
FIGURE 4.
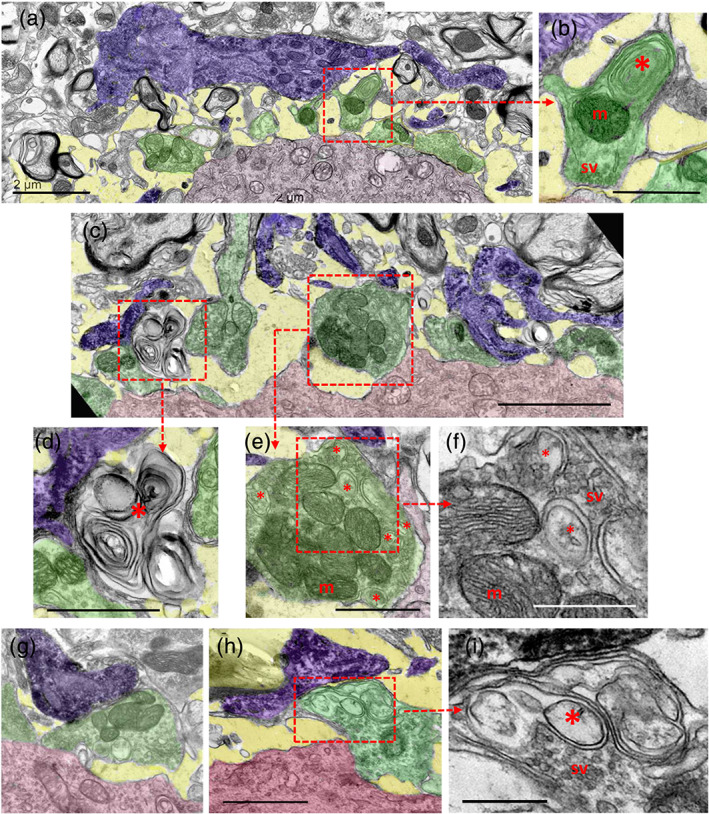
Ultrastructural analysis of the interactions of Iba1‐immunostained microglial profiles (shaded in blue) with synaptic afferents (shaded in green) on motor neuron (MN) cell bodies (shaded in red) 7 days postaxotomy. (a) Microglial processes in close proximity to altered synaptic boutons and a widened extracellular space (shaded in yellow) are depicted. (b) A higher magnification detail of a synaptic bouton (delimited by a dotted square) in (a) containing clustered synaptic vesicles in the active zones (sv), normal mitochondria (m) and abnormal concentrically arranged membranes of presumably endocytic origin (*). (c) Microglial cell processes (blue) interacting with altered and disrupted presynaptic boutons (green) on a 7‐day‐axotomized MN (red). (d) A higher magnification view of the corresponding area delimited in (c) showing a complex multilamellar body located near the MN surface and in close contact with a microglial process, presumably derived from a disrupted presynaptic bouton. (e) A detail of a partially detached presynaptic terminal contacted by microglial processes (which is delimited in (c)), showing abnormal accumulation of endocytic‐like vesicles (*), enlarged in (f); m = mitochondria. (g,h) Microglial processes (blue) contacting an altered afferent synaptic bouton (green) at the surface of MN cell bodies (red). (i) A detail of the area delimited in (h) showing an abnormal accumulation of membranous structures (*) in the region in which the synaptic terminal is closest to the microglial end‐foot process; note the normal clustering of synaptic vesicles in the zone contacting the postsynaptic MN. Scale bars: a = 2 μm, b = 1 μm, c = 2.5 μm, d and e = 1 μm, f = 500 μm, g = 1 μm (valid for h), and i = 500 nm [Color figure can be viewed at wileyonlinelibrary.com]