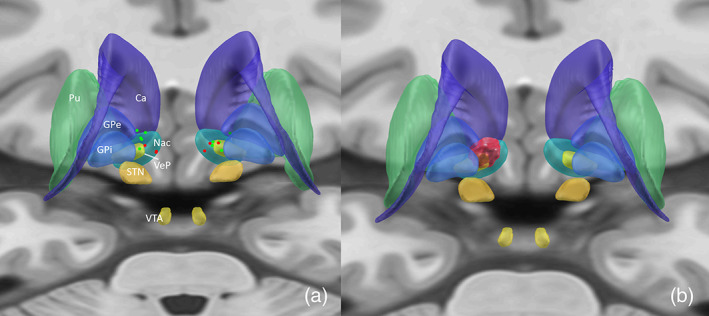
Figure 1.

Note: P‐A visualization. Localization of the active electrodes mapped in ICBM 2009b Nonlinear Asymmetric MNI template (a) and the %Y‐BOCS reduction mapped on the Volume of Tissue activation for all patients, mirrored to the left side (b). Responders are shown in green, nonresponders in red (a). Ca, caudate nucleus; GPe, external globus pallidus; GPi, internal globus pallidus; NaC, nucleus accumbens; Pu, putamen; STN, subthalamic nucleus; VeP, ventral pallidum; VTA, ventral tegmental area. [Color figure can be viewed at wileyonlinelibrary.com]
