

Abstract
We propose the altered lipidostasis hypothesis of Alzheimer's disease (AD). It holds that vulnerable neurons of the entorhinal region generate a neurodegenerative lipid during normal function, adenosine triphosphate–binding cassette transporter subfamily A member 7 (ABCA7) protects from AD pathogenesis by removing it out of the cell, generation of the lipid increases with age, and the minimal amount of ABCA7 needed to dispose of the rising volumes of the lipid also increases with age. A survey of ABCA7 protein levels in the hippocampus or parietal cortex of 123 individuals with or without AD neuropathology showed that individuals with low ABCA7 developed AD neuropathology at a younger age, those with intermediate ABCA7 developed it later, and individuals who developed it very late had high ABCA7, the same as the youngest controls. ABC transporters closely similar to ABCA7 protect cells by removing toxic lipids. ABCA7 may have analogous functions. The hypothesis predicts lipidosis and membrane protein dysfunction in neurons with low ABCA7. Further work will identify the neurodegenerative lipid and determine approaches to exploit ABCA7 for therapeutic purposes.
Keywords: ABCA7, Alzheimer's disease, hippocampus, lipidostasis hypothesis of Alzheimer's disease, lipid metabolism regulator, neurotoxic lipid in dementia, parietal cortex, transmembrane transporter
1. NARRATIVE
Adenosine triphosphate–binding cassette transporter subfamily A member 7 (ABCA7) is part of the new biology relevant to Alzheimer's disease (AD) that has emerged from the genome‐wide association studies (GWAS). 1 GWAS investigate common (ie, the minor allele frequency is high) variants throughout the human genome and identify those with the minor allele being either over‐ or underrepresented among the disease patients. 2 All large AD GWAS have found variants associated with AD at the ABCA7 locus. 3 , 4 , 5 , 6 , 7 , 8 , 9 , 10 However, it has to be shown that these variants modulate AD risk by affecting ABCA7 and not another nearby gene. 2 If ABCA7 were the causative gene at the eponymous locus, then loss‐of‐function mutations in ABCA7 would affect AD risk even more than the common non‐coding AD‐associated variants. This is indeed the case. In European ancestry populations, the common AD‐associated variants at the ABCA7 locus raise risk of late‐onset AD by ≈20%, 3 , 4 , 5 , 6 , 7 , 8 , 9 , 10 whereas ABCA7 loss‐of‐function mutations raise risk of early onset AD by 100% to 400%. 11 , 12 , 13 A loss‐of‐function mutation present in African ancestry populations increases AD risk by ≈80%. 14 Several studies were recently published that attempt to identify the causative gene at each GWAS AD locus by linking the AD‐associated variants with gene promoters and enhancers. 15 , 16 , 17 These studies do not change the conclusion from genetics that ABCA7 is the causative gene at the corresponding locus (see Supplementary Narrative).
The genetic findings also suggest an answer to the next question of whether ABCA7 promotes or forestalls AD pathogenesis by showing that loss of ABCA7 increases AD risk. However, AD transcriptome studies have found modestly higher (≈0.1 to 0.4 fold) levels of ABCA7 message in individuals with AD relative to controls. 18 , 19 , 20 AD Braak stages track spread of neurofibrillary tangles, one of the primary markers of AD, from the entorhinal region, where this marker first appears, through the limbic system to the neocortex. 21 , 22 Braak stages correlate well with cognitive decline in AD. 23 The transcriptome studies have compared individuals with middle Braak stages taken as controls against individuals with late Braak stages taken as AD cases. The present study supports the view of ABCA7 as a protective factor (with the important caveats that this protection is temporary and dose‐dependent), and we suggest that the increase in ABCA7 message detected in the transcriptome studies is a late secondary effect (see Supplementary Narrative).
ABCA7 mediates assembly of lipid and exchangeable apolipoproteins, such as apolipoprotein E (apoE), into high‐density lipoprotein (HDL) particles that are released into the extracellular space. 24 , 25 , 26 , 27 Because the net outcome of HDL assembly is removal of lipid from the cell, this process is also called cell lipid efflux. An early study reported that ABCA7 mediates phospholipid and cholesterol efflux. 24 A consensus was later reached that ABCA7 is at best a mediocre cholesterol efflux mediator. 25 , 26 , 27 ABCA7 is expressed in neurons, astrocytes, and microglia at a similar level. 28 It affects phospholipid composition of the brain 29 and modulates activity of signaling pathways, including those involved in immune responses. 30 , 31 , 32 Loss of ABCA7 increases amyloid beta (Aβ) levels in the brain in mouse models of AD by either increasing Aβ generation 30 , 31 or reducing its disposal. 33 The ABCA7 AD‐risk alleles are associated with brain amyloidosis, Aβ levels in cerebrospinal fluid, and neuritic plaque burden in human subjects. 34 , 35 , 36 Mouse Abca7 knockouts and human ABCA7 AD‐risk allele carriers without AD exhibit mostly minor behavioral and cognitive changes. 29 , 37 , 38 , 39
The purpose of the present study was to determine how ABCA7 protein levels change with Braak stages and age in unaffected controls and individuals with AD neuropathology. We also assessed ABCA7 protein levels in individuals with the tauopathies progressive supranuclear palsy (PSP) and Pick's disease and in individuals with Down syndrome. Our results support the following conclusions. First, ABCA7 levels modestly decline in normal aging. Second, ABCA7 protects from AD neuropathology temporarily in a dose‐dependent manner, ie, individuals with low ABCA7 develop AD neuropathology first and undergo selective attrition 40 , then individuals with average ABCA7 develop AD pathology, and those who have high ABCA7 develop it last, late in life. There is a well‐documented precedent in the literature for a similarly age‐correlated relationship between a protein and AD neuropathology. AD risk owing to the apo E ε4 isoform changes with age: it increases until 60 to 65 years of age and then begins decreasing until it almost disappears in the ninth decade of life. 41 , 42 Individuals with the apo E ε4 isoformalso develop AD 10 to 20 years earlier than individuals with the apo E ε3 isoform. 43 Third, ABCA7 stalls AD pathogenesis very early in this process. Because it is difficult to distinguish between early (but not between early and late) Braak stages, 44 the finding in our cohort that ABCA7 blocks AD pathogenesis between Braak stages I and II is tentative, and we suggest that ABCA7 acts even before Braak stage I. And fourth, individuals with PSP, Pick's disease, and Down syndrome have normal ABCA7 levels.
Based on the present findings and known functions of the ABC transporters closely related to ABCA7, we propose the altered lipidostasis hypothesis of AD pathogenesis centered on ABCA7. Close relatives of ABCA7, ABCA1, and ABCA4 protect vulnerable cells from a deleterious lipid that these cells accumulate during normal function. ABCA1 mediates efflux of cholesterol that macrophages engulf with low‐density lipoprotein (LDL) and dying cells, whereas ABCA4 ensures disposal of N‐retinylidene‐phosphatidylethanolamine, which arises in photoreceptor cells during light perception. 45 ABCA7 likely also removes a neurodegenerative lipid that grid cells 46 and other neurons specifically in the entorhinal region generate internally while executing normal physiological functions. ABCA7 incorporates this lipid into HDL for release into the circulation. Although atherosclerosis is described as a chronic inflammatory disease, the disease‐causative factor in atherosclerosis is LDL cholesterol, and macrophages react to abundance of this lipid by exhibiting immune responses. 47 Likewise in AD, accumulation of the neurodegenerative lipid and resultant neuronal dysfunction may induce immune responses in microglia, but this would be a secondary outcome of the lipid accumulation.
Generation of the neurodegenerative lipid must be increasing with age, thus necessitating proportionately higher levels of ABCA7 to remove it (Figure 1). The increase in the lipid production may stem from age‐related changes in the lipid composition of neuronal membranes. 48 AD neuropathology begins when generation of the lipid exceeds its removal via ABCA7 (Figure 1, 2). Accumulation of the lipid delivers a one‐two‐punch blow to the normal neuronal physiology. It catalyzes Aβ aggregation, 49 thereby initiating the amyloid cascade, and directly disrupts activity of signaling pathways, ion channels, and the endocytic machinery (Figure 2B). Intrinsically disordered peptides and proteins, such as Aβ and tau, exhibit stochastic properties and are exquisitely sensitive to physicochemical environment. 50 In some individuals, the amyloid cascade will inflict more damage than the direct action of the neurodegenerative lipid, and in others, it will be the other way around, depending on fine physicochemical conditions in the brain. The end results of the ensuing pathogenic processes will be loss of membrane integrity and neuronal death likely via necroptosis (Figure 2A). 51 , 52 The molecular identity of the neurodegenerative lipid is presently unknown. ABCA7 mediates efflux of phosphatidylinositol, 27 and it is tempting to hypothesize that phosphatidylinositol and/or its abnormal derivatives are the culprit lipid species. Certain phosphatidylinositol species facilitate signaling along the extracellular signal‐regulated kinase (ERK) pathway (by specially organizing H‐Ras on cell membranes), 53 , 54 and removal of phosphatidylinositols by ABCA7 would explain activation of the ERK pathway in the brain of Abca7‐knockout mice. 29 Phosphatidylinositols also regulate ion channels and endocytosis at the synapse. 55 , 56 Overabundance of these lipids can cause neuronal hyperactivity and death. 56
FIGURE 1.
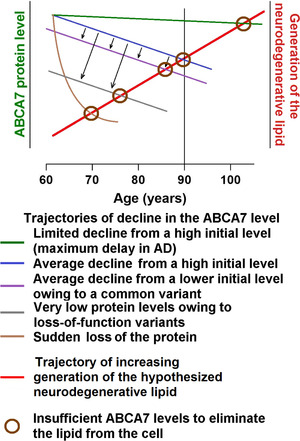
The proposed effect of ABCA7 on AD pathogenesis. Trajectories of change in the ABCA7 level and in the rate of production of the neurodegenerative lipid with age. The amount of the neurodegenerative lipid produced in the vulnerable tissue of the entorhinal region increases with age, whereas ABCA7 levels naturally decline and are subject to genetic effects from common and rare alleles. In young individuals with high ABCA7 levels, the neurodegenerative lipid generated during normal functioning is rapidly removed by ABCA7. However, when ABCA7 is insufficient to remove the lipid, the latter accumulates in the plasma membrane and other cell membrane and triggers AD pathogenesis
FIGURE 2.
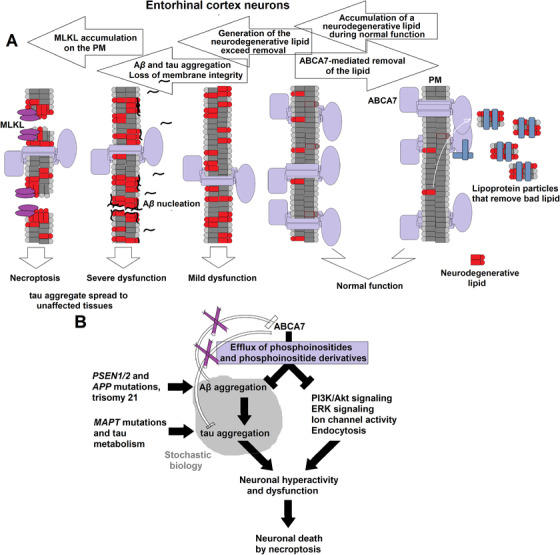
The altered lipidostasis hypothesis of AD. A, A proposed sequence of events leading from an imbalance in the generation and disposal of a neurodegenerative lipid to death of the specifically vulnerable neurons of the entorhinal cortex. Neurons of the entorhinal cortex accumulate a neurodegenerative lipid during normal functioning, and ABCA7 removes this lipid from the cell by exporting it into the extracellular milieu. When the rate of ABCA7‐mediated removal is lower than the rate of generation, concentration of the neurodegenerative lipid in neurons increases. Cell membranes enriched for the lipid catalyze Aβ aggregation. Soluble Aβ aggregates cause wide‐spread dysfunction, induce tau aggregation, and damage cell membranes. The neurodegenerative lipid further directly acts on cell membranes and disrupts normal functions. Activation of mixed lineage kinase domain‐like (MLKL) protein leads to death of the vulnerable neurons thorough necroptosis, while aggregated tau diffuses to healthy neurons to initiate a secondary pathogenic process. B, The proposed ABCA7 functions that forestall AD pathogenesis. ABCA7 suppresses Aβ aggregation and regulates levels of phosphatidylinositol and its derivatives. Purple X's indicate that ABCA7 does not act directly on tau and that Aβ aggregates do not affect ABCA7. Mutations inPSEN1/2andAPPorAPPduplication in trisomy 21 increase Aβ concentration and reduce the need for cell membranes to catalyze Aβ aggregation, thus obviating ABCA7 neuroprotection.MAPTmutations and changes in tau metabolism likewise cause tau dysfunction that then leads to development of tauopathies
The present study and the altered lipidostasis hypothesis have the following limitations. The study cohort is small, the older age groups have few or no unaffected controls, and the age of onset of AD dementia for the study subjects is not available. The lipidostasis hypothesis does not identify which apolipoprotein interacts with ABCA7 to form HDL and remove the neurodegenerative lipid and does not account for apo E and clusterin (also known as apo J), two apolipoproteins that can form HDL and are identified as AD factors in GWAS and in targeted genetic and epidemiological studies. 57 , 58 The effects of ABCA7 and apo E on AD risk have many similarities. As we show in the present study and mention above, the degree of protection conferred by ABCA7 is correlated with age, and the degree of risk conferred by apo E ε4 is also correlated with age. Individuals with the APOE ε4/ε4 genotype have a much greater odds of developing AD than individuals with ε3/ε4 at the age of 60 years, but at the age of 90 years, individuals with ε4/ε4 and ε3/ε4 all have the same low AD odds that are only marginally elevated relative to the odds of developing AD in ε3/ε3 individuals. 42 , 58 Furthermore, individuals with low ABCA7 and carriers of the ε4 isoform experience selective attrition. APOE ε3/ε4 and ε4/ε4 allele carriers develop AD earlier than ε3/ε3 carriers by one and two decades, respectively. 43 ABCA7 and apoE both affect AD risk much more in European than in African and Hispanic ancestry populations. 58 Deletion allele carriers and ABCA7 knockouts are common among individuals of African ancestry in the United States. 14 Some studies have found that apo E levels in cerebrospinal fluid and brain decrease with the APOE genotype in the order ε3/ε3 > ε3/ε4 > ε4/ε4, ie, lower total amounts of neural apo E are correlated with greater AD risk. 42 Lower neural ABCA7 protein levels are also a risk factor. Nonetheless, ABCA1 forms less HDL with the apo E ε4 than ε3 isoform, but ABCA7 does not distinguish between the isoforms and forms the same amount with both. 27 And, it is thought that apoE bears on AD pathogenesis by directly interacting with Aβ or by interfering with Aβ clearance. 43 , 58 GWAS have consistently found AD‐associated variants at the PTK2B‐CLU locus (CLU encodes clusterin). 3 , 4 However, it has not been established that CLU is a causative gene at the locus. In addition to apoE and clusterin, apo A‐I, apo D, and several other apolipoproteins are present in cerebrospinal fluid. 59 One of this apolipoproteins functions as an ABCA7 partner in the disposal of the neurodegenerative lipid.
We intend to expand the present cohort to better characterize the association between ABCA7 and AD neuropathology in older individuals. However, cross‐sectional and prospective epidemiological studies in large cohorts of live individuals of European, African, and Hispanic ancestry are necessary to confirm the association between ABCA7 and AD dementia. These studies should also clarify how ABCA7, apoE, and clusterin interact with one another. A major barrier to human studies is a lack of methods to assess ABCA7 level and/or activity in the brain of live individuals. ABCA7 expression data from the Encyclopedia of DNA Elements (ENCODE) 60 suggest that ABCA7 expression in the brain is regulated differently than in most other tissues. Thus ABCA7 levels in, for example, blood would not be indicative of its levels in the brain. Basic studies will have to develop a method to assess brain ABCA7 protein level or activity in live individuals, identity of the hypothesized neurodegenerative lipid that ABCA7 removes, describe transcriptional regulation of ABCA7 expression as well as determine whether and how ABCA7 affects normal cognition.
In summary, strong genetic evidence indicates that ABCA7 is the causative gene at the AD‐associated ABCA7 locus and that it protects from AD pathogenesis. However, results from the present study suggest an important caveat that this protection is not absolute but temporary and dose‐dependent. Individuals with low ABCA7 are at risk of developing AD pathology early in life, while those with above average ABCA7 are still at risk of developing it but in advanced age. We then draw on our understanding of atherosclerosis and functions of transporters closely related to ABCA7 and propose the altered lipidostasis hypothesis of AD. It postulates that vulnerable neurons of the entorhinal region accumulate a neurotoxic lipid that, if not removed from the neurons via ABCA7, causes AD pathogenesis.
2. CONSOLIDATED RESULTS AND STUDY DESIGN
2.1. Association of ABCA7 with Braak stage and age in the hippocampus and parietal cortex
ABCA7 protein level was measured in the hippocampus of 84 and parietal cortex of 39 individuals without any AD pathology or with AD pathology categorized as Braak stage I through V. ABCA7 values were not normally distributed and were plotted on a log scale. Hippocampal and parietal cortex samples did not differ in the protein level (detailed methods and results) and were analyzed together to increase statistical power (see detailed methods and results for analyses of ABCA7 in each tissue separately). Different ways of separating the cohort into groups were tested (see detailed methods and results). ABCA7 level was significantly different only when unaffected controls and individuals with Braak stage I neuropathology were compared with individuals with Braak stage II‐V neuropathology (Mann‐Whitney statistic U = 1221, P = 0.0102). However, unaffected control/Braak stage I and Braak stage II‐V individuals were not matched for age (t = 4.8, df = 121, P < 0.0001). To match for age, the Braak stage neuropathology groups were subdivided into 63‐78, 79‐93, and 94‐101 years of age at death age groups (Table 1). The resultant Braak stage neuropathology/age groups significantly differed in ABCA7 level (Kruskal‐Wallis statistic H = 30.6, P < 0.0001; Figure 3A and B). In pair‐wise comparisons (false discovery rate 0.05), unaffected/Braak stage I individuals had significantly higher ABCA7 level than Braak stage II‐V individuals in the 63‐78 age group (median, interquartile range, mean ranks; 2.99, 0.36‐8.59, 81.9 vs 0.067, 0.017‐0.478, 29.7; P < 0.0001) but not in the 79‐93 age group (0.17, 0.10‐3.81, 54.5 vs 0.70, 0.16‐2.14, 61.2; P = 0.55); there were unfortunately no control/Braak stage I individuals in the 91‐101 age group (2.51, 0.69‐3.89, 81.9 for the Braak stage II‐V individuals in this group). Unaffected/Braak stage I individuals in the 63‐78 age group also had higher ABCA7 level than unaffected/Braak stage I and Braak stage II‐V individuals in the 79‐93 age group (P = 0.022 and 0.013, respectively) but did not differ from Braak stage II‐V individuals in the 91‐101 age group (P = 0.99). Braak stage II‐V subjects in the 63‐78 age group had the lowest ABCA7 level in the study cohort, not only lower than control/Braak stage I individuals in the same age group, but also lower than control/Braak stage I individuals (P = 0.049) and Braak stage II‐V subjects (P = 0.0008) in the 79‐93 age group and Braak stage II‐V individuals in the 94‐101 age group (P < 0.0001). Braak stage II‐V individuals in the 93‐101 age group had a higher level of ABCA7 in comparison with control/Braak stage I and Braak stage II‐V subjects in the 79‐93 age group, although these differences did not cross the P < 0.5 threshold of significance (P = 0.055 and 0.071, correspondingly). Braak stage II‐V individuals in the 94‐101 age group were also the least heterogeneous among all the study subjects (quartile coefficient of dispersion; 0.70 vs 0.92 and 0.93 for control/Braak stage I and Braak stage II‐V individuals in the 63‐78 age group, and 0.95 and 0.86 for control/Braak stage I and Braak stage II‐V individuals in the 79‐93 age group). In correlational analysis, ABCA7 level decreased with increasing age (Spearman r = ‐0.30, 95% confidence interval [CI] −0.56 to 0.01, n = 42, P = 0.053) in the control/Braak stage I group and increased together with increasing age (Spearman r = 0.48, 95% CI 0.28 to 0.63, n = 81, P < 0.0001) in the Braak stage II‐V group (Figure 3C).
TABLE 1.
Demographic characteristics of the individuals in the AD neuropathology cohort and PMI of the brain samples donated by these individuals
| Total sample | 63‐78 years of age group | 79‐93 years of age group | 94‐101 years of age group | ||||
|---|---|---|---|---|---|---|---|
| Unaffected controls and individuals with Braak stage I(n = 42; UC = 26; BI = 16) | Individuals with Braak stages II‐V(n = 81; BII = 12; BIII = 21; BIV = 23; BV = 25) | Unaffected controls and individuals with Braak stage I(n = 29; UC = 18; BI = 11) | Individuals with Braak stages II‐V(n = 21; BII = 5; BIII = 4; BIV = 4; BV = 8) | Unaffected controls and individuals with Braak stage I(n = 13; UC = 8; BI = 5) | Individuals with Braak stages II‐V(n = 48; BII = 5; BIII = 14; BIV = 15; BV = 14) | Individuals with Braak stages II‐V(n = 12; BII = 2; BIII = 3; BIV = 4; BV = 3) | |
| Age, mean (SD), y | 74.8 (8.5) | 83.1(9.6)*** | 70.0 (4.4) | 70.1 (5.4)ns | 86.2 (4.1) | 85.5 (3.9)ns | 96.5 (2.7) |
| Male sex (%) | 58.5 | 52.4 ns | 70.0 | 47.6 ns | 33.3 | 58.1 ns | 50.0 |
| PMI, mean (SD), h | 17.1 (7.8) | 15.3 (7.9)ns | 17.7 (8.0) | 17.5 (7.4)ns | 15.7 (7.7) | 14.6 (8.2)ns | 13.0 (6.5) |
Abbreviations: BI, Braak stage I; BII, Braak stage II; BIII, Braak stage III; BIV, Braak stage IV; BV, Braak stage V; ns, not significant; PMI, post‐mortem interval; SD, standard deviation; UN, unaffected control.
‐ P < 0.001.
FIGURE 3.
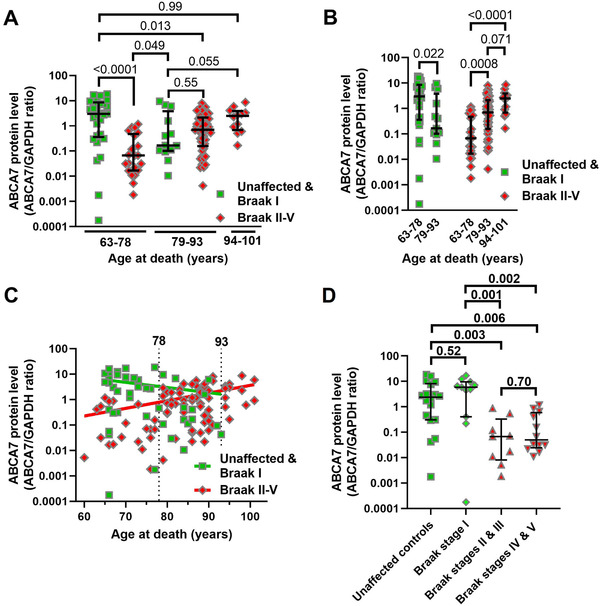
Association of ABCA7 protein level with Braak stage neuropathology and age. A and B, Comparison of ABCA7 level by Braak stage/age group. C, Correlation between ABCA7 protein level and age‐at‐death in control/Braak stage I and Braak stage II‐V individuals. D, Drop‐off in ABCA7 between Braak stages I and II/III in the 63‐78 age group. Error bars—median and interquartile range.Pvalues from Kruskal‐Wallis tests in panels A, B, and D were corrected for multiple comparisons by controlling for the false discovery rate of 0.05 using the two‐stage linear step‐up procedure of Benjamini, Krieger, and Yekutieli. Spearman correlation test was employed in panel C
The relationship between ABCA7 and Braak stages was reassessed for individuals in the 63‐78 age group. When the group was divided into unaffected controls (n = 18) and Braak stage I (n = 11), II/III (n = 9), and VI/V (n = 12) subjects, there were significant differences among the new groups (Kruskal‐Wallis statistic H = 17.8, P = 0.0005). In pair‐wise comparison (false discovery rate 0.05), ABCA7 levels were the same in unaffected and Braak stage I subjects (2.38, 0.31‐8.13, 31.4 vs 5.9, 0.41‐9.62, 35.0; P = 0.52), and in Braak stage II/III and VI/V subjects (0.067, 0.008‐0.33, 14.0 vs 0.045, 0.024‐0.59, 16.5; P = 0.70). However, the protein levels were much lower in Braak stage II/III and VI/V individuals than in unaffected controls and Braak stage I subjects (P = 0.001‐0.006; Figure 3D).
2.2. No difference in ABCA7 between controls and individuals with PSP, Pick's disease or Down syndrome
ABCA7 levels were measured in the middle frontal cortex of unaffected controls and individuals with tauopathies PSP and Pick's disease, matched for age and sex (Table 2). There was no difference in ABCA7 among these subjects (Kruskal‐Wallis statistic H = 2.03, P = 0.36; Figure 4A). We then removed ABCA7 values for individuals older than 78 in order to focus on the age group younger than 78 where ABCA7 levels were the most different between control/Braak stage I and Braak stage II‐V individuals and reanalyzed the data but still did not find a difference (Kruskal‐Wallis statistic H = 1.87, n = 8, 10, 11 for, correspondingly, control, PSP and Pick's disease subjects, P = 0.39).
TABLE 2.
Demographic characteristics of control, PSP, and Pick's disease study subjects a
| Characteristic | Controls (n = 12) | PSP (n = 12) | Pick's disease (n = 12) |
|---|---|---|---|
| Age, mean (SD), y | 71.3(14.2) | 70.0(7.1)ns | 67.9(7.7)ns |
| Male sex (%) | 58.3 | 66.7 ns | 50.0 ns |
Abbreviations: ns, not significant; PSP, progressive supranuclear palsy.
‐Post‐mortem intervals are not available for these samples.
FIGURE 4.
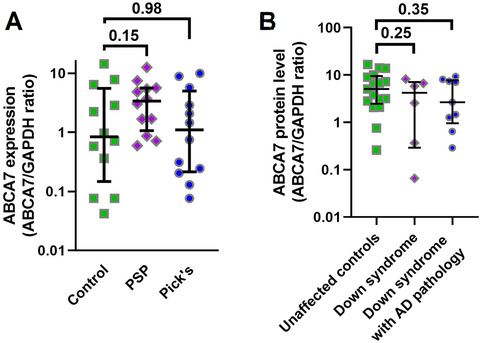
ABCA7 levels in controls and individuals with PSP, Pick's disease, or Down syndrome. A, No difference in ABCA7 between controls and individuals with PSP or Pick'sdisease. B, No difference in ABCA7 between controls and individuals with Down syndrome without AD pathology and with Down syndrome and AD pathology. Error bars—median and interquartile range.Pvalues from Kruskal‐Wallis tests were corrected for multiple comparisons by controlling for the false discovery rate of 0.05 using the two‐stage linear step‐up procedure of Benjamini, Krieger, and Yekutieli
ABCA7 protein levels were also measured in the cortex of unaffected controls, individuals with Down syndrome but without AD neuropathology, and individuals with Down syndrome and AD neuropathology matched for age and sex (Table 3). There was no difference in ABCA7 among these individuals (Kruskal‐Wallis statistic H = 1.70, P = 0.43). Individuals with Down syndrome and especially individuals with Down syndrome and AD pathology had lower ABCA7 levels than controls, but these differences were not statistically significant (median, interquartile range; 4.2, 0.29‐8.2 for individuals with Down syndrome only and 2.7, 0.96‐7.7 for individuals with Down syndrome and AD pathology vs 5.09, 2.5‐16.6 for controls; Figure 4B). When individuals with Down syndrome and Down syndrome and AD pathology were combined together, there was still no difference in ABCA7 between controls and the joint group of Down syndrome subjects (Mann‐Whitney statistic U = 94, P = 0.22).
TABLE 3.
Demographic characteristics of control and Down syndrome study subjects and PMI of the brain samples donated by these individuals
| Characteristic | Controls (n = 17) | Down syndrome (n = 6) | Down syndrome with AD pathology (n = 9) |
|---|---|---|---|
| Age, mean (SD), y | 55.9(5.6) | 56.3(3.1)ns | 55.1(8.2)ns |
| Male sex (%) | 74.5 | 66.7 ns | 66.7 ns |
| PMI, mean (SD), h a | 17.0(6.9) | 9.7(7.2)ns | 12.0(11.3)ns |
Abbreviations: ns, not significant; PMI, post‐mortem interval.
‐Post‐mortem intervals are not available for all samples.
3. DETAILED METHODS AND RESULTS
3.1. Methods
3.1.1. Human brain samples
Human brain samples with Alzheimer's disease (AD) neuropathology were obtained from five repositories (Supplementary Table S1) through the NIH NeuroBioBank. The samples were from unaffected controls or individuals exhibiting AD pathology categorized as Braak stage I through V. Samples from individuals with PSP and Pick's disease and matching controls were from the Brain Bank at Mayo Clinic in Florida, Jacksonville. Samples from individuals with Down syndrome and matching controls were obtained from four repositories: the Neuropathology Brain Bank at the University of Pittsburgh School of Medicine, University of Kentucky Alzheimer's Disease Center Tissue Bank at Sanders‐Brown Center on Aging, Alzheimer's Disease Center at NYU Langone, and University of Maryland Brain and Tissue Bank.
3.1.2. ABCA7‐deficient cells
Baby hamster kidney (BHK) cells expressing human ABCA7 under control of a mifepristone (MFP)–inducible promoter were derived using a GeneSwitch System kit (Thermo Fisher Scientific); ABCA7 was deleted in human‐induced pluripotent stem (iPS) cells and knocked‐down in human immortalized microglial cells C20 using the CRISPR/Cas9 approach (Lyssenko, unpublished observations). C20 cells were a kind gift of Dr. David Alvarez‐Carbonell. 61
3.1.3. Western blot measurement of ABCA7 levels in the human brain
Twenty‐milligram to 60‐mg pieces of frozen brain tissue were combined with ice‐cold lysis buffer (50 mM Tris base, 150 mM NaCl, 1% NP‐40, 5 mM EDTA, 0.5% sodium deoxycholate, 0.1% SDS, 1X protease inhibitor cocktail [sc‐29130, Santa Cruz Biotechnology], 1X Halt phosphatase inhibitor cocktail [Thermo Fisher Scientific]; 1 mL of buffer per 150 μg of tissue) and sonicated for 10 seconds (Sonic Dismembrator Model 100 [Thermo Fisher Scientific], output frequency 22.5 kHz, 2 mm probe). Lysates were then centrifuged at 90,000 g for 45 minutes at 4°C (TLA‐55 rotor, Beckman Coulter). Protein concentration in the supernatant was determined with a BCA kit (Thermo Fisher Scientific). Supernatant aliquots containing 40 μg of protein (heated at 60°C for 10 minutes with SDS loading buffer) were resolved on 3% to 8% Tris‐acetate gels and blotted onto 0.45 μm nitrocellulose membrane (all from Bio‐Rad Laboratories). Membranes were treated with Odyssey blocking buffer (LI‐COR Biosciences) and cut horizontally at the 50 kDa protein standard mark. The upper portion was probed with a mouse monoclonal antibody raised against amino acids 1871‐2008 of the human ABCA7 (ABCA7 antibody E11; sc‐377335, Santa Cruz Biotechnology), followed by probing with IRDye 800CW conjugated donkey anti‐mouse IgG (LI‐COR Biosciences). The lower part was probed with a rabbit monoclonal antibody against glyceraldehyde‐3‐phosphate dehydrogenase (GAPDH; 2118, Cell Signaling Technology), followed by probing with IRDye 800CW conjugated goat anti‐rabbit IgG (LI‐COR Biosciences). Membranes were scanned with an Odyssey CLx imaging system (LI‐COR Biosciences). The ratio of ABCA7 to GAPDH band fluorescence intensity was taken as normalized ABCA7 protein expression level.
3.1.4. Statistical analysis
t Test and Fisher exact tests were used to compare, correspondingly, the mean of ages and sex composition between disease and control groups. ABCA7 expression values were not normally distributed (based on inspection of frequency distribution plots and Kolmogorov‐Smirnov and Shapiro‐Wilk normality tests). A transformation method to normalize all study groups could not be identified. Data were analyzed using non‐parametric tests: Kruskal‐Wallis and Mann‐Whitney tests and Spearman's rank correlation. In Kruskal‐Wallis tests, every mean was compared to every other mean, and P values were corrected for multiple comparisons by controlling for the false discovery rate of 0.05 using the two‐stage linear step‐up procedure of Benjamini, Krieger, and Yekutieli. P values for Mann‐Whitney tests and Spearman r were two tailed.
3.2. Detailed results
3.2.1. Validating specificity of a human ABCA7 monoclonal antibody
The commercially available E11 human ABCA7 monoclonal antibody was validated for western blotting using recombinant expression and genetic knockdown strategies. It recognized human ABCA7 when this protein was stably and inducibly expressed in BHK cells (Figure 5A). The antibody recognized a protein band migrating at just under 250 kDa in lysates from human brain and human iPS cells (Figure 5B). The calculated size of human ABCA7 is 235 kDa. In lysates from iPS cells deleted in ABCA7 this band was absent. Finally, the antibody detected a band of the same size as in the brain and iPS cell lysates in a lysate of immortalized human microglia cells C20 (Figure 5C). The band was much reduced in intensity in a lysate from C20 cells with genetic knock‐down of ABCA7 expression. This evidence indicates that the E11 ABCA7 monoclonal antibody specifically recognizes ABCA7.
FIGURE 5.
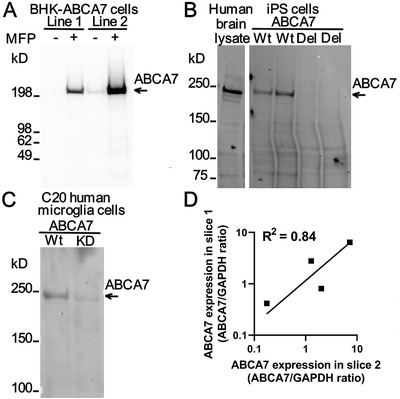
Specificity and repeatability of ABCA7 level measurement using the E11ABCA7 monoclonal antibody. A, Detection of human ABCA7 in two BHK cell lines that express it weakly (line 1) and strongly (line 2) in an MFP‐inducible manner. In line 1, the antibody did not recognize any protein in cells that were not treated with MFP and detected a protein migrating as a single band > 200 kDa in size in cells that were treated with the inducer. In line 2 with strong expression of ABCA7, the antibody detected leaky expression of the protein in uninduced and very strong expression of the protein in MFP‐induced cells. B, Detection of ABCA7 in human brain tissue and human iPS cell lysates. iPS cells either expressed ABCA7 (wild‐type [Wt]) or were deleted in ABCA7 (del). C, Expression of ABCA7 in Wt or ABCA7 knock‐down (KD) human microglial C20 cells as revealed by the ABCA7 antibody. D, Correlation of the ABCA7 levelbetween two independently obtained and processed slices of the hippocampus from four individuals
3.2.2. Repeatability of ABCA7 measurement in the human brain
Correlation between ABCA7 protein values measured by two western blots in the same brain lysates was very strong (Spearman r = 0.98, 95% confidence interval [CI] 0.95 to 0.99; R2 = 0.99 for a log‐log best‐fitting line; n = 22). Two samples of the hippocampus were inadvertently and independently obtained from four brain tissue donors. We measured ABCA7 expression in these samples before realizing that these were duplicates from the same subject. There was strong correlation between measurements in the duplicates (Spearman r = 0.80, R2 = 0.84 for a log‐log best‐fitting line; Figure 5D). Thus ABCA7 level measurements using the antibody had good repeatability.
3.2.3. Comparable levels of ABCA7 protein in the hippocampus and parietal cortex
ABCA7 protein levels were measured in the hippocampus of 84 individuals and parietal cortex of 47 individuals (Supplementary Figure S1). Eight individuals in the two groups were the same. ABCA7 levels in the hippocampus and parietal cortex in these individuals were correlated (Spearman r = 0.71, P = 0.058, a log‐log best‐fitting line R2 = 0.90). Unaffected controls and subjects exhibiting neurofibrillary pathology consistent with Braak stage I on the postmortem neuropathological examination were combined together into two groups by brain region, and subjects exhibiting Braak stages II through V were gathered together into two groups by brain region. There was no significant difference in ABCA7 between hippocampus and parietal cortex in control/Braak stage I subjects (median, interquartile range, mean ranks; 0.85, 0.10‐6.16, 20.0 vs 2.78, 0.39‐9.50, 26.5; P = 0.13); there was also no significant difference in ABCA7 between the two regions in Braak stage II‐V subjects (0.70, 0.07‐2.79, 42.0 vs 0.54, 0.07‐1.19, 37.4; P = 0.41). Given that ABCA7 levels were very similar in the hippocampus and parietal cortex of the same individual, hippocampi and cortices of controls/Braak stage I individuals and hippocampi and cortices of Braak stage II‐V subjects, the hippocampus and parietal cortex samples were analyzed together to increase statistical power. The study cohort included 123 individuals, 84 represented by the hippocampus and 39 represented by the parietal cortex (only hippocampal values were used for the 8 individuals with hippocampal and parietal cortex samples).
3.2.4. Analysis of the relationship between ABCA7 and Braak stage
A biphasic sigmoidal curve was a modestly better fit to the relationship between ABCA7 level and Braak stage than a semilog line (R2 = 0.14 vs 0.11; Supplementary Figure 2A). Although there was no overall significant difference among the unaffected controls and individuals with Braak stages I‐V (Kruskal‐Wallis statistic H = 8.39, P = 0.14), unaffected controls and individuals with Braak stage I neuropathology had significantly higher ABCA7 level than individuals with Braak stage II neuropathology in the post hoc pair‐wise multiple comparison (false discovery rate 0.05; P = 0.046 and 0.034, respectively; Supplementary Figure 2B). These analyses suggested that ABCA7 level likely decreased suddenly rather than gradually with the progression through Braak stages. To determine between which Braak stages the drop in ABCA7 took place, unaffected controls and individuals with Braak stage I‐V neuropathology were combined and statistically compared in two groups in all five possible combinations: unaffected controls versus individuals with Braak stages I‐V, unaffected controls and Braak stage I individuals versus Braak stage II‐V individuals, and so forth. ABCA7 level was significantly different only when unaffected controls and individuals with Braak stage I neuropathology were compared with individuals with Braak stage II‐V neuropathology (Mann‐Whitney statistic U = 1221, P = 0.0102; Supplementary Figure 2C).
3.2.5. Association of ABCA7 with Braak stage and age separately in the hippocampus and in the parietal cortex
The association of ABCA7 with Braak stage and age was also analyzed separately in the hippocampus and in the parietal cortex. For the hippocampal samples alone, the Braak stage neuropathology/age groups significantly differed in ABCA7 level (Kruskal‐Wallis statistic H = 21.9, P = 0.0002; Supplementary Figure S3A). Key differences observed in the combined hippocampus and parietal cortex cohort were also discernible in the hippocampus samples alone. In pair‐wise comparisons (false discovery rate 0.05), unaffected/Braak stage I individuals had significantly higher ABCA7 level than Braak stage II‐V individuals in the 63‐78 age group (P < 0.0001); Braak stage II‐V individuals in the 63‐78 age group had lower ABCA7 than controls (P = 0.15, not reaching statistical significance at the threshold value of 0.05) and Braak stage II‐V individuals in the 79‐93 age group (P = 0.002) and Braak stage II‐V individuals in the 94‐101 age group (P = 0.0006). For the parietal samples alone, the Braak stage neuropathology/age groups also significantly differed in ABCA7 level (Kruskal‐Wallis statistic H = 11.6, P = 0.02; Supplementary Figure S3B). In pair‐wise comparisons (false discovery rate 0.05), unaffected/Braak stage I individuals had significantly higher ABCA7 level than Braak stage II‐V individuals in the 63‐78 age group (P = 0.006).
CONFLICT OF INTEREST
Nicholas N. Lyssenko has been previously supported by a sponsored research agreement from Biogen Inc. to study ABCA7 in neurodegeneration, no finding from that work is presented here; Domenico Praticò has nothing to report.
Supporting information
Supporting Information
ACKNOWLEDGMENTS
Domenico Praticò is the Scott Richards North Star Charitable Foundation Chair for Alzheimer's Research. The authors thank the biorepositories of the NIH NeuroBioBank, Brain Bank at Mayo Clinic in Florida, Neuropathology Brain Bank at the University of Pittsburgh School of Medicine, University of Kentucky Alzheimer's Disease Center Tissue Bank at Sanders‐Brown Center on Aging, Alzheimer's Disease Center at NYU Langone, and University of Maryland Brain and Tissue Bank for kindly providing postmortem brain samples.
Lyssenko NN, Praticò D. ABCA7 and the altered lipidostasis hypothesis of Alzheimer's disease. Alzheimer's Dement. 2021;17:164–174. 10.1002/alz.12220
Contributor Information
Nicholas N. Lyssenko, Email: nicholas.lyssenko@temple.edu.
Domenico Praticò, Email: domenico.pratico@temple.edu.
REFERENCES
- 1. De Roeck A, Van Broeckhoven C, Sleegers K. The role of ABCA7 in Alzheimer's disease: evidence from genomics, transcriptomics and methylomics. Acta Neuropathol. 2019;138(2):201–220. [DOI] [PMC free article] [PubMed] [Google Scholar]
- 2. Pearson TA, Manolio TA. How to interpret a genome‐wide association study. JAMA. 2008;299(11):1335–1344. [DOI] [PubMed] [Google Scholar]
- 3. Jansen IE, Savage JE, Watanabe K, et al. Genome‐wide meta‐analysis identifies new loci and functional pathways influencing Alzheimer's disease risk. Nat Genet. 2019;51(3):404–413. [DOI] [PMC free article] [PubMed] [Google Scholar]
- 4. Kunkle BW, Grenier‐Boley B, Sims R, et al. Genetic meta‐analysis of diagnosed Alzheimer's disease identifies new risk loci and implicates Aβ, tau, immunity and lipid processing. Nat Genet. 2019;51(3):414‐430. [DOI] [PMC free article] [PubMed] [Google Scholar]
- 5. Marioni RE, Harris SE, Zhang Q, et al. GWAS on family history of Alzheimer's disease. Transl Psychiatry. 2018;8(1):99. 10.1038/s41398-018-0150-6. published correction appears in Transl Psychiatry. 2019 Jun 6;9(1):161. Published 2018 May 18. [DOI] [PMC free article] [PubMed] [Google Scholar]
- 6. Moreno‐Grau S, de Rojas I, Hernández I, et al. Genome‐wide association analysis of dementia and its clinical endophenotypes reveal novel loci associated with Alzheimer's disease and three causality networks: the GR@ACE project. Alzheimers Dement. 2019;15(10):1333–1347. [DOI] [PubMed] [Google Scholar]
- 7. Reitz C, Jun G, Naj A, et al. Variants in the ATP‐binding cassette transporter (ABCA7), apolipoprotein E ϵ4, and the risk of late‐onset Alzheimer disease in African Americans. JAMA. 2013;309(14):1483–1492. [DOI] [PMC free article] [PubMed] [Google Scholar]
- 8. Lambert JC, Ibrahim‐Verbaas CA, Harold D, et al. Meta‐analysis of 74,046 individuals identifies 11 new susceptibility loci for Alzheimer's disease. Nat Genet. 2013;45(12):1452–1458. [DOI] [PMC free article] [PubMed] [Google Scholar]
- 9. Naj AC, Jun G, Beecham GW, et al. Common variants at MS4A4/MS4A6E, CD2AP, CD33 and EPHA1 are associated with late‐onset Alzheimer's disease. Nat Genet. 2011;43(5):436–441. [DOI] [PMC free article] [PubMed] [Google Scholar]
- 10. Hollingworth P, Harold D, Sims R, et al. Common variants at ABCA7, MS4A6A/MS4A4E, EPHA1, CD33 and CD2AP are associated with Alzheimer's disease. Nat Genet. 2011;43(5):429–435. [DOI] [PMC free article] [PubMed] [Google Scholar]
- 11. De Roeck A, Van den Bossche T, van der Zee J, et al. Deleterious ABCA7 mutations and transcript rescue mechanisms in early onset Alzheimer's disease. Acta Neuropathol. 2017;134(3):475–487. [DOI] [PMC free article] [PubMed] [Google Scholar]
- 12. Le Guennec K, Nicolas G, Quenez O, et al. ABCA7 rare variants and Alzheimer disease risk. Neurology. 2016;86(23):2134–2137. [DOI] [PMC free article] [PubMed] [Google Scholar]
- 13. Bellenguez C, Charbonnier C, Grenier‐Boley B, et al. Contribution to Alzheimer's disease risk of rare variants in TREM2, SORL1, and ABCA7 in 1779 cases and 1273 controls. Neurobiol Aging. 2017;59:220.e1–220.e9. [DOI] [PubMed] [Google Scholar]
- 14. Cukier HN, Kunkle BW, Vardarajan BN, et al. ABCA7 frameshift deletion associated with Alzheimer disease in African Americans. Neurol Genet. 2016;2(3):e79. [DOI] [PMC free article] [PubMed] [Google Scholar]
- 15. Nott A, Holtman IR, Coufal NG, et al. Brain cell type‐specific enhancer‐promoter interactome maps and disease‐risk association. Science. 2019;366(6469):1134–1139. [DOI] [PMC free article] [PubMed] [Google Scholar]
- 16. Song M, Yang X, Ren X, et al. Mapping cis‐regulatory chromatin contacts in neural cells links neuropsychiatric disorder risk variants to target genes. Nat Genet. 2019;51(8):1252–1262. [DOI] [PMC free article] [PubMed] [Google Scholar]
- 17. Lu L, Liu X, Huang WK, et al. Robust Hi‐C maps of enhancer‐promoter interactions reveal the function of non‐coding genome in neural development and diseases. Mol Cell. 2020;79:521–534.e15. [DOI] [PMC free article] [PubMed] [Google Scholar]
- 18. van Rooij JGJ, Meeter LHH, Melhem S, et al. Hippocampal transcriptome profiling combined with protein‐protein interaction analysis elucidates Alzheimer's disease pathways and genes. Neurobiol Aging. 2019;74:225–233. [DOI] [PubMed] [Google Scholar]
- 19. Mathys H, Davila‐Velderrain J, Peng Z, et al. Single‐cell transcriptomic analysis of Alzheimer's disease. Nature. 2019;570(7761):332–337. [DOI] [PMC free article] [PubMed] [Google Scholar]
- 20. Vasquez JB, Fardo DW, Estus S. ABCA7 expression is associated with Alzheimer's disease polymorphism and disease status. Neurosci Lett. 2013;556:58–62. [DOI] [PMC free article] [PubMed] [Google Scholar]
- 21. Braak H, Del Tredici K. From the entorhinal region via the prosubiculum to the dentate fascia: alzheimer disease‐related neurofibrillary changes in the temporal allocortex. J Neuropathol Exp Neurol. 2020;79(2):163–175. [DOI] [PMC free article] [PubMed] [Google Scholar]
- 22. Braak H, Alafuzoff I, Arzberger T, Kretzschmar H, Tredici Del. Staging of Alzheimer disease‐associated neurofibrillary pathology using paraffin sections and immunocytochemistry. Acta Neuropathol. 2006;112(4):389–404. [DOI] [PMC free article] [PubMed] [Google Scholar]
- 23. Schöll M, Lockhart SN, Schonhaut DR, et al. PET imaging of tau deposition in the aging human brain. Neuron. 2016;89(5):971–982. [DOI] [PMC free article] [PubMed] [Google Scholar]
- 24. Abe‐Dohmae S, Ikeda Y, Matsuo M, et al. Human ABCA7 supports apolipoprotein‐mediated release of cellular cholesterol and phospholipid to generate high density lipoprotein. J Biol Chem. 2004;279(1):604–611. [DOI] [PubMed] [Google Scholar]
- 25. Wang N, Lan D, Gerbod‐Giannone M, et al. ATP‐binding cassette transporter A7 (ABCA7) binds apolipoprotein A‐I and mediates cellular phospholipid but not cholesterol efflux. J Biol Chem. 2003;278(44):42906–42912. [DOI] [PubMed] [Google Scholar]
- 26. Hayashi M, Abe‐Dohmae S, Okazaki M, Ueda K, Yokoyama S. Heterogeneity of high density lipoprotein generated by ABCA1 and ABCA7. J Lipid Res. 2005;46(8):1703–1711. [DOI] [PubMed] [Google Scholar]
- 27. Tomioka M, Toda Y, Mañucat NB, et al. Lysophosphatidylcholine export by human ABCA7. Biochim Biophys Acta Mol Cell Biol Lipids. 2017;1862(7):658–665. [DOI] [PubMed] [Google Scholar]
- 28. Satoh K, Abe‐Dohmae S, Yokoyama S, St George‐Hyslop P, Fraser PE. ATP‐binding cassette transporter A7 (ABCA7) loss of function alters Alzheimer amyloid processing. J Biol Chem. 2015;290(40):24152–24165. [DOI] [PMC free article] [PubMed] [Google Scholar]
- 29. Sakae N, Liu CC, Shinohara M, et al. ABCA7 deficiency accelerates amyloid‐β generation and Alzheimer's neuronal pathology. J Neurosci. 2016;36(13):3848–3859. [DOI] [PMC free article] [PubMed] [Google Scholar]
- 30. Aikawa T, Ren Y, Yamazaki Y, et al. ABCA7 haplodeficiency disturbs microglial immune responses in the mouse brain. Proc Natl Acad Sci U S A. 2019;116(47):23790–23796. [DOI] [PMC free article] [PubMed] [Google Scholar]
- 31. Liu X, Li Q, Zhou J, Zhang S. ATP‐binding cassette transporter A7 accelerates epithelial‐to‐mesenchymal transition in ovarian cancer cells by upregulating the transforming growth factor‐β signaling pathway. Oncol Lett. 2018;16(5):5868–5874. [DOI] [PMC free article] [PubMed] [Google Scholar] [Retracted]
- 32. Jehle AW, Gardai SJ, Li S, et al. ATP‐binding cassette transporter A7 enhances phagocytosis of apoptotic cells and associated ERK signaling in macrophages. J Cell Biol. 2006;174(4):547–556. [DOI] [PMC free article] [PubMed] [Google Scholar]
- 33. Kim WS, Li H, Ruberu K, et al. Deletion of Abca7 increases cerebral amyloid‐β accumulation in the J20 mouse model of Alzheimer's disease. J Neurosci. 2013;33(10):4387–4394. [DOI] [PMC free article] [PubMed] [Google Scholar]
- 34. Ma FC, Zong Y, Wang HF, et al. ABCA7 genotype altered Aβ levels in cerebrospinal fluid in Alzheimer's disease without dementia. Ann Transl Med. 2018;6(22):437. [DOI] [PMC free article] [PubMed] [Google Scholar]
- 35. Apostolova LG, Risacher SL, Duran T, et al. Associations of the Top 20 Alzheimer disease risk variants with brain amyloidosis. JAMA Neurol. 2018;75(3):328–341. [DOI] [PMC free article] [PubMed] [Google Scholar]
- 36. Shulman JM, Chen K, Keenan BT, et al. Genetic susceptibility for Alzheimer disease neuritic plaque pathology. JAMA Neurol. 2013;70(9):1150–1157. [DOI] [PMC free article] [PubMed] [Google Scholar]
- 37. Sinha N, Reagh ZM, Tustison NJ, et al. ABCA7 risk variant in healthy older African Americans is associated with a functionally isolated entorhinal cortex mediating deficient generalization of prior discrimination training. Hippocampus. 2019;29(6):527–538. [DOI] [PMC free article] [PubMed] [Google Scholar]
- 38. Andrews SJ, Das D, Cherbuin N, Anstey KJ, Easteal S. Association of genetic risk factors with cognitive decline: the PATH through life project. Neurobiol Aging. 2016;41:150–158. [DOI] [PubMed] [Google Scholar]
- 39. Logge W, Cheng D, Chesworth R, et al. Role of Abca7 in mouse behaviours relevant to neurodegenerative diseases. PLoS One. 2012;7(9):e45959. [DOI] [PMC free article] [PubMed] [Google Scholar]
- 40. Creasey H, Rapoport SI. The aging human brain. Ann Neurol. 1985;17(1):2–10. [DOI] [PubMed] [Google Scholar]
- 41. O'Donoghue MC, Murphy SE, Zamboni G, et al. APOE genotype and cognition in healthy individuals at risk of Alzheimer's disease: a review. Cortex. 2018;104:103–123. [DOI] [PubMed] [Google Scholar]
- 42. Farrer LA, Cupples LA, Haines JL, et al. Effects of age, sex, and ethnicity on the association between apolipoprotein E genotype and Alzheimer disease. A meta‐analysis. APOE and Alzheimer Disease Meta Analysis Consortium. JAMA. 1997;278(16):1349–1356. [PubMed] [Google Scholar]
- 43. Verghese PB, Castellano JM, Holtzman DM. Apolipoprotein E in Alzheimer's disease and other neurological disorders. Lancet Neurol. 2011;10(3):241–252. [DOI] [PMC free article] [PubMed] [Google Scholar]
- 44. Alafuzoff I, Arzberger T, Al‐Sarraj S, et al. Staging of neurofibrillary pathology in Alzheimer's disease: a study of the BrainNet Europe Consortium. Brain Pathol. 2008;18(4):484–496. [DOI] [PMC free article] [PubMed] [Google Scholar]
- 45. Kaminski WE, Piehler A, Wenzel JJ. ABC A‐subfamily transporters: structure, function and disease. Biochim Biophys Acta. 2006;1762(5):510–524. [DOI] [PubMed] [Google Scholar]
- 46. Jacobs J, Weidemann CT, Miller JF, et al. Direct recordings of grid‐like neuronal activity in human spatial navigation. Nat Neurosci. 2013;16(9):1188–1190. [DOI] [PMC free article] [PubMed] [Google Scholar]
- 47. Bäck M, Yurdagul A Jr, Tabas I, Öörni K, Kovanen PT. Inflammation and its resolution in atherosclerosis: mediators and therapeutic opportunities. Nat Rev Cardiol. 2019;16(7):389–406. [DOI] [PMC free article] [PubMed] [Google Scholar]
- 48. Naudí A, Cabré R, Jové M, et al. Lipidomics of human brain aging and Alzheimer's disease pathology. Int Rev Neurobiol. 2015;122:133–189. [DOI] [PubMed] [Google Scholar]
- 49. Srivastava AK, Pittman JM, Zerweck J, et al. β‐Amyloid aggregation and heterogeneous nucleation. Protein Sci. 2019;28(9):1567–1581. [DOI] [PMC free article] [PubMed] [Google Scholar]
- 50. Theillet FX, Binolfi A, Frembgen‐Kesner T, et al. Physicochemical properties of cells and their effects on intrinsically disordered proteins (IDPs). Chem Rev. 2014;114(13):6661–6714. [DOI] [PMC free article] [PubMed] [Google Scholar]
- 51. Koper MJ, Van Schoor E, Ospitalieri S, et al. Necrosome complex detected in granulovacuolar degeneration is associated with neuronal loss in Alzheimer's disease. Acta Neuropathol. 2020;139(3):463–484. [DOI] [PubMed] [Google Scholar]
- 52. Samson AL, Zhang Y, Geoghegan ND, et al. MLKL trafficking and accumulation at the plasma membrane control the kinetics and threshold for necroptosis. Nat Commun. 2020;11(1):3151. [DOI] [PMC free article] [PubMed] [Google Scholar]
- 53. Zhou Y, Prakash P, Gorfe AA, Hancock JF. Ras and the plasma membrane: a complicated relationship. Cold Spring Harb Perspect Med. 2018;8(10):a031831. [DOI] [PMC free article] [PubMed] [Google Scholar]
- 54. Castellano E, Santos E. Functional specificity of ras isoforms: so similar but so different. Genes Cancer. 2011;2(3):216–231. [DOI] [PMC free article] [PubMed] [Google Scholar]
- 55. Lauwers E, Goodchild R, Verstreken P. Membrane lipids in presynaptic function and disease. Neuron. 2016;90(1):11–25. [DOI] [PubMed] [Google Scholar]
- 56. Ueda Y. The role of phosphoinositides in synapse function. Mol Neurobiol. 2014;50(3):821–838. [DOI] [PubMed] [Google Scholar]
- 57. Foster EM, Dangla‐Valls A, Lovestone S, Ribe EM, Buckley NJ. Clusterin in Alzheimer's disease: mechanisms, genetics, and lessons from other pathologies. Front Neurosci. 2019;13:164. [DOI] [PMC free article] [PubMed] [Google Scholar]
- 58. Belloy ME, Napolioni V, Greicius MD. A quarter century of APOE and Alzheimer's disease: progress to date and the path forward. Neuron. 2019;101(5):820–838. [DOI] [PMC free article] [PubMed] [Google Scholar]
- 59. Elliott DA, Weickert CS, Garner B. Apolipoproteins in the brain: implications for neurological and psychiatric disorders. Clin Lipidol. 2010;51(4):555–573. [DOI] [PMC free article] [PubMed] [Google Scholar]
- 60. ENCODE Project Consortium , Moore JE, Purcaro MJ, et al. Expanded encyclopaedias of DNA elements in the human and mouse genomes. Nature. 2020;583(7818):699–710. [DOI] [PMC free article] [PubMed] [Google Scholar]
- 61. Garcia‐Mesa Y, Jay TR, Checkley MA, et al. Immortalization of primary microglia: a new platform to study HIV regulation in the central nervous system. Neurovirol. 2017;23(1):47–66. [DOI] [PMC free article] [PubMed] [Google Scholar]
Associated Data
This section collects any data citations, data availability statements, or supplementary materials included in this article.
Supplementary Materials
Supporting Information