Abstract
Changes in the reflectivity of lesions on the proximal surfaces of extracted human teeth were measured at SWIR wavelengths from 1300–2000 nm as they were dried with air to assess lesion activity. An extended range tungsten-halogen lamp with bandpass filters of varying wavelength (bandwidth) 1300 nm (90), 1460 nm (85), 1535 nm (80), and 1675 nm (90) along with a broadband ASE source centered near the peak of the water-absorption band at 1950-nm were used as light sources and an extended range InGaAs camera (1000–2340 nm) was used to acquire reflected light images as the samples were dried with air. MicroCT images were used as a gold standard for comparison. SWIR light at 1950 nm yields extremely high contrast of demineralization and appears to be the optimum wavelength for the assessment of lesion activity on tooth coronal surfaces.
Keywords: dental caries, SWIR imaging, lesion activity
1. INTRODUCTION
Caries lesions can be arrested by the preferential deposition of mineral at the lesion surface that inhibits diffusion of fluids into the porous lesion [1–3]. Since arrested lesions do not need further intervention, the assessment of lesion activity is essential for clinical diagnosis.
Many lesions have been arrested or do not require intervention. Even so, it is difficult to identify active lesions with current diagnostic methods. Accurate assessment of lesion activity, depth, and severity is important to determine whether intervention is necessary. Gold standards for lesion assessment such as transverse microradiography (TMR) and polarized light microscopy (PLM) either require destruction of the tooth, or in the case of microCT are unsuitable for use in-vivo. New non-destructive diagnostic tools are needed that can assess lesion activity in a single visit. Effective employment of new optical diagnostic technologies that can exploit the changes in the light scattering of the lesion have great potential for diagnosing the present state of the lesions. Therefore, the development of new methods, such as short wavelength infrared (SWIR) imaging, are needed for the clinical assessment of lesion activity to avoid unnecessary cavity preparations.
When lesions become arrested by mineral deposition, or remineralization, in the outer layers of the lesion, the diffusion of fluids into the lesion is inhibited. Hence, the rate of water diffusion out of the lesion reflects the degree of lesion activity. Previous studies have demonstrated that the optical changes due to the loss of water from porous lesions can be exploited to assess lesion severity and activity with fluorescence, thermal, and SWIR imaging [4–10]. Since arrested lesions are less permeable to water due to the highly mineralized surface layer, changes in the rate of water loss can be related to changes in lesion structure and porosity. We have investigated optical methods for assessing water diffusion rates from lesions since the porosity of the outer layers of active lesions is significantly greater than arrested lesions. This can be indirectly measured via SWIR reflectance methods [11–13]. Normal enamel is transparent at SWIR wavelengths, whereas early demineralization causes increased SWIR reflectance due to scattering. Water in the pores at the surface of the lesion absorbs the incident SWIR light, particularly at wavelengths greater than 1450 nm, reducing surface scattering and lesion contrast. Loss of that water during dehydration produces a marked increase in reflectivity and lesion contrast.
As the lesion becomes arrested by mineral deposition or remineralization, the permeability of the mineralized surface layer decreases. Thus, the rate of diffusion of water from the lesion is greatly reduced if the lesion is arrested. Changes in fluorescence loss [7, 14, 15], thermal emission and SWIR reflectance [8, 16, 17] during lesion dehydration have been investigated as methods for assessing lesion activity. In-vivo studies have been published utilizing the fluorescence loss of white spot lesions on coronal surfaces [7] and thermal imaging to assess root caries during dehydration [18]. The relationship between surface zone thickness and lesion permeability is highly non-linear; a small increase in the surface layer thickness can lead to a marked decrease in permeability [19].
Recent studies at wavelengths beyond 1700-nm show that the contrast of demineralization on tooth surfaces continues to increase with increasing wavelength due to decreasing scattering in sound enamel and increasing water absorption [20–22]. Contrast is particularly high near the strong water absorption band at 1950 nm. The high contrast of demineralization and the high sensitivity to water absorption suggests that 1950 nm should be ideal for SWIR reflectance dehydration measurements and recent studies on bovine enamel blocks support this hypothesis [21]. The purpose of this study was to investigate the use of SWIR reflectance dehydration measurements at 1950 nm to assess the activity of caries lesions on extracted teeth.
2. MATERIALS AND METHODS
2.1. Sample Preparation
Extracted teeth were selected with interproximal lesions for participation in this study. Teeth were collected from patients in the San Francisco Bay area with approval from the UCSF Committee on Human Research. The teeth were sterilized using gamma radiation and stored in 0.1% thymol solution to maintain tissue hydration and prevent bacterial growth.
The teeth were imaged using Microcomputed X-ray tomography (μCT) with a 10-μm resolution. A Scanco μCT 50 from Scanco USA (Wayne, PA) located at the UCSF Bone Imaging Core Facility was used to acquire the images. MicroCT images of 120 teeth were examined and ten teeth with interproximal lesions chosen with distinct surface zones were selected and designated as arrested while ten teeth were chosen for which no discernable surface zones were visible and those were designated as active lesions.
2.2. Visible/Color Images
A USB microscope, Model 5MP Edge AM7915MZT, AnMO Electronics Corp. (New Taipei City,Taiwan) equipped with a visible polarizer was use used to acquired visible images of all samples. The digital microscope captures 5 mega-pixel (2952 × 1944) color images. Eight white LED lights contained in the camera illuminate the sample and a single polarization element in utilized to reduce glare.
2.3. Optical Coherence Tomography (CP-OCT)
An IVS-2000-HR-C OCT system from Santec (Komaki, Aichi, Japan) was used for this study. This system utilizes a swept laser source and a handpiece with a microelectromechanical (MEMS) scanning mirror and the imaging optics. It is capable of acquiring complete tomographic images of a volume of 5 × 5 × 5mm in approximately 3 seconds. The body of the handpiece is 7 × 18 cm with an imaging tip that is 4 cm long and 1.5 cm across. This system operates at a wavelength of 1312-nm with a bandwidth of 173-nm with a measured resolution in air of 8.8 μm (3 dB). Measured lesion depths were divided by 1.6, the refractive index of enamel. The lateral resolution is 30-μm (1/e2) with a measured imaging depth of 5-mm in air. Image analysis and lesion structural measurements were carried out using Dragonfly from ORS (Montreal, Canada).
2.4. SWIR Dehydration Measurements
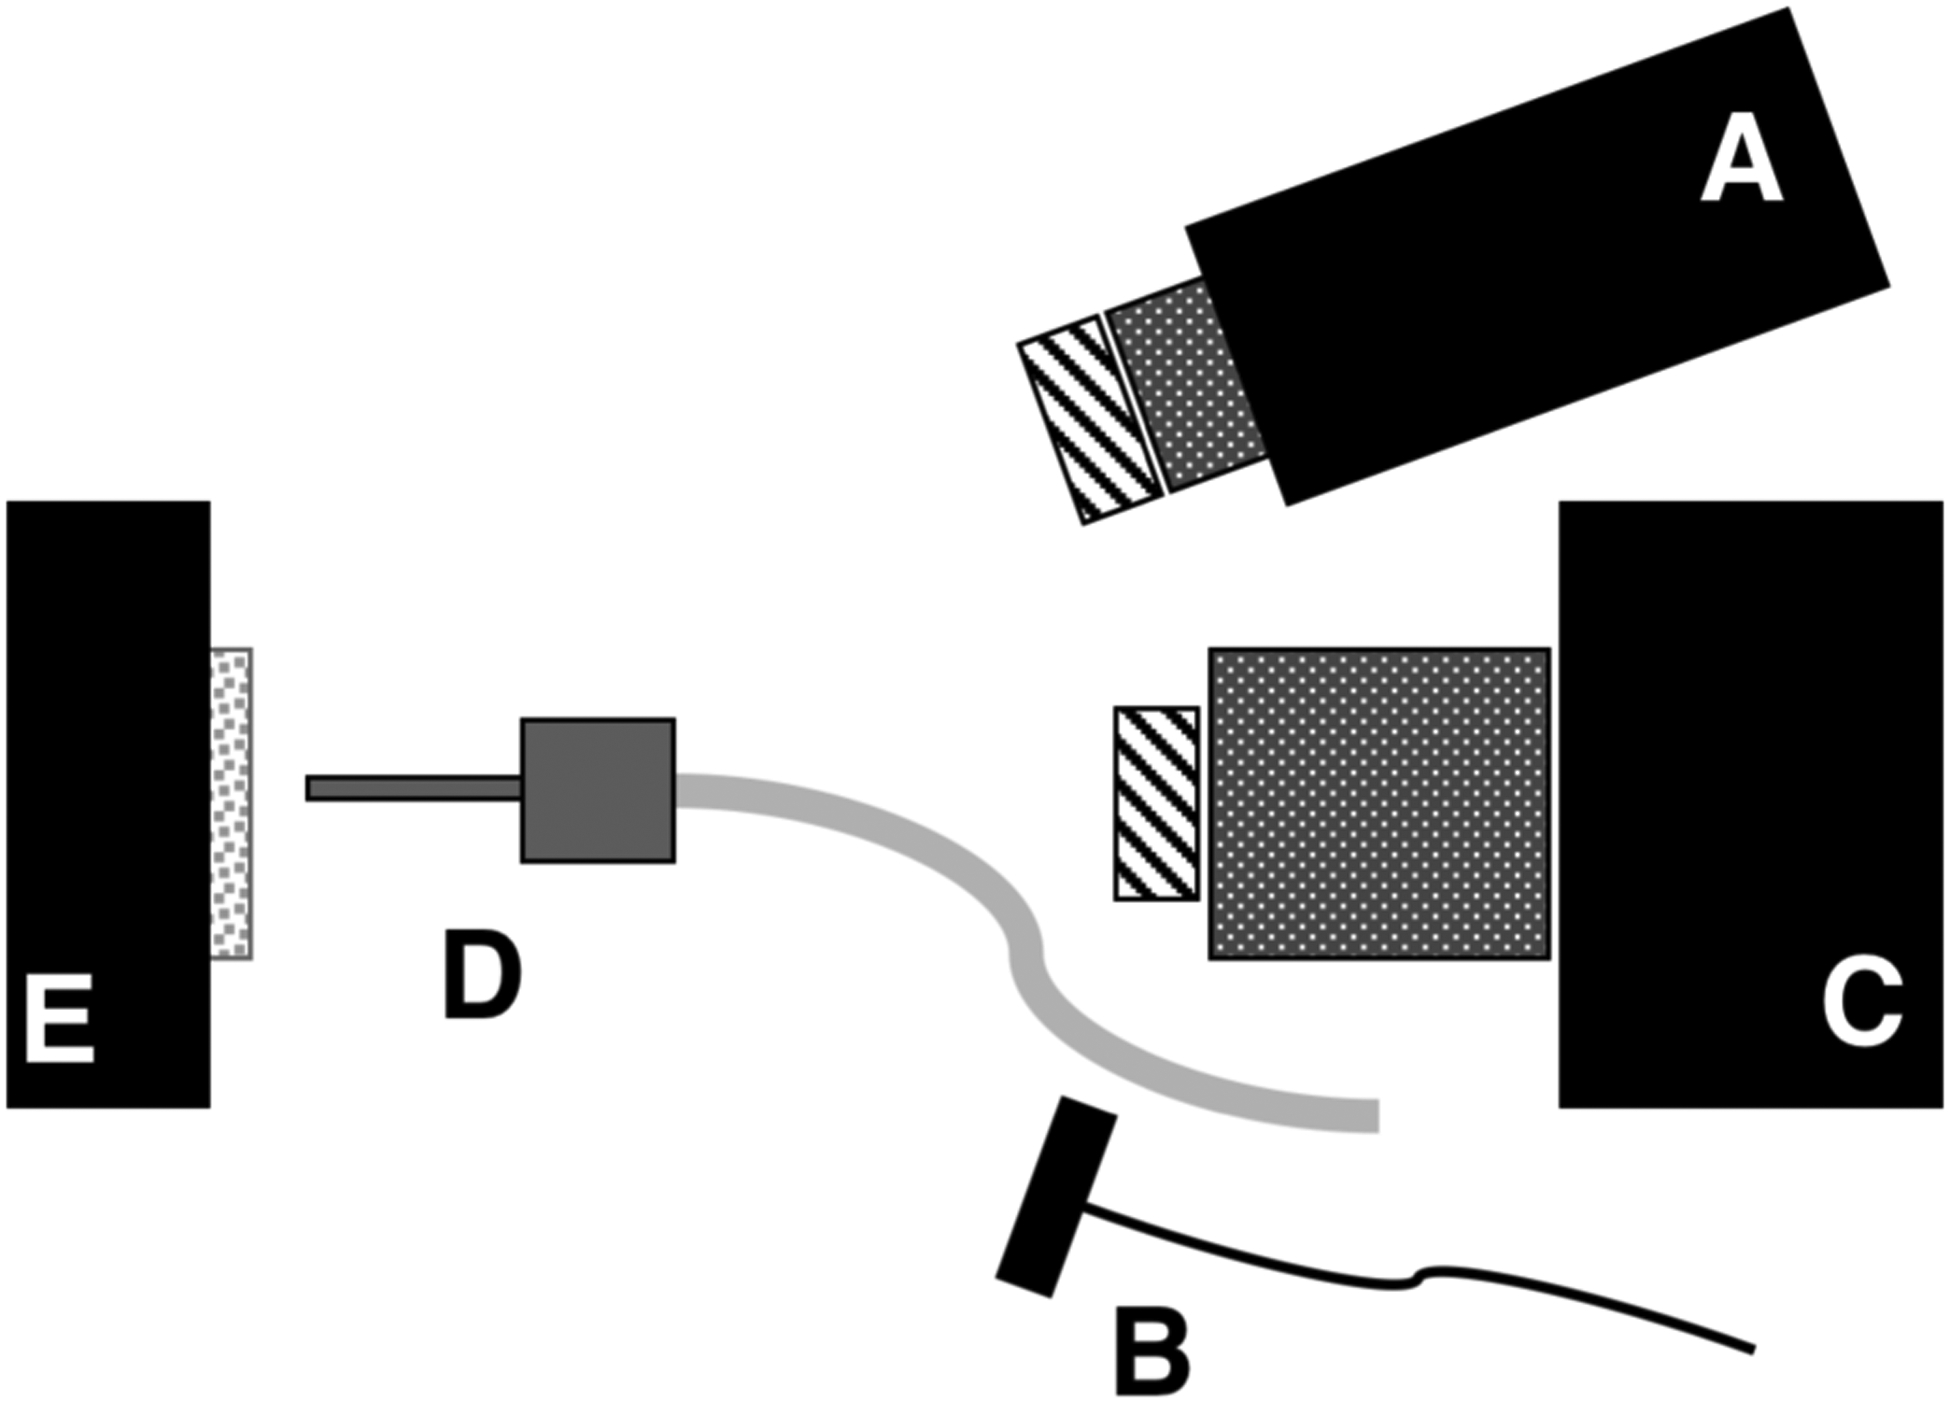
Samples were stored in a moist environment to preserve internal hydration and the samples were immersed in a water bath before mounting and performing measurements. A computer-controlled air nozzle with a 1 mm aperture and an air pressure set to 25 psi was positioned 4 cm away at a 20° angle above the sample plane as shown in Fig. 1. After each sample was removed from the water bath, an image was captured as an initial reference image and the pressurized air nozzle was activated to dehydrate the sample. Each measurement consisted of capturing a sequence of images at 25 frames per second for 60 seconds. For each measurement, the air nozzle and the light source were centered on the region of interest (ROI) that encompasses the entire sample. The dehydration setup was completely automated using LabVIEW software (National Instruments, Austin, TX).
Fig. 1.

Schematic of the experimental setup showing (A) tungsten-halogen light source with bandpass filters, collimating lens and polarizer, (B) polarized 1950-nm fiber optic light source, (C) Xenics extended range InGaAs camera with lens and polarizer, (D) air nozzle and (E) tooth samples mounted on XYZ stage. Light sources A & B were positioned on the same side for these measurements.
A Xenics (Leuven, Belgium) Model Xeva-2.35–320 extended range InGaAs camera sensitive from 900–2350 nm (320×240 pixel) was used to acquire the SWIR images. The camera was equipped with a Navitar f=35-mm SWIR optimized (f/1.4) lens and a 60 mm achromat lens was positioned 40 mm from the 35 mm lens. A high extinction polarizer was used to acquire cross polarization images from 1500–2350 nm. The quantum efficiency peaks at 1500 nm near 65% and drops off rapidly to 30% after 1700 nm and drops off again to below 20% after 2000 nm. A Model SLS202 extended wavelength tungsten-halogen light source from Thorlabs (Newton, NJ) with a peak output at 1500 nm and collimating optics and a high extinction polarizer was used. Bandpass filters of varying wavelength (bandwidth) 1300 nm (90), 1460 nm (85), 1535 nm (80), and 1675 nm (90) were used. A polarized, broadband amplified spontaneous emission (ASE) light source Model AP-ASE-2000 from AdValue Photonics (Tucson, AZ) with a center wavelength of 1959 nm and a bandwidth of ~100 nm (−3 dB), 230 nm (−30 dB) and an output power of 11 mW was used for the 1950 nm light source. The light sources were placed at 20° angles to the camera as shown in Fig. 1 but positioned on the same side. Images were processed and automatically analyzed using a dedicated program constructed with LabVIEW software.
3. RESULTS AND DISCUSSION
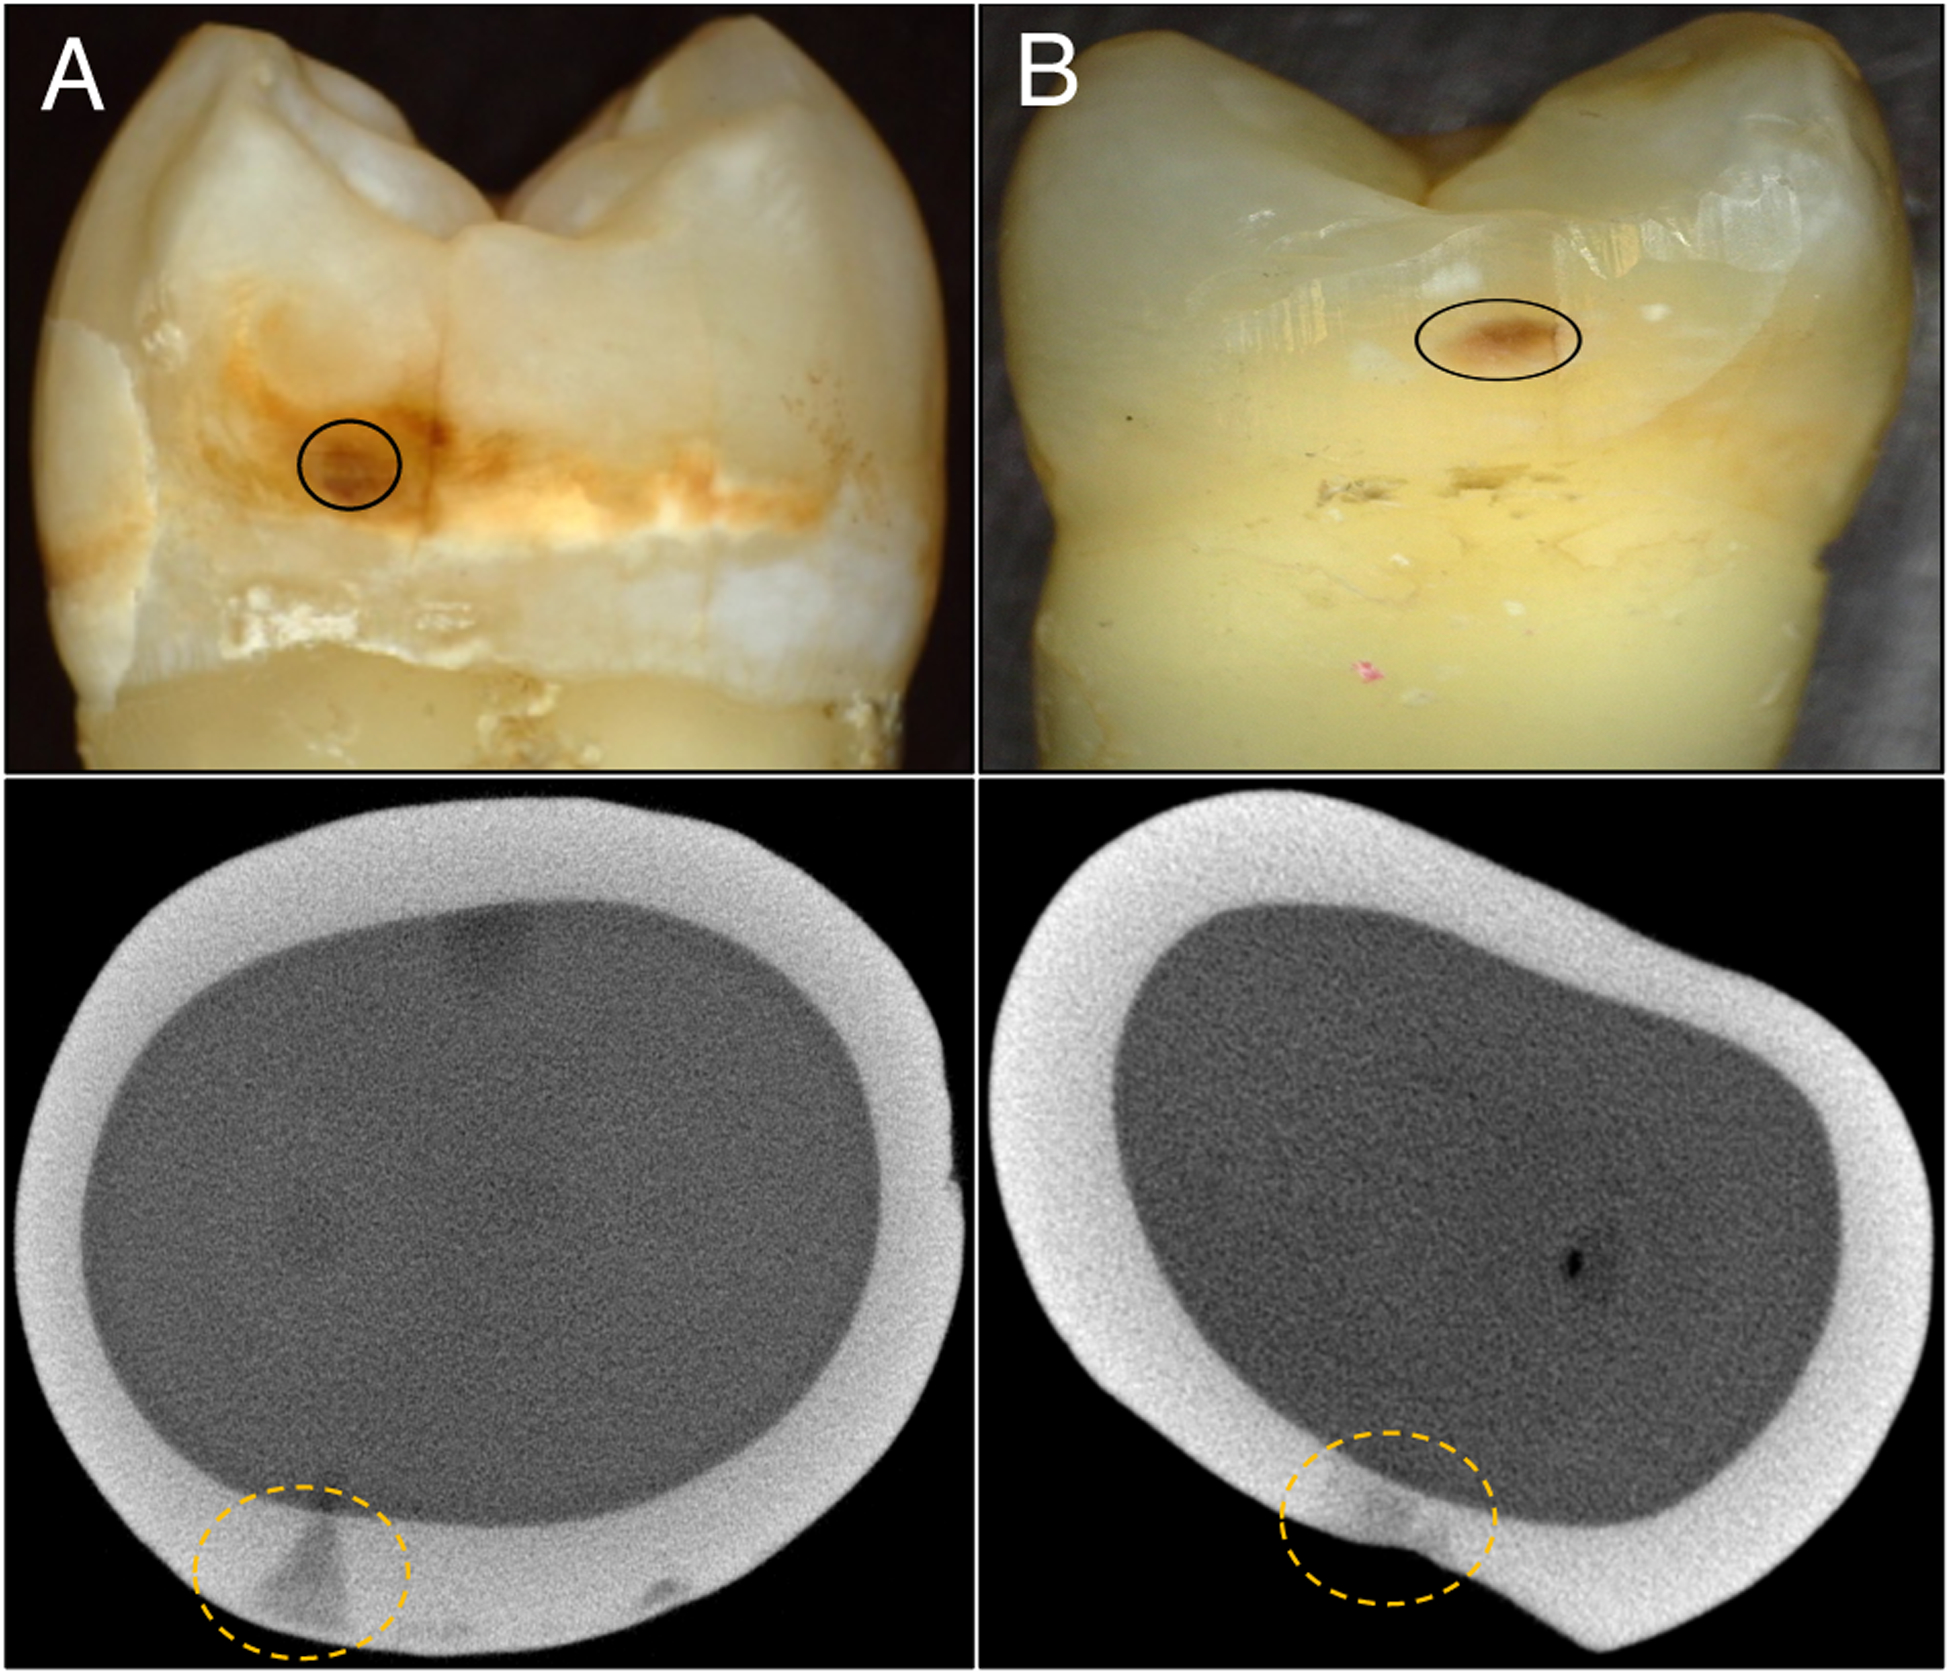
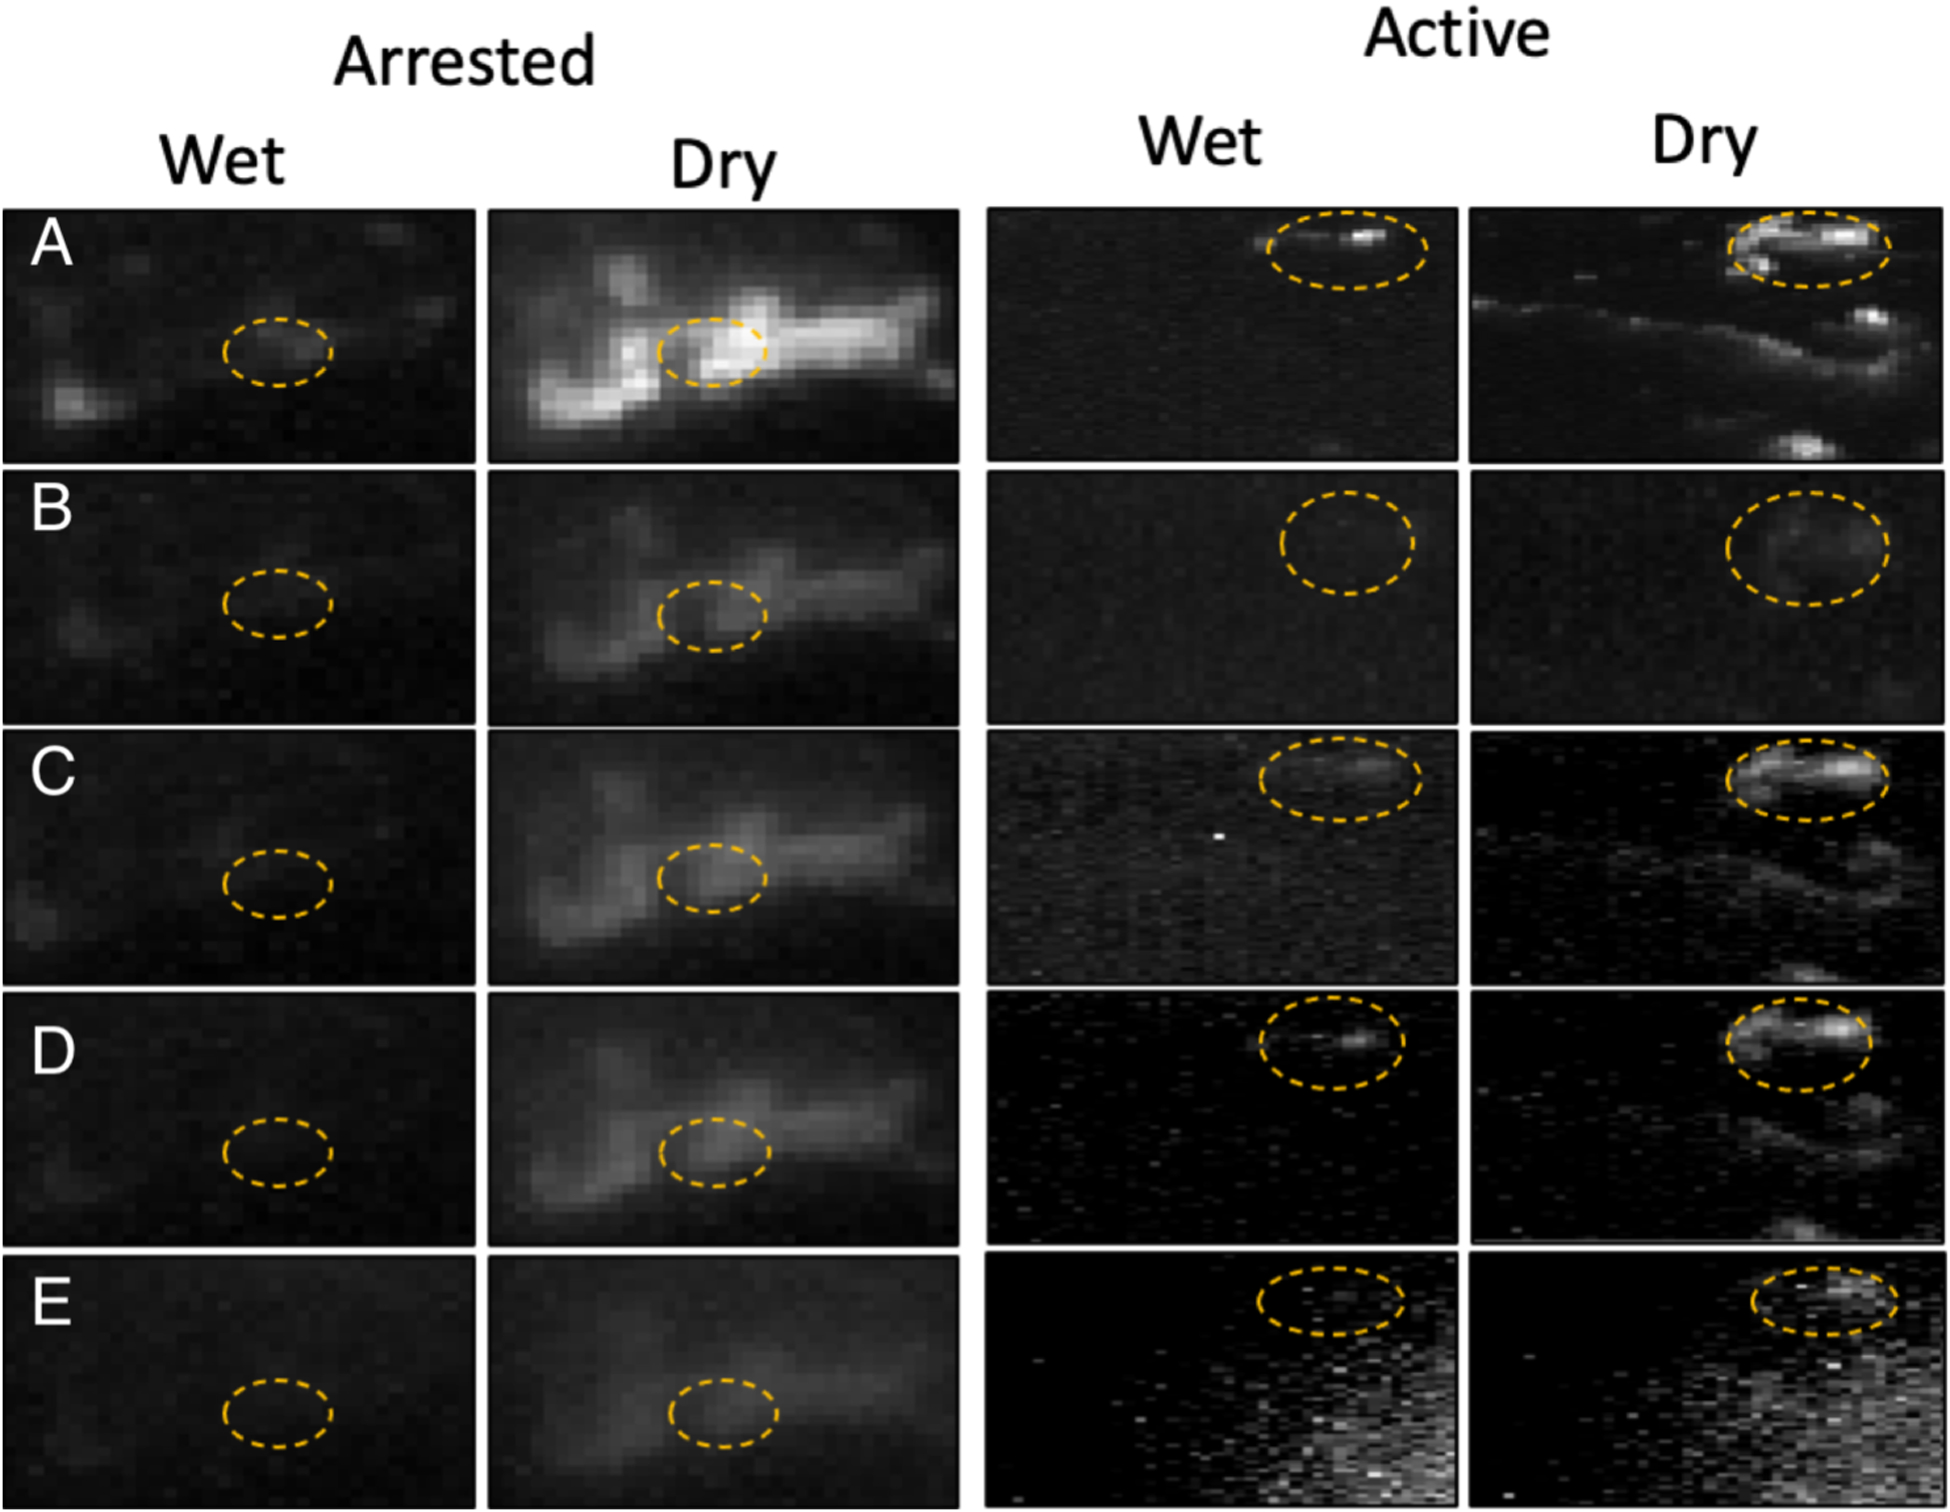
Figure 2 shows color (visible) images for two of the teeth chosen, one suspected to be arrested and one suspected to be active along with microCT images taken orthogonal to the long axis of the tooth showing the structure of the interproximal lesions and the highly mineralized surface zone that is clearly visible for the arrested lesion. Optical coherence tomography was also used to confirm the presence of a transparent surface zone on the lesion surface. The lesions appear to have similar color, staining and texture in the visible images, however, the arrested lesion is both larger and deeper than the active lesion. SWIR images acquired before and after drying the lesions for 60 seconds are shown in Fig. 3. Initially most of the tooth surface is very dark with near zero intensity and that intensity rapidly increases during drying. When dry the intensity (reflectivity) is markedly higher from the lesion areas at 1950 nm compared to other wavelengths which is consistent with what has been observed in other recent studies [20–22].
Fig. 2.

Color(visible) and microCT images of two extracted teeth with suspected (A) arrested and (B) active interproximal lesions.
Fig. 3.

SWIR images acquired from the active and arrested lesion areas from the teeth shown in Fig. 1 before (wet) and after (dry) drying with forced air at 25 psi for 60 seconds. The respective lesion areas are enclosed by the dashed circles. Wavelengths (bandwidth) are (A) 1950(100), (B) 1675(90), (C) 1535(80), (D) 1460(85), and (E) 1300(90) nm.
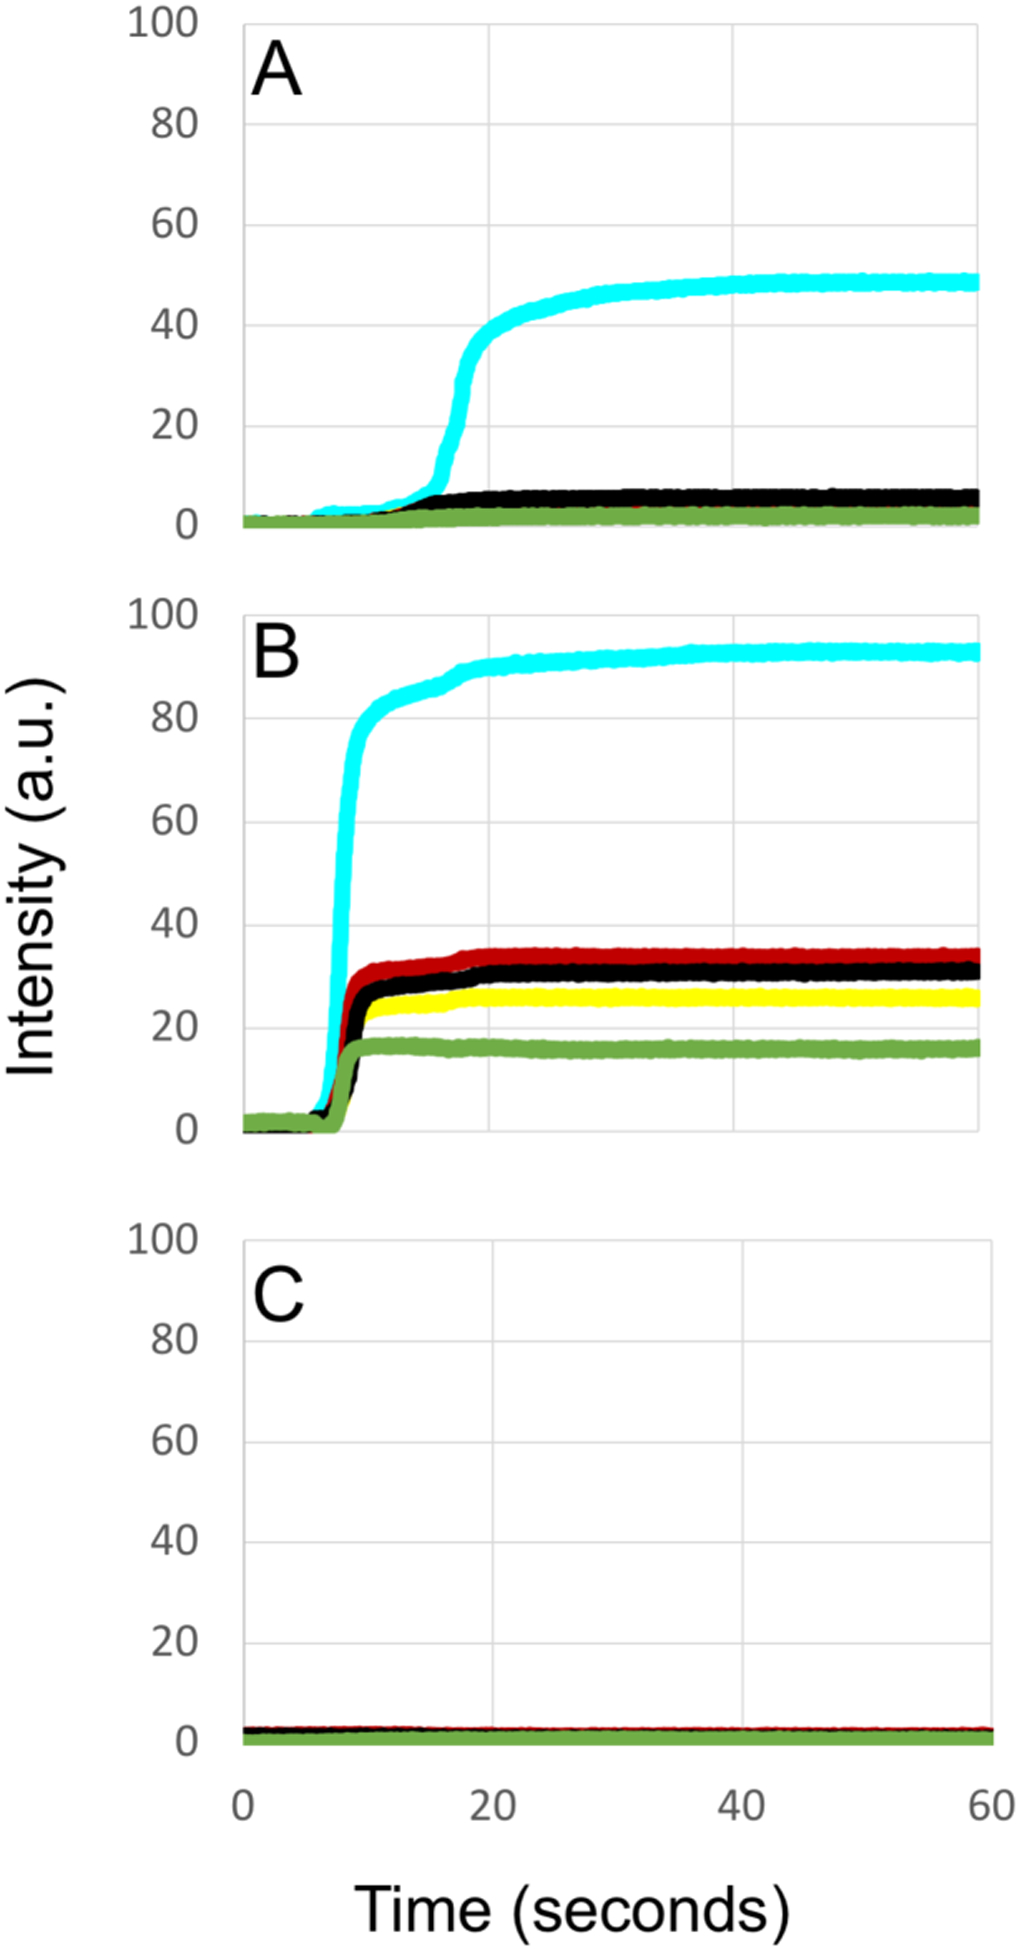
Dehydration curves from the lesion areas marked in Fig. 3 are plotted in Fig. 4 along with curves acquired from a sound area on one of the teeth. The intensity changes or ΔI values are markedly higher for 1950 nm.
Fig. 4.

Dehydration curves of intensity versus time for suspected (A) active, (B) arrested and (C) sound tooth areas. From top to bottom in (B) aqua-1950(100), red-1535(80), black-1460(85), yellow-1675(90) and green-1300(90) nm.
For the two active and arrested lesion examples shown in this paper, the reflectivity is higher for the arrested lesion after drying than it is for the active lesion. Previous studies using simulated lesions have shown that the intensity change is typically significantly higher for those lesions that are more active and that ΔI decreases significantly after those lesion have undergone remineralization. Lesions found on extracted teeth are expected to vary considerably with respect to depth and severity, therefore it is not unexpected to observe arrested lesions that have a higher reflectivity than active lesions simply because they are deeper and more severe than the active lesions they are being compared with which is the case for the two lesions presented in Figs. 1–3. In addition, even though several studies have shown that mean ΔI values are significantly higher for active vs. arrested lesions, the reflectivity after drying and ΔI are not practical measures to use to differentiate active from arrested lesions and other measures such as the shape of the dehydration curve are better suited to differentiate active from arrested lesions. Arrested lesions appear to take longer to completely dry due to the lower permeability.
We observed some notable differences in the dehydration curves acquired at 1950 nm that we have not been observed at other wavelengths and were not evident on simulated lesions. The active lesions manifest a delay of several seconds before there is a change in intensity. This can be clearly seen upon comparing the 1950 nm curves in A & B of Fig. 3. Active lesions are typically rougher and more likely to have micro-cavitation than arrested lesions and such surfaces are likely to have more pooled water on the surface that takes a longer initial period to remove. In addition, we recorded dehydration curves for as long as 2–4 minutes and the arrested lesions take longer to completely dry compared to the suspected active lesions. The strong water absorption at 1950 nm and the high sensitivity to changes in water content provides important insight into the mechanism of dehydration in these samples. Further studies are underway to identify differences in the dehydration curves that can be more easily exploited clinically to differentiate active and arrested lesions.
4. ACKNOWLEDGEMENTS
The authors would like to acknowledge the help of Filipp Kashirtsev, Jacob Simon and Yihua Zhu. This work was supported by the Swiss National Science Foundation (SNSF), Switzerland. (Grant ID: P2GEP3-188157) and NIH/NIDCR Grant R01-DE027335.
5. REFERENCES
- [1].ten Cate JM, and Featherstone JDB, “Mechanistic aspects of the interactions between fluoride and dental enamel,” Critical Rev Oral Bio Med, 2, 283–296 (1991). [DOI] [PubMed] [Google Scholar]
- [2].ten Cate JM, and Arends J, “Remineralization of artificial enamel lesions in vitro,” Caries Res, 11(5), 277–86 (1977). [DOI] [PubMed] [Google Scholar]
- [3].Lepri TP, Colucci V, Turssi CP, and Corona SA, “Permeability of eroded enamel following application of different fluoride gels and CO2 laser,” Lasers Med Sci, 28(1), 235–40 (2013). [DOI] [PubMed] [Google Scholar]
- [4].Kaneko K, Matsuyama K, and Nakashima S, “Quantification of Early Carious Enamel Lesions by using an Infrared Camera,” Early detection of Dental caries II. Indiana University Press, Vol. 483–99 (1999). [Google Scholar]
- [5].Zakian CM, Taylor AM, Ellwood RP, and Pretty IA, “Occlusal caries detection by using thermal imaging,” J Dent, 38(10), 788–795 (2010). [DOI] [PubMed] [Google Scholar]
- [6].Usenik P, Bürmen M, Fidler A, Pernuš F, and Likar B, “Near-infrared hyperspectral imaging of water evaporation dynamics for early detection of incipient caries,” J Dent, 42(10), 1242–1247 (2014). [DOI] [PubMed] [Google Scholar]
- [7].Ando M, Ferreira-Zandona AG, Eckert GJ, Zero DT, and Stookey GK, “Pilot clinical study to assess caries lesion activity using quantitative light-induced fluorescence during dehydration,” J Biomed Opt, 22(3), 35005 (2017). [DOI] [PubMed] [Google Scholar]
- [8].Lee RC, Darling CL, and Fried D, “Assessment of remineralization via measurement of dehydration rates with thermal and near-IR reflectance imaging,” J Dent, 43, 1032–1042 (2015). [DOI] [PMC free article] [PubMed] [Google Scholar]
- [9].Lee RC, Staninec M, Le O, and Fried D, “Infrared methods for assessment of the activity of natural enamel caries lesions,” IEEE J Sel Top Quan Elect, 22(3), 6803609 (2014). [DOI] [PMC free article] [PubMed] [Google Scholar]
- [10].Lee RC, Darling CL, and Fried D, “Activity assessment of root caries lesions with thermal and near-infrared imaging methods,” J Biophotonics, 10(3), 433–445 (2016). [DOI] [PMC free article] [PubMed] [Google Scholar]
- [11].Chung S, Fried D, Staninec M, and Darling CL, “Multispectral near-IR reflectance and transillumination imaging of teeth,” Biomed Opt Express, 2(10), 2804–2814 (2011). [DOI] [PMC free article] [PubMed] [Google Scholar]
- [12].Fried WA, Darling CL, Chan K, and Fried D, “High Contrast Reflectance Imaging of Simulated Lesions on Tooth Occlusal Surfaces at Near-IR Wavelengths,” Lasers Surg Med, 45(8), 533–541 (2013). [DOI] [PMC free article] [PubMed] [Google Scholar]
- [13].Simon JC, Chan KH, Darling CL, and Fried D, “Multispectral near-IR reflectance imaging of simulated early occlusal lesions: variation of lesion contrast with lesion depth and severity,” Lasers Surg Med, 46(3), 203–15 (2014). [DOI] [PMC free article] [PubMed] [Google Scholar]
- [14].Stookey GK, “Quantitative light fluorescence: a technology for early monitoring of the caries process,” Dent Clin North Am, 49(4), 753–70 (2005). [DOI] [PubMed] [Google Scholar]
- [15].Ando M, Stookey GK, and Zero DT, “Ability of quantitative light-induced fluorescence (QLF) to assess the activity of white spot lesions during dehydration,” Am J Dent, 19(1), 15–8 (2006). [PubMed] [Google Scholar]
- [16].Lee C, Lee D, Darling CL, and Fried D, “Nondestructive assessment of the severity of occlusal caries lesions with near-infrared imaging at 1310 nm,” J Biomed Opt, 15(4), 047011 (2010). [DOI] [PMC free article] [PubMed] [Google Scholar]
- [17].Lee RC, Darling CL, and Fried D, “Assessment of remineralized dentin lesions with thermal and near-infrared reflectance imaging,” Laser in Dentistry XXII. Proc. SPIE, Vol. 9692 B:1–5 (2016). [DOI] [PMC free article] [PubMed] [Google Scholar]
- [18].Yang V, Zhu Y, Curtis D, Le O, Chang N, Fried W, Simon JC, Banan P, Darling C, and Fried D, “Thermal Imaging of Root Caries In Vivo,” J Dent Res, 99(13), 1502–1508 (2020). [DOI] [PMC free article] [PubMed] [Google Scholar]
- [19].Chang NN, Jew JM, and Fried D, “Lesion dehydration rate changes with the surface layer thickness during enamel remineralization,” Lasers in Dentistry XXIV. Proc. SPIE Vol. 10473 D:1–7 (2018). [DOI] [PMC free article] [PubMed] [Google Scholar]
- [20].Chan KH, and Fried D, “Multispectral cross-polarization reflectance measurements suggest high contrast of demineralization on tooth surfaces at wavelengths beyond 1300-nm due to reduced light scattering in sound enamel ” J Biomed Opt, 23(6), 060501 (2018). [DOI] [PMC free article] [PubMed] [Google Scholar]
- [21].Fried WA, Abdellaziz M, Darling CL, and Fried D, “High Contrast Reflectance Imaging of Enamel Demineralization and Remineralization at 1950-nm for the Assessment of Lesion Activity,” Lasers Surg Med, in press (2021). [DOI] [PMC free article] [PubMed] [Google Scholar]
- [22].Ng C, Almaz EC, Simon JC, Fried D, and Darling CL, “Near-infrared imaging of demineralization on the occlusal surfaces of teeth without the interference of stains,” J Biomed Optics, 24(3), 036002 (2019). [DOI] [PMC free article] [PubMed] [Google Scholar]


