eLife logoLink to eLife
. 2021 Mar 12;10:e65786. doi: 10.7554/eLife.65786

Synchronous activity patterns in the dentate gyrus during immobility

Martin Pofahl 1, Negar Nikbakht 1, André N Haubrich 1, Theresa Nguyen 1, Nicola Masala 1, Fabian Distler 1, Oliver Braganza 1, Jakob H Macke 2, Laura A Ewell 1, Kurtulus Golcuk 1, Heinz Beck 1,3,
Editors: Laura L Colgin4, Laura L Colgin5
PMCID: PMC7987346  PMID: 33709911

Abstract

The hippocampal dentate gyrus is an important relay conveying sensory information from the entorhinal cortex to the hippocampus proper. During exploration, the dentate gyrus has been proposed to act as a pattern separator. However, the dentate gyrus also shows structured activity during immobility and sleep. The properties of these activity patterns at cellular resolution, and their role in hippocampal-dependent memory processes have remained unclear. Using dual-color in vivo two-photon Ca2+ imaging, we show that in immobile mice dentate granule cells generate sparse, synchronized activity patterns associated with entorhinal cortex activation. These population events are structured and modified by changes in the environment; and they incorporate place- and speed cells. Importantly, they are more similar than expected by chance to population patterns evoked during self-motion. Using optogenetic inhibition, we show that granule cell activity is not only required during exploration, but also during immobility in order to form dentate gyrus-dependent spatial memories.

Research organism: Mouse

Introduction

The dentate gyrus receives polymodal sensory information from the entorhinal cortex, and relays it into the hippocampal network. The most prevalent view of the dentate gyrus input-output transformation in this circuit is that it acts as a pattern separator. This capability requires the animal to generate dissimilar neuronal representations from overlapping input states that represent similar but not identical environments (Cayco-Gajic and Silver, 2019). Such an operation, termed pattern separation, has been ascribed to the hippocampal dentate gyrus in species ranging from rodents to humans (Berron et al., 2016; Leutgeb et al., 2007; Sakon and Suzuki, 2019). In the dentate gyrus, polysensory inputs are mapped onto a large number of granule cells which exhibit extremely sparse firing patterns, resulting in a high probability of non-overlapping output patterns (Danielson et al., 2016; GoodSmith et al., 2017; Hainmueller and Bartos, 2018; Pilz et al., 2016; Senzai and Buzsáki, 2017; van Dijk and Fenton, 2018). This concept has been influential in understanding dentate gyrus function when processing multimodal, current, or ‘online’ sensory information during mobility and exploration.

However, the dentate gyrus is far from silent during immobility. It displays prominent electrographic activity patterns such as dentate spikes and sharp waves, which occur primarily during immobility or sleep (Bragin et al., 1995; Meier et al., 2020; Penttonen et al., 1997). In downstream hippocampal regions such as CA1, neuronal activity during immobility incorporates the replay of behaviorally relevant sequences during sharp wave ripples, a process important in memory consolidation (Davidson et al., 2009; Diba and Buzsáki, 2007; Dupret et al., 2010; Foster and Wilson, 2006; Girardeau et al., 2009; Malvache et al., 2016; Skaggs and McNaughton, 1996; Wilson and McNaughton, 1994). In the dentate gyrus, little detail is known about how granule cells are active during immobility at the population level, and it is unknown whether activity during immobility reiterates behaviorally relevant information. Moreover, the role of dentate gyrus activity during immobility in memory formation is unclear.

Here, we have used dual-color two-photon in-vivo Ca2+ imaging to show that in immobile mice, the dentate gyrus exhibits frequent, sparse, and synchronous population events that at the population level are similar to activity patterns during locomotion. Moreover, we have tested the idea that dentate gyrus activity during immobility is relevant for dentate-gyrus dependent spatial memory.

Results

Sparse, structured dentate network events in immobile animals

We imaged the activity of large populations of hippocampal dentate granule cells (GCs) using a Thy1-GCaMP6s mouse line (GP4.12Dkim/J, Dana et al., 2014). In addition, we monitored the bulk activity of the major input system into the dentate gyrus, the medial perforant path (MPP). To this end, we expressed the red-shifted Ca2+ indicator jRGECO1a (Dana et al., 2016) in the medial entorhinal cortex using viral gene transfer (see Materials and methods section, Figure 1A, Figure 1—figure supplement 1A). To allow efficient excitation of both genetically encoded Ca2+ indicators, we established excitation with two pulsed laser sources at 940 and 1070 nm (see Figure 1—figure supplement 1B–F). The mice were placed under a two-photon microscope and ran on different variants of a linear track, equipped with different types of cues (see Figure 1—figure supplement 1G–J, Figure 1—video 1).

Figure 1. Synchronous dentate granule cell activations, ‘network events’, occur preferentially during immobility.

(A) Expression of GCaMP6s in granule cells (Thy1-GCaMP mouse line, GP4.12Dkim/J). jRGECO was expressed in medial entorhinal cortex neurons using rAAV mediated gene transfer, and is visible in the middle molecular layer (MML) corresponding to the medial perforant path (MPP). Upper panel: Post hoc analysis in 70 µm fixed slice. Nuclei stained with DAPI (blue). Lower panel: Imaging plane for simultaneous recording of MPP bulk and individual GC activity. Scale bar 100 µm. (B) Data of representative recording session. Bulk fluorescence signal of MPP fibers (red), extracted fluorescence signals from a subset of individual GCs (black), mouse position on linear track (blue) and diameter of mouse pupil (black). (C) Participation of granule cells in synchronous network events. Representative field of view with highlighted simultaneously active GCs. Cells active during an individual network event are depicted in the same color. A subset of neurons is active in multiple network events, recognizable as white color. (D) Raster plot of network events. Dashed lines mark network events, corresponding to simultaneous activity of > four cells. Participating cells are highlighted according to color scheme from panel C. Running speed is depicted (blue) to distinguish running and resting periods. (E) Fluorescence transients of participating granule cells from NEs in panel D. Color scheme corresponds to panel C and D. Each column shows all respective transients of the respective synchronous ensemble. Shown is a time window of ±1 s around each NE. Vertical scale bars correspond to 100% ΔF/F. (F) Mean number of network events per twenty-minute recording session during running and resting. Network events occurred mainly during immobility (repeated measures ANOVA, F(1,8)=71.80, p=2×10⁻⁷, n = 9 animals, three sessions). Gray bars depict shuffled data for each condition (n = 9 animals). (G) Average number of identified network events plotted against different thresholds for the size of network events in terms of numbers of synchronously active cells (green line, shaded area depicts SEM, n = 3 mice, three sessions). Shuffled data null-distribution is created by randomly shuffling event times for every individual cell (gray line, shaded area depicts SEM). (H) Frequencies of network events calculated from equal time intervals for locomotion and immobility (Repeated measures ANOVA, F(1,8) = 117.28, p=2×10⁻⁶). (I) Cumulative probability distribution of network event occurrence during the entire twenty-minute session for individual sessions (gray lines) and the pooled sessions (Green line, n = 9 mice, three sessions). (J) Pooled cumulative probability distribution of network event occurrence during resting periods. All resting periods of one session that were longer than 5 s were normalized to their length (n = 9 mice, three sessions).

Figure 1.

Figure 1—figure supplement 1. Dual-color two-photon imaging in the dentate gyrus.

Figure 1—figure supplement 1.

(A) Representative hippocampal sections from three different mice with expression of jRGECO in the MPP (red), GCaMP6s in granule cells (green), and DAPI as nuclear staining. (B) Setup of the two-photon microscope for dual-color two-photon imaging. To allow efficient excitation of both genetically encoded Ca2+ indicators, we established excitation with two pulsed laser sources at 940 and 1070 nm. (C, D) Dimensions of flat, custom head fixation ring. (F) Conical transparent inset used to maximize NA in deep imaging. Linked to Materials and methods. (D) Properties of the linear track designs for baseline, cue-enriched and zone configuration. (H, I, J) Locomotion on the linear track. Neither the total distance run on the linear track (D) nor the average running speed (E) nor the fraction of time spent running differed significantly between the baseline and cue-enriched and zone conditions (n.s., ANOVA, p=0.31, 0.58, and 0.67, respectively).
Figure 1—figure supplement 2. Granule cell activity during locomotion on empty textured belt.

Figure 1—figure supplement 2.

(A) Image plane for granule cell recording in the dentate gyrus. (B) One representative component of non-negative matrix factorization. Upper panel: spatial component as extracted from image stack. Middle panel: Corresponding ΔF/F trace generated from a ROI drawn around the corresponding somatic region. Lower panel: Extracted ΔF/F trace (gray) with deconvolved trace (black). Identified event onsets are depicted with vertical green lines. (C, D) Frequencies of Ca2+ events (C) and magnitude of Ca2+ transients during each recording session (D) recorded during quiet immobility (rest, dark bars) and locomotion (run, light bars) on an empty textured belt (data from three sessions per animal, n = 9 mice, comparisons between running and resting states ANOVA, n.s.). (E) Distribution of event frequencies for all cells. Black bars represent events during resting periods, gray bars represent frequencies during locomotion (data from three sessions per animal, n = 9 mice).
Figure 1—figure supplement 3. Shuffling analyses demonstrating that network events do not arise by chance.

Figure 1—figure supplement 3.

(A) Average number of identified network events plotted against different used thresholds for the size of network events in terms of numbers of synchronously active cells (green line, shaded area depicts SEM, n = 3 mice, three sessions). Shuffled data null-distribution is created by randomly shuffling event times for every individual cell (gray line, shaded area depicts SEM). (B) Same as A, but using a shuffling approach where traces are randomly shifted with respect to each other (red line, shaded area depicts SEM). (C) Same as A and B, but using a shuffling method were event times are randomly shuffled for locomotion and immobility periods separately (Purple line, shaded area depicts SEM). (D–I) Six representative example data sets. Left panels: Raster plot of event onsets (gray dots) and identified network events (Colored dots) during episodes of locomotion and immobility (blue line). Right panels: Number of network events identified for different threshold (green lines). All three different shuffling approaches are shown in each panel gray, red, purple lines for the shuffling approaches depicted in panels (A-C) respectively. Error bars depict standard deviation. All shuffling approaches yield uniform results.
Figure 1—video 1. Video showing activity of granule cells and MPP, corresponding to Figure 1A,B.
Download video file (68.4MB, mp4)
Figure 1—video 2. Video showing network events, corresponding to Figure 1C.
Download video file (46.3MB, mp4)

As previously described, the firing of GCs was generally sparse (Danielson et al., 2016; Hainmueller and Bartos, 2018; Neunuebel and Knierim, 2012; Pilz et al., 2016), both when animals were immobile and when they were running on a textured belt without additional cues (mean event frequency 1.38 ± 0.19 events/min and 0.97 ± 0.2 events/min, respectively, n = 1415 granule cells in nine mice, Figure 1B, Figure 1—figure supplement 2C–E). Despite the sparse activity of granule cells, we observed synchronized activity patterns (Figure 1—video 2). To rigorously define such events, we used an algorithm that detects synchronized network events within a 200 ms time window, corresponding to 1 ± 1 frame at our sampling rate (see Materials and methods). Such synchronous network events could readily be observed in the dentate gyrus in all mice (Figure 1C,D, network events depicted in different colors, see examples for ΔF/F traces of participating cells in Figure 1E). Network events were sparse, incorporating on average only 5.7 ± 0.09% of the total active GC population. Shuffling analysis (see Materials and methods) confirmed that network events do not arise by chance (Figure 1F, gray bars correspond to shuffled data, n = 9 mice, three sessions/mouse). This was robust over three different types of shuffling analysis (Figure 1G, Figure 1—figure supplement 3 and Materials and methods for the description of the shuffling methods).

Notably, network events occurred mainly during immobility periods and were much less prevalent during running (Figure 1D, quantification in Figure 1G). Accordingly, network event frequencies were significantly higher during immobility (repeated measures ANOVA, F(1,8)=117, p=2×10⁻⁶, n = 9 mice, three sessions, Figure 1H). During immobility periods (defined as running speeds < 4 cm/s), the vast majority of (99.6%) network events occurred when mice were completely immobile. Network events were on average evenly distributed during the 20 min imaging session (Figure 1I), as well as during individual periods of immobility (Figure 1J).

Dentate network events are correlated with MPP activation

We then analyzed the activity in the MPP input fiber tract expressing jRGECO, and probed the relation of this activity with GC activity patterns. As expected during exploratory states, the bulk MPP activity was increased during locomotion, consistent with increased sensory input (Figure 2A,B, red channel, Figure 2C for average value). During immobility in particular, larger fluctuations of bulk MPP activity were observed. This phenomenon was reflected in a larger variance of the bulk MPP signal during immobility (Figure 2D). Cross-correlation revealed that during immobility, the increases in bulk MPP activity were associated with peaks in average GC activity levels (Figure 2E). Both signals were significantly correlated in most sessions for periods of immobility (8/9 sessions, n = 3 mice, three sessions per mouse, Granger causality test p<0.05). This correlation was clearly visible during network events, because aligning GC activity and MPP activity to the timepoint of network events revealed a strong coactivation of GC and MPP during network events (Figure 2F, n = 3 mice). During running, MPP signals did not correlate with average GC activity, which is not unexpected given the asynchronous activation of GCs during running. 8/9 sessions, Granger causality test p>0.05.

Figure 2. Granule cell and MPP activity during locomotion and immobility.

Figure 2.

(A) Mean MPP activity (red) and the sum of all granule cell activities (green) for a representative section of a recording session in an individual mouse. Dashed lines mark transition between resting and running periods (see blue line indicating running speed). (B) Average MPP fluorescence and running speeds, both aligned to running onsets (dashed line). Shaded areas indicate standard error (n = 4 mice, one mouse had only jRGECO expression in MPP, but no granule cell signal, three sessions per mouse). (C) Mean fluorescence averaged during resting (dark red) and running (light red). Asterisk indicates 5% significance threshold (repeated measures ANOVA, F(1,3) = 7,86, p=0.032, n = 4 mice, three sessions). (D) Variance of MMP bulk signal during resting (dark red) and running (light red, n = 4). Asterisk indicates results of repeated measures ANOVA, F(1,3) = 7,07, p=0.037, n = 4 mice, three sessions. (E) Cross-correlation of MPP bulk signal and summed GC signal during resting. Shaded gray area indicates standard error. (F) Average MPP activity (red) and probability of granule cell activity across all mice, three baseline sessions each, both aligned to the time point of network events (n = 3 mice, 2008 network events, shaded red area depicts SEM). (G) Amplitudes of deconvolved events in MPP bulk data during locomotion (light red) und resting (dark red). (H) Frequencies of all deconvolved MPP bulk events during locomotion and immobility (repeated measures ANOVA, F(1,2) = 255, p=3×10⁻⁶, n = 3 mice, three sessions). (I) Frequencies of deconvolved events with amplitudes above two standard deviations (repeated measures ANOVA, F(1,2) = 27, p=2×10⁻³, n = 3 mice, three sessions). (J) Delay of NEs to the closest identified MPP event.

To explore in more detail how individual fluctuations in MPP bulk activity are associated with GC activity, we used a deconvolution algorithm to identify synchronous activity of MPP axons visible in the bulk MPP transients (see Materials and methods). We then quantified amplitude and frequency of these transients during locomotion and immobility. First, we found that bulk MPP events detected during immobility are on average larger than those detected during running (Figure 2G, Kruskal-Wallis test, n = 3 mice, three sessions per mouse, 8469 and 19,106 events during running and resting, respectively, p=2×10−44), in agreement with the larger variance of the MPP signal during these periods. When we examined the frequencies of all detected MPP bulk events during locomotion and immobility, we found that there were significantly more events during running (repeated measures ANOVA, F(1,2)=255, p=3×10⁻⁶, n = 3 mice, three sessions, Figure 2H). However, large events, defined as bulk MPP events with amplitudes above two standard deviations of the mean, were significantly more frequent during resting states (repeated measures ANOVA, F(1,2)=27, p=2×10⁻³, n = 3 mice, three sessions, Figure 2I). Again, this is consistent with the larger variance of the MPP signal during immobility, and likely reflects synchronized activation of MPP fibers. In line with the correlation of MPP and GC signals, there was a short temporal delay between individual bulk MPP transients and network events (Figure 2J).

Dentate network events are correlated with pupil constriction

Pupil diameter is an indicator of neuronal state and arousal (Reimer et al., 2014; Reimer et al., 2016), and can be used to track changes in neuronal states during quiet wakefulness (Reimer et al., 2014). Of note, pupil changes have been shown to closely track the rate of occurrence of hippocampal synchronous activity, namely sharp waves in the hippocampal CA1 region (McGinley et al., 2015). We therefore asked if dentate network events are also associated with specific changes in pupil diameter (Figure 3A for example measurement of pupil diameter over multiple resting and locomotor states). As previously described (Reimer et al., 2014; Reimer et al., 2016), we found pupil constriction during immobility with dilation at locomotion onsets (Figure 3B,C, n = 6 mice, three sessions). Intriguingly, the average pupil diameters during network events were significantly more constricted compared to the average pupil diameters during entire periods of immobility (Figure 3D, repeated measures ANOVA for all three groups F(2,28)=17.17, p=1×10⁻⁵, n = 6, data from three sessions each, Bonferroni post-tests: pupil diameters during locomotion vs. immobility p=0.0068, locomotion vs. network events p=0.0016, immobility vs. network events p=0.0017).

Figure 3. Pupil dynamics during network events.

Figure 3.

(A) Representative example of pupil size measurements during different locomotor states. Green dots indicate timepoints of network events. (B, C) Average pupil diameters (gray lines) aligned to locomotion onsets (B) or offsets (C, blue lines) reveals pupil dilation at locomotion onsets, and constriction during locomotion offset. Shaded areas indicate standard error. GC activity stays on baseline value during change of behavioral state (green). (D) Average pupil diameters during locomotion, during resting periods, and during network events. Asterisks indicate significant Bonferroni post-test at 5% level. (E) Average rate of pupil diameter change during locomotion, during resting periods, and during network events. Asterisks indicate significant Bonferroni post-test at 5% level. (F) Averaging pupil diameters aligned to NE times (green bars) reveals pupil constriction during NEs. Shaded areas indicate standard error. (n = 6 mice, three sessions). (n = 6 mice, three sessions).

When looking at pupillary dynamics by assessing the rate of diameter change, locomotor episodes were on average associated with pupil dilation, while network events were specifically associated with pupil constriction (Figure 3E, repeated measures ANOVA F(2,28)=34.18, p=3×10⁻⁸, n = 6 mice, data from three sessions each, Bonferroni post-tests: pupil diameters during locomotion vs. immobility p=0.0016, locomotion vs. network events p=2.53×10⁻⁵, immobility vs. network events p=0.00053). The latter finding was clearly illustrated by averaging pupil diameters aligned to NE times (Figure 3F). Together, this suggests that network events are associated with specific pupillary dynamics reflecting substates of arousal and neuronal synchronization during immobility.

Network events are more orthogonal than expected by chance, but repetitively recruit GC sub-ensembles

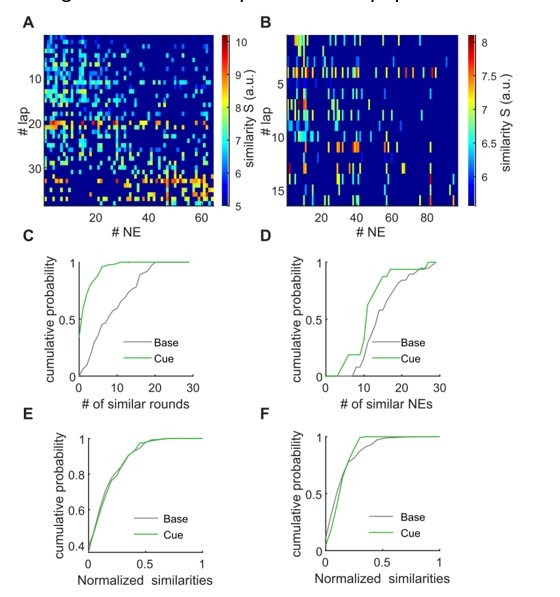
We then further characterized the participation of dentate granule cells in network events. We first asked to what extent individual network events recruit orthogonal cell populations. Indeed, while individual GCs can partake in multiple network events (see Figure 1C,D, Figure 1—video 2), we also observed network events that seemed completely distinct to others. To quantify how similar network events are to one another, we computed population vectors for each network event. We then computed the cosine similarity as a measure of similarity between vectors representing individual network events (see Materials and methods). With this measure, network event pairs recruiting the same set of neurons have a cosine similarity of 1, and completely orthogonal patterns exhibit a cosine similarity of 0. This analysis revealed that 38% of network event pairs were completely orthogonal to one another (Figure 4A, the fraction of completely orthogonal patterns corresponds to the bar with a cosine similarity of zero). Because in sparse activity patterns, orthogonality can and will arise by chance, we additionally performed a shuffling analysis to ascertain if sparse activity per se can account for the observed occurrence of orthogonal patterns. We found significantly more orthogonality than expected by chance (38 ± 4% vs. 29 ± 4% in real vs. shuffled data, respectively, see Figure 4A inset, n = 9 mice, three sessions, comparison to shuffled data: Wilcoxon test, p=0.0039). This is consistent with the capability to represent separate sets of information within network events.

Figure 4. Network events are orthogonal, but repetitively recruit GC sub-ensembles.

(A) Similarity between network events. Similarity of population vectors computed for individual network events. Comparisons were carried out between all possible pairwise combinations of vectors and quantified using cosine similarity. Inset: Mean number of orthogonal NEs for baseline sessions (Black bar) compared to shuffled data (gray bar) with SEM. Gray lines depict individual sessions. (B) Graphical representation of the correlation matrix using Pearson’s r for all cell combinations, with values for r being color coded. Data from one representative session in an individual mouse. (C) Identification of clusters of correlated cells using agglomerative hierarchical clustering. Clusters were combined using a standardized Euclidean distance metric and a weighted average linkage method, until the mean of the cluster internal r-value reached a significance threshold. The 5% significance threshold was defined by creating a null-distribution of r values from randomized data sets, and is indicated for this particular experiment with a vertical line. Right panel in C depicts the reordered correlation matrix showing clusters of highly correlated cells. Only clusters whose mean intra-correlation exceeded the threshold were included in further analysis (significant clusters indicated with gray frames). (D) Raster plot showing the reactivation of clusters identified in panel C during multiple episodes of running and immobility. Individual dots indicate participation of individual cells. Clusters are color-coded according to the agglomerative tree. Network events are indicated by vertical dashed lines. Running episodes are indicated at the lower border with the running speed (blue).

Figure 4.

Figure 4—figure supplement 1. Clustering of cells active during network events into correlated sub-ensembles via a correlation matrix.

Figure 4—figure supplement 1.

(A–H) Examples of correlation matrices after hierarchical clustering from four of the nine mice investigated. Those clusters with an intra-cluster correlation above threshold that were considered for further analysis are indicated with a gray frame. Upper row (A–D) shows baseline condition and lower row (E–H) cue-enriched condition.

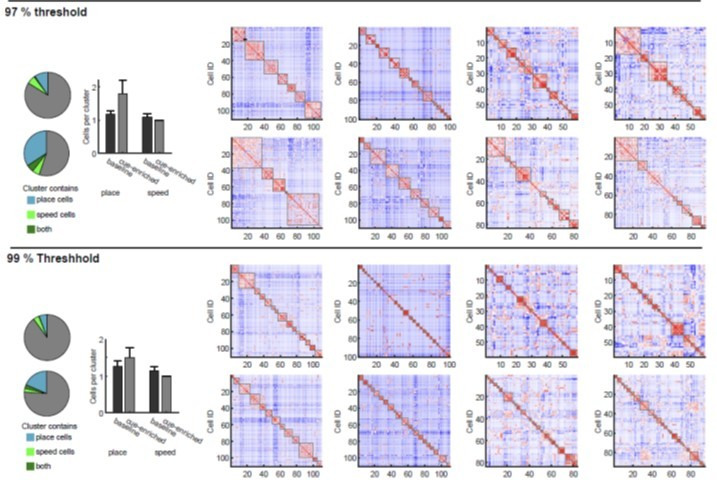
Even though orthogonal network events were observed, we also observed a repeated activation of granule cells in multiple network events (see i.e. Figure 1—video 2). To examine if specific sub-ensembles of granule cells are repeatedly recruited in network events, we performed a pairwise Pearson’s correlation of the activity of all cell pairs during all network events of a recording session (correlation coefficients depicted in the correlation matrix in Figure 4B). We then re-arranged the cells by hierarchical clustering. Clusters were combined using a standardized Euclidean distance metric and a weighted average linkage method (Figure 4C, more examples in Figure 4—figure supplement 1A–H).

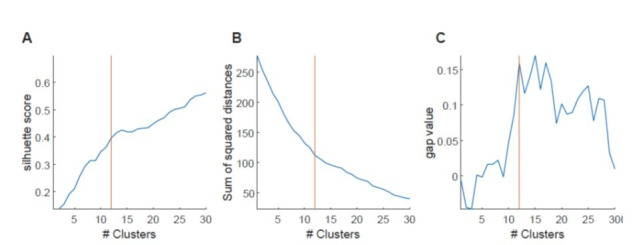
This visualization reveals the existence of subgroups of cells that are strongly correlated within network event-related activity (Figure 4C), as previously demonstrated for activity during immobility in the CA1 region (Malvache et al., 2016). To more rigorously define what we considered a cluster showing correlated activity, we used a comparison to a null distribution generated by shuffling. Such approaches have been shown to outperform other approaches to define how many clusters are present in complex data (Tibshirani et al., 2001). We combined clusters until the mean of the cluster internal r-value reached a significance threshold, which was defined by creating a null-distribution of r-values from shuffled datasets (indicated with a vertical line in Figure 4C). Thus, clusters were defined quantitatively as exhibiting a mean correlation coefficient within the cluster above chance level. Using this definition, the average cluster size was 6.7 ± 0.4 cells per cluster (n = 9 mice, three sessions). The repetitive nature of GC cluster activation during an entire session becomes clearly apparent when viewing cell activity during network events over an entire session, sorted by their participation in clusters (example shown in Figure 4D).

Participation of place- and speed-coding granule cells in network events

To ask if network events carry specific spatial or locomotion-related information, we identified GCs with position-related or speed-related activity. We first identified the group of GCs that exhibited significant place coding (2.83% of n = 1415 active cells imaged in nine mice, Figure 5A for representative polar plots of three GCs). The place fields of place-coding GCs were distributed over the linear track (Figure 5B). If the fraction of place-coding cells was calculated as a fraction of only those GCs active during running, the fraction of significantly place-coding GCs was 6.09%. Secondly, we identified a fraction of GCs (0.85% of GCs, 1.83% of running-active GCs, n = 9 mice) displaying a significant correlation of activity with running speed (Figure 5C–E). This is in contrast to a previous study (Danielson et al., 2016), but consistent with data obtained in freely moving mice (Stefanini et al., 2020). We also examined recordings from sessions using two other linear track environments with sensory cues placed on the textured belt. First, additional sensory cues were placed randomly on the belt (cue-enriched condition). Under these conditions, the fraction of place cells observed within the GC population increased (4.56% of GCs, 10.74% of running-active GCs), as did the proportion of speed cells (1.54% of GCs, 3.64% of running-active GCs, n = 1425 active GCs imaged in nine mice, Figure 5F).

Figure 5. Characterization of dentate gyrus place and speed neurons.

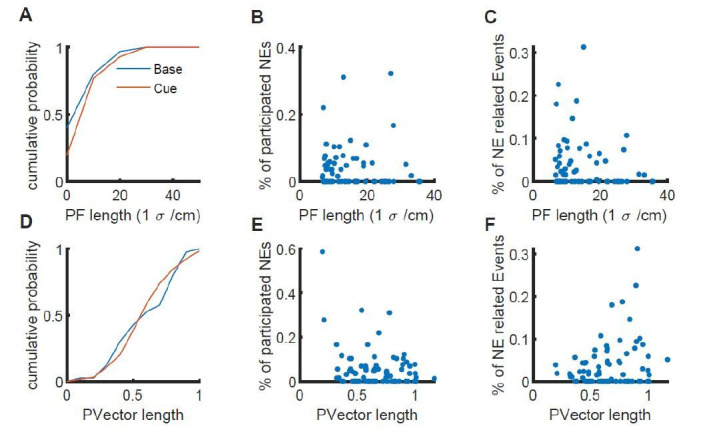
(A B) Place cells in the dentate gyrus. (A) Representative polar plots of two significantly place-coding granule cells (left, middle), and one without significant place preference (right). Place coding is depicted as spiral plot, where each 360° turn of the spiral represents a transition through the 1.5 m linear track without additional cues (baseline condition). Detected events are shown as black dots. The red line represents the place vector. The corresponding heatmap of normalized fluorescence is shown in the inset. In lower panels, the distributions for place vector lengths generated from shuffled data (see Materials and methods) are shown (gray histograms), the place vector for the individual cell is indicated by the red line. (B) Place field heatmaps of cells showing significant place preference. (C) Representative examples of three significantly speed-modulated neurons (black traces, running speed depicted in cyan). (D) Speed-modulated mean fluorescence signal of a representative example cell. Gray area indicates standard error. (E) Mean fluorescence signals of all significantly speed-modulated cells. Normalized fluorescence is color coded and running speed is normalized to every individual mouse maximum running speed. (F) Fractions of place and speed coding cells (cyan and green bar, respectively) normalized to all active cells (left panel) and only running active cells (right panel). Only a very small number of cells carried encoded both features (dark green bar).

Figure 5.

Figure 5—figure supplement 1. Activity of granule cells and MPP inputs in cue-enriched conditions.

Figure 5—figure supplement 1.

(A) Average frequencies of Ca2+ events (A) for baseline and cue-enriched conditions recorded during quiet immobility (rest, dark bars) and running (run, light bars). Data from n = 9 mice, last baseline session and cue-enriched session for panels A and B (2-way ANOVA, run vs. rest: F(1,32) = 1.71, p=0.20, baseline vs cue-enriched F(1,32) = 1.80, p=0.19). (B), Same as A for the magnitude of Ca2+ transients (2-way ANOVA, run vs. rest: F(1,32) = 1.67, p=0.21, baseline vs cue-enriched F(1,32) < 0.01, p=0.99) (C), Distribution of event frequencies for all cells for the cue-enriched condition. (D) Under cue-enriched conditions, network events also occurred mainly during immobility. Mean number of network events per recording session during running (light green) and resting (dark green). Gray bars depict shuffled data for each condition. Section sign indicates ANOVA F(3,28) = 8.6, p=0.0003, asterisk indicates Bonferroni post-test resting vs. shuffled p=0.0019. (E) Cos-similarity between network events under cue-enriched conditions. Similarity of population vectors computed for individual network events. Comparisons were carried out between all possible pairwise combinations of vectors and quantified using cosine similarity. The number of orthogonal network events were significantly higher than expected by chance (Comparison shuffled vs. real data, Wilcoxon signed rank test p=0.031). (F–J) Activity of MPP inputs in the cue-enriched condition. Data from n = 4 mice, one mouse included additionally to Figure 1F that had only jRGECO expression in MPP, but no granule cell signal for panels G-J. Shaded areas indicate standard errors. (F) Mean fluorescence averaged during resting (dark red) and running (light red, n = 4) in cue-enriched trials. ANOVA for running vs. immobile states F(1,3) = 9.64, p=0.02. (G) Variance of MPP bulk signal during resting (dark red) and running (light red, n = 4) in cue-enriched trials. ANOVA for running vs. Immobile states n.s. (H) Cross correlation of MPP bulk signal and summed GC signal during resting. Gray shaded area indicates standard error. (I) In cue-enriched conditions, MPP activity also increases at transitions from immobility to running (red line, MPP activity, blue line indicates running speed, n = 4). (J) Average MPP activity (red) and probability of granule cells being active in cue-enriched trials, both aligned to the time point of network events. Red shaded areas indicate standard error.

Second, we tested if there is a further increase in place cells with a commonly used linear track divided into zones, each with very different spatial cues (see Materials and methods, Figure 1—figure supplement 1G–J). This was not the case. In these mice (n = 3), we recorded 690 GCs, of which 2.61% were place cells. As a fraction of those GCs active during running, we found 8.11% place cells. In all conditions, few cells exhibited both speed coding and place coding.

We then examined if place or speed cells are incorporated in network events, and if this participation is altered when the environment changes. Specifically, we examined the difference between the baseline linear track without additional cues and the cue-enriched condition. We chose the cue-enriched condition for further experiments and analyses because it provided sufficient spatial cues for a strong spatial representation, without introducing edges between differently cued zones on the linear track. We found that in the cue-enriched condition, dentate gyrus network events were again observed predominantly during immobility (Figure 5—figure supplement 1D, statistics of GC activity in Figure 5—figure supplement 1A–C) and were similarly related to MPP activity (Figure 5—figure supplement 1F–J). Increasing the cue density did not significantly alter the network event frequency (Figure 5—figure supplements 1D, 2.39±0.73 vs 3.63 ± 0.90 events/minute, respectively, n = 9 mice, two-way ANOVA, baseline vs. cue enriched: F(1,30)=0.71, p=0.41, run vs. rest: F(1,3)=59.13, p=0.001). However, the average size of individual network events, measured as the number of participating GCs, was significantly larger in the cue-enriched condition compared to the baseline condition (Figure 6A, Kruskal-Wallis test, n = 9 mice, 1313 and 1493 network events in baseline and cue-enriched condition, respectively, p=4×10−41), with individual GCs contributing more frequently to network events in the cue-rich condition (Figure 6B, Kruskal-Wallis test, p=1×10−40). Fewer orthogonal networks were observed in the cue-rich condition, but this was not significantly different to the baseline condition (not shown, Kruskal-Wallis test, n.s. p=0.49).

Figure 6. Increasing sensory cues is associated with enlargement of network events and increased incorporation of place cells.

Figure 6.

(A) Network events comprise more granule cells in cue-enriched environments. Cumulative probability of network event size (number of cells per network event) for baseline and cue enriched condition (dark and light gray lines, respectively). (B) Cumulative probability of participation in multiple network events per cell for baseline and cue enriched condition (dark and light gray lines, respectively). (C) Fraction of place and speed cells that participate in network events (total number of place/speed cells equals 100%). (D) Relation of place and speed cells to correlated cell clusters (c.f. Figure 4). Fraction of the total number of clusters containing place cells (cyan), speed cells (light green), or both (dark green). Gray indicates clusters containing neither place nor speed cells. (E) Mean number of place and speed cells per cluster, in baseline and cue-enriched conditions, n = 9 mice.

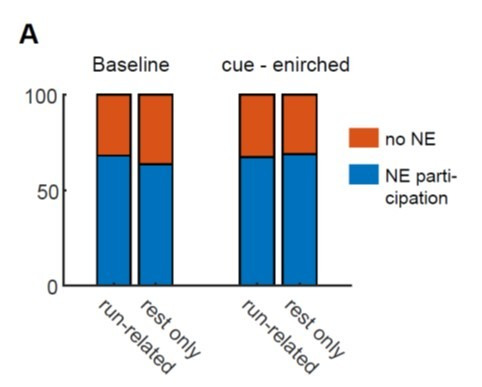
We then examined if the participation of place and speed cells in network events is altered in the cue-enriched compared to the baseline condition. As stated above, place cells are more commonly observed in cue-enriched sessions. However, when we calculated the fraction of all place cells that participated in network events, taking into account the total number of place cells under each condition, the probability of being incorporated in network events was increased significantly (Figure 6C, 55.42 vs. 88.46% of place cells in baseline vs. cue-rich conditions). This was not the case for speed cells (42.86 vs. 52.63% of speed cells in baseline vs. cue-rich conditions, n = 9 mice, chi2 test regarding changes in the incorporation of place and speed cells in network events p=3×10⁻⁴, post-test: place cells baseline vs. cue-enriched p=1×10⁻⁵, indicated with asterisk in Figure 6C, speed cells baseline vs. cue-enriched p=0.22). Thus, irrespective of the increase in the number of place cells in cue-enriched conditions, the probability of individual place cell to be integrated a network event is significantly higher. Accordingly, the proportion of synchronous events that incorporated at least one place cell increased (from 23 ± 9 to 33 ± 11%). The properties of correlated cell clusters within network events did not change (cluster size comparison, Kruskal-Wallis test, n = 9 mice, p=0.13), but significantly more of the clusters contained place cells in the cue-rich condition (Figure 6D, n = 9 mice, Chi2 test p=0.004, post-test comparison baseline vs. cue-enriched for place cells p=0.004, speed cells p=0.6), with the number of place or speed cells per cluster remaining unchanged (Figure 6E).

Thus, network events are responsive to changes in the environment, and incorporate more place-coding neurons into correlated activity patterns.

Similarity of population activity patterns during locomotion to network events during immobility

The incorporation of place and speed cells in network events, as well as the fact that changing features of the environment modifies network event size and place cell participation is consistent with the idea that animals, when immobile, represent information about the environment in synchronous, sparse network events. Testing this idea is difficult, however, given that place cells are less prevalent in the dentate gyrus compared to other hippocampal sub-regions. It has been suggested that the dentate gyrus utilizes a population code (Stefanini et al., 2020), meaning that even though only few cells can be rigorously classified as place cells, many more neurons may encode relevant but partial information about the environment. We used three different approaches to assess similarity between running and resting activity in the dentate gyrus at the population level. All these approaches are based on analyzing population coding separately during either locomotion or network events using Principal Component Analysis (PCA).

To obtain a first visual impression of population behavior during linear track locomotion, we plotted the neuronal state captured by the first three components (Figure 7B,C, Figure 7—figure supplement 1B–C for Independent Component Analysis, ICA, and Gaussian Process Factor Analysis, GPFA). We observed smooth, large trajectories with high variability reflecting movement along the linear track for some laps on the linear treadmill. Such large trajectories did not occur for every lap. We examined this unexpected phenomenon in both the baseline and cue-enriched condition (Figure 7—figure supplement 2A,B), as well as in the belt with three distinct zones (Figure 7—figure supplement 2C). In all three types of linear tracks, we found a similar, high lap-to-lap variability in the dentate gyrus population. To see how this behavior compares to the CA1 region, which is known to exhibit a reliable place code over these timeframes (Rubin et al., 2019), we examined CA1 neurons in mice running on a linear track with zones (n = 2 mice, 543 CA1 neurons, identical conditions to the zoned belt used for GC measurements). Here, PCA trajectories showed a much lower lap-to-lap variability and related smoothly to the position on the linear track (Figure 7C, Figure 7—figure supplement 1D–F, for PCA, GPFA, ICA, see Materials and methods, and Figure 7—figure supplement 2D). We have quantified this phenomenon across all laps in a session by plotting the weights of the first five components of the PCA across laps. In this depiction for CA1, as well as the three different versions of the linear track used for DG experiments, it is very clear that strong periodicity for each round is observed in CA1, but much less so in all DG experiments (Figure 7—figure supplement 2E–H).

Figure 7. Similarity of activity patterns during network events to population patterns during locomotion.

(A) Color code for position on the linear track used in panels B. (B) Trajectories during an individual representative session plotted in a three-dimensional coordinate system corresponding to the first three PCA components (Comp 1–3). (C) Trajectories calculated from CA1 Ca2+-imaging data during an individual representative session for comparison. (D) Average peak value of weight-autocorrelations at Δlap = 1 (ANOVA, F(1,3) = 88.32, p=2×10⁻³⁰, * Bonferroni post-test at p<0.05, *** Bonferroni post-test at p<0.001). (E) Schematic of the procedure for comparing population activity during network events (NE) and locomotion. Population activity is represented by three cells (upper traces), recorded during running and quiet immobility (blue trace indicates speed). Time point of three network events is indicated schematically by red lines. Activity during network events (NE) was used to perform PCA, computing the transformation matrix Vnet. Similarly, PCA was performed on the neuronal population activity only from running periods (speed indicated in blue, bordered by vertical gray dashed lines), to generate the transformation matrix Vrun representing the covarying activity during locomotion. (F) Schematic description of the procedure for projecting co-variances of running activity into the PCA basis of network events (or shuffled data). Gray dots show covarying activity of two representative cells during running. The blue graph denotes the projection into the locomotion PCA-space using Vrun and the width of the distribution shows the projected variance. The red graph shows the same information for the network space using Vnet. (G) Individual example of shuffle analysis for a representative session. The vertical red line indicates the observed projected variance explained normalized to variance explained in the original space (50% of the overall variance). The observed variance explained is larger than the shuffled distribution (blue bars), indicating that the population activity during locomotion and network events is more similar than expected by chance (i.e. for network activity without correlations). (H) Cartoon illustrating NE structure for four cells and three synchronous events. (I) Upper panel: Cartoon illustrating the first shuffling procedure where each cells time series is shifted by a randomized time interval. Lower panel: Fraction of sessions in which comparisons of population activity were significant vs. chance level for the two cue conditions and all similarity measures (n = 8 mice, one session per condition, see Figure 7—figure supplement 3 for comparisons to shuffled datasets for all sessions). (J) Upper panel: Cartoon illustrating the second shuffling procedure where cell IDs within each NE are randomly shuffled. This approach randomizes NE-composition while maintaining the number of cells per NE. Lower panel: Analogous to I. (K) Upper panel: Cartoon illustrating the third shuffling procedure where the NE participation is randomly shuffled for each cell. This approach randomizes NE-participation while maintaining the activity level for each cell. Lower panel: Analogous to I.

Figure 7.

Figure 7—figure supplement 1. Analysis of population activity in dentate gyrus and the CA1 subfield of the hippocampus using PCA, ICA, and GPFA.

Figure 7—figure supplement 1.

(A-C) Upper panels depict the first three components from representative sessions (A: PCA, B: ICA, C: GPFA) plotted in a coordinate system. The color code refers to the place on the linear track, with the same locations represented in the same color. (D–F) As in (A-C), but for CA1 neurons. Note the smooth and repetitive trajectories. Linked to Figure 7.
Figure 7—figure supplement 2. PCA-based analysis of spatial representation in DG and CA1.

Figure 7—figure supplement 2.

(A-D) Trajectories of first three components for DG example recordings in different environments (A-C for baseline, cue-enriched and zones, respectively) and CA1 data (D). The animals’ position is color coded analogous to Figure 7—figure supplement 1. (E–H) Weights of five first principal components plotted against the animal position during the first six laps of the recording. (I–L) Normalized autocorrelation of five first PCA-weights from example data calculated with respect to different laps. Place information in weights leads to peaks at integer multiples of Δlap. (M–P) Autocorrelations from five first components averaged for all animals (n = 9 animals for baseline and cue-enriched, n = 3 animals for DG zones, n = 5 animals for CA1).
Figure 7—figure supplement 3. Similarity of individual network events to population activity during running.

Figure 7—figure supplement 3.

Data from all sessions under baseline and cue-enriched conditions are depicted (as indicated on the leftmost border of the figure) for all three measures. PCA similarity using the vector projection method introduced in this paper (see Materials and methods), cosine similarity measures (Krzanowski, 1979) and EROS (Yang and Shahabi, 2004) are depicted in the leftmost, middle and rightmost columns, respectively. In all graphs, shuffled data distributions generated with shuffle method one are shown in light blue, a vertical red line indicates the observed similarity value between network and locomotion related population activity in the particular session. p-Values are indicated above each graph. In the variance projection method, values were normalized to the locomotion related variances projected into the locomotor states. As expected, this results in a high proportion of explained variance. Linked to Figure 7.

To quantify the strength of lap-periodicity (i.e. population spatial stability throughout a session) across animals, we performed an autocorrelation for all experiments in the four conditions. The autocorrelation showed large magnitude peaks at integer multiples of 1 lap for CA1, which were significantly larger than corresponding peaks for all linear track conditions in DG (examples shown in Figure 7—figure supplement 2I–L, averages across all mice and sessions Figure 7—figure supplement 2M–P, statistics Figure 7D ANOVA, F(1,3)=88.32, p=2×10⁻³⁰, * Bonferroni post-test p<0.05, *** Bonferroni post-test p<0.001).

Thus, the population behavior in DG was similar across three different types of linear track, with an episodic nature that was clearly distinct from the repetitive, stable population dynamics in CA1.

After applying PCA to locomotor states in the dentate gyrus, we then also performed a PCA analysis of population activity during network events, including the number of components explaining 50% of the variance (see Materials and methods, Figure 7E for schematic description). In order to compare the two sets of PCAs representing population activity during running states and network events, respectively, we first used a vector-based similarity measure. Briefly, we projected the traces recorded during locomotion into the PCA-space representing activity during network events, and tested how much of their variance was captured by them. In this analysis, similarity between both population measures would result in a large fraction of explained variance (Figure 7F).

To obtain the expected null distribution, we performed different types of shuffling analysis on the resting activity (see Materials and methods). In the first shuffling procedure, we shifted the entire ΔF/F time series of each cell by random time values (compare Figure 7H,I). Thus, all non-random activity timing between cells is destroyed and cells will no longer be synchronously active at NE timepoints. At the same time, individual cell event statistics will be maintained (i.e. inter-event-intervals). This method thus preserves intra-neuronal correlations and event frequencies, but destroys inter-neuronal correlations. The distributions from shuffled data were clearly distinct from the real data (red vertical line in Figure 7G, Figure 7—figure supplement 3 for comparisons to shuffled data for all sessions). The comparisons to shuffled data were significant in all sessions, both for baseline and cue-enriched conditions (Figure 7I, leftmost bars in lower panel), indicating that synchronous activity is important for the similarity between locomotor related activity and network events.

We used two further similarity measures that have been used so far to quantify similarity between PCA bases. Firstly, we used a similarity factor SPCA as described by Krzanowski, 1979 and the EROS similarity factor (Yang and Shahabi, 2004) (see Materials and methods for description), testing them against shuffled datasets in the same manner (Figure 7I, Figure 7—figure supplement 3 for comparisons to shuffled data for all sessions). With these measures, significant comparisons to shuffled data were obtained with all (cosine similarity) or a majority (EROS) of sessions (Figure 7I, n = 8 animals, last baseline session and cue-enriched session).

This shuffling approach (Figure 7I), however, does not specifically test if the composition of NEs matters for the similarity between running and NE activity. We therefore implemented two additional shuffling approaches that probe the importance of NE structure by shuffling activity within NEs. In our second shuffling approach, we tested if the composition of individual NEs is important. To this end, for each individual NE, we randomly reassigned a given cells activity to a different cell. Thus, NEs have exactly the same number of active cell’s, but the identity of cells active within them has been randomly changed, and the number of NEs that individual cells participate in will be altered (see schematic in Figure 7J, compare to panel H). This shuffling approach also revealed that NEs are significantly more similar to locomotor related activity with all three similarity measures (Figure 7J, lower panel).

If morpho-functional properties in the network simply confine activity during run and rest to very specific populations of cells that are always very active, then a different type of shuffling would be required to test if this phenomenon drives similarity. We therefore added a third shuffling method, in which for each cell, we randomly reassigned its NE activity to other NEs (see schematic in Figure 7K, cf. panel H). Thus, how many NEs a given cell participates in is maintained. At the same time, NE interactions between specific sets of cells will be altered, although highly active cells that participate in multiple NEs will still be more likely to be co-active in shuffled NEs. If the similarity were driven by such a population of always-active cells, then this shuffling would not disrupt the similarity between running and shuffled NE activity. However, also here NE activity was more similar to running activity than shuffled data for all three similarity measures (Figure 7K, lower panel).

Collectively, these data show that at the population level, NEs and locomotion-related activity are more similar than expected by chance. Moreover, the two shuffling procedures described in Figure 7J and K suggest that the cellular composition of network events matters for this similarity.

In CA1, replay of place cell sequences has been described extensively. To ascertain the robustness of our similarity measures, we have applied them to CA1 population activity, in exactly the same manner as described in Figure 7F. This approach showed significant similarities between synchronous CA1 events during immobility, and activity during locomotion in 100% of the tested sessions for all three PCA-based measures (five mice, three sessions per mouse, data not shown).

Inhibition of dentate granule cell activity during immobility disrupts pattern separation

Collectively, these data suggest that during immobility, GCs engage in structured ensemble activity that reiterates activity during running at the population level. This suggests that such activity might be important for the formation of hippocampal dependent spatial memories. The ideal test of this hypothesis would be to detect network events in freely moving animals using two-photon imaging during a memory task, and then applying closed-loop inhibition of granule cells during this task. The sparseness of granule cell activity, and the difficulties inherent in triggering closed-loop inhibition to very sparse activity patterns renders this experiment extraordinarily difficult. We therefore opted to use closed-loop inhibition of granule cells during all periods of immobility during a dentate gyrus-dependent memory task to test if dentate gyrus activity during immobility is necessary for memory formation. We used an established memory task for spatial object pattern separation (OPS, van Goethem et al., 2018), in which DG-dependent spatial discrimination is assessed based on the differential exploration of two objects. Briefly, animals are first exposed to two objects in defined locations during an acquisition trial (5 min) and are then re-exposed following an intermediate period, with one of the objects slightly displaced. Increased exploration of the displaced object indicates that the animal has encoded the initial location and is able to discriminate the displaced object. In preliminary experiments, we tested 4 degrees of object displacement along a vertical axis (3–12 cm, Figure 8—figure supplement 1C). We then determined the extent to which spatial object pattern separation was dependent on the activity of the dentate gyrus. We expressed either halorhodopsin (eNpHR, Gradinaru et al., 2008), or eYFP (control group) selectively in dentate GCs using Prox1-Cre mice, which efficiently inhibited GC firing (Figure 8—figure supplement 1F–J), and bilaterally illuminated the dentate gyrus with two implanted light fibers during the OPS task (Figure 8—figure supplement 1A,B,D). We found that GC activity was most important for an intermediate degree of displacement (9 cm), while maximal displacement was no longer dependent on GC activity (Figure 8—figure supplement 1E).

We then used this intermediate degree of displacement for the further experiments. We first inhibited GCs during locomotion only in the learning trial. As expected, inhibiting GC activity when mice actively explored the environment to be memorized led to a loss of preference for the displaced object in the subsequent recall trials (Figure 8—figure supplement 2).

We then used the intermediate degree of displacement in the OPS task to see if dentate gyrus activity during quiet immobility was equally required to establish a memory of object location. We bilaterally inhibited GCs during periods of quiet immobility (running speed <4 cm/s) only during the learning trial (Figure 8A,B). This manipulation led to a complete loss of preference for the displaced object in the subsequent recall trials (Figure 8H for representative sessions, analysis of discrimination index in I, unpaired T-test with Welch’s correction, n = 6 and 9 for eNpHR and eYFP respectively, t(12) = 5.37, p=0.0002), whereas control mice displayed a clear preference for the displaced object (Figure 8G for representative session). Similar results were obtained in a separate cohort of animals, where the difference in performance was measured in a paired experimental design (Figure 8—figure supplement 2, repeated measures ANOVA, F(1,14) = 54.58, p=0.0003. Bonferroni post-tests: no illumination vs. resting illumination, p=0.0026; no illumination vs. illumination during locomotion, p=0.0076; n = 5.).

Figure 8. Inhibition of dentate granule cell activity during immobility prevents memory acquisition.

(A) Schematic of the bilateral optogenetic inhibition of the dentate gyrus granule cells expressing eNpHR. (B) Schematic of the experimental procedure. In the acquisition phase, mice were familiarized with an arena containing two objects. Following an intermediate period of 90 min, the mice were placed in the same arena in which one object was moved slightly. (C, D) Representative sessions from acquisition trials in control (eYFP) mice and mice expressing eNpHR in granule cells showing the tracking of the mouse center of mass (dashed white lines), as well as normalized occupancy within the arena. (E) Discrimination index from the acquisition trial quantifying the specific exploration activity of the objects relative to one another (see Materials and methods), with 0 values indicating equal exploration (see Materials and methods). (F) Total time spent exploring the objects in the eYFP and eNpHR groups during the acquisition trial. (G, H) Representative sessions from recall trials depicted as shown in B, C. (I) Discrimination index for recall trials, showing strong preference for the displaced object in the eYFP group, but not the eNpHR group if granule cell activity was inhibited during acquisition trials only during immobility. (J) Total time spent exploring the objects in the eYFP and eNpHR groups during the recall trial (n = 6 animals for eNpHR group, n = 9 animals for eYFP group).

Figure 8.

Figure 8—figure supplement 1. Establishing a dentate gyrus-dependent variant of the object pattern separation task.

Figure 8—figure supplement 1.

(A) Schematic of the bilateral optogenetic inhibition of the dentate gyrus granule cells expressing eNpHR. (B) Description of the task. Following familiarization with the object location, one of the objects is moved in a subsequent recall session, and the extent to which mice explore the moved vs. stationary object is examined. These trials can be repeated allowing to explore the effects of variable movement of the objects. (C) Schematic of possible object locations for the displaced object. Displacement was randomized for each animal, such that either the left or the right object was displaced, in either a forward or back direction (LB i.e. corresponding to left, back, and RF to right, forward). The experiment used four possible new locations along a vertical axis, increasing from minor displacement (3 cm) to maximal displacement, indicated by numbers 1-4. (D) Stitched wide-field image of a hippocampal slice showing expression of NpHR-eYFP in both DGs. (E) Results of light-based inhibition of granule cells during acquisition and recall trials for different degrees of object separation indicate on the x-axis (eNpHR group, n = 4, green bars) vs. an eYFP expressing control group (n = 3, black bars). The effect of granule cell inhibition is most pronounced for intermediate degrees of object movement. (F) Representative, typical discharge behavior of a granule cell. (G) Inhibition of granule cell firing evoked with long current injections by light-based activation of NpHR (green vertical bars) with continuous stimulation. (H) Quantification of firing rates before, during and after illumination for continuous stimulation (ANOVA, F(2,5) = 28.30, p=0.001, Dunnett’s multiple comparison test, asterisks indicate 5% significance level). (I) like F with pulsed stimulation at 50% duty cycle and 20 Hz (d). (J) like G with pulsed stimulation (ANOVA, F(2,5) = 61.00, p=0.001, Dunnett’s multiple comparison test, asterisks indicate 5% significance level). (K, L) Estimation of light-induced warming within brain tissue for continuous illumination (K) or pulsed illumination at 50% duty cycle and 20 Hz (L) at intensities used for the behavioral experiments. Predicted temperature changes are plotted as a function of time and depth. (M) Analysis of warming over time, showing that the warming effects of pulsed light stimulation are asymptotic, and remain below 0.4°C at a distance of 300 µm from the fiber front end. Linked to Figure 8.
Figure 8—figure supplement 2. Inhibition of dentate granule cell activity during locomotion only in the acquisition trial impairs memory formation in the OPS task.

Figure 8—figure supplement 2.

(A) Description of the experimental protocol. In the acquisition phase, mice were familiarized with an arena containing two objects. Following an intermediate period of 90 min, the mice were placed in the same arena in which one object was moved slightly. Inhibition of granule cells was carried out not at all, during periods of quiet immobility, or during periods of locomotion in the acquisition trial in three consecutive experiments. (B) Discrimination indices for animals performing the OPS task during acquisition. Experiments were performed in three conditions. First, granule cells were not inhibited. In a second run GC activity was optogenetically inhibited during resting periods. In the third run, GC activity was inhibited exclusively during running periods (Repeated measures ANOVA, F(1,14) = 1.48, p=0.28, n = 5). (C) Animals showed comparable exploration times during the acquisition trial in all three conditions (Friedmann test, p=0.69). (D) During the recall trial animals were only able to discriminate the displaced object, when no GC inhibition had happened during the acquisition trial. No difference was found for the animals depending on whether inhibition had happened during immobility or locomotion (Repeated measures ANOVA, F(1,14) = 54.58, p=0.0003. Bonferroni post-tests: none vs. rest, p=0.0026; none vs. run, p=0.0076; rest vs. run p=0.14, n = 5). (E) Exploration times did not differ with regard to the experimental condition (Friedmann test, p=0.78).
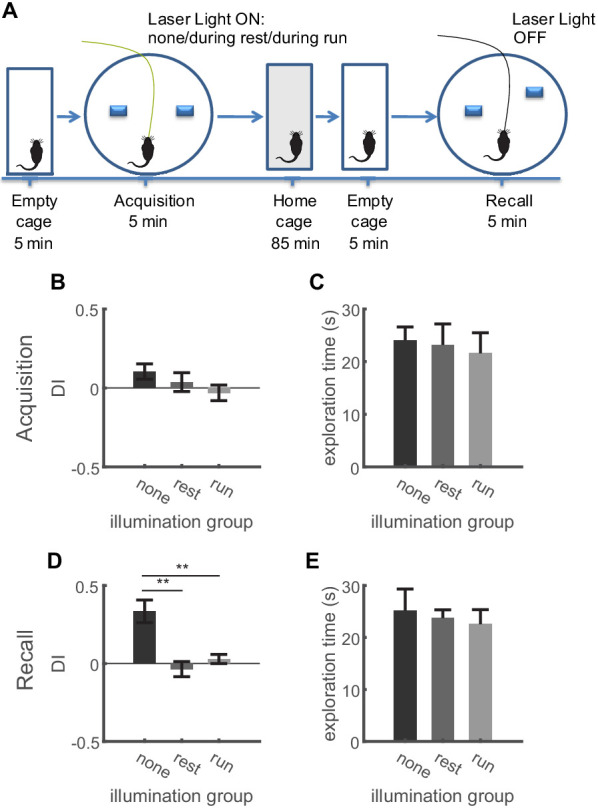
Figure 8—figure supplement 3. Inhibition of dentate granule cell activity during immobility in the acquisition trial only in non-object locations impairs memory formation in the OPS task.

Figure 8—figure supplement 3.

(A) Description of the experimental protocol. In the acquisition phase, mice were familiarized with an arena containing two objects. Following an intermediate period of 90 min, the mice were placed in the same arena in which one object was moved slightly. Inhibition of granule cells was carried out only during periods of quiet immobility in the acquisition trial, and only if the periods of immobility were not adjacent to the objects. (B, C) Representative sessions from acquisition trials in control (eYFP) mice (b, n = 10) and mice expressing eNpHR in granule cells (c, n = 4) showing the tracking data (dashed white lines), as well as occupancy within the open field as a heat map. (D) Discrimination index quantifying relative exploration times of the two objects, with 0 values indicating equal exploration (see Materials and methods). Comparison between groups n.s., t-test with Welch correction p=0.3537. (E) Total time spent exploring the objects in the eYFP and eNpHR groups during the acquisition trial. Comparison between groups n.s., t-test with Welch correction p=0.6126. (F, G) Representative sessions from recall sessions. (H) Discrimination index for recall trials, showing a significant reduction in the recognition of the displaced object in the eNpHR group. t-test with Welch correction p=0.0018. (I) Total time spent exploring the objects in the eYFP and eNpHR groups during the recall trial. Comparison between groups n.s., t-test with Welch correction p=0.4285. (J) Inhibition of dentate granule cell activity during immobility only during recall trials does not significantly impair performance in the OPS task. In the acquisition phase, mice were familiarized with an arena containing two objects. Following an intermediate period of 90 min, the mice were placed in the same arena in which one object was moved slightly. Inhibition of granule cells was carried out only during periods of quiet immobility in the recall trial. (K, L) Representative sessions from acquisition trials in control (eYFP) mice (b, n = 11) and mice expressing eNpHR in granule cells (c, n = 6) showing the tracking data (dashed white lines), as well as occupancy within the open field as a heat map. (M) Discrimination index quantifying relative exploration times of the two objects, with 0 values indicating equal exploration (see Materials and methods). Comparison between groups n.s., t-test with Welch correction p=0.8613. (N) Total time spent exploring the objects in the eYFP and eNpHR groups during the acquisition trial. Comparison between groups n.s., t-test with Welch correction p=0.6097. (O, P) Representative sessions from recall sessions. (Q) Discrimination index for recall trials, showing no significant reduction in the recognition of the displaced object in the eNpHR group. Comparison between groups n.s., t-test with Welch correction p=0.2802. (R) Total time spent exploring the objects in the eYFP and eNpHR groups during the recall trial. Comparison between groups n.s., t-test with Welch correction p=0.8236.

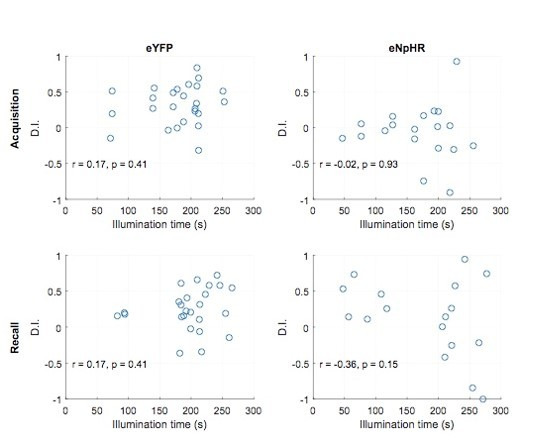
Carrying out the OPS task in mice expressing eNpHR without illumination yielded discrimination indices indistinguishable from the control group (not shown). For the three groups, ANOVA revealed a significant effect (F(2,18) = 8.52, p=0.003), with Bonferroni post-tests showing that inhibition of GCs significantly reduces performance vs. the two control groups (eYFP vs. eNpHR illuminated p=0.006, eYFP vs. eNpHR without illumination p>0.99, eNpHR with illumination vs. without illumination p=0.006).

Because mice are also immobile while examining the objects, we also performed a set of experiments in which light-stimulation was only carried out during immobility, but excluding a 4 cm zone surrounding the objects (Figure 8—figure supplement 3A). This experiment yielded similar results, with a virtually complete loss of object discrimination during the recall trial (Figure 8—figure supplement 3B–I). This effect was specific to acquisition. GC inhibition only during immobility in the recall trial (Figure 8—figure supplement 3J) elicited no significant reduction in the recognition of the displaced object (Figure 8—figure supplement 3K–L, n = 11 and 6 for eYFP and eNpHR groups, respectively, t-test with Welch correction n.s.). These data suggest that activity of GCs during rest is important to form memories that require discrimination of similar experiences.

Discussion

The dentate gyrus has been implicated in pattern separation of sensory-driven activity patterns during experience but is also active during immobility and sleep. The properties of these latter forms of activity at the cellular level and the role they play in behavior are largely unknown. The application of multiphoton in-vivo Ca2+ imaging allowed us to observe large-scale dentate gyrus dynamics at the cellular level and to detect a novel form of sparse, synchronized GC activity that occurs during immobility, termed dentate network events. These events were specifically modified by the environment, and showed higher similarity than expected by chance to population activity occurring during locomotion, indicating a sparse reiteration of locomotion-associated activity patterns.

Interestingly, network events were associated with pupil constriction and on average smaller pupil diameters when compared to entire periods of immobility, indicating that they may be associated with fluctuations in brain state during immobility, as described for visual cortex (Reimer et al., 2014). This finding is in agreement with the correlation of pupil constriction with the rate of hippocampal ripple oscillations during resting states (McGinley et al., 2015). The association of pupil constriction with synchronized activity is also very consistent with data from visual cortex, where brief episodes of pupil constriction during immobility are associated with synchronization and increased low-frequency oscillations (Reimer et al., 2014).

For neuronal activity during resting states to support learning or memory consolidation concerning a particular environment, one general requirement would be that there is reactivation of activity patterns induced by exploration of the relevant environment (Davidson et al., 2009; Diba and Buzsáki, 2007; Dupret et al., 2010; Foster and Wilson, 2006; Girardeau et al., 2009; Skaggs and McNaughton, 1996; Wilson and McNaughton, 1994). We have used three different similarity measures to show that this is the case in the dentate gyrus at the population level.

In addition to this general requirement, two specific features of resting activity are consistent with the formation of precise memories that conserve the pattern separation capabilities of the dentate gyrus. Firstly, the activity patterns, although sparse, should be capable of generating orthogonal ensembles representing different features of the environment. Secondly, the activity should repetitively recruit specific subsets of dentate GCs capable of instructing the formation of CA3 attractors via Hebbian plasticity mechanisms. Indeed, we found that activity during network events is sparse, recruiting just ~5–7% of the active GCs. Given that only ~50% of GCs are active in head-fixed animals (Danielson et al., 2016; Pilz et al., 2016), recruitment of dentate GCs during network events is much sparser than in other forms of activity occurring during immobility or sleep. For instance, the fraction of CA1 neurons recruited during sharp wave ripple mediated replay of behaviorally relevant sequences (Davidson et al., 2009; Diba and Buzsáki, 2007; Dupret et al., 2010; Foster and Wilson, 2006; Girardeau et al., 2009; Malvache et al., 2016; Skaggs and McNaughton, 1996; Wilson and McNaughton, 1994) is much higher than the recruitment of GCs in network events. One consequence of the sparseness of network events is that they are predicted to recruit highly constrained CA3 ensembles, both because of the sparse excitatory connectivity of mossy fibers in CA3, and because of the properties of the powerful inhibitory circuits in the CA3 region (Acsády et al., 1998; Neubrandt et al., 2017; Neubrandt et al., 2018). This has been suggested to be important in the capability to store information in CA3, while conserving the pattern separation benefits of the dentate gyrus (O'Reilly and McClelland, 1994; GoodSmith et al., 2019).

We found that network events are structured, with subgroups of dentate GCs forming correlated sub-ensembles that are repeatedly recruited (see Figure 4). This finding is consistent with the idea that dentate GC activity recruits plasticity mechanisms to form sparse attractor-like representations in CA3 (O'Reilly and McClelland, 1994). A similar structure was also observed for awake hippocampal reactivations in the hippocampal CA1 region, and may serve similar plasticity mechanisms in downstream targets (Malvache et al., 2016). Thus, dentate activity during immobility may be important to instruct downstream ensembles to exhibit specific memory-related sequences. That the integrity of the dentate gyrus is important in determining behaviorally relevant firing patterns in CA3 has also been demonstrated by lesion experiments showing that activity of dentate GCs is necessary for increased SWRs and prospective goal-directed firing of CA3 neurons (Sasaki et al., 2018).

One interesting feature of population activity in the dentate gyrus during locomotion became apparent from our PCA analyses. We noted that population behavior in in the dentate gyrus was very dissimilar during different laps, even though animals traversed the identical belt sections. A qualitatively similar finding has been obtained in a recent publication, showing that even after extensive training in the very same environment on successive days, different sets of dentate granule cells were activated every day (Lamothe-Molina and Franzelin, 2020, Doi: https://doi.org/10.1101/2020.08.29.273391). The population dynamics that we observed in DG were very different from CA1, which expectedly shows a very robust association with space during repetitive laps. One interpretation of this finding is that the dentate gyrus amplifies small difference between laps, and is able to represent successive laps in a different way; this itself being a potential manifestation of the pattern separation capabilities of this structure. We note that while this is conceptually compelling, these experiments do not prove that this is the case.

If network events are important in memory processes, then inhibiting dentate gyrus activity during the entire period the animal is resting should impede the formation of dentate gyrus-dependent memories. It would be desirable to inhibit only network events to test this idea, but, due to the sparseness and high synchrony of these events, a closed loop approach to achieve this is not feasible. Thus, the behavioral experiments have to be interpreted with caution, as all resting activity is being inhibited, regardless of whether they constitute network events or not. Inhibiting only granule cells during immobility to test the effect this has on a dentate-dependent memory tasks should therefore be considered a hypothesis testing experiment, but does not provide definite proof of the relevance of network events. The OPS task requires storage of the initial object location with a high degree of precision that can be utilized later on for discriminating the translocated object. We show that optogenetically inhibiting GCs, even if this was done only during immobility remote from the explored objects, disrupted the capability to acquire such memories. This supports the idea that dentate network events may rapidly and flexibly introduce information about the environment into the hippocampal network, in the time intervals interspersed between episodes of exploration. Consistent with this view of ‘real-time updating’, we observed increased incorporation of spatial information via place cell integration into network events upon the first experience of a cue-rich environment. Inhibition of the dentate gyrus during the recall phase did not significantly inhibit task performance, consistent with the idea that recall of precise location information is achieved via activation of memory-related attractors in downstream CA3 and/or CA1 regions. Indeed, behavioral analyses combined with selective lesions of dentate gyrus and CA3 have also suggested an interaction between CA3 and DG in supporting encoding but not retrieval processes in a spatial learning task (Jerman et al., 2006). Moreover, disrupting dentate spikes via electrical stimulation has been shown to disrupt acquisition of hippocampal-dependent trace eyeblink conditioning (Nokia et al., 2017).

We also performed inhibition of dentate granule cells only during locomotion in the OPS task. This inhibition also prevented the formation of spatial memories. This may simply reflect that mice are not able to store the initial object location if exploratory activity is disrupted. On the other hand, it is possible that the dentate gyrus is encoding the experience of the initial session in the OPS task as a single sequence spanning rest and running. In this case, inhibition of population at any point during the entire experience could disrupt memory formation, and would not reflect a specific role of DG activity during rest.

Two caveats have to be considered in these behavioral experiments. First, while it is very likely that network events of a similar kind occur in freely moving mice during the OPS task, we have not explicitly shown this. A second caveat when using optogenetics for behavioral experiments are the known aberrant effects of some opsins. Because the design of our experiment involves closed-loop stimulation and requires inhibition with relatively fast kinetics, we had to select a fast inhibitory opsin for these experiments, with NpHR and ArchT as the most established opsins in this category. While rebound excitation effects have been described for NpHR, and not for the most prominent alternative ArchT following illumination (Raimondo et al., 2012), ArchT has pH-dependent effects in synaptic terminals, which lead to very powerful, action potential independent excitation of Arch-expressing terminals during illumination (Mahn et al., 2016). Because this could lead to aberrant excitation of hilar neurons during illumination, ArchT was not a viable alternative in our experiments. We therefore used NpHR as the most appropriate strategy, and utilized pulsed stimulation to minimize unwanted side effects. However, we acknowledge rebound excitation effects may be a potential confounding factor.

How do network events correspond to the different types of activity that have been described in the dentate gyrus during immobility or sleep, namely dentate spikes and sharp waves (Bragin et al., 1995; Penttonen et al., 1997)? During dentate spikes, granule cells are discharged anterogradely by entorhinal input, while they are activated retrogradely by the CA3‐mossy cell feedback pathway during sharp waves (Bragin et al., 1995; Penttonen et al., 1997). We show that dentate network events are associated with MPP activation, but would be cautious in designating these events dentate spikes in the absence of parallel in-vivo electrophysiology, especially given recent descriptions of other subclasses of DG sharp waves (Meier et al., 2020).

Activity in the dentate gyrus may also be relevant for processes on more extended time scales, such as maintenance of established memories. For instance, pharmacogenetic inhibition of GCs induces loss of a hippocampal memory in trace eyeblink conditioning (Madroñal et al., 2016). Such longer time-scale coding may be mediated by processes that extend beyond local hippocampal computations. Along these lines, dentate gyrus activity during dentate spikes is associated with wide-spread increases in single-cell activity, gamma oscillations, and intraregional gamma coherence (Headley et al., 2017). It is thus possible that the precise activation patterns we observe in dentate gyrus here are part of a more distributed, organized activity occurring in immobile animals.

In summary, we described a novel form of synchronized, sparse network activity during immobility in DG that is potentially relevant to the formation of dentate gyrus-dependent spatial memories.

Materials and methods

Animals and procedures

All animal experiments were conducted in accordance with European (2010/63/EU) and federal law (TierSchG, TierSchVersV) on animal care and use and approved by the county of North-Rhine Westphalia (LANUV AZ 84–02.04.2015.A524, AZ 81–02.04.2019.A216). We used 9–12 weeks old Thy1-GCaMP6 mouse line (GP4.12Dkim/J) mice for imaging experiments, which express GCaMP6s in most hippocampal neurons (Dana et al., 2014). For optogenetic inhibition of the dentate gyrus granule cells, we used heterozygous Prox1-Cre animals (Tg(Prox1-cre)SJ39Gsat/Mmucd) obtained from MMRRC UC Davis as cryopreserved sperm and rederived in the local facility.

Virus injections and head fixation

Thy1-GCaMP6 mice were anesthetized with a combination of fentanyl/midazolam/medetomidine (0.05/5.0/0.5 mg/kg body weight i.p.) and head-fixed in a stereotactic frame. 30 min prior to induction of anesthesia, the animals were given a subcutaneous injection of ketoprofen (5 mg/kg body weight). Eyes were covered with eye-ointment (Bepanthen, Bayer) to prevent drying and body temperature was maintained at 37°C using a regulated heating plate (TCAT-2LV, Physitemp) and a rectal thermal probe. After removal of the head hair and superficial disinfection, the scalp was removed about 1 cm² around the middle of the skull. The surface was locally anesthetized with a drop of 10% lidocaine and after 3–5 min residual soft tissue was removed from the skull bones with a scraper and 3% H2O2/NaCl solution. After complete drying, the cranial sutures were clearly visible and served as orientation for the determination of the drilling and injection sites. For virus injection, a hole was carefully drilled through the skull with a dental drill, avoiding excessive heating and injury to the meninges. Any minor bleeding was stopped with a sterile pad. The target site was located as the joint of Parietal, Interparietal and Occipital skull plates. Subsequently, the tip of a precision syringe (cannula size 34 G) was navigated stereotactically through the burrhole (30° toward vertical sagittal plane, 1.5 mm depth from skull surface) to target the following coordinates: Anterioposterior [AP] measured from bregma ~4.6 mm; lateral [L] specified from midline ~3 mm; dorsoventral [DV] from surface of the skull ~4.2 mm. Virus particles (rAAV2/1-CaMKIIa-NES-jRGECO1a Dana et al., 2016) were slowly injected (total volume 250 nl, 50 nl/min) in the medial entorhinal cortex. Correct injection site in the medial entorhinal cortex was verified in all cases by confined expression of jRGECO1a in the middle molecular layer of the dentate gyrus (Figure 1A). To prevent reflux of the injected fluid, the cannula was retained for 5 min at the injection site. Optibond (Optibond 3FL; two component, 48% filled dental adhesive, bottle kit; Kerr; FL, USA) was then applied thinly to the skull to aid adhesion of dental cement. Subsequently, a flat custom-made head post ring was applied with the aid of dental cement (Tetric Evoflow), the borehole was closed and the surrounding skin adapted with tissue glue, also closing the borehole and adapting the surrounding skin with tissue glue. At the end of the surgery, anesthesia was terminated by i.p. injection of antagonists (naloxone/flumazenil/atipamezole, 1.2/0.5/2.5 mg/kg body weight). Postoperative analgesia was carried out over 3 days with 1 × daily ketoprofen (5 mg/kg body weight, s.c.).

Window implantation procedure

Cranial window surgery was performed to allow imaging from the hippocampal dentate gyrus. Thirty min before induction of anesthesia, the analgesis buprenorphine was administered for analgesia (0.05 mg/kg body weight) and dexamethasone (0.1 mg/20 g body weight) was given to inhibit inflammation. Mice were anesthetized with 3–4% isoflurane in an oxygen/air mixture (25/75%) and then placed in a stereotactic frame. Eyes were covered with eye-ointment (Bepanthen, Bayer) to prevent drying and body temperature was maintained at 37°C using a regulated heating plate (TCAT-2LV, Physitemp) and a rectal thermal probe. The further anesthesia was carried out via a mask with a reduced isoflurane dose of 1–2% at a gas flow of about 0.5 l/min. A circular craniotomy (Ø 3 mm) was opened above the right hemisphere hippocampus using a dental drill. Cortical and CA1 tissue was aspirated using a blunted 27-gauge needle until the blood vessels above the dentate gyrus became visible. A custom-made cone-shaped silicon inset (Upper diameter 3 mm, lower diameter 1.5 mm, length 2.3 mm, RTV 615, Movimentive) attached to by a cover glass (Ø 5 mm, thickness 0.17 mm) was inserted and fixed with dental cement. This special window design allowed easy implantation and maintenance and minimized the amount of aspirated tissue. Further the geometry was optimal for conserving the numerical aperture of the objective (see Figure 1—figure supplement 1D–F). Postoperative care included analgesia by administering buprenorphine twice daily (0.05 mg/kg body weight) and ketoprofen once daily (5 mg/kg body weight s.c.) on the three consecutive days after surgery. Animals were carefully monitored twice daily on the following 3 days, and recovered from surgery within 24–48 hr, showing normal activity and no signs of pain. The preparation of CA1 imaging windows followed mainly the same protocol. Here only the cortex was aspirated until the alveus fibers above CA1 became visible. The silicon inset was shorter version (length 1.5 mm) of the one used for DG experiments.

Two-photon calcium imaging

We used a commercially available two photon microscope (A1 MP, Nikon) equipped with a 25x long-working-distance, water-immersion objective (N.A. = 1, WD = 4 mm, XLPLN25XSVMP2, Olympus) controlled by NIS-Elements software (Nikon). GCaMP6s was excited at 940 nm using a Ti:Sapphire laser system (~60 fs laser pulse width; Chameleon Vision-S, Coherent) and a fiber laser system at 1070 nm (55 fs laser pulse width, Fidelity-2, Coherent) to excite jRGECO1a (see Figure 1—figure supplement 1B). Emitted photons were collected using gated GaAsP photomultipliers (H11706-40, Hamamatsu). Movies were recorded using a resonant scanning system at a frame rate of 15 Hz and duration of 20 min per movie.

Habituation and behavior on the linear track

Experiments were performed in head fixed awake mice running on a linear track. Two weeks before the measurements, mice were habituated to the head fixation. Initially mice were placed on the treadmill without fixation for 5 min at a time. Subsequently, mice were head-fixed, but immediately removed if signs of fear or anxiety were observed. These habituation sessions lasted 5 min each and were carried out three times per day, flanked by 5 min of handling. During the following 3–5 days, sessions were extended to 10 min each. The duration of sessions used for experiments was always 20 min each. After habituation, mice ran well on the treadmill for average distances between 30 and 40 m per session (see Figure 1—figure supplement 1H). The treadmill we implemented was a self-constructed linear horizontal treadmill, similar to Royer et al., 2012. Three different belt configurations were used. In the first, no spatial cues were added to the belt beyond the texture of the belt itself (baseline condition). Three 20-min sessions were carried out for each mouse on consecutive days. In the second, cue enriched condition, the belt surface was equipped with tactile cues (see Figure 1—figure supplement 1G). In the zone condition the belt was divided in three zones where each zone contained unique tactile ques. Belt position and running speed were measured by modified optical computer-mouse sensors. All stimulation and acquisition processes were controlled by custom-made software written in LabView (Source code 1).

Pupil diameter measurement and analysis

On the linear track, the pupil diameter was measured using a high-speed camera (Basler Pilot, Basler, Germany) at a framerate of 100 Hz. To estimate pupil diameter, a circular shape was fitted to the pupil using the LabView NI Vision toolbox (National Instruments), providing a real-time readout. Post-hoc, the pupil-diameter trace was normalized to its mean. As in a published study (Reimer et al., 2014), frames in which pupil diameters could not be obtained due to blinking or saccades were removed from the trace. The pupil diameter trace was filtered using a Butterworth low-pass filter at a cutoff frequency of 4 Hz. To match the time resolution of the imaging data, the pupil-trace was down-sampled to 15 Hz. Average pupil diameters were calculated for entire episodes of locomotion, entire periods of immobility, and for the single frame coincident with the peak of granule cell activity during network events.

Data analysis, two-photon imaging

All analysis on imaging data and treadmill behavior data were conducted in MATLAB using standard toolboxes, open access toolboxes and custom written code. To remove motion artifacts, recorded movies were registered using a Lucas–Kanade model (Greenberg and Kerr, 2009). Individual cell locations and fluorescence traces were identified using a constrained nonnegative matrix factorization based algorithm and afterwards Ca2+ events were identified with a constrained deconvolution algorithm (Pnevmatikakis et al., 2016). All components were manually inspected and only those that showed shape and size of a granular cell and at least one Ca2+-event amplitude three standard deviations above noise level in their extracted fluorescence trace were kept. We binarized individual cell fluorescence traces by converting the onsets of detected Ca2+ events to binary activity events. We did not observe any indication of epileptiform activity in Thy1-GCaMP6 (GP4.12Dkim/J) mice, in line with previous work (Steinmetz et al., 2017). On average 5–6% of the GC population was active during synchronized network events (Mean: 5,71%, Median: 5.03%, n = 1312 NEs, nine mice, three sessions).

Analysis of MPP input signals

MPP input bulk signal was analyzed by setting a region of interest in the molecular layer. For that, a threshold of 50% maximum fluorescence was used within the field of view on the average projection of the movie. The bulk fluorescence signal trace was calculated as the average signal of the defined region of interest in each frame. The baseline for the bulk signal was defined as the low pass filtered signal of the raw trace with a cutoff frequency of 0.01 Hz using a Butterworth filter model. We used a constrained deconvolution algorithm (Pnevmatikakis et al., 2016) to create a proxy for the underlying activity of the bulk signal. This allowed for identification of precise onset times and normalized amplitude values of Ca2+ events in MPP input data.

Network activity

To define events of synchronized activity we used binarized data that marked the onset of each significant Ca2+-event. First, we searched for events occurring simultaneously in several GCs within a moving time window of 200 ms which corresponds to 1 ± 1 frames in our recordings, where multiple events in one cell were counted as one. We then defined the distribution of synchronous events that could arise by chance in each individual session using three different shuffling approaches. Firstly, for every individual cell the event onset times were redistributed to random times, thereby conserving the mean event frequency per cell but destroying temporal correlations. This was done for every cell and repeated a thousand times to create a null-distribution of population behavior. To ascertain how robustly the data were different from the null distribution, we identified the number of synchronous events for different network event size thresholds (see Figure 1—figure supplement 3A for average values, green line real data, gray line shuffled data, see Figure 1—figure supplement 3D–I for six individual representative examples). The second shuffling approach shifted complete traces of onset times with respect to each other. This maintains within-cell correlations of firing (i.e. episodes of higher frequency firing), but reduces between-cell correlations. This is shown in Figure 1—figure supplement 3B (averages, green line real data, red line shuffled data). In the representative examples in Figure 1—figure supplement 3D–I, this shuffling approach is shown as red lines in the rightmost panels (note that the three shuffling curves are closely superimposed). The third shuffling approach considers potential differences of individual cell activity levels during locomotion and immobility. To account for this, event onset times were randomly re-distributed only within these activity states (Figure 1—figure supplement 3C for averages green line real data, purple line shuffled data, Figure 1—figure supplement 3D–I, this shuffling method shown as purple line in rightmost panels). All three shuffling methods reveal that significantly more synchrony is observed than expected by chance. We then set the minimal threshold for network events in each individual session at that number of synchronously active granule cells where less than 0.1% of events (p<0.001) could be explained by chance.

Orthogonality between pairs of network events was assessed using cosine-similarity measures. To this end, population vectors of all network events derived from binarized data were multiplied using the normalized vector-product in a pair-wise manner. To test which fraction of orthogonal pairs could be explained by chance, we generated a null distribution by randomly reassigning the cell participations to different population vectors a 1000 times. We then tested the real fraction of orthogonal pairs against the fraction derived from the shuffled data (Source code 2, Source code 3).

Spatial tuning

To assess spatial tuning of activity in sparsely coding GCs we used spatial tuning vector analysis (Danielson et al., 2016). We restricted analysis to running epochs, where a running epoch was defined as an episode of movement with a minimal duration of 2.5 s above a threshold of 4 cm/s in a forward direction. The threshold of 4 cm/s was chosen in line with both literature using head-fixed mice (i.e. Danielson et al., 2016), as well as a very extensive literature in freely moving animals (i.e. Kay et al., 2016). Only cells with four or more event onsets during running epochs were included in the analysis. We used binarized data to calculate the mean of the vectors pointing in the mouse position at the times of transient onsets, weighted by the time spent in that bin. We addressed statistical significance by creating the null distribution for every spatially tuned cell. This was achieved by randomly shuffling the onset times and recalculating the spatial tuning vector 1000 times. The p value was calculated as the percentage of vector lengths arising from the shuffled distribution that was larger than the actual vector length.

Velocity tuning

To analyze speed modulated activity of GCs, velocity values were divided in 20 evenly sized bins between 0 and the maximum velocity of the animal. We calculated the mean ΔF/F at all times the animal was running at velocities within each specific velocity bin. Putative speed cells were those granule cells that showed a Pearson’s r of at least 0.9. To further exclude the possibility that correlations arise by chance, we shifted the individual ΔF/F traces with respect to the behavior randomly in the time domain 1000 times. The cell was considered a significant speed coder if the shuffle-data r-values were below the original one in at least 95% of the cases.

Hierarchical cluster analysis

To find ensembles of correlated activity within network activity, we focused only on those granule cell Ca2+ events that occurred within network events. We calculated the correlation matrix from binarized data using Pearson’s r for all cell combinations. To identify clusters of correlated cells we used agglomerative hierarchical cluster trees. Clusters were combined using a standardized Euclidean distance metric and a weighted average linkage method. Clusters were combined until the mean of the cluster internal r-value reached a significance threshold. To define the significance threshold, we created a null-distribution of r-values from randomized data sets. Data was shuffled by randomly reassigning all network related events to different network events for every cell. This process was repeated 1000 times and the 95 percentiles of the created r-value null-distribution was used as the threshold for the clustering procedure. Only clusters in which the mean intra-cluster r-value exceeded the threshold obtained from the null distribution were considered for further analysis (see Source code 4).

Principal component analysis

To perform Principal Component Analysis (PCA) and Independent Component Analysis (ICA) we used standard MATLAB procedures and calculated the maximal number of components. Gaussian Process Factor Analysis (GPFA) was conducted using a formerly described procedure and toolbox (Yu et al., 2009), that we adapted for Ca2+-imaging data. Principals were calculated using singular value decomposition (SVD) of the data X  of size N by T, where N is the number of cells, T the number of recorded frames and the rows of X  are the z-scored F/F traces, decomposing the data-matrix as

X = VW

where V is an orthogonal matrix whose columns are the principal components, and W is a matrix of associated weights. For an analysis of population activity patterns relative to spatial location, we projected the animal position onto PCA trajectories, allowing us to identify loops in component space reflecting complete laps on the belt. Further we projected all individual component amplitudes onto the position of the mouse to detect repetitive patterns. This analysis had comparable results for PCA, as well as ICA and GPFA (Figure 7—figure supplement 1A–C for dentate gyrus, D-F for CA1).

Analysis of spatial representation using PCA weights

After performing PCA, we quantified spatial representation within our data using the weights Wrun . To that end, we projected the amplitudes of Wrun  of the five first components onto the linear space defined by the 150 cm linear track. Spatial tuning leads to a harmonic behavior of amplitudes with respect to mouse position (see Figure 7—figure supplement 2E–H) and the periodicity was quantified using the normalized autocorrelation of each weight. In the individual examples (see Figure 7—figure supplement 2I–L) as well as averaged over animals (see Figure 7—figure supplement 2M–P), peaks in the autocorrelation were observed at integer multiples of rounds, in particular in CA1. To compare the strength of spatial tuning in different DG-experimental conditions as well as CA1 data, we quantified and averaged the peak values at a delay of one round (see Figure 7D).

PCA-based comparison of population activity during running and immobility epochs

For further analysis, we restricted the number of components so that 50% of variance in each individual data set was explained. To compare running and network related epochs we calculated principal components Vrun   and  Vnet  independently from each other so that

XrunVrunWrun,Xnet VnetWnet

, where Xrun contains all the data from epochs of running and Xnet the data from 2 s windows around all network events. To calculate the similarity between these two bases, the covariance of Xrun  was projected into the principal space of the network activity

Snet×runVnetTcov(Xrun)Vnet

, where Snet×run is the matrix of projected co-variances and trace(Snet×run) quantifies the amount of projected co-variance. This number was normalized to the total amount of covariance of locomotion activity in the locomotion principal space trace(Srun×run).

To compare our results against chance level, we used three different shuffling approaches to exclude possible mechanisms for similarities that could arise by chance. In the first procedure we used the entire traces recorded during immobility, randomly shift those with respect to each other in the time domain. This approach conserved individual activity levels and intra-neuronal correlations while creating randomized inter-neuronal correlations. We applied the original network times to these time shifted traces to create a random principal direction space Vrand  and calculated the projected co-variances of Xrun  into the random-network space as trace(Srand×run). For shuffling approaches two and three, we shuffled within the matrix of concatenated NEs – in other words, only the 2 s around NEs rather than the entire time-series used in shuffle one. For the second approach, we tested if the composition of individual NEs is important. To this end, for each individual NE, we randomly reassigned activity of a given cells activity to a different cell. Thus, NEs have exactly the same number of active cells, but the identity of cells active within them has been randomly changed, and the number of NEs that individual cells participate in will be altered. In the third shuffling method, we tested whether similarity could be driven by the activity level of individual cells within NEs. Therefore, we randomly reassigned each cells’ NE activity to other NEs. This approach maintains the number of NEs a given cell participates and randomizes the interactions between specific sets of cells. All procedures were repeated 1000 times and the p-value was calculated as the percentage of random projections that exceeded the initial value.

Additionally, we used two alternative approaches to quantify similarity between the PCA bases. First a similarity factor SPCA as described by Krzanowski, 1979.

SPCA=trace(Vnet TVrun Vrun T Vnet )=i=1k cos2θi

, where θi is the angle between the ith principal directions of  Vrun  and Vnet . Further the Eros similarity factor as described in Yang and Shahabi, 2004 was used:

Eros=i=1kwi |cosθi|

where wi is a weighting factor. All measures delivered comparable results as compared to shuffled data. All different procedures of similarity calculation and shuffling available with this paper (see Source code 5).

In vitro patch-clamp experiments

Acute slices were prepared from mice expressing NpHR-eYFP in GCs. NpHR expression was induced by rAAV mediated gene transfer (rAAV2/1-DOI-eNpHR3-eYFP) into Prox1-Cre mice (see below for virus injection protocols). >2 weeks after virus injection, animals were deeply anesthetized with Isoflurane (Abbott Laboratories, Abbot Park, USA) and decapitated. The head was instantaneously submerged in ice-cold carbogen saturated artificial cerebrospinal fluid (containing in mM: NaCl, 60; sucrose, 100; KCl, 2.5; NaH2PO4, 1.25; NaHCO3, 26; CaCl2, 1; MgCl2, 5; glucose, 20) and the brain removed. Horizontal 350-µm-thick sections were cut with a vibratome (VT1200 S, Leica, Wetzlar, Germany). Slices were incubated at 35°C for 20–40 min and then stored in normal ACSF (containing in mM: NaCl, 125; KCl, 3.5; NaH2PO4, 1.25; NaHCO3, 26; CaCl2, 2.0; MgCl2, 2.0; glucose, 15) at room temperature. Recordings were performed in a submerged recording chamber at 33–35°C under constant superfusion with carbogen saturated ACSF (3 ml/min). Visually identified GCs were recorded in current clamp using a low chloride intracellular solution (containing in mM: K-gluconate, 140; 4-(2-hydroxyethyl)−1-piperazineethanesulfonic acid (HEPES-acid), 5; ethylene glycol tetraacetic acid (EGTA), 0.16; MgCl2, 0.5; sodium phosphocreatine, 5) and a Multiclamp 700B and Digidata 1322A (Molecular Devices). Illumination (~560 nm,~1 mW) was achieved through the Objective. Action potential frequencies were calculated using the smallest current injection yielding at least four action potentials.

Light fiber implantation for behavioral experiments

Mice were injected with buprenorphine (0.05 mg/kg BW) 30 min before inducing anesthesia using 3.5% isoflurane for induction and 1–1.5% for maintenance. Mice were placed in a stereotactic frame (Kopf Instruments) and the scalp opened with surgical scissors after disinfecting it with iodine solution and applying local anesthetic (10% lidocaine). The skull was thoroughly cleaned using 2% H2O2, covered with a thin layer of two-component dental adhesive (Optibond) and the surrounding wound sealed with tissue glue (Vetbond). Small craniotomies were performed above the target sites and 500 nl virus suspension (rAAV2/1-Ef1a-DOI-NLS-eYFP for controls, rAAV2/1-EF1a-DOI-eNpHR3-eYFP for experimental group) was bilaterally injected using a 34 G syringe (Nanofill Syringe, World Precision Instruments, Inc) at a speed of 50 nl/min. After each injection, the syringe was kept in place for 5 min to ensure permeation of the virus into the parenchyma. Coordinates for viral injections into dorsal dentate gyrus were: (from bregma): AP: −2.3; ML: -/+ 1.6 and DV: 2.5 mm. Afterwards, fiber optic cannulae of 200 µm diameter (NA: 0.39, CFMLC12, Thorlabs) were bilaterally implanted at (from bregma): AP: −1.7; ML: -/+ 1.35 and DV: 1.7 and fixed to the skull with a layer of flowable opaque composite (Tetric Evoflow) topped by multiple layers of dental cement (Paladur, Heraeus). Finally, antibiotic cream (Refobacin, Almirall) was applied to the wound and the animals received ketoprofen (5 mg/kg BW) s. c. Analgesia was applied post-surgery by injecting ketoprofen (5 mg/kg BW) s. c. after 24, 48, and 72 hr. All mice recovered for at least 3 weeks after surgery before the start of behavioral experiments.

Behavioral experiments

To test the effect of optogenetic inhibition of granule cells, 23 heterozygous Prox1-Cre animals (5 male, 18 female) between the age of 4 and 9 months were used. Males were single caged and females were group-caged (2–4 individuals per cage) in standard mouse cages under an inverted light-dark cycle with lights on at eight pm and ad libitum access to food and water. Prior to experiments, animals were randomly assigned to the control or experimental group. All experiments were conducted during the dark phase of the animals. Prior to experiments, mice were handled by the experimenter for at least 5 days (at least 5 min/day). On experimental days, animals were transported in their home cages from the holding facility to the experimental room and left to habituate for at least 45 min. All experiments were performed under dim light conditions of around 20 Lux. Animals were also habituated to the procedure of photostimulation by attaching a dual patch cord for around 10 min to the bilaterally implanted light fibers and letting them run in their home cage on multiple days.

For optogenetic stimulation, 561 nm laser light (OBIS/LS FP, Coherent, Santa Clara, CA) was delivered bilaterally into the implanted optical fibers using a dual patch cord (NA: 0.37, Doric lenses, Quebec, Canada) and a rotary joint (FRJ, Doric lenses, Quebec, Canada) located above the behavioral test arena. The laser power was set to 5 mW at the tip of the fiber probes.

We used a pulsed laser light at 20 Hz with a 50% duty cycle instead of continuous illumination to keep the light-induced heat effect minimal in the brain. Previous studies have shown that continuous light delivery to brain tissues can cause a temperature increase of up to 2°C (Owen et al., 2019). It has been reported that changes in temperature can alter neuronal physiology of rodents (Stujenske et al., 2015) and birds (Long and Fee, 2008). We simulated the light-induced heat effect using the model developed by Stujenske et al., 2015. We first examined the continuous light photostimulation of 561 nm light with 5 mW output power. The temperature increase reached a steady-state and was found to be 0.7°C in 60 s. For the pulsed light stimulation used in this study, the temperature change did not exceed 0.3°C in 60 s (see Figure 8—figure supplement 1K–M). Both pulsed and continuous stimulation resulted in efficient silencing of granule cell activity (Figure 8—figure supplement 1F–J). The average illumination times were not significantly different between eNpHR and eYFP control groups in any of the experiments. To apply photostimulation only during immobility, we used a closed loop system employing EthoVision 8.5 that opened an optical shutter (SH05, Thorlabs) in the light path of the laser via a TTL pulse only when the tracking software detected that the body center of the animal was moving less than 5 cm/s and closed the shutter if the speed exceeded 5 cm/s over a period of 0.5 s. Behavior was recorded using EthoVision 8.5 software (Noldus, Netherlands) and an IR camera with a frame rate of 24 Hz. Videos were stored on a computer for offline analysis. To apply photostimulation only during mobility, we reversed the parameters and let the shutter open when the speed of the animal exceeded 5 cm/s and closed the shutter at speeds of below 5 cm/s for more than 0.5 s.

Object pattern separation task

We used the object location memory test as a test for spatial learning ability. We used a circular arena (diameter: 45 cm) made of red Plexiglas with 40 cm high walls as described in van Goethem et al., 2018. Two pairs of almost identical building blocks (4 × 3×7 cm) made of either plastic or metal were used as objects. All building blocks were topped with a little plastic cone to prevent animals from climbing onto the objects. To habituate animals to the arena and the experimental procedure, they were taken out of their home cage and placed into an empty cage only with bedding for 5 min in order to increase their exploration time. After connecting the mice to the photostimulation apparatus via the light fiber, they were placed into the empty arena for 10 min with no laser light. On test days, mice were again first placed into a new empty cage for 5 min, then connected to the photostimulation apparatus and placed into the arena for 5 min. The arena contained two identical objects placed in the middle of the arena with an inter-object distance of 18 cm. The animals were allowed to freely explore the arena and the objects. After 5 min, the animals were transferred into their home cage for 85 min. For the recall trial, everything was done identically to the previous acquisition trial, but one of the two previously encountered objects was displaced. Experiments for individual displacement configuration were repeated in some cases up to three times with an interval of 2 days and the discrimination indices averaged. The following variants of this task regarding object displacement were performed using a first batch of up to 18 mice (3 males, 15 females). In a first set of experiments, variable displacements (3, 6, 9, and 12 cm) were used, with inhibition of granule cells carried out during the entire acquisition and recall trial (schematic in Figure 8—figure supplement 1A–C). In a second set of experiments a fixed, intermediate degree of displacement (9 cm, position three in Figure 8—figure supplement 1C) was used, and inhibition of granule cells was carried out only during quiet immobility using a closed-loop system (see above) in either only the acquisition trials (Figure 8) or only the recall trials (Figure 8—figure supplement 3). In a final set of experiments with those mice, we applied photostimulation in the acquisition trials only when the mouse was in quiet immobility and the nose point of the mouse at least 4 cm away from the objects (Figure 8—figure supplement 3). Lastly, with a separate batch of mice consisting of 2 males and three females, all bilaterally injected into the dentate gyrus with eNpHR-eYFP, we performed the pattern separation task with an object displacement of 9 cm either without illumination, with illumination at speeds below 5 cm/s or at speeds above 5 cm/s, both times in the acquisition trials (Figure 8—figure supplement 2). After each mouse, the arena and the objects were cleaned with 70% ethanol. An experienced observer blinded to the experimental group of the animals manually scored the time the animals explored the displaced and the non-displaced object by sniffing with the snout in very close proximity to the objects and their head oriented toward them. We calculated the discrimination index based on the following formula: (time exploring displaced object – time exploring the non-displaced object) / (time exploring displaced object + time exploring the non-displaced object). Trials in which the total exploration time in an acquisition or recall trial was lower than 4 s were excluded from further analysis. Trajectory maps and occupancy plots were generated using custom-written MATLAB Scripts.

Histology and microscopy

To verify successful viral transduction and window position, animals were deeply anesthetized with ketamine (80 mg/kg body weight) and xylazine (15 mg/kg body weight). After confirming a sufficient depth of anesthesia, mice were heart-perfused with cold phosphate buffered saline (PBS) followed by 4% formalin in PBS. Animals were decapitated and the brain removed and stored in 4% formalin in PBS solution. Fifty to 70 µm thick coronal slices of the hippocampus were cut on a vibratome (Leica). For nuclear staining, brain slices were kept for 10 min in a 1:1000 DAPI solution at room temperature. Brain slices were mounted and the red, green, and blue channel successively imaged under an epi fluorescence or spinning disc microscope (Visitron VisiScope). In optogenetic inhibition experiments, post-hoc microscopy was used to confirm successful expression of NpHR-eYFP. Of the animals used, three control animals showed no eYFP expression and one experimental animal lacked NpHR-eYFP expression. The animal lacking NpHR expression was excluded from the study. Control animals lacking eYFP expression were assumed to lack modulation of granule cell activity by illumination and were pooled with eYFP expressing control animals.

Expression of NpHR was highly selective to the dentate gyrus, as described previously (Braganza et al., 2020; Truman et al., 2012), and as reported in the Gensat project (http://www.gensat.org/ShowMMRRCStock.jsp?mmrrc_id=MMRRC:036632). Functional evidence has excluded recombination in hilar interneurons in this mouse line (Braganza et al., 2020). Crossing the Prox1-Cre mouse line used in the present study with a mouse leading to Cre-dependent expression of ChR2 showed a lack of monosynaptic inhibitory responses, as would be expected if ChR2 were also present in hilar interneurons.

Acknowledgements

We are very grateful to David Greenberg, Jason Kerr, and Damian Wallace for technical help and advice, as well as the supply of analysis algorithms. We gratefully acknowledge the support of Jonathan Ewell in editing the manuscript, and Antoine Madar for helpful comments on an earlier manuscript draft. We acknowledge the support of the Imaging Core Facility of the Bonn Technology Campus Life Sciences. The work was supported by the SFB 1089, Project C04 to HB, the Research Group FOR2715, the Research Priority Program SPP Computational Connectomics and EXC 2151 under Germanys Excellence Strategy of the Deutsche Forschungsgemeinschaft (DFG, German Research Foundation) to HB and to JHM (EXC 2064/1 PN 390727645), support of the Humboldt Foundation PSI to KG, and support of the Volkswagen Foundation to LAE. ANH was supported by the IMPRS Brain and Behavior.

Funding Statement

The funders had no role in study design, data collection and interpretation, or the decision to submit the work for publication.

Contributor Information

Heinz Beck, Email: heinz.beck@ukbonn.de.

Laura L Colgin, University of Texas at Austin, United States.

Laura L Colgin, University of Texas at Austin, United States.

Funding Information

This paper was supported by the following grants:

  • Deutsche Forschungsgemeinschaft SFB 1089 Project C04 to Heinz Beck.

  • Deutsche Forschungsgemeinschaft EXC 2064/1 PN 390727645 to Jakob H Macke, Heinz Beck.

  • Alexander von Humboldt-Stiftung PSI to Kurtulus Golcuk.

  • Volkswagen Foundation to Laura A Ewell.

  • Deutsche Forschungsgemeinschaft EXC 2151 to Heinz Beck.

  • IMPRS Brain and Behavior to André N Haubrich.

Additional information

Competing interests

No competing interests declared.

Author contributions

Conceptualization, Software, Formal analysis, Supervision, Investigation, Visualization, Methodology, Writing - original draft, Writing - review and editing.

Investigation, Methodology.

Formal analysis, Investigation.

Investigation.

Investigation.

Investigation.

Supervision, Investigation, Visualization.

Software, Methodology.

Conceptualization, Writing - original draft, Writing - review and editing.

Software, Supervision, Visualization.

Conceptualization, Resources, Supervision, Funding acquisition, Writing - original draft, Project administration, Writing - review and editing.

Ethics

Animal experimentation: All animal experiments were conducted in accordance with European (2010/63/EU) and federal law (TierSchG, TierSchVersV) on animal care and use and approved by the county of North-Rhine Westphalia (LANUV AZ 84-02.04.2015.A524, AZ 81-02.04.2019.A216).

Additional files

Source code 1. Behavior apparatus LabView program.
elife-65786-code1.zip (18.5MB, zip)
Source code 2. Network detection MATLAB code.
elife-65786-code2.zip (2.3KB, zip)
Source code 3. Network cluster structure MATLAB code.
elife-65786-code3.zip (1.8KB, zip)
Source code 4. Network shuffle analysis MATLAB code.
elife-65786-code4.zip (905B, zip)
Source code 5. PCA similarity MATLAB code.
elife-65786-code5.zip (3.3KB, zip)
Supplementary file 1. Spread Sheet containing statistical test results for present data with respective figure numbers.
elife-65786-supp1.xlsx (38.8KB, xlsx)
Transparent reporting form

Data availability

Binarized imaging traces of all cells from all experiment sessions are available on Dryad. https://doi.org/10.5061/dryad.mkkwh70z6.

The following dataset was generated:

Pofahl M. 2020. Synchronous activity patterns in the dentate gyrus during immobility. Dryad Digital Repository.

References

  1. Acsády L, Kamondi A, Sík A, Freund T, Buzsáki G. GABAergic cells are the major postsynaptic targets of mossy fibers in the rat Hippocampus. The Journal of Neuroscience. 1998;18:3386–3403. doi: 10.1523/JNEUROSCI.18-09-03386.1998. [DOI] [PMC free article] [PubMed] [Google Scholar]
  2. Berron D, Schütze H, Maass A, Cardenas-Blanco A, Kuijf HJ, Kumaran D, Düzel E. Strong evidence for pattern separation in human dentate gyrus. Journal of Neuroscience. 2016;36:7569–7579. doi: 10.1523/JNEUROSCI.0518-16.2016. [DOI] [PMC free article] [PubMed] [Google Scholar]
  3. Braganza O, Mueller-Komorowska D, Kelly T, Beck H. Quantitative properties of a feedback circuit predict frequency-dependent pattern separation. eLife. 2020;9:e53148. doi: 10.7554/eLife.53148. [DOI] [PMC free article] [PubMed] [Google Scholar]
  4. Bragin A, Jandó G, Nádasdy Z, van Landeghem M, Buzsáki G. Dentate EEG spikes and associated interneuronal population bursts in the hippocampal hilar region of the rat. Journal of Neurophysiology. 1995;73:1691–1705. doi: 10.1152/jn.1995.73.4.1691. [DOI] [PubMed] [Google Scholar]
  5. Cayco-Gajic NA, Silver RA. Re-evaluating circuit mechanisms underlying pattern separation. Neuron. 2019;101:584–602. doi: 10.1016/j.neuron.2019.01.044. [DOI] [PMC free article] [PubMed] [Google Scholar]
  6. Dana H, Chen TW, Hu A, Shields BC, Guo C, Looger LL, Kim DS, Svoboda K. Thy1-GCaMP6 transgenic mice for neuronal population imaging in vivo. PLOS ONE. 2014;9:e108697. doi: 10.1371/journal.pone.0108697. [DOI] [PMC free article] [PubMed] [Google Scholar]
  7. Dana H, Mohar B, Sun Y, Narayan S, Gordus A, Hasseman JP, Tsegaye G, Holt GT, Hu A, Walpita D, Patel R, Macklin JJ, Bargmann CI, Ahrens MB, Schreiter ER, Jayaraman V, Looger LL, Svoboda K, Kim DS. Sensitive red protein calcium indicators for imaging neural activity. eLife. 2016;5:e12727. doi: 10.7554/eLife.12727. [DOI] [PMC free article] [PubMed] [Google Scholar]
  8. Danielson NB, Kaifosh P, Zaremba JD, Lovett-Barron M, Tsai J, Denny CA, Balough EM, Goldberg AR, Drew LJ, Hen R, Losonczy A, Kheirbek MA. Distinct contribution of Adult-Born hippocampal granule cells to context encoding. Neuron. 2016;90:101–112. doi: 10.1016/j.neuron.2016.02.019. [DOI] [PMC free article] [PubMed] [Google Scholar]
  9. Davidson TJ, Kloosterman F, Wilson MA. Hippocampal replay of extended experience. Neuron. 2009;63:497–507. doi: 10.1016/j.neuron.2009.07.027. [DOI] [PMC free article] [PubMed] [Google Scholar]
  10. Diba K, Buzsáki G. Forward and reverse hippocampal place-cell sequences during ripples. Nature Neuroscience. 2007;10:1241–1242. doi: 10.1038/nn1961. [DOI] [PMC free article] [PubMed] [Google Scholar]
  11. Dupret D, O'Neill J, Pleydell-Bouverie B, Csicsvari J. The reorganization and reactivation of hippocampal maps predict spatial memory performance. Nature Neuroscience. 2010;13:995–1002. doi: 10.1038/nn.2599. [DOI] [PMC free article] [PubMed] [Google Scholar]
  12. Foster DJ, Wilson MA. Reverse replay of behavioural sequences in hippocampal place cells during the awake state. Nature. 2006;440:680–683. doi: 10.1038/nature04587. [DOI] [PubMed] [Google Scholar]
  13. Girardeau G, Benchenane K, Wiener SI, Buzsáki G, Zugaro MB. Selective suppression of hippocampal ripples impairs spatial memory. Nature Neuroscience. 2009;12:1222–1223. doi: 10.1038/nn.2384. [DOI] [PubMed] [Google Scholar]
  14. GoodSmith D, Chen X, Wang C, Kim SH, Song H, Burgalossi A, Christian KM, Knierim JJ. Spatial representations of granule cells and mossy cells of the dentate gyrus. Neuron. 2017;93:677–690. doi: 10.1016/j.neuron.2016.12.026. [DOI] [PMC free article] [PubMed] [Google Scholar]
  15. GoodSmith D, Lee H, Neunuebel JP, Song H, Knierim JJ. Dentate gyrus mossy cells share a role in pattern separation with dentate granule cells and proximal CA3 pyramidal cells. The Journal of Neuroscience. 2019;39:9570–9584. doi: 10.1523/JNEUROSCI.0940-19.2019. [DOI] [PMC free article] [PubMed] [Google Scholar]
  16. Gradinaru V, Thompson KR, Deisseroth K. eNpHR: a Natronomonas halorhodopsin enhanced for optogenetic applications. Brain Cell Biology. 2008;36:129–139. doi: 10.1007/s11068-008-9027-6. [DOI] [PMC free article] [PubMed] [Google Scholar]
  17. Greenberg DS, Kerr JN. Automated correction of fast motion artifacts for two-photon imaging of awake animals. Journal of Neuroscience Methods. 2009;176:1–15. doi: 10.1016/j.jneumeth.2008.08.020. [DOI] [PubMed] [Google Scholar]
  18. Hainmueller T, Bartos M. Parallel emergence of stable and dynamic memory engrams in the Hippocampus. Nature. 2018;558:292–296. doi: 10.1038/s41586-018-0191-2. [DOI] [PMC free article] [PubMed] [Google Scholar]
  19. Headley DB, Kanta V, Paré D. Intra- and interregional cortical interactions related to sharp-wave ripples and dentate spikes. Journal of Neurophysiology. 2017;117:556–565. doi: 10.1152/jn.00644.2016. [DOI] [PMC free article] [PubMed] [Google Scholar]
  20. Jerman T, Kesner RP, Hunsaker MR. Disconnection analysis of CA3 and DG in mediating encoding but not retrieval in a spatial maze learning task. Learning & Memory. 2006;13:458–464. doi: 10.1101/lm.246906. [DOI] [PMC free article] [PubMed] [Google Scholar]
  21. Kay K, Sosa M, Chung JE, Karlsson MP, Larkin MC, Frank LM. A hippocampal network for spatial coding during immobility and sleep. Nature. 2016;531:185–190. doi: 10.1038/nature17144. [DOI] [PMC free article] [PubMed] [Google Scholar]
  22. Krzanowski WJ. Between-Groups comparison of principal components. Journal of the American Statistical Association. 1979;74:703–707. doi: 10.1080/01621459.1979.10481674. [DOI] [Google Scholar]
  23. Lamothe-Molina PJ, Franzelin A. cFos ensembles in the dentate gyrus rapidly segregate over time and do not form a stable map of space. bioRxiv. 2020 doi: 10.1101/2020.08.29.273391. [DOI]
  24. Leutgeb JK, Leutgeb S, Moser MB, Moser EI. Pattern separation in the dentate gyrus and CA3 of the Hippocampus. Science. 2007;315:961–966. doi: 10.1126/science.1135801. [DOI] [PubMed] [Google Scholar]
  25. Long MA, Fee MS. Using temperature to analyse temporal dynamics in the songbird motor pathway. Nature. 2008;456:189–194. doi: 10.1038/nature07448. [DOI] [PMC free article] [PubMed] [Google Scholar]
  26. Madroñal N, Delgado-García JM, Fernández-Guizán A, Chatterjee J, Köhn M, Mattucci C, Jain A, Tsetsenis T, Illarionova A, Grinevich V, Gross CT, Gruart A. Rapid erasure of hippocampal memory following inhibition of dentate gyrus granule cells. Nature Communications. 2016;7:10923. doi: 10.1038/ncomms10923. [DOI] [PMC free article] [PubMed] [Google Scholar]
  27. Mahn M, Prigge M, Ron S, Levy R, Yizhar O. Biophysical constraints of optogenetic inhibition at Presynaptic terminals. Nature Neuroscience. 2016;19:554–556. doi: 10.1038/nn.4266. [DOI] [PMC free article] [PubMed] [Google Scholar]
  28. Malvache A, Reichinnek S, Villette V, Haimerl C, Cossart R. Awake hippocampal reactivations project onto orthogonal neuronal assemblies. Science. 2016;353:1280–1283. doi: 10.1126/science.aaf3319. [DOI] [PubMed] [Google Scholar]
  29. McGinley MJ, David SV, McCormick DA. Cortical membrane potential signature of optimal states for sensory signal detection. Neuron. 2015;87:179–192. doi: 10.1016/j.neuron.2015.05.038. [DOI] [PMC free article] [PubMed] [Google Scholar]
  30. Meier K, Merseburg A, Isbrandt D, Marguet SL, Morellini F. Dentate gyrus sharp waves, a local field potential correlate of learning in the dentate gyrus of mice. The Journal of Neuroscience. 2020;40:7105–7118. doi: 10.1523/JNEUROSCI.2275-19.2020. [DOI] [PMC free article] [PubMed] [Google Scholar]
  31. Neubrandt M, Oláh VJ, Brunner J, Szabadics J. Feedforward inhibition is randomly wired from individual granule cells onto CA3 pyramidal cells. Hippocampus. 2017;27:1034–1039. doi: 10.1002/hipo.22763. [DOI] [PMC free article] [PubMed] [Google Scholar]
  32. Neubrandt M, Oláh VJ, Brunner J, Marosi EL, Soltesz I, Szabadics J. Single bursts of individual granule cells functionally rearrange feedforward inhibition. The Journal of Neuroscience. 2018;38:1711–1724. doi: 10.1523/JNEUROSCI.1595-17.2018. [DOI] [PMC free article] [PubMed] [Google Scholar]
  33. Neunuebel JP, Knierim JJ. Spatial firing correlates of physiologically distinct cell types of the rat dentate gyrus. Journal of Neuroscience. 2012;32:3848–3858. doi: 10.1523/JNEUROSCI.6038-11.2012. [DOI] [PMC free article] [PubMed] [Google Scholar]
  34. Nokia MS, Gureviciene I, Waselius T, Tanila H, Penttonen M. Hippocampal electrical stimulation disrupts associative learning when targeted at Dentate spikes. The Journal of Physiology. 2017;595:4961–4971. doi: 10.1113/JP274023. [DOI] [PMC free article] [PubMed] [Google Scholar]
  35. O'Reilly RC, McClelland JL. Hippocampal conjunctive encoding, storage, and recall: avoiding a trade-off. Hippocampus. 1994;4:661–682. doi: 10.1002/hipo.450040605. [DOI] [PubMed] [Google Scholar]
  36. Owen SF, Liu MH, Kreitzer AC. Thermal constraints on in vivo optogenetic manipulations. Nature Neuroscience. 2019;22:1061–1065. doi: 10.1038/s41593-019-0422-3. [DOI] [PMC free article] [PubMed] [Google Scholar]
  37. Penttonen M, Kamondi A, Sik A, Acsády L, Buzsáki G. Feed-forward and feed-back activation of the dentate gyrus in vivo during dentate spikes and sharp wave bursts. Hippocampus. 1997;7:437–450. doi: 10.1002/(SICI)1098-1063(1997)7:4&#x0003c;437::AID-HIPO9&#x0003e;3.0.CO;2-F. [DOI] [PubMed] [Google Scholar]
  38. Pilz GA, Carta S, Stäuble A, Ayaz A, Jessberger S, Helmchen F. Functional imaging of dentate granule cells in the adult mouse Hippocampus. Journal of Neuroscience. 2016;36:7407–7414. doi: 10.1523/JNEUROSCI.3065-15.2016. [DOI] [PMC free article] [PubMed] [Google Scholar]
  39. Pnevmatikakis EA, Soudry D, Gao Y, Machado TA, Merel J, Pfau D, Reardon T, Mu Y, Lacefield C, Yang W, Ahrens M, Bruno R, Jessell TM, Peterka DS, Yuste R, Paninski L. Simultaneous denoising, Deconvolution, and demixing of calcium imaging data. Neuron. 2016;89:285–299. doi: 10.1016/j.neuron.2015.11.037. [DOI] [PMC free article] [PubMed] [Google Scholar]
  40. Raimondo JV, Kay L, Ellender TJ, Akerman CJ. Optogenetic silencing strategies differ in their effects on inhibitory synaptic transmission. Nature Neuroscience. 2012;15:1102–1104. doi: 10.1038/nn.3143. [DOI] [PMC free article] [PubMed] [Google Scholar]
  41. Reimer J, Froudarakis E, Cadwell CR, Yatsenko D, Denfield GH, Tolias AS. Pupil fluctuations track fast switching of cortical states during quiet wakefulness. Neuron. 2014;84:355–362. doi: 10.1016/j.neuron.2014.09.033. [DOI] [PMC free article] [PubMed] [Google Scholar]
  42. Reimer J, McGinley MJ, Liu Y, Rodenkirch C, Wang Q, McCormick DA, Tolias AS. Pupil fluctuations track rapid changes in adrenergic and cholinergic activity in cortex. Nature Communications. 2016;7:13289. doi: 10.1038/ncomms13289. [DOI] [PMC free article] [PubMed] [Google Scholar]
  43. Royer S, Zemelman BV, Losonczy A, Kim J, Chance F, Magee JC, Buzsáki G. Control of timing, rate and bursts of hippocampal place cells by dendritic and somatic inhibition. Nature Neuroscience. 2012;15:769–775. doi: 10.1038/nn.3077. [DOI] [PMC free article] [PubMed] [Google Scholar]
  44. Rubin A, Sheintuch L, Brande-Eilat N, Pinchasof O, Rechavi Y, Geva N, Ziv Y. Revealing neural correlates of behavior without behavioral measurements. Nature Communications. 2019;10:4745. doi: 10.1038/s41467-019-12724-2. [DOI] [PMC free article] [PubMed] [Google Scholar]
  45. Sakon JJ, Suzuki WA. A neural signature of pattern separation in the monkey Hippocampus. PNAS. 2019;116:9634–9643. doi: 10.1073/pnas.1900804116. [DOI] [PMC free article] [PubMed] [Google Scholar]
  46. Sasaki T, Piatti VC, Hwaun E, Ahmadi S, Lisman JE, Leutgeb S, Leutgeb JK. Dentate network activity is necessary for spatial working memory by supporting CA3 sharp-wave ripple generation and prospective firing of CA3 neurons. Nature Neuroscience. 2018;21:258–269. doi: 10.1038/s41593-017-0061-5. [DOI] [PMC free article] [PubMed] [Google Scholar]
  47. Senzai Y, Buzsáki G. Physiological properties and behavioral correlates of hippocampal granule cells and mossy cells. Neuron. 2017;93:691–704. doi: 10.1016/j.neuron.2016.12.011. [DOI] [PMC free article] [PubMed] [Google Scholar]
  48. Skaggs WE, McNaughton BL. Replay of neuronal firing sequences in rat Hippocampus during sleep following spatial experience. Science. 1996;271:1870–1873. doi: 10.1126/science.271.5257.1870. [DOI] [PubMed] [Google Scholar]
  49. Stefanini F, Kushnir L, Jimenez JC, Jennings JH, Woods NI, Stuber GD, Kheirbek MA, Hen R, Fusi S. A distributed neural code in the Dentate Gyrus and in CA1. Neuron. 2020;107:703–716. doi: 10.1016/j.neuron.2020.05.022. [DOI] [PMC free article] [PubMed] [Google Scholar]
  50. Steinmetz NA, Buetfering C, Lecoq J, Lee CR, Peters AJ, Jacobs EAK, Coen P, Ollerenshaw DR, Valley MT, de Vries SEJ, Garrett M, Zhuang J, Groblewski PA, Manavi S, Miles J, White C, Lee E, Griffin F, Larkin JD, Roll K, Cross S, Nguyen TV, Larsen R, Pendergraft J, Daigle T, Tasic B, Thompson CL, Waters J, Olsen S, Margolis DJ, Zeng H, Hausser M, Carandini M, Harris KD. Aberrant cortical activity in multiple GCaMP6-Expressing transgenic mouse lines. Eneuro. 2017;4:ENEURO.0207-17.2017. doi: 10.1523/ENEURO.0207-17.2017. [DOI] [PMC free article] [PubMed] [Google Scholar]
  51. Stujenske JM, Spellman T, Gordon JA. Modeling the spatiotemporal dynamics of light and heat propagation for in vivo optogenetics. Cell Reports. 2015;12:525–534. doi: 10.1016/j.celrep.2015.06.036. [DOI] [PMC free article] [PubMed] [Google Scholar]
  52. Tibshirani R, Walther G, Hastie T. Estimating the number of clusters in a data set via the gap statistic. Journal of the Royal Statistical Society: Series B. 2001;63:411–423. doi: 10.1111/1467-9868.00293. [DOI] [Google Scholar]
  53. Truman LA, Bentley KL, Smith EC, Massaro SA, Gonzalez DG, Haberman AM, Hill M, Jones D, Min W, Krause DS, Ruddle NH. ProxTom lymphatic vessel reporter mice reveal Prox1 expression in the adrenal medulla, megakaryocytes, and platelets. The American Journal of Pathology. 2012;180:1715–1725. doi: 10.1016/j.ajpath.2011.12.026. [DOI] [PMC free article] [PubMed] [Google Scholar]
  54. van Dijk MT, Fenton AA. On how the dentate gyrus contributes to memory discrimination. Neuron. 2018;98:832–845. doi: 10.1016/j.neuron.2018.04.018. [DOI] [PMC free article] [PubMed] [Google Scholar]
  55. van Goethem NP, van Hagen BTJ, Prickaerts J. Assessing spatial pattern separation in rodents using the object pattern separation task. Nature Protocols. 2018;13:1763–1792. doi: 10.1038/s41596-018-0013-x. [DOI] [PubMed] [Google Scholar]
  56. Wilson MA, McNaughton BL. Reactivation of hippocampal ensemble memories during sleep. Science. 1994;265:676–679. doi: 10.1126/science.8036517. [DOI] [PubMed] [Google Scholar]
  57. Yang K, Shahabi C. A PCA-based similarity measure for multivariate time series. Proceedings of the 2nd ACM International Workshop on Multimedia Databases (MMDB); 2004. [DOI] [Google Scholar]
  58. Yu BM, Cunningham JP, Santhanam G, Ryu SI, Shenoy KV, Sahani M. Gaussian-process factor analysis for low-dimensional single-trial analysis of neural population activity. Journal of Neurophysiology. 2009;102:614–635. doi: 10.1152/jn.90941.2008. [DOI] [PMC free article] [PubMed] [Google Scholar]

Decision letter

Editor: Laura L Colgin1
Reviewed by: Jerome Epsztein2

In the interests of transparency, eLife publishes the most substantive revision requests and the accompanying author responses.

Acceptance summary:

This study used two-photon calcium imaging of the dentate gyrus in mice and found synchronous network events in the dentate gyrus during periods of immobility that share some similarity with activity recorded during movement. The link between this network activity and memory will be interesting to explore in future studies. The paper will be of interest to neurophysiologists studying the cellular/network mechanisms of hippocampal-dependent memory formation.

Decision letter after peer review:

[Editors’ note: the authors submitted for reconsideration following the decision after peer review. What follows is the decision letter after the first round of review.]

Thank you for submitting your work entitled "Dentate gyrus population activity during immobility supports formation of precise memories" for consideration by eLife. Your article has been reviewed by a Senior Editor, a Reviewing Editor, and three reviewers. The following individual involved in review of your submission has agreed to reveal their identity: Jerome Epsztein (Reviewer #1).

Our decision has been reached after consultation between the reviewers. Based on these discussions and the individual reviews below, we regret to inform you that your work will not be considered further for publication in eLife.

During the consultation session, reviewers agreed that the major conclusions of the paper are not justified without additional experiments. In other words, reviewers felt that the paper falls short of providing convincing results to support the major conclusions. A major issue raised by all reviewers is the disconnect between the imaging results and the freely moving experiment. First, reviewers agreed that there is an important control experiment missing in the freely moving experiment (inhibit only during locomotion). Second, if this control experiment is completed, then there is still a missing link between the DG network events found during imaging to the inhibition of learning during the freely moving experiments. Other effects of DG inhibition could have produced this deficit in learning. As it stands, it is unclear whether the network events occur during the pattern separation test, and so the optogenetic inactivation experiments do not show that the network events are involved in the acquisition of the task. Yet, this is not explicitly stated in the manuscript in its current form.

Another concern raised was the high variability of population activity between different laps in the DG compared to CA1 population activity recorded in the same paradigm. It is unclear what this means in terms of spatial coding and memory in the dentate gyrus during this task. The question was also raised about how this variability could affect data analysis illustrated in Figure 4, which is meant to support an important claim of the paper that activity during synchronous events "recapitulates" activity during movement.

Reviewers agreed that the topic is interesting. We would be willing to reconsider a majorly revised manuscript in the future should you find a way and should you choose to address these major concerns. We recognize that many labs are unable to collect new data at this time due to the pandemic, but reviewers still wanted to give this option to convey their enthusiasm for the questions. However, all agreed that a soft rejection is appropriate at this point (rather than Revise and Resubmit) because it's possible that the major conclusions of the paper may change based on the outcome of control experiments necessary to support the major conclusions.

Reviewer #1:

Granule cells of the dentate gyrus are numerous and discharge very sparsely despite receiving intense synaptic inputs from the entorhinal cortex. This has led to the hypothesis that the dentate gyrus would work as a filter/classifier for entorhinal inputs allowing segregation of similar contexts representations onto distinct cell assemblies. Dentate granule cells are active both during locomotion during which their firing is spatial modulated (place cells) and during immobility periods during which they are synchronously co-activated. These co-activations coincide with the recording of large fluctuations in local field potential called dentate spikes in the dentate gyrus and sharp-waves in CA1. In this paper the authors used dual-color bi-photon in vivo calcium imaging in head fixed mice walking on a treadmill to characterize the synchronous activities recorded during immobility in the dentate gyrus and compare them with activities recorded during movement. Mice were running either on an un-cued treadmill (with textures) or a cued-treadmill (with more salient tactile sensory cues). During immobility, they observe co-activation of dentate granule cells with on average 6 cells per synchronous events. These synchronous activities are temporally correlated with increased activity of axonal fibers from the medial entorhinal cortex and correspond to the reactivation of some dentate granule cells active during periods of movement including place cells (average 1.5- 2 place cells/synchronous event) and cells that code for speed (average 1.2). A number of pairs of synchronous events are orthogonal. The authors then use PCA to compare activity during synchronous events and movement. They report a high lap-by-lap variability of dentate granule cell activity (notably compared to CA1 pyramidal cell activity) during movement and more similarity between single synchronous event activity during immobility and population activity during movement compared to a shuffled distribution. Finally, they observed that inhibiting dentate granule cell activity during immobility impairs both learning and recall of an object spatial discrimination task.

1) The behavioral task used in this article is described only briefly. According to the method section animals are not rewarded. In the absence of reward is there any sensory cues structuring the task? The first belt has textures only, but the number, spatial arrangement and type of sensory information provided by these textures are not described. If the sensory information provided by textures is reduced, this may explain why few place cells are observed when the animal navigates in this environment and possibly the high lap by lap variability of their discharge (Bourboulou et al., 2019). The number of spatially modulated cells appears to be greater at the beginnings and ends of the environment. Were there specific sensory cues at these locations? How could animal know that they completed a single lap around the belt instead of travelling an infinite environment? Was there a specific reason for choosing an impoverished environment? Even when more salient tactile cues are added (cued environment) they seemed to be randomly interspaced and provide poor spatially relevant information.

2) MPP fibers seem much more active than granule cells. Could you quantify this activity for comparison (frequency and amplitude of transients)? Although synchronous activities in the granule cell network seems to be associated with an increase in MPP fiber fluorescence, there also seems to be large increases in MPP fiber activity not associated with synchronous DG activities. Can the authors quantify the proportion of increased MPP activity associated with synchronous events?

3) Could the authors discuss the lack of causality between MPP activity and granule cells' activity during movement that seems counter-intuitive at first glance, especially in an environment impoverished in sensory cues?

4) What are the respective durations of movement and immobility periods and what is the influence of this proportion on the probability of observing synchronous events during movement?

5) To what extent do the synchronous events described in this study correspond to the co-activation of granule cells observed during the dentate spike or sharp wave ripples?

6) The authors find intriguing that the synchronous activities are associated with pupil constrictions but this is also the case for the synchronous activities associated with sharp-wave ripples (McGingley et al., 2015, Figure 1).

7) The authors state that "a large fraction of events pairs were orthogonal to each other" but what is the exact fraction and how to decipher whether it is large or not?

8) Concerning the coding of place cells, what is the proportion of place cells with small and large place fields? What is the proportion of synchronous events that incorporate at least one place cell and/or one speed cell? Were place cells with a sharp place field more likely to be reactivated? What is the total number of cells imaged in this study? If 300 cells were imaged and the place cells represent 2% of the recorded cells only 6 place cells would be recorded? however at least 40 cells are shown in Figure 3.

9) In the environment enriched with tactile cues the proportion of place cells but not speed cells increases. Does this increase alone explains the higher proportion of cells per network events or were additional non-spatially modulated cells also included? This could reflect a global increase in network excitability. In general it would be interesting to know the proportion of active and silent DGCs during movement that are active during synchronous events.

10) How do authors explain the high lap to lap variability of PCA trajectories in the dentate gyrus when compared to CA1? Is it due to the low proportion of place cells in the DG or to the use of uncued treadmill? This high variability complicates comparisons between network synchronous activity and population activity during movement. Indeed, if a network event is similar to population activity during a given lap it will be different from population activity during subsequent laps. We would like to have more precisions on the selection of movement periods and synchronous activities to perform these comparisons. Did the authors compare the activity between a period of movement and the synchronous activity on a lap by lap basis?

11) Population activity during locomotion is more similar to network events than expected by chance but this is unsurprising given that the network architecture morpho-functional properties of dentate granule cells etc… will impose constrains on observed neural dynamics. A useful comparison would be with CA1 where synchronous network events that replay place cells sequences have been thoroughly described. What is the measure of similarity between synchronous events and population activity in the CA1 region? How does the similarity index in DG compares to that in CA1?

Reviewer #2:

In this manuscript, Pofahl et al., found synchronized network events in the dentate gyrus during periods of immobility in mice. These synchronized network events occurred in largely separate groups of granule cells and were correlated with increased excitation coming from the MPP. About half of the cells participating in these synchronized events encoded the position or the speed of the mouse during mobility. Increasing the cues along the track increased the number of cells participating in each network event and increase the fraction of place cells in each network event. Using dimensionality reduction methods, the authors found that a significant amount of the variance of running activity is captured by the space represented by the network events. Separately, using optogenetics the authors inhibit the dentate gyrus of mice during the learning of a pattern separation task and show inactivating dentate gyrus during immobility (away from the objects of interest) can impair acquisition of the pattern separation task. Overall, the manuscript is well-written, and the analysis is done to a high standard. I found the synchronized events in DG, and their relation to activity patterns during locomotion, to be particularly interesting.

1) There is no strong connection between the belt (linear track) head fixed task and the object recognition freely moving task. First, in the head-fixed task the authors found synchronized events during immobility that appear orthogonal to each other, but the mice were not engaged in any pattern separation task and so there is no way to deduce the relevance of this phenomenon to pattern separation. Second, using a pattern separation task in freely moving mice, the authors showed that inactivation of granule cells in the dentate gyrus during immobility can impair pattern separation, but they did not show that the synchronized events (found during the head fixed task) occur during this pattern separation task. The most significant connection between the tasks is the occurrence of rest periods in both. It is reasonable to assume that the network events occur during the pattern separation task, but the authors have no proof for this. I strongly suggest that the authors explicitly address this issue in their manuscript and simply state that it is unclear whether the network events occur during the pattern separation test, but assuming that they do occur, then their optogenetic inactivation experiments imply that the network events are involved in the acquisition of the task.

Along these same lines, the last phrase of this statement in the Discussion does not appear correct and should be revised: "These events were specifically modified by the environment, showed higher similarity than expected by chance to population activity occurring during locomotion, and were important for formation of memories requiring pattern separation."

2) In the pattern separation task, it is unclear if ANY inhibition of DG during acquisition can impair learning/memory/preference, or if it is only inhibition during immobility. It seems to me that the following control experiment is missing: inhibit only during locomotion (the same amount of time as during their immobile inhibition experiment).

Reviewer #3:

In Pofhal et al., the authors utilize 2-photon calcium imaging of dentate granule cells and MEC input in head-fixed, awake mice to show ensembles of neurons active during immobility are important for the encoding of spatially related information. They find ensembles of neurons that fire during immobility, that these ensembles are largely orthogonal, with a small subpopulation that are shared across ensembles, that network events contain place cells and speed cells, and the ensembles of neurons incorporated into network events is greater in cue rich environments. They go on to show that inhibition of DG GCs during periods of immobility (movement less than 4cm/s) during acquisition of an object place task impairs subsequent retrieval. This paper is potentially interesting and understanding the population-level encoding properties of the DG are certainly of interest to the field. However, the manuscript, as presented, does not provide a strong case that these network events are meaningful. There is no indication what these network events represent, and if they are related to anything significant in terms of dentate physiology or behavior. In addition, I don't see how links can be made between the imaging data and the behavioral data. This and other comments below:

1) Figure 1B and 1D should show the same snippet of data in order to be convinced of the fact that these events only occur during immobility. For instance it could be that during movement you simply don't see them. Figure 1D should show all events, not only the synchronous ones, (maybe highlight which cells the algorithm has delineated into a synchronous ensemble) to justify the need to focus on the synchronous ones that happen during immobility.

2) The chance level for synchronous events is very generous, as it does not take into account differences in overall activity during network events. The authors should try shuffling to check for synchronous events using time bins of equal activity levels; rather than choosing from a random time bin, time bins should be chosen from those of similar activity level of the population. In other words one needs to control for mean population activity. This would increase confidence that the patterns of synchronous events in the real data still more frequent than chance. Alternatively, a null hypothesis could be generated by simulating a group of neurons with an underlying, varying overall network activity, and make each cell fire independently at random times given that underlying network activity. You will have some neurons that fire together just by chance. So is this chance still lower than what they observe? While the network events may still be real, these would be more rigorous tests.

3) Clustering analysis: This should be assessed with silhouette scores, not mean-r only. In addition " we focused only on those granule cell Ca2+ events that occurred within network events", why only during network events? In addition, how was the number of clusters chosen, was there any cross-validation performed?

4) If cells are tuned so much to speed (Figure 2E) and have almost 0 activity during immobility (as in the heat map), what activity are activity is being analyzed in the network event? In other words, it's a bit confusing to consider how speed cells are involved in immobility. In addition, only ~50% of place and speed cells are recruited in network activity, does it mean that they are recruited randomly, by chance?

5) In Figure 3, is the enhancement of place and speed cells, and increased network activity due to more neural activity in the enriched environment (Figure 5—figure supplement 1A)? This possibility should be excluded.

6) I found Figure 4 confusing and difficult to interpret. They say in the abstract that they "recapitulate patterns evoked in self-motion". It’s not clear to me where this is shown. Maybe I don't understand this figure, but I was expecting they would do PCA during locomotion and compare to PCA during immobility. I’m also confused by Figure 4E, what is being conveyed here? What is the variance explained in their PCAs? Do the first 3 component explain a good fraction of the variance?

7) When introducing the behavior, the authors state "Collectively, these data suggest that during immobility, GCs engage in structured ensemble activity that reiterates activity during running at the population level. This suggests that such activity might be important for the formation of hippocampal dependent spatial memories." However, the optogenetic experiment doesn't really test this, as the inhibition is impacting a multitude of things outside of these network effects. Also, the authors should plot total immobile time (i.e. total time of DG inhibition) for each mouse and compare to the discrimination index (do the mice that were more immobile, and thus got more inhibition show worse discrimination?). In addition, a more rigorous control would be inhibition during mobility to show that there is any specificity to the immobility period.

8) They state that "We did not observe any indication of epileptiform activity in Thy1-GCaMP6 (GP4.12Dkim/J) mice, as already reported," however this should be shown, specifically in the mice with the 3mm-1.5mm cone implant above dentate gyrus. It would be reassuring to the reader to show that these network events are not due to abnormal activity from the preparation.

[Editors’ note: further revisions were suggested prior to acceptance, as described below.]

Thank you for submitting your article "Dentate gyrus population activity during immobility supports formation of precise memories" for consideration by eLife. Your article has been reviewed by Laura Colgin as the Senior Editor, a Reviewing Editor, and three reviewers. The following individual involved in review of your submission has agreed to reveal their identity: Jerome Epsztein (Reviewer #1).

The reviewers have discussed the reviews with one another and the Senior Editor has drafted this decision to help you prepare a revised submission.

We would like to draw your attention to changes in our policy on revisions we have made in response to COVID-19 (https://elifesciences.org/articles/57162). Specifically, when editors judge that a submitted work as a whole belongs in eLife but that some conclusions require a modest amount of additional new data, we are asking that the manuscript be revised to limit claims to those supported by data in hand, or to explicitly state that the relevant conclusions require additional supporting data.

Our expectation is that the authors will eventually carry out the additional experiments and report on how they affect the relevant conclusions either in a preprint on bioRxiv or medRxiv, or if appropriate, as a Research Advance in eLife, either of which would be linked to the original paper.

Summary:

This study used two-photon calcium imaging of the dentate gyrus in mice and found synchronous network events in the dentate gyrus during periods of immobility that share some similarity with activity recorded during movement. The synchronized events and their relation to activity patterns during locomotion were interesting and novel. The authors also found that silencing dentate gyrus activity during immobility impaired learning in an object location discrimination task performed by freely moving mice. The authors conclude that synchronized events in the dentate gyrus during immobility are involved in memory acquisition, but this conclusion did not have strong support, as Figure 8—figure supplement 2 shows that inactivation of the dentate gyrus during locomotion also impairs learning. This suggests that any inhibition of the dentate gyrus during acquisition of the task can impair learning, and thus conclusions about the specificity of the events during resting are not supported. Still, reviewers found the paper to be interesting because of the synchronized events in dentate gyrus and their relationship to activity patterns during locomotion. Reviewers agreed that the link between this network activity and memory would be interesting to explore in future studies. The paper will be of interest to neurophysiologists studying the cellular/network mechanisms of hippocampal dependent memory formation.

Essential revisions:

1) In the first round of review, the primary concern was the link between network events during immobility and the behavior in the discrimination task. In the revised manuscript, the strong claims of the paper are still not strongly supported by the results shown, and the conclusions of the manuscript should be toned down accordingly and caveats clearly described and discussed. In the revised manuscript, the control experiment has now been provided in Figure 8—figure supplement 1, and the reviewers appreciate this. However, Figure 8—figure supplement 1 shows that inactivation of DG during locomotion in the object place discrimination task also impairs learning. This information is important since it suggests that ANY inhibition of DG during acquisition of the task can impair learning and so it is not clear if there is anything unique about the DG activity during resting for acquisition. Perhaps DG is encoding the experience as a single sequence spanning rest and running, and breaking this sequence at any point could then impact learning. This is an important caveat that should be added as a counterpoint to statements such as the following in the Abstract "Using optogenetic inhibition during immobility, we show that granule cell activity during immobility is required to form dentate gyrus-dependent spatial memories." Also, in the Discussion, the authors should include a statement such as the following "however, the same inhibition of DG during locomotion in the OPS task also prevents the formation of spatial memories, making it unclear if DG activity during rest plays a role in acquisition that is unique or different from the activity during locomotion". In general, any claims about specificity of network events during immobility to memory operations, or misleading language, should be revised and toned down. The authors should describe the data as they stand: the synchronized events during immobility may be involved in learning; however, any specificity remains unknown and untested here.

2) The huge inter-trial lap by lap variability of population activity in DG during running could be due to the lack of salient sensory cues at fixed locations in the belt or reward. In their response to the previous round of review, the authors suggest that activity in DG is structured by laps because a fixed sensory cue (a change in belt width) is present. But this information is absent from the Materials and methods section, and it is difficult to determine if animals take into account this sensory cue. Authors should find some indication either in their data and in the analysis of behavior that this is indeed the case. The high inter trial similarity of PCA trajectories in CA1 and the data showing that part of the belt is overrepresented seems to suggest that this is the case but this point should be discussed and clearly stated in the manuscript to justify the lap by lap analysis.

3) For the orthogonality of network events, authors should indicate the percentage of orthogonal network events that are likely to occur by chance to give readers an idea of the percentage of "true" orthogonal events.

4) The variability of PCA trajectories in DG should be quantified and compared to CA1. The reviewers would like to have actual numbers in the text for comparison. Also, PCA trajectories in CA1 should be illustrated in Figure 7 for comparison.

5) Reviewers would be more convinced about the specificity of the reinstated activity during synchronous network events by a comparison with random network activity during immobility but outside synchronous network events or a shuffling procedure which preserves inter-neuronal correlations such as procedure number 2 in Figure 1—figure supplement 3.

6) Reviewers recommend deciphering clusters with a different shuffling procedure maybe leading to a higher threshold because some of these clusters do not look convincing in Figure 4 and Figure 4—figure supplement 1.

Reviewer #1:

Granule cells of the dentate gyrus are numerous and discharge very sparsely despite receiving intense synaptic inputs from the entorhinal cortex. Dentate granule cells are active both during locomotion during which their firing is spatially modulated (place cells) and during immobility periods during which they are synchronously co-activated during large fluctuations in local field potential called dentate spikes in the dentate gyrus and sharp-waves in CA1. In this paper the authors used dual-color bi-photon in vivo calcium imaging in head fixed mice walking on a treadmill to characterize at the cellular level the synchronous activities recorded during immobility in the dentate gyrus and compare them with activities recorded during movement. Mice were running either on an un-cued treadmill (with textures) or a cued-treadmill (with more salient tactile sensory cues). During immobility, they observe co-activation of dentate granule during synchronous network events. These synchronous activities are temporally correlated with increased activity of axonal fibers from the medial entorhinal cortex and correspond to the reactivation of some dentate granule cells active during periods of movement including place cells and speed cells. A number of pairs of synchronous events are orthogonal but synchronous events also reactivate similar clusters of DGCs. The authors then use PCA to compare activity during synchronous events and movement. They report a high lap by lap variability of dentate granule cell population activity (notably compared to CA1 pyramidal cell activity) during movement on the belt and some similarity between synchronous event activity during immobility and population activity during movement. Finally, they observed that inhibiting dentate granule cell activity during immobility impairs performance in an object spatial discrimination task.

Synchronous activation of principal cells during awake immobility and sleep has been well described in the CA1 area of the hippocampus and linked to hippocampal dependent spatial memory formation. Much less is known for synchronous activities of dentate granule cells of the dentate gyrus during immobility. Given the sparse activity of these cells two photon calcium imaging seems an appropriate approach to address this question. The study provides interesting characterization of synchronous network activity in the dentate gyrus during immobility. Interpretation of the results is however limited by the high lap by lap heterogeneity of dentate granule cells population activity in the behavioral paradigm used. Furthermore the link between these synchronous network events and memory during an object spatial discrimination task deserves to be strengthened in future studies.

1) In the behavioral paradigm used, head-fixed animals are running on belts which can be devoid of any sensory cue or with randomly interspaced cues. Furthermore no reward is provided at a fixed location/distance on the belt. In these conditions it is unclear whether animals get a sense of the dimension of the environment and notably whether they completed single laps around the belt instead of travelling an infinite environment. This point is important because several analyses are performed lap by lap notably the characterization of dentate gyrus place cells in Figure 3 and comparisons between PCA trajectories in Figure 7.

2) Authors use a shuffle distribution to compare population activity during running periods and population activity during immobility-associated synchronous network events and observed that similarity is higher than expected by chance, but this is unsurprising given that the network architecture morpho-functional properties of dentate granule cells etc… will impose constrains on observed neural dynamics. Furthermore, the shuffle method used eliminates inter-neuronal correlations. To decipher the specificity of this similarity, a more convincing comparison would be with activity recorded during immobility but outside network events. Alternatively authors could use a shuffling method that preserves inter-neuronal correlations.

3) Trajectories in PCA space show high inter-trial variability in the dentate gyrus unlike what is observed in CA1. This could result from the lower proportion of spatially modulated cells in the dentate gyrus compared to CA1. This heterogeneity raises a question about the specificity of reinstated activity during synchronous network events.

4) Authors report preferred reactivations of identical cell clusters during synchronous network events. However, while some clusters illustrated in Figure 4C look convincing (like the red cells' cluster) others appear not very convincing (like the orange cells' one in Figure 4 C). Authors could use a more stringent shuffling procedure to strengthen cluster detection.

Reviewer #2:

In this manuscript, Pofahl et al. found synchronized network events in the dentate gyrus during periods of immobility in mice. These synchronized network events occurred in largely separate groups of granule cells and were correlated with increased excitation coming from the MPP. About half of the cells participating in these synchronized events encoded the position or the speed of the mouse during mobility. Increasing the cues along the track increased the number of cells participating in each network event and increase the fraction of place cells in each network event. Using dimensionality reduction methods, the authors found that a significant amount of the variance of running activity is captured by the space represented by the network events. Separately, using optogenetics the authors inhibit the dentate gyrus of mice during the learning of a pattern separation task and show inactivating dentate gyrus during immobility (away from the objects of interest) can impair acquisition of the pattern separation task. However, inactivation of DG during locomotion in the same task also impairs learning. This is an important caveat since it suggests that any inhibition of DG during acquisition of the task might impair learning and so it is not clear if there is anything unique about the DG activity during resting for acquisition. Overall, the manuscript is well-written, and the analysis is done to a high standard. The synchronized events in DG and their relation to activity patterns during locomotion are particularly interesting.

Reviewer #3:

The authors have nicely addressed my technical concerns in the first round of review. However, a direct link between the network events that occur during immobility and learning is not shown, nor is specificity for immobility shown, as inhibition during mobility also produces deficits in learning.

eLife. 2021 Mar 12;10:e65786. doi: 10.7554/eLife.65786.sa2

Author response


[Editors’ note: the authors resubmitted a revised version of the paper for consideration. What follows is the authors’ response to the first round of review.]

Reviewer #1:

1) The behavioral task used in this article is described only briefly. According to the method section animals are not rewarded. In the absence of reward is there any sensory cues structuring the task? The first belt has textures only, but the number, spatial arrangement and type of sensory information provided by these textures are not described. If the sensory information provided by textures is reduced, this may explain why few place cells are observed when the animal navigates in this environment and possibly the high lap by lap variability of their discharge (Bourboulou et al., 2019). The number of spatially modulated cells appears to be greater at the beginnings and ends of the environment. Were there specific sensory cues at these locations? How could animal know that they completed a single lap around the belt instead of travelling an infinite environment?

We have added a more detailed description of the linear track. In brief, the animals were indeed not rewarded, as in previous imaging studies showing structured population activity in CA1 (Malvache et al., 2016). However, even the belt devoid of explicitly placed local spatial cues was not completely without spatial information, as the cut ends of the linear track belt were connected via a tape on the underside, imposing a different flexibility of the belt. We note, however, that if the fraction of place-coding cells was calculated as a fraction of only those GCs active during running (as commonly done in other publications, see (Danielson et al., 2016)), it was higher (6.09% instead of 2.83%, Results). In the cue-enriched condition, these fractions were 4.56% of all active GCs, 10.7% of running-active GCs.

For the revised manuscript, we have now performed additional experiments with a linear track divided into zones, each with very different spatial cues, as also commonly used in many studies. In these mice (n=3), we have recorded 690 GCs, of which 2.61% were place cells. As a fraction of those GCs active during running, we found 8.11% place cells, and thus no increase in place cell fraction over the cue-enriched condition. This information has been added to the manuscript Results, Figure 1—figure supplement 1).

We realize that normalizing to the total number of detected GCs may have been confusing, as most studies normalize to the cells active during running. We have tried to be clearer about this in the revised version of the manuscript, and give both fractions in the revised manuscript initially. However, since our manuscript is strongly focused on GCs active during rest, we believe that it is important to give the fraction of place cells as a fraction of total GCs detected.

Was there a specific reason for choosing an impoverished environment? Even when more salient tactile cues are added (cued environment) they seemed to be randomly interspaced and provide poor spatially relevant information.

We agree with the reviewer that it might have been better to add tactile cues with more spatially structured differences. Our thinking originally was that we would like to have spatial information equally distributed along the belt, avoiding edges between patches of completely different tactile cues. Since mice are very good at discriminating even slight differences in the tactile structure of their environment, we thought that the random arrangement of spatial cues would still provide enough spatial information. As stated above, our fraction of place-coding cells calculated as fraction of those GCs active during running was reasonable high, and did not increase substantially when using a more commonly used variation of the linear track with a segmented belt. We would therefore argue that there is sufficient spatial information in our linear track to permit us to draw conclusions about how this spatial information is represented in the network events.

2) MPP fibers seem much more active than granule cells. Could you quantify this activity for comparison (frequency and amplitude of transients)? Although synchronous activities in the granule cell network seems to be associated with an increase in MPP fiber fluorescence, there also seems to be large increases in MPP fiber activity not associated with synchronous DG activities. Can the authors quantify the proportion of increased MPP activity associated with synchronous events?

We would like to note at the outset that we have not analyzed single MPP fibers, but have recorded bulk activity of all fibers within the medial molecular layer. This is because at the depth of imaging, we could not reliably resolve single axons. Thus, in this manuscript we are interpreting the MPP signal as a summed activity of many fibers. This makes it straightforward to look at average slower changes in MPP activity during changes in locomotion.

Indeed, as we showed in the initial submission, the average MPP activity is increased during locomotion, consistent with increased sensory input (see Figure 2C in the revised manuscript). Superimposed on this steady-state activity were larger synchronous events, which we found were particularly prominent during immobility. We had previously shown that this results in a larger variance of the bulk MPP signal during immobility (see Figure 2D in the revised manuscript).

However, it is true that there are notable peaks in the bulk MPP signal, most likely representing synchronous activity of MPP fibers. Following the reviewer’s suggestion, we now additionally use a constrained foopsi deconvolution algorithm to identify individual bulk MPP transients (see Materials and methods and [Pnevmatikakis et al., 2016]). We have then, as requested, quantified amplitude and frequency of these transients during locomotion and immobility. First, we find that bulk MPP events detected during immobility are on average larger than those detected during rest (see Figure 2G in the revised manuscript). When we plotted the frequencies of all detected MPP bulk events during locomotion and immobility, we found that there were significantly more events during running (repeated measures ANOVA, F(1,2) = 255, p = 3*10-6, n = 3 mice, 3 sessions, see Figure 2H). However, large events, defined as bulk MPP events with amplitudes above two standard deviations of the mean, were significantly more frequent during resting states (repeated measures ANOVA, F(1,2) = 27, p = 2*10-3, n = 3 mice, 3 sessions, see Figure 2I). Regarding association of MPP events with network events, there was a close temporal association between both events (see Figure 2J).

These data thus indicate that (i) MPP fibers are more active during running than during immobility, as expected, (ii) during immobility, however, large bulk MPP events indicative of synchronous activity are more common and (iii) NEs are closely associated temporally with MPP events. As this has expanded the MPP dataset, we have condensed all data on MPP activity and GC-MPP coactivity into one figure, presented as Figure 2 in the revised manuscript.

The reviewer is right in noting that the number of detected bulk MPP events is larger than the number of NEs that we see. However, this to some extent is expected, as we are recording from a large fraction of the MEC axons in the particular hippocampal segment we are imaging, which also target GCs outside our field of view. Additionally, we are recording only from a small fraction of GCs compared to the total fraction of GCs. Thus, we are also recording synchronous MEC activity that is perhaps correlated with active GC ensembles outside (or not completely inside) our imaging field of view.

3) Could the authors discuss the lack of causality between MPP activity and granule cells' activity during movement that seems counter-intuitive at first glance, especially in an environment impoverished in sensory cues?

We are happy to discuss this. We do not believe that our results suggest that there is no relationship between MPP activity and granule cell activity during movement – rather the activity structure and the techniques that we are using are not ideal for finding such a relationship during movement. The state dependent differences we observe in the bulk signal are not only a read out for the amount of input but also for the synchrony of the imaged fiber bundle. The increase of bulk-fluorescence during locomotion reflects an overall higher asynchronous MPP-input (Figure 2B, C). This is supported by our deconvolution analysis that found significantly more small amplitude events during locomotion compared to immobility (Figure 2G, H), Overall dense asynchronous activity makes it difficult to identify direct correlations between input and output (i.e. it would only be expected that a selection of peaks drives any given active GC), especially when activity levels of input and output differ. However, during immobility we observe a sparser but more synchronous input signal. This is reflected by distinct fluorescence peaks (Figure 2A), a higher overall variance (Figure 2C) and more detected high amplitude events (Figure 2I). The significant cross-correlation analysis reveals that the synchronous input events are correlated to the network events that we observed in GC ensemble. This said, we also think that a very tight correlation between MPP activity and GC activity might not be expected across all states because of the strong feed-forward inhibition at the MPP– to DG synapse (Ewell and Jones, 2010). We have tried to make this clearer in the revised manuscript (Results).

4) What are the respective durations of movement and immobility periods and what is the influence of this proportion on the probability of observing synchronous events during movement?

This point is well taken. We now additionally report total durations of movement periods for the different linear tracks in Figure 1—figure supplement 1 of the revised manuscript.

In addition, we now present the frequencies of NEs during locomotion and immobility, using equal times for locomotion and immobility periods. NE frequencies were significantly higher during immobility (repeated measures ANOVA, F(1,8)=117, p=2*10-6, n=9 mice, 3 sessions). These analyses were added to the Results section of the revised manuscript.

5) To what extent do the synchronous events described in this study correspond to the co-activation of granule cells observed during the dentate spike or sharp wave ripples?

We had addressed this in the Discussion section of our initial submission. In the absence of co-implanted electrodes, we cannot finally address this issue. However, we had discussed that during dentate spikes, granule cells are discharged anterogradely by entorhinal input, while they are activated retrogradely by the CA3‐mossy cell feedback pathway during sharp waves (Bragin et al., 1995; Penttonen et al., 1997). We do show that dentate network events are associated with MPP activation, however, we would be cautious in designating these events dentate spikes in the absence of parallel in-vivo electrophysiology. We have explicitly stated this in the Discussion.

6) The authors find intriguing that the synchronous activities are associated with pupil constrictions but this is also the case for the synchronous activities associated with sharp-wave ripples (McGingley et al., 2015, Figure 1).

We are very grateful for this comment. We had missed this interesting paper, and have now referenced it in our manuscript (discussion). We feel that it strengthens the general point that increased synchrony in both hippocampal and neocortex is associated with pupil constriction, well in line with our findings.

7) The authors state that "a large fraction of events pairs were orthogonal to each other" but what is the exact fraction and how to decipher whether it is large or not?

We had compared network events using cosine similarity as a measure of similarity between vectors representing individual network events. In this measure, identical patterns have a cosine similarity of 1, and completely orthogonal patterns would exhibit a cosine similarity of 0. Thus, the data we had shown in Figure 1G (Figure 4A of the revised manuscript. Specifically, the bar with a cos similarity of zero) shows that 36% of network events are orthogonal to one another. We now explicitly refer to this in the manuscript to make this clear (Results).

Because in sparse activity patterns, orthogonality can and will arise by chance, we had additionally performed a shuffling analysis to ascertain if sparse activity per se can account for the fraction of orthogonal patterns. We found significantly more orthogonality than expected by chance (n=9 mice, 3 sessions, comparison to shuffled data Wilcoxon test, p=0.0039). We presume that the reviewer is referring to the fact that the number of completely orthogonal patterns that we report does not consider that a certain number of orthogonal events would occur at a certain chance level. We agree that this makes it difficult to state that the orthogonality is “large” and now simply state that it is larger than expected by chance.

8) Concerning the coding of place cells, what is the proportion of place cells with small and large place fields?

We realized following this reviewer comment that we had designated our examples of place coding neurons shown in Figure 2 as “narrow” and “broad”. It was not our intent to state that these are two categories of place cells, but simply to illustrate that place coding is not uniform even within the place cell population. We apologize for being misleading and have corrected this.

Nonetheless, we have calculated the size of place fields according to a Gaussian fit of the average discharge frequency over space. We also quantified the precision of place coding using the vector lengths described in the original Figure 2 (now Figure 5), with longer vector lengths corresponding to a more precise place representation. In both analyses, place field sizes/vector lengths showed a unimodal distribution and no indication of discriminable subgroups of place cells with small and large place fields (see Author response image 1A, D, for Gaussian size estimate and place vector lengths respectively). Moreover, we found that there was no difference in the distribution of place field sizes when comparing baseline and cue-enriched conditions (see Author response image 1A, D).

Author response image 1. Relation of place field length/vector length to the participation of place cells in network events.

Author response image 1.

A, place field size determined by a Gaussian fit for the baseline (blue) and cue-rich condition (red). B, Plot of the place field length versus the fraction of network events in which this particular place cell participates for each cell. C, Plot of the place field length versus the fraction of calcium events associated with a network event. D-F, Same as A-C, but with the place vector length measure.

We are happy to include this in the publication if the reviewer thinks it helpful, but we feel that since we cannot subdivide the place cells into clearly distinct subpopulations, this does not add much to our main conclusions.

What is the proportion of synchronous events that incorporate at least one place cell and/or one speed cell?

We have calculated this and it is on average 23±9 and 33±11% of the synchronous events that incorporate at least one place cell under baseline and cue-enriched conditions, respectively (n=9 mice). 3±2 and 7±3% of events incorporate at least one speed cell (n=9 mice). Currently we do not report these values in the manuscript, but are happy to do so if the reviewer wishes.

Were place cells with a sharp place field more likely to be reactivated?

This is an interesting question. If place cells with more precise tuning are more likely to be reactivated, then the place field length calculated as above should be inversely related to either the fraction of network events the cell participates in, or to the fraction of calcium events occurring within network events. Similarly, there should be a correlation of the place vector length with these parameters. However, neither the place field size nor the vector length were predictive of network event participation. Place field size or vector length were not correlated with the fraction of network events in which the place cell participated (Author response image 1B, E, respectively), or with the fraction of Ca2+ events in the place cell occurring within a network event (Author response image 1C, F, respectively). Again, we have submitted this as Author response image 1 only, because we did not find place cells to fall into two distinct groups, and because there was no correlation with network event participation, but we are happy to include it in the paper if the reviewer thinks it helpful.

What is the total number of cells imaged in this study? If 300 cells were imaged and the place cells represent 2% of the recorded cells only 6 place cells would be recorded? however at least 40 cells are shown in Figure 3.

We are sorry that we did not supply the total number of GCs imaged. We imaged 1415 GCs in the baseline condition, and 1425 GCs in the cue-enriched condition. In additional experiments with a segmented linear track, we imaged 690 GCs. Specifically, we should note that these numbers refer only to GCs that were active during the recording sessions and thus were detected by the non-negative matrix factorization, not to those GCs that were never active. We have added these numbers to the Results section.

9) In the environment enriched with tactile cues the proportion of place cells but not speed cells increases. Does this increase alone explains the higher proportion of cells per network events or were additional non-spatially modulated cells also included?

The reviewer is right in stating that the place cells are found more frequently in cue-enriched sessions. However, this did not explain the increase in place cell incorporation into network events. When we calculated the fraction of all place cells that participated in network events (with the total number of place cells under each condition set as 100%), we saw a strong and significant increase from 55.42 to 88.46 % of place cells participating (baseline vs. cue-rich conditions, see Figure 3C). Thus, irrespective of the increase in the number of place cells in cue-enriched conditions, the probability of a place cell to appear in a network event is significantly higher. We have tried to make this clearer in the revised manuscript (Results).

This could reflect a global increase in network excitability. In general it would be interesting to know the proportion of active and silent DGCs during movement that are active during synchronous events.

The reviewer is right, and we have looked at this. We have separated the GCs recorded into two groups. The first group contains the GCs that are active during running and rest (run-related), and the second group contains the GCs that were not active during running but only during immobility (rest only in Author response image 2). We found that both in the baseline and cue-enriched condition, the fraction of network event participating cells (blue, NE participation) was not different. Thus, it does not seem as if we can deduce a general difference in excitability between these two populations that affects network event participation. We have not included this in the manuscript, but are happy to do so if the reviewer wishes.

Author response image 2. Network event participation of two groups of GCs separated according to their locomotion-related behavior.

Author response image 2.

A, Run-related: GCs that are active during both running and rest, Rest only: GCs that were not active during running but only during immobility. Fraction of network event participating cells in blue, fraction of cells not participating in orange.

10) How do authors explain the high lap to lap variability of PCA trajectories in the dentate gyrus when compared to CA1? Is it due to the low proportion of place cells in the DG or to the use of uncued treadmill?

Firstly, as stated above, we would like to note that our proportion of place cells is not extraordinarily low when normalized to those cells active during locomotion, as commonly done in other publications. Secondly, as described above, we have now added data from mice running on a more commonly used segmented linear track, which also does not have more place cells than our cue-enriched condition.

In all three types of linear tracks, we found a similar, high lap to lap variability also in the segmented linear track, apparent in the PCA trajectories (Figure 7—figure supplement 2A-C). In contrast, CA1 neurons measured under the very same conditions showed a much lower variability (Figure 7—figure supplement 2D). This behavior thus not only occurred in the non-cued belt, but was a very consistent phenomenon across three different types of linear track in DG. In all cases, the behavior was clearly distinct from CA1. We have quantified this phenomenon across all laps in a session by plotting the first 10 components of the PCA across laps for all conditions. In this depiction for CA1, as well as the three different versions of the linear track used for DG experiments, it is clear that strong periodicity for each round is observed in CA1, but much less so in all DG experiments (Figure 7—figure supplement 2E-H). To quantify this phenomenon across animals, we have performed an autocorrelation for all experiments in the four conditions (examples shown in Figure 7—figure supplement 2I-L, averages in Figure 7—figure supplement 2M-P). This also clearly illustrates the phenomenon. If we quantified the autocorrelogram peaks at δ of one lap (corresponding to the first order peak of the autocorrelogram), the difference between CA1 and DG was also clearly apparent (Figure 7—figure supplement 2Q).

These results show that the differences between CA1 and DG are robust, and are unlikely to be a consequence of the features of the linear track. We believe that this difference is a potentially interesting phenomenon in itself. One interpretation of this finding would be that the dentate gyrus is able to represent slightly different, successive rounds in a different way, this itself being a potential manifestation of the pattern separation capabilities of this structure. We cannot prove that this is the case (one of the reasons why we did not focus on this in the prior version of the manuscript), but are now briefly and conservatively discussing these data. We note that a related finding has been obtained for more extended timescales of days recently in a Biorxiv paper published by the group of Thomas Oertner, where they show that even after extensive training in the very same environment on successive days, different sets of dentate granule cells were activated every day (Lamothe-Molina et al., 2020). Albeit at a different time scale, this suggests that the dentate gyrus may discriminate between the same environment presented at different times.

We indeed think that a high variability of place coding between laps is strongly correlated with the probability of detecting place coding cells using a comparison against shuffled data. We would think that the more variable coding is at the population and single cell level across laps, the more unlikely it will be for cells to pass criterion as a place cell.

This high variability complicates comparisons between network synchronous activity and population activity during movement. Indeed, if a network event is similar to population activity during a given lap it will be different from population activity during subsequent laps. We would like to have more precisions on the selection of movement periods and synchronous activities to perform these comparisons. Did the authors compare the activity between a period of movement and the synchronous activity on a lap by lap basis?

The second, related request of the reviewer was to compare the locomotion related activity during individual laps with the synchronous activity of individual NEs. Indeed, the PCA results presented above would suggest that individual network events can be similar to population activity during individual laps, as the reviewer states. We performed such analyses, first calculating PCAs for locomotion related activity for each lap on the linear track on the one hand, and for the network events on the other hand. We then tested which of these individual, lapwise comparisons are significant compared to shuffled datasets (as done for the bulk comparisons initially presented). Examples of these comparisons are shown in the heatmaps in Author response image 3A, B. These analyses have revealed that the activity during individual laps is similar to activity during network events, and these similarities have an episodic character, as expected.

Author response image 3. Lapwise similarity of population activity during locomotion with individual network events.

Author response image 3.

A, B, The matrix shows similarity values for the PCA-based comparison between population activity during all network events (x-axis), and during all individual laps. Nonsignificant comparisons are dark blue. A: Baseline example, B: cue-enriched example. C, D, Quantification of the amount of similarity. Panel C shows for individual network events to how many lapwise activity patterns the similarity is higher than chance. Panel D shows for individual lapwise activities to how many network events it is similar. Plots in C, D correspond to data shown in A, B. E, F, as in C, D, but x-axis normalized and averaged (n = 9 mice, 1 session per condition).

We then quantified for each network event to how many lapwise activity patterns the similarity is higher than chance and vice versa (i.e. for each lapwise activity to how many network events it is similar, Author response image 3C, D, respectively). Even though, as seen in Author response image 3C, D, in individual examples there might be some differences between baseline and cue-enriched conditions, this proved not to be the case in averaged data (Author response image 3E, F).

We are of course willing to include this in the manuscript, but felt that this does not add too much to the main conclusions of the paper. We think that – as stated above – this finding is interesting in itself, implying that individual network events may replay population patterns during individual laps. However, without a behavioral protocol that enables us to say that mice have successfully perceived the identity of an individual lap, or a certain number of laps (as i.e. in a protocol that requires mice to count the number of laps it has run), we cannot really prove this. We have therefore included these data as Author response image 3 only, but again, are very willing to include these panels in the paper if the reviewer thinks it makes sense.

11) Population activity during locomotion is more similar to network events than expected by chance but this is unsurprising given that the network architecture morpho-functional properties of dentate granule cells etc… will impose constrains on observed neural dynamics. A useful comparison would be with CA1 where synchronous network events that replay place cells sequences have been thoroughly described. What is the measure of similarity between synchronous events and population activity in the CA1 region? How does the similarity index in DG compares to that in CA1?

We have done the same comparison as we have done for DG for CA1. We have found that the three PCA-based measures we show for the DG comparisons, also show significant similarities between network events and activity during locomotion in CA1. These data have been included in the manuscript (Discussion).

Reviewer #2:

In this manuscript, Pofahl et al., found synchronized network events in the dentate gyrus during periods of immobility in mice. These synchronized network events occurred in largely separate groups of granule cells and were correlated with increased excitation coming from the MPP. About half of the cells participating in these synchronized events encoded the position or the speed of the mouse during mobility. Increasing the cues along the track increased the number of cells participating in each network event and increase the fraction of place cells in each network event. Using dimensionality reduction methods, the authors found that a significant amount of the variance of running activity is captured by the space represented by the network events. Separately, using optogenetics the authors inhibit the dentate gyrus of mice during the learning of a pattern separation task and show inactivating dentate gyrus during immobility (away from the objects of interest) can impair acquisition of the pattern separation task. Overall, the manuscript is well-written, and the analysis is done to a high standard. I found the synchronized events in DG, and their relation to activity patterns during locomotion, to be particularly interesting.

1) There is no strong connection between the belt (linear track) head fixed task and the object recognition freely moving task. First, in the head-fixed task the authors found synchronized events during immobility that appear orthogonal to each other, but the mice were not engaged in any pattern separation task and so there is no way to deduce the relevance of this phenomenon to pattern separation. Second, using a pattern separation task in freely moving mice, the authors showed that inactivation of granule cells in the dentate gyrus during immobility can impair pattern separation, but they did not show that the synchronized events (found during the head fixed task) occur during this pattern separation task. The most significant connection between the tasks is the occurrence of rest periods in both. It is reasonable to assume that the network events occur during the pattern separation task, but the authors have no proof for this. I strongly suggest that the authors explicitly address this issue in their manuscript and simply state that it is unclear whether the network events occur during the pattern separation test, but assuming that they do occur, then their optogenetic inactivation experiments imply that the network events are involved in the acquisition of the task.

Along these same lines, the last phrase of this statement in the Discussion does not appear correct and should be revised: "These events were specifically modified by the environment, showed higher similarity than expected by chance to population activity occurring during locomotion, and were important for formation of memories requiring pattern separation."

The reviewer is correct. It was our aim to test the hypothesis that resting activity might be important for memory formation in a freely moving behavior. We should have stated this clearly. We have revised the presentation of this issue as suggested by the reviewer. We explicitly state that we have not recorded in-vivo in freely moving animals and therefore do not know if network events are present. We also state explicitly that we – because it is impossible to detect sparse network events in freely moving mice to do closed loop stimulation only during network events – are inhibiting network events, but also additional activity of GCs during immobility.

2) In the pattern separation task, it is unclear if ANY inhibition of DG during acquisition can impair learning/memory/preference, or if it is only inhibition during immobility. It seems to me that the following control experiment is missing: inhibit only during locomotion (the same amount of time as during their immobile inhibition experiment).

This is a valid experiment. We agree that it is reasonable to assume that dentate granule cell activity during locomotion, i.e. when the mouse is actively sampling information in the environment, plays an important role in building a memory of this environment. This is why we did not add this control experiment in the first place. We acknowledge that this was an omission. Thus, we followed the reviewer suggestion and repeated the experiments with a new batch of mice expressing eNpHR bilaterally in the dentate gyrus. We tested their performance in the OPS task in trials with inhibition during the entire running period (speed > 5 cm/s). As expected, this also led to a complete loss of preference for the displaced object in the recall trial, indicating that granule cell activity during locomotion is equally important. We have added these data to the manuscript as Figure 8—figure supplement 2.

Reviewer #3:

In Pofhal et al., the authors utilize 2-photon calcium imaging of dentate granule cells and MEC input in head-fixed, awake mice to show ensembles of neurons active during immobility are important for the encoding of spatially related information. They find ensembles of neurons that fire during immobility, that these ensembles are largely orthogonal, with a small subpopulation that are shared across ensembles, that network events contain place cells and speed cells, and the ensembles of neurons incorporated into network events is greater in cue rich environments. They go on to show that inhibition of DG GCs during periods of immobility (movement less than 4cm/s) during acquisition of an object place task impairs subsequent retrieval. This paper is potentially interesting and understanding the population-level encoding properties of the DG are certainly of interest to the field. However, the manuscript, as presented, does not provide a strong case that these network events are meaningful. There is no indication what these network events represent, and if they are related to anything significant in terms of dentate physiology or behavior. In addition, I don't see how links can be made between the imaging data and the behavioral data. This and other comments below:

1) Figure 1B and 1D should show the same snippet of data in order to be convinced of the fact that these events only occur during immobility. For instance it could be that during movement you simply don't see them.

Figure 1B is designed to give the reader a closer look at representative Ca2+ traces at a little higher magnification. This means that we are showing only a short section of data, and a random set of cells (i.e. only very few of the ~500 GCs). Showing network events in the figure format of Figure 1B would mean that we have to cherry pick participating GCs. We are willing to do this, but think that panels such as in Figure 1D that depict all GCs are more useful. To make the reviewer more confident that these events occur during immobility, we now show in Figure 1—figure supplement 3E-J six examples of different sessions and mice, equivalent to those in Figure 1D. Note that in these examples, running speeds are clearly indicated at the bottom to indicate when animals are running and when they are immobile. Amongst these, we also show the session depicted in Figure 1B as an example (corresponding to Figure 1—figure supplement 3J). These examples illustrate that by far most network events occur during immobility.

We are afraid we do not understand the comment stating that we simply might not see network events during movement. We had rigid quantitative criteria for detection of network events, applied to both resting and running episodes, which result in the clear finding that network events mainly occur during immobility. We have extended the manuscript, now including an additional two types of shuffling analysis (see Figure 1—figure supplement 3B-J, and comments to point 2 of this reviewer).

Figure 1D should show all events, not only the synchronous ones, (maybe highlight which cells the algorithm has delineated into a synchronous ensemble) to justify the need to focus on the synchronous ones that happen during immobility.

We have done as requested, and have included the non-network-event activity as gray datapoints in Figure 1D, as well as in Figure 1—figure supplement 3E-J. The network events are color-coded, as in the previous version of the manuscript.

2) The chance level for synchronous events is very generous, as it does not take into account differences in overall activity during network events. The authors should try shuffling to check for synchronous events using time bins of equal activity levels; rather than choosing from a random time bin, time bins should be chosen from those of similar activity level of the population. In other words one needs to control for mean population activity. This would increase confidence that the patterns of synchronous events in the real data still more frequent than chance. Alternatively, a null hypothesis could be generated by simulating a group of neurons with an underlying, varying overall network activity, and make each cell fire independently at random times given that underlying network activity. You will have some neurons that fire together just by chance. So is this chance still lower than what they observe? While the network events may still be real, these would be more rigorous tests.

The purpose of the study was to identify synchronous activity patterns (defined as cells being coactive within a 200 ms window). This corresponds with our imaging study to 1±1 frames. During such very short time windows, finding synchronously active GCs by chance would very rare in the absence of coordinated network , due to the extreme overall sparseness of firing in the dentate gyrus. In fact, network events themselves, if they occur, constitute a substantial fraction of the cells active at that particular time bin, and one could even define a network event as a transient, coordinated increase in firing rate across multiple neurons. Thus, taking either surrogate activity with activity levels identical to those during network events themselves, or shuffling simply using time bins with equal activity to network events would necessarily lead to false non-detection of network events.

We agree with the reviewer, however, that the shuffling analysis should take into account the general level of activity in the population during behavioral episodes, this point is well taken. We had originally included both episodes of locomotion and immobility in the shuffling analysis, thus controlling for levels of population activity across both behavioral states. However, the reviewer is right in that there could be a difference in average activity levels between locomotion and immobility (as suggested by Figure 1—figure supplement 2C, even if the difference was not significant). We therefore repeated the shuffling analysis but shuffled event times for locomotion and immobility periods separately (Figure 1—figure supplement 3C). This shuffling approach also robustly detected network events (Figure 1—figure supplement 3C, examples in Figure 1—figure supplement 3E-J, shuffled data in right panels depicted in red, real data in green).

We furthermore shuffled the data by randomly shuffling the event times for every individual cell (as presented in the previous version of the manuscript). This conserves the firing frequencies of individual cells, but disrupts any temporal correlations. We understand this to satisfy the reviewers request that we make ‘each cell fire independently at random times given that underlying network activity’. These data are depicted in Figure 1E, as well as in Figure 1—figure supplement 3B, with the six individual examples in Figure 1—figure supplement 3E-J (shuffled data in right panels depicted in gray, real data in green, note that shuffled data curves are superimposed and not easily visible).

Finally, we present a third shuffling approach where traces were randomly shifted with respect to each other. This maintains within-cell correlations of firing (i.e. episodes of higher frequency firing), but reduces between-cell correlations. This is shown in Figure 1—figure supplement 3C (averages, green line real data, red line shuffled data). In the representative examples in Figure 1—figure supplement 3E-J, this shuffling approach is shown as red lines in the rightmost panels.

Thus, three different shuffling approaches clearly show detection of network effects that are significantly more common than expected by chance. We would consider this to provide a high level of evidence that network events do not arise by chance.

3) Clustering analysis: This should be assessed with silhouette scores, not mean-r only. In addition " we focused only on those granule cell Ca2+ events that occurred within network events", why only during network events? In addition, how was the number of clusters chosen, was there any cross-validation performed?

Determining the optimal number of clusters in a data set is a fundamental issue, for which at present there are no definitive solutions. In general, the methods though can be subdivided into (i) direct methods, which optimize some criterion, such as the within cluster sum of squares or silhouette score, or (ii) statistical testing methods which compare the data against a null hypothesis, such methods for instance include gap statistics.

We have – after much thought – used a method related to the second class of statistical testing methods. As stated in the supplementary data, we first generated Pearson’s r for all cell combinations in a particular imaging session. We then identified clusters of correlated cells using agglomerative hierarchical cluster trees. Clusters were combined using a standardized Euclidean distance metric and a weighted average linkage method. Clusters were combined until the mean of the cluster internal r-value reached a significance threshold. Importantly, the significance threshold was defined by creating a null-distribution of r-values from shuffled data sets. We had shown this in Supplementary Figure 4C and D, of the original manuscript (now Figure 4B, C) where the r-threshold is indicated for that particular example. Thus, the number of clusters was defined based on a specific r value generated from shuffled data from the same session (we hope this answers the last question in this section). We consider this type of analysis a very objective approach, because it allowed us to obtain a precise number of significant clusters at a particular, defined chance level. Moreover, it is a way to base the number of clusters on a statistic relative to a null distribution.

The reviewer has asked for alternative ways of analyzing clustering. We had indeed considered different types of analysis for these data, and have performed K-means and hierarchical clustering, assessing this both with silhouette scores and with within cluster sum of squares measures. When using such methods, indeed we see that in many sessions, increased clustering results in systematic changes in silhouette scores (or cluster sum of squares, see Author response image 4). Currently commonly used methods such as the elbow method considers the total cluster sum of squares as a function of the number of clusters, and then selects an ‘optimal’ number of clusters so that adding another cluster does not lead to a large improvement in the cluster sum of squares. One criticism of this approach is that such estimates of cluster numbers are frequently ambiguous (Tibshirani et al., 2001). This can also be observed in our data, shown in Author response image 4, in which the general magnitude of the optimal cluster number can be broadly inferred, but it is hard to derive a specific number (see Author response image 4A for silhouette score, Author response image 4B for sum of squared distances). We also have used a gap method, which defines the number of clusters relative to a null distribution based on shuffled data using the same clustering approach. Here the optimal number of clusters would correspond to a maximization of the gap value between the shuffled and real dataset. Also, for this approach, however, it is often difficult to derive a clear, unambiguous estimate for a maximum, and hence, the cluster number. We have therefore opted for the described variant of the gap statistic method, which compares against a shuffled dataset, but – as stated above – allows us to derive a precise cluster number at a defined chance level. We hope that the examples we show in the Author response image 4 perhaps make the reviewer more confident that our analysis results in cluster numbers that are in good agreement with those that would be generated from the inflection (or elbow) of the plots of silhouette score vs. cluster numbers (see vertical red lines for our estimate in Author response image 4A-C).

Author response image 4. Cluster size determination with different methods.

Author response image 4.

A, Silhouette method. For our data, measured silhouettes do not form global or local maxima at certain cluster numbers, but form plateaus around certain values. Usually our determined value (orange line) fell within this plateau. B, Elbow method. Usually our method delivered values that were close to what came closest to an elbow. C, Gap method. Steps in gap value at certain cluster sizes were usually at our or close to our determined value.

We would maintain that this analysis is rigorous, in particular in view of the fact that we are using it to compare cluster structures in two conditions (baseline and cue-enriched), in which these analyses were carried out in an identical fashion. If the reviewer is not satisfied by these considerations, we would be willing to remove the quantitative descriptive data that is secondary to the rigorous cluster identification (i.e. the description of cluster sizes, etc.). We do not think that these are essential to the main conclusions of our manuscript, although we do think that this correlative structure is interesting and deserves description.

Regarding the question why we focused on network events, we were interested if in this specific type of synchronous activity, a substructure emerges, as seen previously (Malvache et al., 2016). We had explained that we had observed a repeated activation of GCs in network events (see also Video 1), and that we were curious if it is specific correlated sub-ensembles of GCs that are repeatedly recruited in network events.

4) If cells are tuned so much to speed (Figure 2E) and have almost 0 activity during immobility (as in the heat map), what activity are activity is being analyzed in the network event? In other words, it's a bit confusing to consider how speed cells are involved in immobility.

We see the reviewers point. The correlations indicate that speed cells have a significant correlation of DF/F with speed. The reviewer is right that activity is very low during immobility. However, it is still the case that individual significant Ca2+-events of speed cells are detected in network events. These are much less common though than for place cells. When we analyze the number of network events containing at least one place vs. at least one speed cell, it is on average 23±9 and 33±11% of the network events for place cells under baseline and cue-enriched conditions, respectively (n=9 mice). For speed cells, the participation is much lower, with only 3±2 and 7±3% of events incorporating at least one speed cell (n=9 mice). We still think it is important to report the speed cell participation too. We have included this in the manuscript (Results).

In addition, only ~50% of place and speed cells are recruited in network activity, does it mean that they are recruited randomly, by chance?

We do not entirely understand what the reviewer means by chance. We had already shown that the network events themselves do not arise by chance, by comparing against shuffled datasets (now extended with three shuffling methods in Figure 1—figure supplement 3). This means that the participation of GCs in network events (irrespective of whether they are place cells or not) cannot be explained by random co-occurrence of neuronal activity.

In addition, we would like to clear up that the chance level for recruitment is not 50% (i.e. network vs. non-network participation). Instead, the chance level is determined by the number of network events, and the sparseness of place cell activity.

Irrespective of these considerations, we would argue that the fact that in the cue-enriched condition, we see an increased incorporation of place- but not of speed cells in network events also suggests a specific incorporation of place related information in the network events.

5) In Figure 3, is the enhancement of place and speed cells, and increased network activity due to more neural activity in the enriched environment (Figure 5—figure supplement 1A)? This possibility should be excluded.

Regarding the size of network events, the reviewer is right, this may be related to activity increases. We would suggest that this does not have to be excluded, we are not disputing that changes in neuronal state that modify neuronal excitability influence network events. In fact, the pupil data we show supports such a view. We would note, however, that our detection of network events using shuffled data still detects only network events that are significant beyond the chance level, considering increased general activity levels (see also our extended shuffling analyses in Figure 1—figure supplement 3).

The reviewer is right in stating that the place cells are found more frequently in cue-enriched sessions. This certainly also may be due to increased network activity. However – as we understand it – the reviewer is asking if the increased incorporation of place cells into network events (as shown in Figure 3) is due to enhanced general neuronal activity. We do not think that this is the case. We show that the increase in place cells does not explain the increase in place cell incorporation into network events. When we calculated the fraction of all place cells that participated in network events (with the total number of place cells under each condition set as 100%), we saw a strong and significant increase from 55.42 to 88.46% of place cells participating (baseline vs. cue-rich conditions, see Figure 3C). Thus, irrespective of the increase in the number of place cells in cue-enriched conditions, the probability of a place cell to appear in a network event is significantly higher. The same was not true for speed cells. We have tried to make this clearer in the revised manuscript (Results).

A similar point has also been raised by reviewer 1 (Query 9). We refer to the Author response image 2 for the respective analysis. Reviewer 1 suggested to separate the GCs recorded into two groups. The first group contains the GCs that are active during running and rest (run-related), and the second group contains the GCs that were not active during running but only during immobility (rest only in Author response image 2). We found that both in the baseline and cue-enriched condition, the fraction of network event participating cells (blue, NE participation) was not different. Thus, it does not seem as if we can deduce a general difference in excitability between these two populations that affects network event participation.

6) I found Figure 4 confusing and difficult to interpret. They say in the abstract that they "recapitulate patterns evoked in self-motion". It’s not clear to me where this is shown. Maybe I don't understand this figure, but I was expecting they would do PCA during locomotion and compare to PCA during immobility.

Yes, we did systematically compare two PCAs. To ask if network events recapitulation population activity patters evoked in self-motion, we compared PCAs during locomotion to PCAs during network events. To make this approach clear, we had schematically depicted this approach in Figure 4B. We wrote: ‘After applying PCA to locomotor states in the dentate gyrus, we then also performed a PCA analysis of the population activity in the same region during network events. In order to compare the two sets of PCAs representing population activity during running states and network events, respectively, we first used a vector-based similarity measure. Briefly, we projected the traces recorded during locomotion into the PCA-space representing activity during network events, and tested how much of their variance was captured by them. In this analysis, similarity between both population measures would result in a large fraction of explained variance (Figure 7 in the revised manuscript). The principal components, are, by definition, the directions that capture most of the variance of the data they are computed from, and therefore evaluating the ability of NE-PCs to also capture locomotion-associated variability is an appropriate way to measure the similarity of PCs.

This was the first type of analysis we did, which was explained in detail in the methods. We went on to explain the shuffling procedure used to obtain the null distribution. We also have used the two other published similarity measures that have been used so far to quantify similarity between the PCA bases. First a similarity factor 𝐒PCA as described by Krzanowski (Krzanowski, 1979), and the Eros similarity factor as described in (Yang and Shahabi, C., 2004). These were also described in the methods section. We had perhaps not explained this sufficiently at length in the main text, and have tried to make this clearer by explaining the PCA comparison more extensively in the main text (Results).

I’m also confused by Figure 4E, what is being conveyed here? What is the variance explained in their PCAs? Do the first 3 component explain a good fraction of the variance?

We wanted to use the PCAs to provide an illustration of the neuronal state. It may have been confusing that this figure panel was panel E in the submitted version, it could have thus been perceived as belonging to the comparison procedures described in panels C, D and F. We apologize if this has created confusion. We have renumbered the figure panel (now panel D) to make clearer that this is simply illustrative. The first three components explain 50 % of the variance. We note that for the comparison of locomotion related activity to network events, we chose the number of components such that an equal amount (50 %) of variance in each individual data set was explained.

7) When introducing the behavior, the authors state "Collectively, these data suggest that during immobility, GCs engage in structured ensemble activity that reiterates activity during running at the population level. This suggests that such activity might be important for the formation of hippocampal dependent spatial memories." However, the optogenetic experiment doesn't really test this, as the inhibition is impacting a multitude of things outside of these network effects.

This is true, we thank the reviewer for this comment. We note that the experiment that would be ideal to test the role of network events would be to inhibit only the network events. This would entail two-photon in-vivo imaging in freely moving mice, in combination with closed loop inhibition of granule cells. This is an extremely difficult experiment.

However, the reviewers point stands – we completely agree with the reviewer that our behavioral results should not be overstated. We have rephrased this section in the Results and in the Discussion. We now explicitly discuss the possibility that the behavioral effects could potentially rely also on inhibition of non-network event related activity Discussion.

Also, the authors should plot total immobile time (i.e. total time of DG inhibition) for each mouse, and compare to the discrimination index (do the mice that were more immobile, and thus got more inhibition show worse discrimination?). In addition, a more rigorous control would be inhibition during mobility to show that there is any specificity to the immobility period.

We have done so, and show the plots of total immobile time vs. discrimination index in Author response image 5 for all groups. There was no significant correlation in any group. We are happy to add this to the manuscript if the reviewer thinks it is helpful.

Author response image 5. Discrimination indices are not correlated to illumination time.

Author response image 5.

Plotted are individual discrimination indices for individual sessions of recall trials against the illumination time during the respective session. This is shown for the eYFP control group (left panels) and the halorhodopsin group (right panels) for inhibition during acquisition trials (Upper panels, corresponding to data shown in Figure 9) as well as inhibition during recall trials (lower panels, corresponding to data shown in Figure 8—figure supplement 3Q).

We have also performed the requested set of experiments with inhibition during mobility. The hypothesis for this experiment would be to assume that dentate granule cell activity during locomotion, i.e. when the mouse is actively sampling information in the environment, plays an important role in building a memory of this environment. We followed the reviewer suggestion and repeated the experiments with a new batch of mice expressing eNpHR bilaterally in the dentate gyrus. We tested their performance in the OPS task in trials with inhibition during the entire running period (speed > 5 cm/s). This also led to a complete loss of preference for the displaced object in the recall trial, indicating that granule cell activity during locomotion is equally important.

Thus, as written in our response to reviewer #2, inhibition during the entire trial inhibits memory formation. We now show that inhibition only during exploration also disrupts memory formation, as was expected. Interestingly though, our initial result shows that inhibition only during immobility also leads to significantly impaired memory performance, equal in severity to inhibition during the entire trial. We have added these data to the manuscript as Figure 8—figure supplement 2.

8) They state that "We did not observe any indication of epileptiform activity in Thy1-GCaMP6 (GP4.12Dkim/J) mice, as already reported," however this should be shown, specifically in the mice with the 3mm-1.5mm cone implant above dentate gyrus. It would be reassuring to the reader to show that these network events are not due to abnormal activity from the preparation.

Throughout our recordings, we have had no indication of epileptiform activity. Epileptiform activity in Ca2+ imaging experiments is characterized by a substantial synchronous recruitment of hippocampal neurons, frequently lasting for many seconds. Activity with such properties was never seen in the dentate gyrus of control animals. The network events we see were – in marked contrast to epileptiform activity – extremely sparse, involving on average only ~ 5-6 % of the neuronal population. This clearly sets them apart from any so far described epileptiform activity pattern. The absence of larger scale synchronous activity in all our experiments has now been explicitly stated in the Materials and methods section.

[Editors’ note: what follows is the authors’ response to the second round of review.]

Essential revisions:

1) In the first round of review, the primary concern was the link between network events during immobility and the behavior in the discrimination task. In the revised manuscript, the strong claims of the paper are still not strongly supported by the results shown, and the conclusions of the manuscript should be toned down accordingly and caveats clearly described and discussed. In the revised manuscript, the control experiment has now been provided in Figure 8—figure supplement 1, and the reviewers appreciate this. However, Figure 8—figure supplement 1 shows that inactivation of DG during locomotion in the object place discrimination task also impairs learning. This information is important since it suggests that ANY inhibition of DG during acquisition of the task can impair learning and so it is not clear if there is anything unique about the DG activity during resting for acquisition. Perhaps DG is encoding the experience as a single sequence spanning rest and running, and breaking this sequence at any point could then impact learning. This is an important caveat that should be added as a counterpoint to statements such as the following in the Abstract "Using optogenetic inhibition during immobility, we show that granule cell activity during immobility is required to form dentate gyrus-dependent spatial memories."

We have further toned down the statements made. Specifically, we have added the idea that DG is encoding the experience as a single sequence spanning rest and running to the Discussion section. We indeed did not think of this interesting possibility. In the Abstract, we now clearly state that inhibition during locomotion inhibits learning, but that inhibition only during immobility is also sufficient. Due to space issues, we did not elaborate on the reasons for this effect in the Abstract, but have included these points in the Discussion.

Also, in the Discussion, the authors should include a statement such as the following "however, the same inhibition of DG during locomotion in the OPS task also prevents the formation of spatial memories, making it unclear if DG activity during rest plays a role in acquisition that is unique or different from the activity during locomotion". In general, any claims about specificity of network events during immobility to memory operations, or misleading language, should be revised and toned down. The authors should describe the data as they stand: the synchronized events during immobility may be involved in learning; however, any specificity remains unknown and untested here.

We have included a statement to this effect in the Discussion section. We have also carefully revised the manuscript to remove potentially misleading claims.

2) The huge inter-trial lap by lap variability of population activity in DG during running could be due to the lack of salient sensory cues at fixed locations in the belt or reward. In their response to the previous round of review, the authors suggest that activity in DG is structured by laps because a fixed sensory cue (a change in belt width) is present. But this information is absent from the Materials and methods section, and it is difficult to determine if animals take into account this sensory cue. Authors should find some indication either in their data and in the analysis of behavior that this is indeed the case. The high inter trial similarity of PCA trajectories in CA1 and the data showing that part of the belt is overrepresented seems to suggest that this is the case but this point should be discussed and clearly stated in the manuscript to justify the lap by lap analysis.

In the manuscript, we have used three different types of belt: Firstly, an uncued belt, secondly, a belt with spatial cues (cue-rich), and thirdly, a more traditional linear track with three segments comprising completely different sets of cues. We would like to stress that an inter-trial lap by lap variability far larger than that observed in CA1 was seen in a three types of linear track.

In the uncued belt mentioned by the reviewer, the only spatial cue is the belt junction at which both ends of the belt are joined. We indeed did not mention this in the methods and have now added explicitly that there is a belt junction different in texture even in the uncued belt.

As stated above, we see a very large lap by lap variability of population activity in all three types of linear track. We show this in Figure 7—figure supplement 2, where we plotted the weights of the first five principal components against the animal position for all three conditions in the DG, and show the corresponding CA1 data with the segmented belt for comparison. To quantify how similar population activity is across laps, we computed the normalized autocorrelation of the first five PCA-weights from example data with respect to different laps. The autocorrelation showed clear peaks at integer multiples of 1 lap for CA1, which were much less pronounced for all linear track conditions in DG (see Figure 7—figure supplement 2M-P, for autocorrelations from five first components averaged for all animals). We also quantified the average peak value of weight-autocorrelations at a spatial distance of 1 lap. This revealed a significant difference in the omnibus test (ANOVA, F(1,3) = 88.32, p = 2*10-30,). Moreover, the CA1 autocorrelations were significantly different from all three DG conditions. We did find more periodicity in the segmented linear track compared to the baseline condition (* Bonferroni posttest p<0.05, *** Bonferroni posttest p<0.001). We have explained this analysis better in the revision. We have transferred the key quantification of this phenomenon in Figure 7—figure supplement 2Q to the main Figure 7D.

We would also like to emphasize that the periodicity shown in Figure 7—figure supplement 2 does not mean that parts of the linear track are over-represented. In fact, place cells relatively regularly tile the linear track. Instead, the autocorrelation merely shows the repetitiveness of population behaviour with a periodicity of 1 lap (i.e. stable place coding from lap to lap).

3) For the orthogonality of network events, authors should indicate the percentage of orthogonal network events that are likely to occur by chance to give readers an idea of the percentage of "true" orthogonal events.

We have added the bar graphs depicting the comparison to shuffled data in Figure 4A as an inset. We also now give the percentage of orthogonal network events in real and shuffled data in the main text.

4) The variability of PCA trajectories in DG should be quantified and compared to CA1. The reviewers would like to have actual numbers in the text for comparison. Also, PCA trajectories in CA1 should be illustrated in Figure 7 for comparison.

The quantification of the autocorrelation analysis presented in Figure 7—figure supplement 2 has now been included in the main text. We have inserted the numbers and statistics in the text as requested. Additionally, we have transferred the key quantification of this phenomenon to the main Figure 7D. We have also included a representative PCA trajectory of CA1 in Figure 7 for comparison as requested.

5) Reviewers would be more convinced about the specificity of the reinstated activity during synchronous network events by a comparison with random network activity during immobility but outside synchronous network events or a shuffling procedure which preserves inter-neuronal correlations such as procedure number 2 in Figure 1—figure supplement 3.

First, we would like to make clear that in shuffling procedure 2 in Figure 1—figure supplement 3, we shifted the entire time series of cells DF/F by a random time value. This is also the shuffling procedure that we performed for the PCA based similarity measures. Thus, all non-random activity timing between cells is destroyed and cells will no longer be synchronously active at NE timepoints. At the same time, individual cell event statistics will be maintained (i.e. inter-event-intervals). This method thus preserves intra-neuronal correlations and event frequencies, but destroys inter-neuronal correlations. We now better explain this by adding a schematic to Figure 7H-K that illustrates the shuffling procedure.

We agree with the reviewer that in the case of our similarity measures, it is highly relevant how shuffling is carried out. We were not entirely sure that we understood what the reviewers meant with their suggestions for additional shuffling procedures or comparisons. However, it was refreshing and valuable to take the different points the reviewers made as an impetus to rethink what we actually test with different shuffling methods. We consequently added two more shuffling approaches to the paper following a number of additional analyses.

We first tried to follow one reviewer request as we understood it, i.e. to compare locomotor activity with network activity during immobility, but outside network events, with a method that preserves inter-neuronal correlations. One approach we tried was to randomly shuffle NE times (excluding the actual NEs), such that random non-NE times during resting periods are picked. This procedure by definition excludes all activity during NEs, leaving just the activity occurring during immobility outside NEs. Due to this exclusion of a substantial portion of activity, the remaining activity was very sparse, and unfortunately, insufficient to reasonably perform PCAs.

We then stepped back and considered which additional shuffling procedures might be informative. The shuffling approach included in the first submission of this paper, while relevant, does not test if the composition of NEs matters for the similarity between running and NE activity. We therefore implemented two more shuffling approaches that shuffle activity within NEs.

In our second shuffling approach, now included in Figure 7J, we tested if the composition of individual NEs is important. To this end, for each individual NE, we randomly reassigned activity of a given cells activity to a different cell. Thus, NEs have exactly the same number of active cells, but the identity of cells active within them has been randomly changed, and the number of NEs that individual cells participate in will be altered.

In our third shuffling procedure, now included in Figure 7K, we address one reviewers concern that we interpreted as follows: Could it be that morpho-functional properties in the network simply confine activity during run and rest to very specific populations of cells that are always very active? This is a reasonable concern, because the dentate gyrus does contain small subpopulations of cells that are much more active than the rest. If so, then shuffling in a different way would be required. We therefore added a third shuffling method, in which for each cell, we randomly reassigned its NE activity to other NEs. Thus, how many NEs a given cell participates in is maintained. At the same time, NE interactions between specific sets of cells will be altered, although highly active cells that participate in multiple NEs will still be more likely to be co-active in shuffled NEs. If the similarity was driven by such a population of always-active cells, then this shuffling would not disrupt the similarity between running and shuffled NE activity. However, also here NE activity was more similar to running activity than shuffled data.

We think that these data with three different shuffling procedures testing different aspects of similarity between NEs and locomotion related activity show convincingly that there is a similarity at the population level between these two activity types that is larger than expected. Moreover, the two novel shuffling procedures strongly suggest that the cellular composition of network events matters for this similarity.

6) Reviewers recommend deciphering clusters with a different shuffling procedure maybe leading to a higher threshold because some of these clusters do not look convincing in Figure 4 and Figure 4—figure supplement 1.

Indeed, some clusters have a higher intra-cluster correlation coefficient than others. Of note, we have only included clusters into the further analysis when their mean intra-cluster correlation exceeded the 5% significance value which was determined by the shuffling analysis. This means that not all of the clusters appearing along the diagonal axis enter further analysis. We have made this clearer in the text (not only the methods) and have indicated clusters that passed the significance threshold in Figure 4 and Figure 4—figure supplement 1.

The reviewers are correct that higher thresholds would lead to smaller clusters with higher intra-cluster correlations. Therefore, we followed the reviewers’ advice and included all analysis using more stringent significance thresholds (3% and 1% instead of 5%) (Author response image 6). As expected, these thresholds result in smaller more convincing clusters in some examples but on the other hand also lead to an increase of inter-cluster correlation in others. However, the general changes observed in place cell participation in clusters are comparable for all different thresholds. We are happy to include this in the manuscript, but since a 5% significance threshold seems to us the most objective approach, and our main findings are robust when changing thresholds, we would suggest leaving it out.

Author response image 6. Analysis of clusters with different thresholds.

Author response image 6.

Cluster analysis was done as described in the methods. Significance values of 5%, 3% and 1% are used, determined by shuffling analysis. Clustering examples for eight sessions are depicted on the right. All clusters passing the respective significance threshold are indicated with grey frames. On the left side, we have reproduced the bar and pie charts from Figure 6D and E regarding place and speed cell participation in clusters for all different thresholds.

Reviewer #1:

Granule cells of the dentate gyrus are numerous and discharge very sparsely despite receiving intense synaptic inputs from the entorhinal cortex. Dentate granule cells are active both during locomotion during which their firing is spatially modulated (place cells) and during immobility periods during which they are synchronously co-activated during large fluctuations in local field potential called dentate spikes in the dentate gyrus and sharp-waves in CA1. In this paper the authors used dual-color bi-photon in vivo calcium imaging in head fixed mice walking on a treadmill to characterize at the cellular level the synchronous activities recorded during immobility in the dentate gyrus and compare them with activities recorded during movement. Mice were running either on an un-cued treadmill (with textures) or a cued-treadmill (with more salient tactile sensory cues). During immobility, they observe co-activation of dentate granule during synchronous network events. These synchronous activities are temporally correlated with increased activity of axonal fibers from the medial entorhinal cortex and correspond to the reactivation of some dentate granule cells active during periods of movement including place cells and speed cells. A number of pairs of synchronous events are orthogonal but synchronous events also reactivate similar clusters of DGCs. The authors then use PCA to compare activity during synchronous events and movement. They report a high lap by lap variability of dentate granule cell population activity (notably compared to CA1 pyramidal cell activity) during movement on the belt and some similarity between synchronous event activity during immobility and population activity during movement. Finally, they observed that inhibiting dentate granule cell activity during immobility impairs performance in an object spatial discrimination task.

Synchronous activation of principal cells during awake immobility and sleep has been well described in the CA1 area of the hippocampus and linked to hippocampal dependent spatial memory formation. Much less is known for synchronous activities of dentate granule cells of the dentate gyrus during immobility. Given the sparse activity of these cells two photon calcium imaging seems an appropriate approach to address this question. The study provides interesting characterization of synchronous network activity in the dentate gyrus during immobility. Interpretation of the results is however limited by the high lap by lap heterogeneity of dentate granule cells population activity in the behavioral paradigm used. Furthermore the link between these synchronous network events and memory during an object spatial discrimination task deserves to be strengthened in future studies.

1) In the behavioral paradigm used, head-fixed animals are running on belts which can be devoid of any sensory cue or with randomly interspaced cues. Furthermore no reward is provided at a fixed location/distance on the belt. In these conditions it is unclear whether animals get a sense of the dimension of the environment and notably whether they completed single laps around the belt instead of travelling an infinite environment. This point is important because several analyses are performed lap by lap notably the characterization of dentate gyrus place cells in Figure 3 and comparisons between PCA trajectories in Figure 7.

See our comments to point 2 above.

2) Authors use a shuffle distribution to compare population activity during running periods and population activity during immobility-associated synchronous network events and observed that similarity is higher than expected by chance, but this is unsurprising given that the network architecture morpho-functional properties of dentate granule cells etc… will impose constrains on observed neural dynamics. Furthermore, the shuffle method used eliminates inter-neuronal correlations. To decipher the specificity of this similarity, a more convincing comparison would be with activity recorded during immobility but outside network events. Alternatively authors could use a shuffling method that preserves inter-neuronal correlations.

See our comments to point 5 above.

3) Trajectories in PCA space show high inter-trial variability in the dentate gyrus unlike what is observed in CA1. This could result from the lower proportion of spatially modulated cells in the dentate gyrus compared to CA1. This heterogeneity raises a question about the specificity of reinstated activity during synchronous network events.

See our comments to points 2, 4 and 5 above.

4) Authors report preferred reactivations of identical cell clusters during synchronous network events. However, while some clusters illustrated in Figure 4C look convincing (like the red cells' cluster) others appear not very convincing (like the orange cells' one in Figure 4 C). Authors could use a more stringent shuffling procedure to strengthen cluster detection.

See our comments to point 6 above.

Associated Data

    This section collects any data citations, data availability statements, or supplementary materials included in this article.

    Data Citations

    1. Pofahl M. 2020. Synchronous activity patterns in the dentate gyrus during immobility. Dryad Digital Repository. [DOI] [PMC free article] [PubMed]

    Supplementary Materials

    Source code 1. Behavior apparatus LabView program.
    elife-65786-code1.zip (18.5MB, zip)
    Source code 2. Network detection MATLAB code.
    elife-65786-code2.zip (2.3KB, zip)
    Source code 3. Network cluster structure MATLAB code.
    elife-65786-code3.zip (1.8KB, zip)
    Source code 4. Network shuffle analysis MATLAB code.
    elife-65786-code4.zip (905B, zip)
    Source code 5. PCA similarity MATLAB code.
    elife-65786-code5.zip (3.3KB, zip)
    Supplementary file 1. Spread Sheet containing statistical test results for present data with respective figure numbers.
    elife-65786-supp1.xlsx (38.8KB, xlsx)
    Transparent reporting form

    Data Availability Statement

    Binarized imaging traces of all cells from all experiment sessions are available on Dryad. https://doi.org/10.5061/dryad.mkkwh70z6.

    The following dataset was generated:

    Pofahl M. 2020. Synchronous activity patterns in the dentate gyrus during immobility. Dryad Digital Repository.


    Articles from eLife are provided here courtesy of eLife Sciences Publications, Ltd

    RESOURCES