

Abstract
Background.
A limitation of the Agatston coronary artery calcium (CAC) score is that it does not use all of the calcium density information in the CT scan such that many individuals have a score of zero. We examined the predictive validity for incident coronary heart disease events of the spatially weighted coronary calcium score (SWCS), an alternative scoring method for CAC that assigns scores to individuals with Agatston CAC = 0.
Methods.
The Multi-Ethnic Study of Atherosclerosis (MESA) is a longitudinal study that conducted a baseline exam in 2000–2002 in 6,814 participants including CT scanning for CAC. Subsequent exams and systematic follow-up of the cohort for outcomes were performed. Statistical models were adjusted using the MESA risk score based on age, sex, race/ethnicity, systolic blood pressure, use of hypertension medications, diabetes, total and high-density lipoprotein (HDL) cholesterol, use of lipid lowering medications, smoking status, and family history of heart attack.
Results.
In the 3,286 participants with Agatston CAC = 0 at baseline and for whom SWCS was computed, 98 incident CHD events defined as definite or probably myocardial infarction or definite CHD death occurred during a median follow-up of 15.1 years. In this group SWCS predicted incident CHD events after multivariable adjustment (hazard ratio = 1.30 per standard deviation of ln(SWCS), 95% CI, 1.04–1.60; p=0.005); and progression from Agatston CAC = 0 at baseline to CAC > 0 at subsequent exams (multivariable adjusted incidence rate difference per standard deviation of ln(SWCS) per 100 person-years 1.68, 95% CI, 1.03–2.33; p<0.0001).
Conclusions.
SWCS predicts incident CHD events in individuals with Agatston CAC score=0 as well as conversion at repeat CT scanning at later exams to Agatston CAC > 0. SWCS has predictive validity as a subclinical phenotype and marker of CHD risk in individuals with Agatston CAC = 0.
Keywords: Atherosclerosis, coronary artery calcium score
INTRODUCTION
Atherosclerosis is an inflammatory process leading to plaque formation that results from intra-cellular accumulation of low density lipoprotein (LDL) cholesterol in macrophages in the arterial wall.1–5 Calcification is a response to inflammation in the plaque,6 thereby providing a biological rationale for the measurement of coronary artery calcium (CAC) as a risk factor for coronary heart disease (CHD). Scoring systems have been developed to quantitate CAC reproducibly from computerized tomography (CT) images. Of these, the most widely used is the Agatston CAC score.7 Agatston CAC score has been shown to be highly predictive for CHD8 and cardiovascular disease (CVD) events9 and is widely used in risk stratification, particularly in individuals who are at intermediate risk for CVD based on traditional risk factors.10,11
A limitation of the Agatston CAC score is that it does not use all of the calcium density information in the CT scan. Approximately half of the MESA cohort had Agatston coronary artery calcium (CAC) score = 0 at the baseline exam,12 with Agatston CAC = 0 being more common in younger individuals. An alternative scoring system, termed spatially weighted coronary calcium score (SWCS) and described in a previous MESA publication,12 has been used to assign scores to individuals with Agatston CAC = 0. The SWCS aligns closely with the Agatston score for those with Agatston CAC > 012 and, like the Agatston score, predicts CHD events in the cohort as a whole, that is, among individuals with CAC =0 and CAC > 0 at baseline considered together.12 In this previous study, among individuals with Agatston CAC = 0, there was a statistically non-significant association of SWCS and CHD risk, but data were available for only six years of follow-up, in which only 22 incident CHD events occurred in this group. Thus, the predictive ability of SWCS for CHD events in this group was underpowered. We therefore examined the predictive ability of SWCS for incident CHD events using follow-up data through 2016, with a median of approximately 15 years of follow-up, among those with Agatston CAC score = 0 at baseline in the MESA cohort. Additionally, we examined the predictive ability of SWCS for incidence of Agatston CAC > 0 in follow-up CT scans at MESA exams 2 and 3. Exam 2 took place from September 2002 through February 2004. Exam 3 took place from March 2004 through September 2005.
METHODS
The data that support the findings of this study are available from the corresponding author upon reasonable request.
Study Participants and Baseline Measures
The Multi-Ethnic Study of Atherosclerosis (MESA) is a population-based study of 6,814 men and women aged 45–85 years, without known clinical cardiovascular disease at time of entry, recruited from six U.S. communities (Baltimore, MD; Chicago, IL; Forsyth County, NC; Los Angeles County, CA; northern Manhattan, NY; and St. Paul, MN). Sampling and recruitment procedures have been reported.13 Questionnaires were used to assess age, gender, race/ethnicity, educational and income levels, occupational information, smoking status, and medication use for diabetes mellitus, lipid lowering, and hypertension. Classification of race/ethnicity was based on self-identification using questions based on the U.S. 2000 census questionnaire. Height and weight were measured, and body mass index (BMI) was computed as kg/m2. Blood pressure was measured in the seated position three times at one minute intervals using an appropriately sized cuff and following a standardized protocol.14 The average of the last two measurements was used for analysis. Hypertension was defined as systolic blood pressure ≥140 mmHg, diastolic blood pressure ≥90 mmHg, or self-reported high blood pressure and on treatment with medication for hypertension.15 Diabetes was defined as being on treatment with insulin or oral medication for diabetes or fasting glucose ≥126 mg/dl.16 Fasting blood specimens were analyzed for serum glucose, total cholesterol, high density lipoprotein (HDL) cholesterol, and triglyceride levels. The baseline exam was conducted between 8/1/2000 and 7/30/2002. Centrally trained and certified study staff performed all participant measurements. Institutional Review Board approval was obtained at all MESA sites. Consent was obtained from all participants.
CT Scanning and CAC Measurement
Coronary artery calcium (CAC) was assessed at the six MESA field centers using either an electron-beam CT scanner (at the Chicago, Los Angeles, and New York centers) or a multidetector CT system (at the Baltimore, Forsyth County, and St. Paul centers).17 Certified technologists scanned all participants twice over phantoms of known physical calcium concentration. A radiologist or cardiologist read all CT scans at a single center (Los Angeles Biomedical Research Institute at Harbor–University of California Los Angeles Medical Center, Torrance) using an interactive scoring system. The reader–work station interface calibrated each tomographic image according to the estimated attenuation of the calcium phantom and then identified and quantified the coronary calcium in each image. The Agatston CAC score7 was calculated for each scan, and the mean of the two scans was used in all analyses. Intra-observer and inter-observer agreement were excellent (kappa statistics, 0.93 and 0.90, respectively). The SWCS were calculated from the CT scans at the baseline exam and the randomly selected 50% of participants who had repeat CT scanning at exam 2 and the remaining 50% who had repeat scanning at exam 3.
Spatially Weighted Calcium Score
The procedure for calculating SWCS has been described in detail in a previous publication and appendix.12 As in reading the CT scans for the Agatston score, a set of voxels was identified by the reader as representing the coronary arteries. A weight was assigned to each voxel using a weighting function with parameters derived from the scan’s phantom, so that scores across images were comparable. Each voxel was then assigned a score based on the weight assigned to it and its neighbors. This procedure used surrounding information to increase accuracy by upweighting voxels with neighboring voxels that had high attenuation levels and down-weighting those whose neighbors had low attenuation levels.
Coronary Heart Disease Events
Incident CHD was defined as definite or probably myocardial infarction (MI) or definite CHD death.8 Participants included in the analysis were followed for incident CHD events from the baseline exam until the end of 2016, for a median of 15.1 and maximum of 16.5 years of follow-up. In addition to five follow-up MESA examinations, a telephone interviewer contacted each participant every 9 to 12 months to inquire about interim hospital admissions, cardiovascular outpatient diagnoses, and deaths. To verify self-reported diagnoses, copies were requested of all death certificates and medical records for all hospitalizations and outpatient cardiovascular diagnoses. Next of kin interviews for out of hospital cardiovascular deaths were obtained. Medical records were obtained for approximately 99% of reported hospitalized cardiovascular events and information on 97% of reported outpatient cardiovascular diagnostic encounters. Follow-up telephone interviews were completed in 90% of living participants. Trained personnel abstracted medical records suggesting possible cardiovascular events. Two physicians independently reviewed all abstracted medical records for endpoint classification and assignment of incidence dates, using pre-specified criteria. Descriptions of MESA events definitions and follow-up procedures have been previously published.8 MESA CHD event ascertainment was supplemented by including events missed by MESA with MI events found from Medicare claims data and CHD deaths found in the National Death Index.
Statistical Analysis
Cox regression for the participants with baseline SWCS measured and Agatston CAC = 0 was used to estimate the relationship (hazard ratio) of the natural logarithm (ln) of baseline SWCS as a continuous variable per standard deviation (SD) of ln(SWCS) and in quartiles with the risk of CHD. In sensitivity analyses we also tested whether a cubic spline function improved the fit compared to a linear function for ln(SWCS) with no evidence of improvement (data not shown). We estimated hazard ratios for CHD before and after adjustment for traditional CHD risk factors. For the adjusted Cox models, we used the MESA risk score18 to adjust for potential confounding factors. The risk score incorporates information for age, sex, race/ethnicity, MESA site, systolic blood pressure, use of hypertension medications, diabetes, HDL cholesterol, use of lipid lowering medications, smoking status, and family history of heart attack. This was done because the number of events was too small to allow for interpretable coefficients with all covariates included individually in the final model. To evaluate potential differences in the association between ln(SWCS) and incident CHD by age groups, gender, and race/ethnic groups, we also added interaction terms to the model, with no evidence of effect modification by those participant characteristics (data not shown).
We modeled the incidence rate (per 100 person years) of Agatston CAC > 0 at Exams 2 or 3 as a function of the ln(SWCS) using weighted least squares for linear regression with weights equal to the time between baseline and Exams 2 or 3.19 Based on this approach, the model coefficient estimates the incidence rate difference of CAC > 0 for a SD increment of the ln(SWCS) reported per 100-person years. A robust variance estimator20 was used in models that were unadjusted and adjusted for the variables listed in Table 1. All analyses were carried out using STATA 16.0.
Table 1.
Descriptive statistics comparing MESA participants with Agatston coronary artery calcium (CAC) = 0 vs. CAC > 0 at the MESA baseline exam 2000–2002 included in the analysis.
| CAC = 0 | CAC > 0 | |||||
|---|---|---|---|---|---|---|
| Variable | N | Mean | Std. Dev. | N | Mean | Std. Dev. |
| Age (years) at baseline exam | 3,286 | 57.96 | 9.14 | 3,255 | 66.41 | 9.51 |
| Body mass index (kg/m2) | 3,286 | 28.29 | 5.64 | 3,255 | 28.36 | 5.32 |
| Systolic blood pressure (mmHg) | 3,285 | 122.40 | 20.47 | 3,253 | 130.86 | 21.69 |
| Diastolic blood pressure (mmHg) | 3,285 | 71.30 | 10.23 | 3,253 | 72.54 | 10.23 |
| Total cholesterol (mg/dL) | 3,272 | 193.72 | 35.02 | 3,246 | 194.53 | 36.27 |
| High density lipoprotein (HDL) cholesterol (mg/dL) | 3,271 | 52.48 | 15.06 | 3,244 | 49.45 | 14.51 |
| Agatston Coronary Artery Calcium score (CAC) | 3,286 | 0.00 | 3,255 | 291.01 | 545.60 | |
| Spatially Weighted Calcium Score (SWCS) | 3,286 | 3.11 | 9.13 | 3,255 | 194.34 | 366.65 |
| N | % | N | % | |||
| Sex | ||||||
| Female | 2,082 | 63.36 | 1,380 | 42.4 | ||
| Male | 1,204 | 36.64 | 1,875 | 57.6 | ||
| Race/Ethnicity | ||||||
| White or Caucasian | 1,068 | 32.50 | 1,428 | 43.87 | ||
| Chinese-American | 395 | 12.02 | 395 | 12.14 | ||
| Black or African-American | 1,031 | 31.38 | 782 | 24.02 | ||
| Hispanic | 792 | 24.10 | 650 | 19.97 | ||
| Smoking | ||||||
| Never | 1,821 | 55.64 | 1,459 | 44.92 | ||
| Former | 1,010 | 30.86 | 1,370 | 42.18 | ||
| Current | 442 | 13.50 | 419 | 12.9 | ||
| Diabetes at baseline exam | ||||||
| Normal | 2,581 | 78.86 | 2,211 | 68.14 | ||
| Impaired Fasting Glucose | 388 | 11.85 | 518 | 15.96 | ||
| Untreated Diabetes | 67 | 2.05 | 103 | 3.17 | ||
| Treated Diabetes | 237 | 7.24 | 413 | 12.73 | ||
| Hypertension medication | ||||||
| No | 2,331 | 70.98 | 1,770 | 54.39 | ||
| Yes | 953 | 29.02 | 1,484 | 45.61 | ||
| Statin use at baseline exam | ||||||
| No | 90.29 | 90.29 | 2,588 | 79.63 | ||
| Yes | 9.71 | 9.71 | 662 | 20.37 | ||
RESULTS
In the MESA sample of 6,814 participants at baseline, 29 participants with no follow-up were excluded from the analyses. Of the remaining 6,785 participants, 6,541 had SWCS computed (Figure 1). As previously reported, individuals with CAC > 0 at the baseline exam were older, more likely to be male, white or Caucasian, and more likely to have CHD risk factors compared to individuals with CAC = 0 (Table 1). Among the 3,286 participants with CAC = 0 at baseline and for whom SWCS was computed, 15 were missing data for one or more covariates included in the multivariable models and were excluded, so that 3,271 individuals were included in these models. In this group, there were 98 incident CHD events during the follow-up period.
Figure 1.
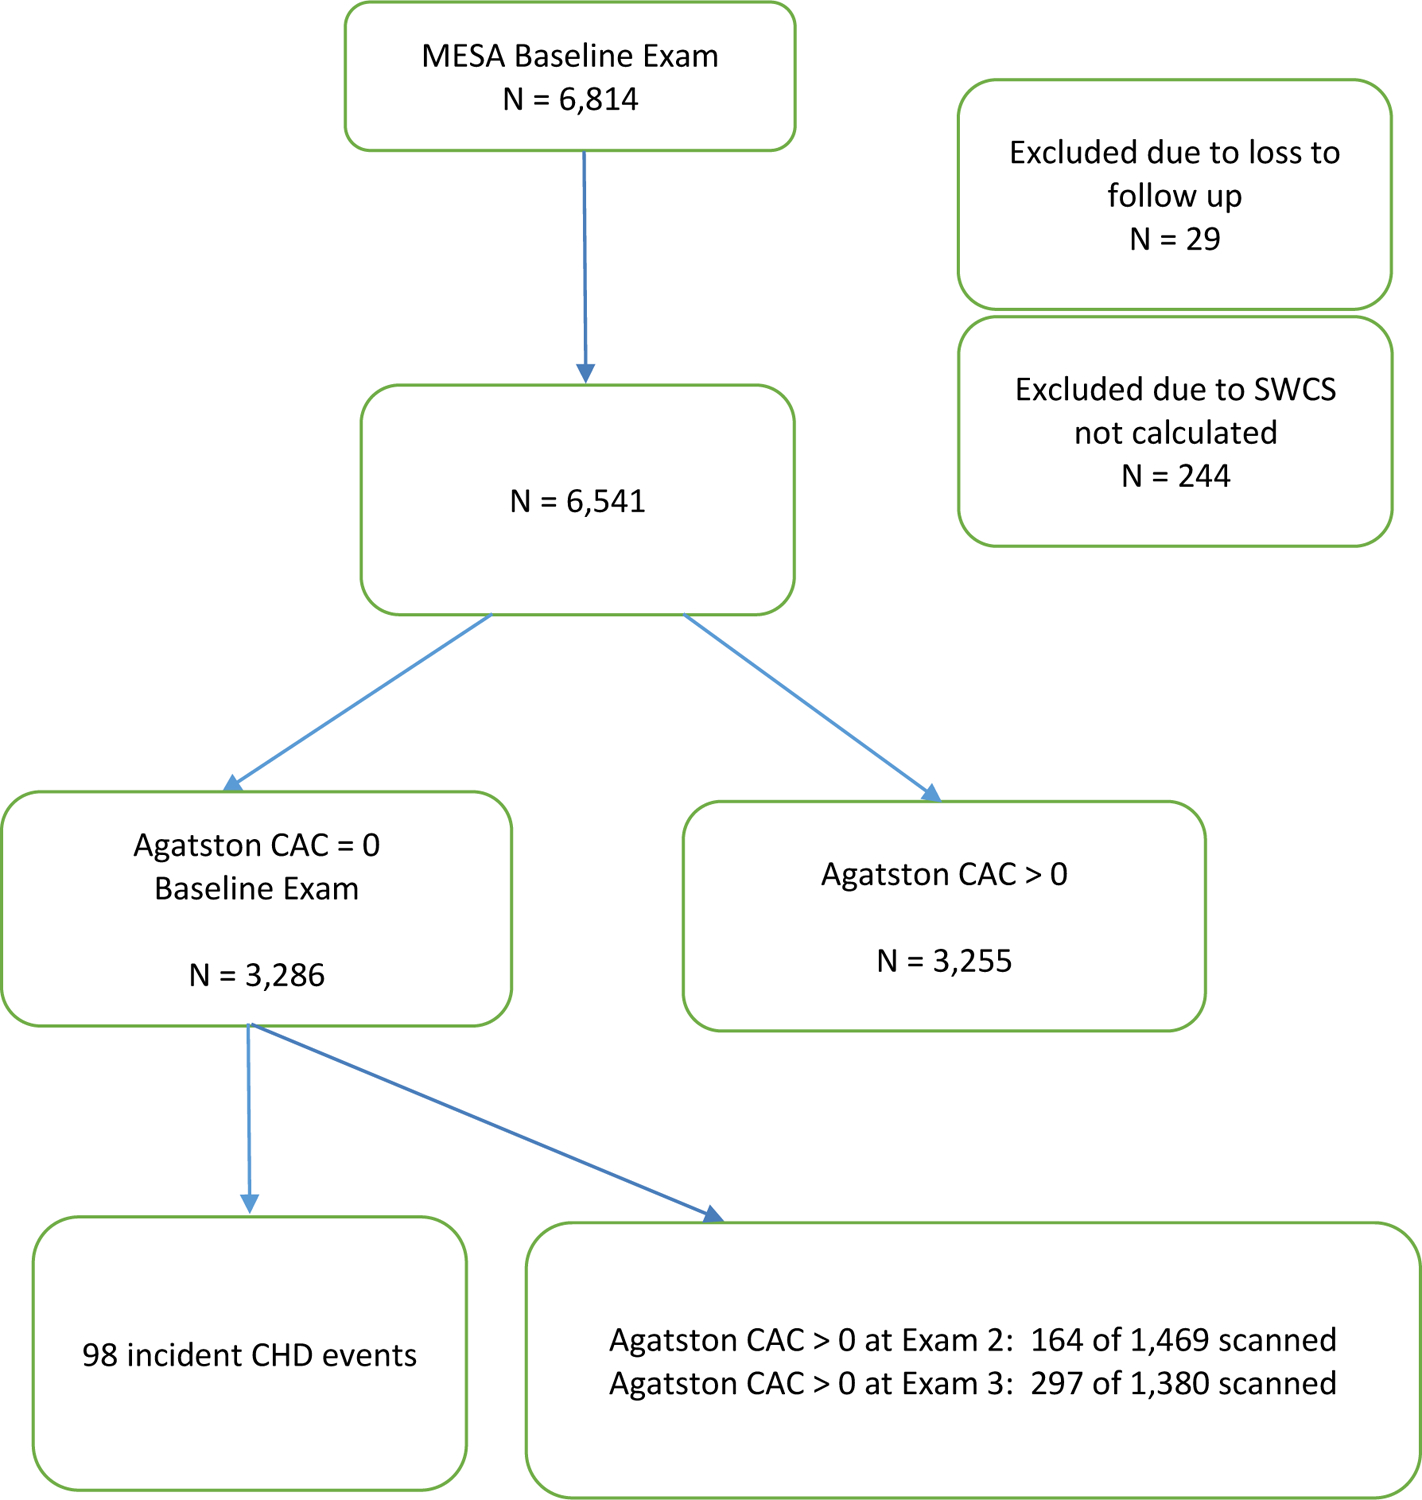
Flow Chart
In the Cox model for incident CHD, the unadjusted hazard ratio per SD of ln(SWCS) was 1.40 (95% CI, 1.14–1.80; p=0.0023). The hazard ratio adjusted for covariates using the MESA risk score was 1.30 (95% CI, 1.04–1.60). As shown in Table 2, the cumulative CHD event rates were progressively greater in each quartile of SWCS at baseline among those with Agatston CAC = 0 at the baseline line exam. This was also the case after multivariable adjustment (Table 3). As shown in Figure 2, very few events occurred during the first five years after the baseline CT scan with Agaston CAC = 0. Also as shown in Figure 2, the quartiles became more separate with longer time of follow-up.
Table 2.
Cox model for 15-year incidence of CHD by quartile of ln (SWCS) for participants with Agatston CAC = 0; N=3,286.
| Covariate | Haz. Ratio | 95% Conf. Interval | P>|z| |
|---|---|---|---|
| Quartiles of ln (SWCS) | |||
| Quartile 1* (n = 14) | 1 | reference | |
| Quartile 2 (n = 21) | 1.33 | (0.68,2.61) | 0.398 |
| Quartile 3 (n = 25) | 1.79 | (0.95,3.38) | 0.072 |
| Quartile 4 (n = 38) | 2.62 | (1.44,4.78) | 0.002 |
CHD = coronary heart disease. ln = natural logarithm.
SWCS = spatially weighted calcium score. n = number of events.
Reference category.
Table 3.
Cox model for 15-year incidence of CHD by quartiles of ln (SWCS) for participants with Agatston CAC = 0, with adjustment for covariates using the MESA risk score18; N=3,271. Covariates as of baseline exam.
| Covariate | Haz. Ratio | 95% Conf. Interval | P>|z| |
|---|---|---|---|
| Quartiles of ln (SWCS) | |||
| Quartile 1* | 1 | reference | |
| Quartile 2 | 1.46 | (0.74,2.88) | 0.270 |
| Quartile 3 | 1.70 | (0.88,3.26) | 0.114 |
| Quartile 4 | 2.32 | (1.24,4.32) | 0.008 |
| MESA Risk Score | 1.40 | 1.23,1.59 | <0.0001 |
CHD = coronary heart disease. ln = natural logarithm.
SWCS = spatially weighted calcium score.
Reference category.
Figure 2.
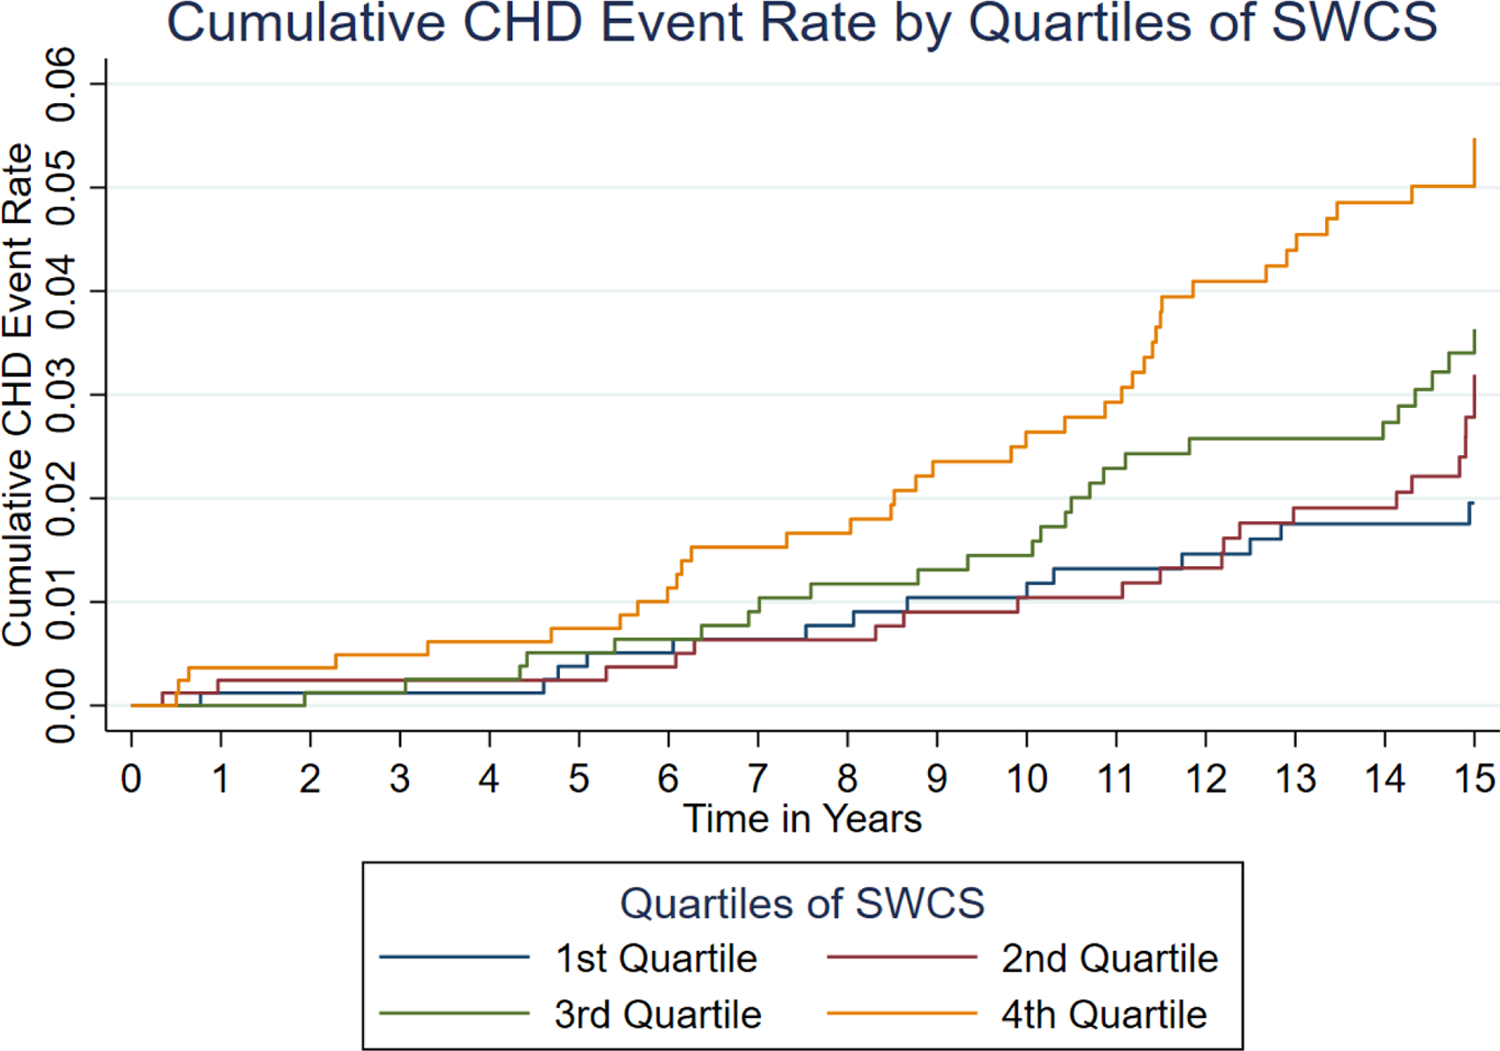
Cumulative CHD event rates by quartile of SWCS
The rate of transition from Agatston CAC = 0 to CAC > 0 was 7 per 100 person-years for both the transition from baseline to Exam 2 and from baseline to Exam 3. This indicates a constant rate for this transition. For risk of progression from Agatston CAC = 0 at baseline to Agatston CAC > 0 at either Exam 2 or Exam 3, we observed an unadjusted rate difference of 1.95 CAC transition events per 100 person years per SD increase of ln(SWCS)(p<0.0001). After multivariable adjustment, a one SD increase in ln(SWCS) was associated with 1.68 (95% CI, 1.03–2.33; p<0.0001) more CAC transition events per 100 person-years (Table 4). Also as shown in Table 4, other established risk factors for CHD were associated with the transition from CAC = 0 to CAC > 0.
Table 4.
Regression model for the transition from baseline Agatston coronary artery calcium (CAC) score = 0 to CAC > 0 at either exam 2 or 3, adjusted for demographic variables and CHD risk factors. For continuous variables, the regression coefficients predict the rate difference for a 1 standard deviation change of the variable (in 100 person-years) of Agatston CAC going from 0 to > 0. N=2,819. Covariates as of baseline exam.
| Covariate | Incidence rate difference | 95% Conf. Interval | p-value |
|---|---|---|---|
| ln (SWCS) per SD (=2.221) | 1.68 | (1.03,2.33) | <0.0001 |
| Age (years) per S.D. (=9.139) | 2.02 | (1.36,2.68) | <0.0001 |
| Gender | |||
| 0: Female* | 0 | Reference | |
| 1: Male | 1.76 | (0.36,3.15) | 0.014 |
| Race/Ethnicity | |||
| 1: White or Caucasian* | 0 | Reference | |
| 2: Chinese-American | −1.80 | (−3.72,−1.83) | 0.067 |
| 3: Black or African-American | −1.95 | (−3.44,−0.46) | 0.010 |
| 4: Hispanic | −2.11 | (−3.66,−0.56) | 0.008 |
| Body mass index (kg)/(m^2) per SD (=5.642) | 0.17 | (−0.54,0.87) | 0.644 |
| Cigarette smoking status | |||
| 0: Never* | 0 | Reference | |
| 1: Former | 1.27 | (−0.01,2.55) | 0.052 |
| 2: Current | 1.77 | (0.02,3.53) | 0.048 |
| Hypertension medication | |||
| No* | 0 | Reference | |
| Yes | 2.18 | (0.79,3.57) | 0.002 |
| Systolic blood pressure (mmHg) per SD (=20.470) | 0.90 | (−0.02,1.81) | 0.054 |
| Diastolic blood pressure (mmHg) per SD (=10.233) | −0.19 | (−1.06,0.67) | 0.660 |
| Total cholesterol (mg/dL) per S.D. (=35.024) | 0.84 | (0.26,1.42) | 0.005 |
| HDL cholesterol (mg/dL) per S.D. (=15.055) | −0.95 | (−1.59,−0.30) | 0.004 |
| Statin use | |||
| No* | 0 | Reference | |
| Yes | 2.16 | (0.21,4.10) | 0.030 |
| Diabetes | |||
| No | 0 | Reference | |
| Yes | 1.79 | (−0.52,4.11 | 0.129 |
| Constant | −12.75 | (−20.57,−4.94) | 0.001 |
Reference category.
SD = standard deviation. ln = natural logarithm. CHD = coronary heart disease. SWCS = spatially weighted calcium score. HDL = high density lipoprotein.
DISCUSSION
Many individuals have coronary artery calcium scores of zero based on the Agatston scoring method. In the MESA cohort, which was aged 45–84 years at the baseline exam, slightly more than half of the cohort had Agatston CAC = 0. Individuals with Agatston CAC = 0 are at low risk for incident CHD and CVD events, compared to individuals with Agatston CAC > 0.8 However, it is known that this risk is not absent and that some individuals with Agatston CAC = 0 develop CHD over time.21,22 We report here that a clinically underused scoring method, Spatially Weighted Calcium Score, is predictive of incident CHD events over 15 years among individuals with Agatston CAC = 0 at baseline in the MESA cohort. We also found that among these individuals, higher SWCS at baseline predicted Agatston CAC score > 0 at repeat CT scanning at either Exam 2 or Exam 3 beyond traditional CVD risk factors.
Progression of Agatston CAC score over time has previously been shown to predict incident CHD, over and above the baseline CAC score.23,24 The 10-year CHD events rates among individuals with Agatston CAC = 0 are low and have been previously reported from the MESA cohort.22 Data from other studies with different lengths of follow-up confirm this finding.25–27 However, these reports as well as the data reported here show individuals with Agatston CAC = 0 have residual risk.28 Several mechanisms for residual risk have been hypothesized, including levels of triglyceride-rich lipoproteins and their remnants, lipoprotein(a), HDL-mediated cholesterol efflux,29 and inflammation.28
Our data indicate that SWCS is a measure of residual risk for CHD over long-term follow-up. The SWCS adds to the prediction information of Agatston CAC = 0 by leveraging calcium density information in neighboring voxels. The SWCS is thus able to provide additional information on patient level CHD risk. Because of the high correlation of SWCS to Agatston CAC score among individuals with Agatston CAC > 0,12 traditional risk CVD risk factors that predict Agatston CAC score30,31 will predict SWCS as well. The relationship of traditional risk factors, other than cholesterol level, to Agatston CAC score appears to be weaker in younger individuals.32 The degree to which newer, residual CVD risk factors are associated with SWCS remains to be investigated.
Identifying individuals with CAC = 0 who remain at risk of developing CHD could contribute to refinement of cardiovascular disease guidelines and clinical practice. A recent analysis showed that the average time period to CAC > 0 among MESA participants with mean age 58 years and CAC = 0 at baseline ranged from 3 to 7 years of age.33 The authors concluded that a 3 to 5-year time frame seemed reasonable to recommend repeating CT scanning among individuals of similar age to MESA and with CAC = 0. Repeating a CT scan, however, involves cost and radiation exposure. Maximizing the information already available in the baseline exam among those with CAC = 0 to predict who will convert to CAC > 0 may help to delay the need to repeat a CT scan.
An important question is whether the risk throughout SWCS levels among those with CAC = 0 is linear or if there is a threshold (a level below which there is no residual risk for CHD). In the quartile analysis, while the unadjusted model showed similar risk for quartiles 1 and 2, the adjusted models showed a progressive increased risk, suggesting no threshold. Additional research with longer follow-up, in different populations, and with larger sample sizes would be needed to further evaluate the shape of the dose-response relationship between SWCS and CHD.
Validated measures of subclinical CVD and CHD in younger individuals are lacking. Agatston CAC score is the best validated measure of subclinical CHD, but presence of Agatston CAC is strongly related to age and Agatston CAC score is commonly zero in younger individuals. Carotid intima-medial thickening has been extensively investigated as a subclinical measure but is at best weakly predictive for CHD events specifically as well as for CVD events more generally, in most studies.9,34,35 Thus, SWCS may have a useful role as a subclinical measure of CHD, particularly in younger individuals in whom longer term risk is of interest. For instance, in young adults, SWCS could be useful to investigate novel and established risk factors for CHD risk as well as the potential effects of prevention interventions in altering atherosclerosis progression.
By leveraging calcium density information available in neighboring voxels, the SWCS is able to assign quantitative scores to individuals with Agatston CAC = 0, thus supporting risk prediction in this group. An additional advantage of SWCS compared to the Agatston score is that it is continuous through the origin and normally distributed on the logarithmic scale. The SWCS thus avoids the statistical challenges in modeling the Agatston score, which is sometimes referred to as a zero-inflated variable and requires two-part models.36 These models can be complex, especially in describing associations between covariates and CAC progression or development.36
Other strengths include the rigorous follow-up and adjudication of incident CHD events in the MESA study, the well characterized set of covariates, and the length of follow-up available. The long-term follow-up is especially important in light of the very small number of CHD events that occurred in individuals with Agatston CAC = 0 during the first five years of follow-up. Of equal importance is that even in this group, a significant number of events occurred during the ensuing 10 years of observation.
Limitations include the relatively small number of incident events occurring in individuals with Agatston CAC=0, which limits power to detect possible differences by gender or race/ethnicity. Neither of these variables met criteria for inclusion in the final multivariable model. MESA participants were not all scanned at each Exam, some having a second scan at Exam 2 and others at Exam 3, and without subsequent scanning. Another limitation is that different scanner types were used at different MESA field centers. However, these scanners were phantom-calibrated17 and previously reported findings have shown that differences in scanner type did not contribute importantly to differences in scores.8 We also note that it is possible that use of thinner CT slices for image reconstruction might allow detection of micro-calcification in those with measured Agatston scores = 0. However, increased noise becomes a significant concern with thinner slices, especially as the kv and ma are fixed and adjusted for 2.5–3.0 mm slice thickness.
In summary, SWCS is a novel calcium scoring method that assigns numerical values to individuals with Agatston CAC = 0. SWCS predicts incident CHD events and conversion from Agatston CAC = 0 to > 0 in fully adjusted models. SWCS may be a useful subclinical phenotype and marker of CHD risk with Agatston CAC = 0, particularly in younger individuals in whom Agatston CAC score is often zero and for whom longer term risk is of interest. The potential role of SWCS or other alternative methods for scoring coronary calcium in risk prediction merits further research.
CLINICAL PERSPECTIVE.
Calcification in response to inflammation in coronary artery plaque can be measured quantitatively by CT scanning. The most widely used scoring system is the Agatston coronary artery calcium (CAC) score. Agatston CAC score has been shown to be highly predictive for coronary heart disease (CHD) events and is widely used in risk stratification, particularly in individuals who are at intermediate risk for CHD based on traditional risk factors. A limitation of the Agatston CAC score is that many individuals have scores of zero, especially younger individuals. The Agatston CAC score does not use all of the calcium density information in the CT scan, and an alternative scoring method, termed spatially weighted coronary calcium score (SWCS), has been used to assign quantitative scores to individuals with Agatston CAC=0. Here we report that among individuals with Agatston CAC=0, the SWCS score predicted incident CHD events over 15 years, as well as progression from Agatston CAC=0 to Agatston CAC > 0. Thus, SWCS may be a clinically useful subclinical phenotype and marker of CHD risk, particularly among younger individuals in whom Agatston CAC score is often zero and for whom longer term risk is of interest.
Acknowledgments
The authors thank the other investigators, the staff, and the participants of the MESA study for their valuable contributions. A full list of participating MESA investigators and institutions can be found at http://www.mesa-nhlbi.org.
Sources of Funding
This research was supported by contracts 75N92020D00001, HHSN268201500003I, N01-HC-95159, 75N92020D00005, N01-HC-95160, 75N92020D00002, N01-HC-95161, 75N92020D00003, N01-HC-95162, 75N92020D00006, N01-HC-95163, 75N92020D00004, N01-HC-95164, 75N92020D00007, N01-HC-95165, N01-HC-95166, N01-HC-95167, N01-HC-95168 and N01-HC-95169 from the National Heart, Lung, and Blood Institute, and by grants UL1-TR-000040, UL1-TR-001079, and UL1-TR-001420 from the National Center for Advancing Translational Sciences (NCATS).
Abbreviations
- CAC
Coronary artery calcium
- CHD
Coronary heart disease
- CI
Confidence interval
- CT
Computerized tomographic
- HDL
High density lipoprotein
- ln
Natural logarithm
- MESA
Multi-Ethnic Study of Atherosclerosis
- MI
Myocardial infarction
- SD
Standard deviation
- SWCS
Spatially weighted calcium score
Footnotes
Disclosures
S. Shea: Funding from NHLBI.
A. Navas-Acien: Funding from NIEHS (R01ES028758, P42ES010349, P30ES009089) and NHLBI (1R01HL134149).
D. Shimbo: Funding from NHLBI.
E. Brown:
M. Bancks: Funding from NHLBI.
R. G. Barr: Funding from NHLBI.
R. Kronmal: Funding from NHLBI.
References
- 1.Ross R Atherosclerosis—an inflammatory disease. New Engl J Med 1999;340:115–26. [DOI] [PubMed] [Google Scholar]
- 2.Hansson GK. Inflammation, atherosclerosis, and coronary artery disease. New Engl J Med 2005;352:1685–95. [DOI] [PubMed] [Google Scholar]
- 3.Libby P, Ridker PM, Maseri A. Inflammation and atherosclerosis. Circulation 2002;105:1135–43. [DOI] [PubMed] [Google Scholar]
- 4.Tall AR, Yvan-Charvet L. Cholesterol, inflammation and innate immunity. Nat Rev Immunol 2015;15:104. [DOI] [PMC free article] [PubMed] [Google Scholar]
- 5.Kasikara C, Doran AC, Cai B, Tabas I. The role of non-resolving inflammation in atherosclerosis. J Clin Investigation 2018;128:2713–23. [DOI] [PMC free article] [PubMed] [Google Scholar]
- 6.Aikawa E, Nahrendorf M, Figueiredo J-L, Swirski FK, Shtatland T, Kohler R, Jaffer FA, Aikawa M, Weissleder R. Osteogenesis associates with inflammation in early-stage atherosclerosis evaluated by molecular imaging in vivo. Circulation 2007;116:2841–50. [DOI] [PubMed] [Google Scholar]
- 7.Agatston AS, Janowitz WR, Hildner FJ, Zusmer NR, Viamonte M, Detrano R. Quantification of coronary artery calcium using ultrafast computed tomography. J Am Coll Cardiol 1990;15:827–32. [DOI] [PubMed] [Google Scholar]
- 8.Detrano R, Guerci AD, Carr JJ, Bild DE, Burke G, Folsom AR, Liu K, Shea S, Szklo M, Bluemke DA. Coronary calcium as a predictor of coronary events in four racial or ethnic groups. New Engl J Med 2008;358:1336–45. [DOI] [PubMed] [Google Scholar]
- 9.Folsom AR, Kronmal RA, Detrano RC, O’Leary DH, Bild DE, Bluemke DA, Budoff MJ, Liu K, Shea S, Szklo M. Coronary artery calcification compared with carotid intima-media thickness in the prediction of cardiovascular disease incidence: the Multi-Ethnic Study of Atherosclerosis (MESA). Arch Intern Med 2008;168:1333–9. [DOI] [PMC free article] [PubMed] [Google Scholar]
- 10.Goff DC, Lloyd-Jones DM, Bennett G, Coady S, D’Agostino RB, Gibbons R, Greenland P, Lackland DT, Levy D, O’Donnell CJ. 2013 ACC/AHA guideline on the assessment of cardiovascular risk: a report of the American College of Cardiology/American Heart Association Task Force on Practice Guidelines. Circulation 2014;129:S49–S73. [DOI] [PubMed] [Google Scholar]
- 11.Grundy SM, Stone NJ, Bailey AL, Beam C, Birtcher KK, Blumenthal RS, Braun LT, de Ferranti S, Faiella-Tommasino J, Forman DE. 2018 AHA/ACC/AACVPR/AAPA/ABC/ACPM/ADA/AGS/APhA/ASPC/NLA/PCNA guideline on the management of blood cholesterol: a report of the American College of Cardiology/American Heart Association Task Force on Clinical Practice Guidelines. Circulation 2019;139:e1082–e143. [DOI] [PMC free article] [PubMed] [Google Scholar]
- 12.Liang CJ, Budoff MJ, Kaufman JD, Kronmal RA, Brown ER. An alternative method for quantifying coronary artery calcification: the Multi-Ethnic Study of Atherosclerosis (MESA). BMC Med Imaging 2012;12:14. [DOI] [PMC free article] [PubMed] [Google Scholar]
- 13.Bild DE, Bluemke DA, Burke GL, Detrano R, Diez Roux AV, Folsom AR, Greenland P, JacobsJr DR, Kronmal R, Liu K. Multi-Ethnic Study of Atherosclerosis: objectives and design. Am J Epidemiol 2002;156:871–81. [DOI] [PubMed] [Google Scholar]
- 14.Perloff D, Grim C, Flack J, Frohlich ED, Hill M, McDonald M, Morgenstern BZ. Human blood pressure determination by sphygmomanometry. Circulation 1993;88:2460–70. [DOI] [PubMed] [Google Scholar]
- 15.Joint National Committee on Prevention D, Evaluation, and Treatment of High Blood Pressure. The 6th Report of the Joint National Committee on Prevention, Detection, Evaluation, and Treatment of High Blood Pressure. Arch Intern Med 1997;157:2413–46. [DOI] [PubMed] [Google Scholar]
- 16.Mellitus TECotDaCoD. Follow-up report on the diagnosis of diabetes mellitus: the Expert Committee on the Diagnosis and Classifications of Diabetes Mellitus. Diabetes Care 2003;26:3160–7. [DOI] [PubMed] [Google Scholar]
- 17.Carr JJ, Nelson JC, Wong ND, McNitt-Gray M, Arad Y, Jacobs DR Jr, Sidney S, Bild DE, Williams OD, Detrano RC. Calcified coronary artery plaque measurement with cardiac CT in population-based studies: standardized protocol of Multi-Ethnic Study of Atherosclerosis (MESA) and Coronary Artery Risk Development in Young Adults (CARDIA) study. Radiology 2005;234:35–43. [DOI] [PubMed] [Google Scholar]
- 18.McClelland RL, Jorgensen NW, Budoff M, Blaha MJ, Post WS, Kronmal RA, Bild DE, Shea S, Liu K, Watson KE. 10-year coronary heart disease risk prediction using coronary artery calcium and traditional risk factors: derivation in the MESA (Multi-Ethnic Study of Atherosclerosis) with validation in the HNR (Heinz Nixdorf Recall) study and the DHS (Dallas Heart Study). J Am Coll Cardiol 2015;66:1643–53. [DOI] [PMC free article] [PubMed] [Google Scholar]
- 19.Xu Y, Cheung Y, Lam K, Tan S, Milligan P. A simple approach to the estimation of incidence rate difference. Am J Epidemiol 2010;172:334–43. [DOI] [PMC free article] [PubMed] [Google Scholar]
- 20.Wooldridge JM. Heteroskedasticity-Robust Inference after OLS Estimation. Introductory Econometrics: A Modern Approach (Fourth ed) 2009; Mason: South-Western:265–71. [Google Scholar]
- 21.Budoff MJ, McClelland RL, Nasir K, Greenland P, Kronmal RA, Kondos GT, Shea S, Lima JA, Blumenthal RS. Cardiovascular events with absent or minimal coronary calcification: the Multi-Ethnic Study of Atherosclerosis (MESA). Am Heart J 2009;158:554–61. [DOI] [PMC free article] [PubMed] [Google Scholar]
- 22.Joshi PH, Blaha MJ, Budoff MJ, Miedema MD, McClelland RL, Lima JA, Agatston AS, Blankstein R, Blumenthal RS, Nasir K. The 10-year prognostic value of zero and minimal CAC. JACC Cardiovasc Imaging 2017;10:957–8. [DOI] [PubMed] [Google Scholar]
- 23.Budoff MJ, Young R, Lopez VA, Kronmal RA, Nasir K, Blumenthal RS, Detrano RC, Bild DE, Guerci AD, Liu K. Progression of coronary calcium and incident coronary heart disease events: MESA (Multi-Ethnic Study of Atherosclerosis). J Am Coll Cardiol 2013;61:1231–9. [DOI] [PMC free article] [PubMed] [Google Scholar]
- 24.Radford NB, DeFina LF, Barlow CE, Lakoski SG, Leonard D, Paixao AR, Khera A, Levine BD. Progression of CAC score and risk of incident CVD. JACC Cardiovasc Imaging 2016;9:1420–9. [DOI] [PubMed] [Google Scholar]
- 25.Keelan PC, Bielak LF, Ashai K, Jamjoum LS, Denktas AE, Rumberger JA, Sheedy I, Patrick F, Peyser PA, Schwartz RS. Long-term prognostic value of coronary calcification detected by electron-beam computed tomography in patients undergoing coronary angiography. Circulation 2001;104:412–7. [DOI] [PubMed] [Google Scholar]
- 26.Nappi C, Nicolai E, Daniele S, Acampa W, Gaudieri V, Assante R, Zampella E, Segreto S, Imbriaco M, Petretta M. Long-term prognostic value of coronary artery calcium scanning, coronary computed tomographic angiography and stress myocardial perfusion imaging in patients with suspected coronary artery disease. J Nuclear Cardiol 2018;25:833–41. [DOI] [PubMed] [Google Scholar]
- 27.Budoff MJ, Shaw LJ, Liu ST, Weinstein SR, Tseng PH, Flores FR, Callister TQ, Raggi P, Berman DS, Mosler TP. Long-term prognosis associated with coronary calcification: observations from a registry of 25,253 patients. J Am Coll Cardiol 2007;49:1860–70. [DOI] [PubMed] [Google Scholar]
- 28.Matsuura Y, Kanter JE, Bornfeldt KE. Highlighting residual atherosclerotic cardiovascular disease risk. Arterioscler Thomb Vasc Biol 2019;39:e1–e9. [DOI] [PMC free article] [PubMed] [Google Scholar]
- 29.Shea S, Stein JH, Jorgensen NW, McClelland RL, Tascau L, Shrager S, Heinecke JW, Yvan-Charvet L, Tall AR. Cholesterol mass efflux capacity, incident cardiovascular disease, and progression of carotid plaque: the Multi-Ethnic Study of Atherosclerosis. Arterioscler Thromb Vasc Biol 2019;39:89–96. [DOI] [PMC free article] [PubMed] [Google Scholar]
- 30.Wong ND, Kouwabunpat D, Vo AN, Detrano RC, Eisenberg H, Goel M, Tobis JM. Coronary calcium and atherosclerosis by ultrafast computed tomography in asymptomatic men and women: relation to age and risk factors. Am Heart J 1994;127:422–30. [DOI] [PubMed] [Google Scholar]
- 31.Okwuosa TM, Greenland P, Ning H, Liu K, Bild DE, Burke GL, Eng J, Lloyd-Jones DM. Distribution of coronary artery calcium scores by Framingham 10-year risk strata in the MESA (Multi-Ethnic Study of Atherosclerosis): potential implications for coronary risk assessment. J Am Coll Cardiol 2011;57:1838–45. [DOI] [PMC free article] [PubMed] [Google Scholar]
- 32.Taylor AJ, Feuerstein I, Wong H, Barko W, Brazaitis M, O’Malley PG. Do conventional risk factors predict subclinical coronary artery disease? Results from the Prospective Army Coronary Calcium Project. Am Heart J 2001;141:463–8. [DOI] [PubMed] [Google Scholar]
- 33.Dzaye O, Dardari ZA, Cainzos-Achirica M, Blankstein R, Szklo M, Budoff MJ, Lima JA, Blumenthal RS, Nasir K, Blaha MJ. Incidence of new coronary calcification: time to conversion from CAC= 0. J Am Coll Cardiol 2020;75:1610–3. [DOI] [PMC free article] [PubMed] [Google Scholar]
- 34.Lorenz MW, Schaefer C, Steinmetz H, Sitzer M. Is carotid intima media thickness useful for individual prediction of cardiovascular risk? Ten-year results from the Carotid Atherosclerosis Progression Study (CAPS). Eur Heart J 2010;31:2041–8. [DOI] [PubMed] [Google Scholar]
- 35.Simon A, Megnien J-L, Chironi G. The value of carotid intima-media thickness for predicting cardiovascular risk. Arterioscler Thromb Vasc Biol 2010;30:182–5. [DOI] [PubMed] [Google Scholar]
- 36.Ma S, Liu A, Carr J, Post W, Kronmal R. Statistical modeling of Agatston score in Multi-Ethnic Study of Atherosclerosis (MESA). PLoS One 2010;5:e12036. [DOI] [PMC free article] [PubMed] [Google Scholar]