

SUMMARY
Extrusion is a mechanism used to eliminate unfit, excess or dying cells from epithelial tissues. The initial events guiding which cells will be selectively extruded from the epithelium are not well understood. Here we induced damage in a subset of epithelial cells in the developing zebrafish and used time-lapse imaging to examine cell and cytoskeletal dynamics leading to extrusion. We show that cell extrusion is preceded by actomyosin contractions that are pulsatile. Our data show that pulsatile contractions are induced by a junctional to medial re-localization of myosin. Analysis of cell area during contractions revealed that cells pulsing with the longest duration and highest amplitude undergo progressive area loss and extrude. While pulses were driven by local increases in tension, damage to many cells promoted an overall decrease in the tensile state of the epithelium. We demonstrate that caspase activation leads to sphingosine-1-phosphate enrichment that controls both tissue tension and pulses to dictate areas of extrusion. These data suggest the kinetics of pulsatile contractions define a key behavioral difference between extruding and non-extruding cells and are predictive of extrusion. Altogether, our study provides mechanistic insight into how localized changes in physical forces are coordinated to remove defective cells for homeostatic maintenance of living epithelial tissues.
Graphical Abstract

eTOC blurb
Atieh et al. investigate the mechanics underlying epithelial cell extrusion. They show that dynamic pulsatile contractions emerge following cellular damage and promote extrusion of apoptotic cells. Caspase activation leads to sphingosine-1-phosphate enrichment that controls both tissue tension and pulses to dictate areas of extrusion.
INTRODUCTION
Epithelial cell extrusion is a mechanically intricate tissue shaping process and occurs in instances of apoptosis, crowding and oncogenic mutations1–7. Cells to be extruded produce sphingosine-1-phosphate (S1P) that binds to its receptor S1P2 in neighboring cells, triggering actomyosin contraction at the basolateral surface of the epithelium to expel the extruding cell (Figure S1A)8. Similarly to cell division, cell extrusion is necessary to maintain tissue homeostasis as it has been suggested that inhibition of extrusion could lead to the formation of adenomas1, while excessive extrusion results in poor barrier function9. While the process of cell division has been extensively studied in vivo10, 11, much less is known about apoptotic cell extrusion due to the sporadic nature of the process: it is difficult to know when and where cells undergo apoptosis and extrude. To bypass this limitation, extrusion has been mostly studied during development: in Drosophila, processes such as the refinement of the notum12, ventral nerve cord13, 14 and pupal abdomen development15 are accompanied by cell delamination, ingression or extrusion, respectively. However, how cells extrude from live tissues when homeostasis is perturbed has not been well studied.
Experiments performed on cultured cells have shown that extrusion entails communication between damaged cells and their neighbors. Neighbors organize in a rosette-shaped pattern and assemble a contractile ring necessary to extrusion2. Extrusion is impaired when an oncogenic cell is surrounded by oncogenic neighbors3, 7 or when an injured cell is surrounded by non-contractile cells2. However, these experiments present a simplified situation in which damage is inflicted on a cell surrounded by healthy neighbors. How extrusion operates when injured cells neighbor each other, and how tissues decide which cells to extrude is still unknown.
To address this question, we have developed an assay that allows induction of damage in a large fraction of cells in the epidermis of zebrafish larvae16. Combined with live imaging, we followed fluorescently labeled cells prior to and during extrusion. Using this strategy, we have uncovered the appearance of actomyosin assembly/disassembly cycles which drive cellular pulses prior to extrusion. We found that cells fated to extrude pulsed with a higher duration, amplitude and area loss compared to non-extruding cells, thus uncovering a behavioral difference between the two populations. Finally, using a combination of genetic and pharmacological perturbations we altered the mechanical state of the tissue that impacted both cellular pulses and cell extrusion.
RESULTS
Epithelial damage induces pulsatile contractions that are predictive of cell extrusion
To characterize the dynamics of cell extrusion, we developed an assay that controls extrusion by specifically damaging epithelial cells: the bacterial enzyme nitroreductase (NTR) tagged with mCherry fluorescent protein17, 18 was expressed in the outer layer of epithelial cells of the zebrafish epidermis using the zc1044A GAL4 enhancer trap line (Figure S1B)16, 18. Addition of the prodrug metronidazole (MTZ) to four days post-fertilization (4dpf) larvae leads to the production of a cytotoxic DNA crosslinking agent that causes cell damage and promotes extrusion (Figure S1B). Our assay therefore allows spatial and temporal control of cell extrusion in vivo. NTR-mCherry was expressed in 95% of epithelial cells on average, but because of the mosaic nature of the UAS-GAL4 system and varying levels of expression of the enzyme across cells, not all cells are damaged or extrude at the same time. We combined this approach with fluorescently labeled F-actin (LifeAct-GFP) and used time-lapse confocal microscopy to follow cells prior to and during extrusion (Video S1; Figure 1A, S1B–D). Cells extruded apically and were characterized by a basal actin ring, surrounded by neighbors forming a rosette (Figure S1D)1, 2, 8. In addition, our videos revealed the appearance of pulsatile cell area contractions that preceded cell extrusion events (Figure 1A; Video S1).
Figure 1 – Pulsatile contractions appear following cellular damage and predict extrusion events.

A) Left: Maximum intensity projection (MIP) of a larva tail 2h post-MTZ treatment. Epithelial cells express NTR-mCherry (magenta) and LifeAct-GFP (green). Scale bar = 50µm. Magnified regions are represented by white square. Right: Time-lapse sequence of pulsing epithelial cell until extrusion. White arrowheads indicate pulsing events and red arrowheads extrusion event. Time is in hours and minutes HH:MM. See also Video S1.
B) Scatter dot graph correlating the area fold change of pulsing epithelial cells overtime. Dots represent the average area fold change +/− SD of 155 pulses of 29 cells over 9 larvae. Average values of frequency (0.0046s−1), duration (120s), relative area loss (2.5%) and relative amplitude (15%) are represented. See also Figure S1E.
C) Scatter dot graph representing the cumulative number of pulses in all epithelial cells (purple line) and the cumulative number of extrusion events (blue line). T = 0h is when live-imaging starts. Analysis was performed in n=5 larvae and dots represent average values +/− SEM.
D) Scatter dot graph representing single cell examples of the area fluctuation of an extruding cell, neighboring cell and non-extruding cell. See also Figure S1J.
E) Quantification of the duration, relative amplitude, relative area loss and frequency (from left to right) of pulses in extruding, neighboring and non-extruding cells. Analyses were performed on n= 20 cells/category over n= 5 larvae.
F) Quantification of the number of extruding cells in larvae treated with 10mM of MTZ for 2h, 10mM of MTZ for 1h or 5mM of MTZ for 2h. Results are expressed as histograms +/− SEM with all values.
G) Quantification of the duration, relative amplitude and relative area loss (from left to right) of extruding cells in larvae treated with 10mM of MTZ for 2h (same larvae than in Figure 1E), 10mM of MTZ for 1h and 5mM of MTZ for 2h. Analyses were performed on n= 13–20 cells/category over n= 5 larvae.
We first characterized dynamics of cellular shape changes during pulsing. Because the epithelium of the zebrafish epidermis is squamous, cell volume was difficult to assess. However, the thin nature of epithelial cells makes apical and basal areas usually very similar. We therefore quantified the change in apical area in single cells in timelapse videos of 1s interval using the ImageJ plugin Tissue Analyzer19. Plotting cell area from the start of contraction, to the peak (minimum area) of a pulse, to the end expansion, showed that a pulse lasted on average 2min with a frequency of 0.25–0.33min−1 (Figure 1B, S1E). At the peak, cells were contracted to about 85% of their initial area and only recovered 97.5% of their initial areal at the end expansion (Figure 1B, S1E), suggesting that pulsatile contractions in our system result in a ratchet-like process that gradually decreases cell area, similar to pulsatile contractions during development20. Extrusion occured 1–2h following pulsing (Figure 1C), raising the possibility of a causal link between the two processes. Both pulses and extrusion did not occur in DMSO-treated larvae expressing NTR, or in MTZ-treated NTR negative larvae, indicating that pulsing and extrusion are a consequence of cellular damage caused by the NTR-MTZ reaction (Figure S1F, S1G). We detected pulsing in over 85% of cells fated to extrude (Figure S1H). Only cells that extruded in the first hour following imaging did not pulse beforehand (Figure S1I). In the latter case, we cannot rule out that pulsing occurred during the 2h treatment window before imaging began. We did however observe the appearance of pulses in non-extruding cells, indicating that not all cells that pulse extrude, but rather all cells that are fated to extrude pulse beforehand.
We next sought to determine whether cells fated to extrude pulsed with specific kinetics compared to those that did not extrude. Through a retrospective analysis of 15s interval videos after MTZ addition until extrusion occurred, we distinguished three populations: extruding cells, neighboring cells (1st degree neighbors that did not extrude) and cells that would neither extrude nor be in immediate contact with an extruding cell (non-extruding cells). A similar kinetic characterization of these populations revealed that extruding cells pulsed with a higher duration and relative amplitude, leading to a higher area loss following each pulse (Figure 1D–1E, S1J). This result suggests that the dynamics by which a damaged cell pulses is predictive of whether this cell will extrude. Because pulsing leads to cumulative area loss in cells fated to extrude, the effect of damage-induced pulsing could be a reduction of cell area to a threshold that would facilitate extrusion. Indeed, only extruding cells were significantly smaller than their starting area before extrusion started (Figure S1K). Interestingly, the rate of pulsing followed the opposite trend, as non-extruding cells pulsed with a higher frequency compared to extruding cells (Figure 1E). This behavior is contrary to that of ingressing neuroblasts13 and highlights a difference between apoptotic extrusion and ingression.
To test whether pulsing occurs before more sporadic extrusion events, we treated larvae with a lower dose or a shorter delivery time of MTZ. We observed a significantly lower number of extruding cells and consequently, the epithelium retained its integrity (Video S1; Figure 1F). However, pulsatile contractions in extruding cells were similar in all conditions (Figure 1G), indicating that it is the dynamics of pulses that predict whether a cell will extrude, regardless of the number of damaged cells in the tissue.
Altogether, these data show that cell extrusion in vivo is preceded by pulsatile contractions that are predictive of cell extrusion as they define a behavioral difference between extruding and non-extruding cells.
Pulsatile contractions are a cell-level behavior but induce area changes across neighbors
Cell extrusion depends on the formation of a basolateral actomyosin ring in neighboring cells that contracts to squeeze extruding cells out of the epithelium (Figure S1A)1–3. While this mode of cell contraction has been well studied, it is not clear whether it bares similarities to the pulsatile contractions uncovered here. Cell area measurements reveal the shape changes associated with pulsing at the cell scale, but may miss patterns of contraction at sub-cellular, or larger tissue scales, making, in particular, the role of neighbors difficult to assess.
We therefore characterized cell deformations using particle image velocimetry (PIV). This allows quantitative analysis of tissue movements (velocity vectors) and area changes (convergence/contraction and divergence/expansion). Measurements of cellular and subcellular shape changes showed that F-actin structures were persistent in the medial and junctional regions of cells compared to dynamic and fast-recycling myosin (Figure S2A). Summing the total convergence and divergence of cells during pulsing revealed a time course that matched segmented cell area measurements: a high rate of convergence of −5.10−3s−1 as cell area reduced transitioned to a divergence of 3.10−3s−1 as cells expanded at a slower rate (Figure 2A). Neighboring cells displayed the same trends in convergence/divergence movements with a lower amplitude, suggesting coordination between pulsing cells and their neighbors.
Figure 2 – Pulsatile contractions are a cell-level behavior but induce area changes across neighbors.
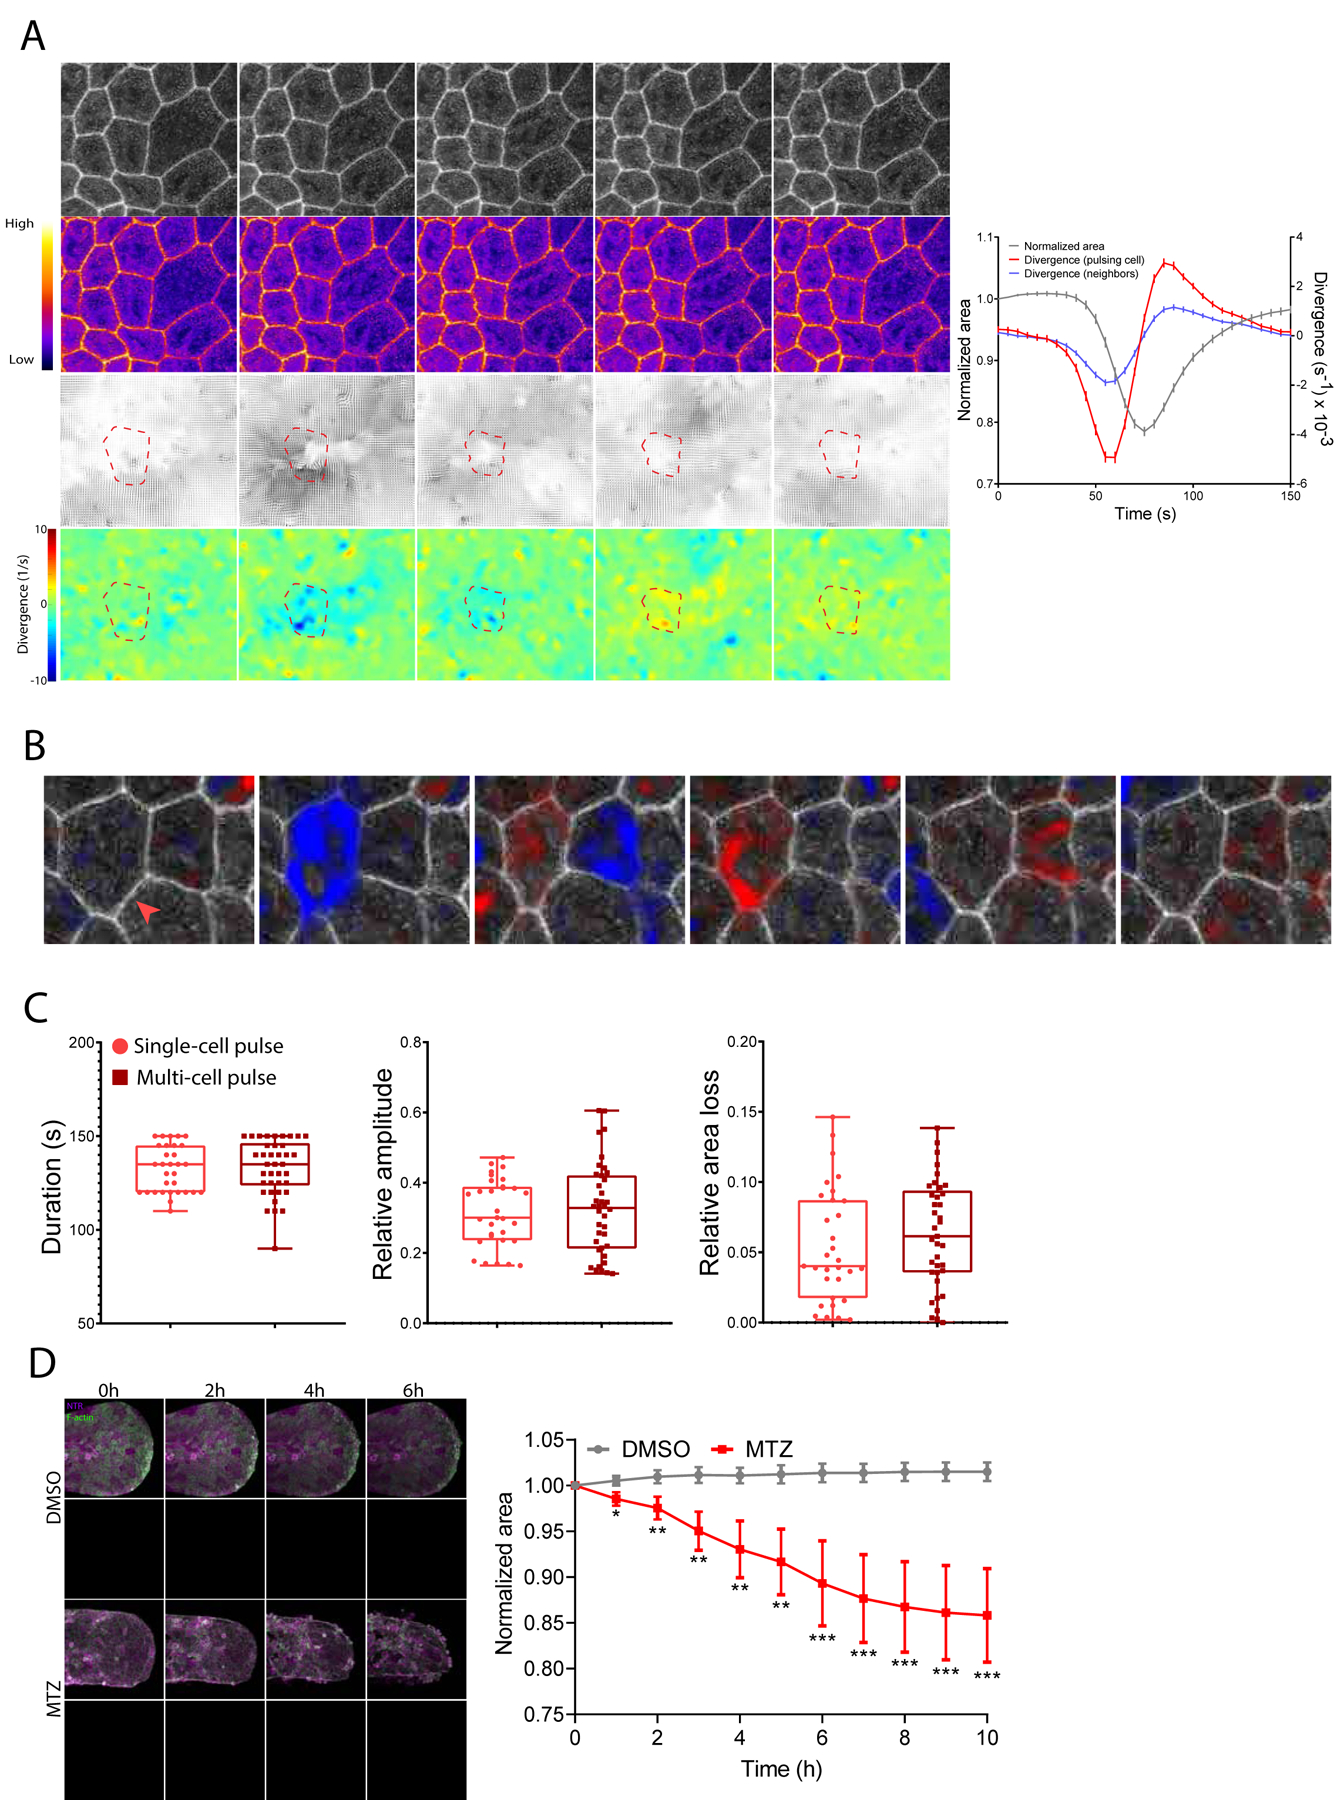
A) Left: Time-lapse sequence of pulsing epithelial cells expressing LifeAct-GFP. Time is in minutes and seconds MM:SS. Scale bar = 20µm. Third panel represents flow fields where the length of the arrows is proportional to convergence/divergence. Lower panel represents convergence/divergence maps where convergence is blue and divergence is red. Color code gives the amplitude of convergence/divergence in s−1. Dashed red line represents the outline of tracked pulsing cell. Right: Scatter dot graph correlating the area fold change (left axis; grey line as given by segmentation in Tissue Analyzer), divergence from a pulsing cell (right axis; red line) and neighboring cells (right axis; blue line). Dots represent average values of convergence/divergence of 182 pulses +/− SEM in n=3 larvae.
B) Time-lapse sequence of epithelial cells expressing LifeAct-GFP. Overlaid color map represents convergence/divergence field where blue is convergence and red is divergence. Red arrow indicates the first pulsing cell and white arrow indicates neighboring cell that pulses afterwards. Scale bar = 20µm. Time is in minutes and seconds MM:SS. See also Video S2 and Figure S2B, S2C.
C) Quantification of the duration, relative amplitude and relative area loss of single-cell pulses vs multi-cell pulses. Analyses were performed on n= 10 cells/category over n= 3 larvae.
D) Left: Time-lapse sequence of MIPs of larva tails where epithelial cells express NTR-mCherry (magenta) and LifeAct-GFP (green). Dotted white lines represent the contour of the tails. Time is in hours. Scale bar = 100µm. Right: Scatter dot graph correlating the area fold change of DMSO-treated larvae and MTZ-treated larvae. Analysis was performed on n=10 larvae/condition and dots represent average values +/− SEM.
To test this and more precisely visualize which regions were contracting, we applied an image thresholding technique to the divergence maps. This revealed that pulses occurred as both ‘single cell’ (28%+/−10%) and ‘multi-cell’ pulses (72%+/−10%) (Video S2; Figure 2B, S2B, S2C). In single cell pulses, regions of contractility aligned closely to the shape of the cell (Figure S2B), covering on average 81+/−11% of cell area while only 13+/−9% of the pulse region spilled into neighbors (n = 60 cells, N = 3 larvae).
In multi-cell pulses, two or more neighboring cells were found to be contracting during overlapping time periods (Figure 2B, S2C). Pulses were, however, still a cell-level behavior. Despite contractile regions covering larger areas of tissue, they still followed cell boundaries: most of the pulsing cells’ areas were covered by the region (79+/−10%) and only a small percentage (11+/−8%) spilled into neighboring cells (n = 150 cells, N = 3 larvae). Pulsing kinetics were independent of cells contracting alone or as part of a group, as contractions exhibited similar duration, amplitude and area loss in both multi- and single-cell pulses (Figure 2C). Pulsing is therefore predominantly a cell-level behavior, as opposed to subcellular- or tissue-level behaviors, in which the shape and size of contractions would not overlap so closely with cell boundaries.
Simultaneous contraction of all neighbors was never observed in multi-cell pulses, unlike the concerted action of neighboring cells during extrusion. Instead, multi-cell pulses appeared in a small number of neighbors and often travelled sequentially across the tissue (Video S2; Figure 2B), suggesting some level of coordination between cells. Multi-cell pulses occurred too frequently to be the result of independent single-cell pulses overlapping by chance. If the same number of pulses were distributed randomly in the tissue over a set time period, only 11+/−6% would be expected to overlap by chance to form multi-cell pulses, whereas we observed this occurred 72+/−10% of the time. Further, while regions of convergence/divergence were confined to individual pulsing cells, the velocity magnitude (displacement over time) of neighbors was similar to that of pulsing cells during a contraction (Figure S2D). Therefore, while pulsing was generated autonomously, the mechanical state of the tissue is such that forces cause deformations over multiple cells. Because pulsatile contractions display a ratchet-like behavior, this would suggest that area loss in a group of cells would induce area loss at the tissue scale. Indeed, the surface area of the epithelium decreased following damage to 85% of its initial size (Figure 2D). Area decrease occurred as soon as 1h after imaging began, but before extrusion started, indicating that initial area loss was due to pulsing rather than loss of cells from the tissue. Together, these results reveal that pulses drive deformations that span several cell rows, leading to intercellular area reduction and tissue shape change.
Cellular damage correlates with a decrease in tension at the tissue scale and the appearance of tension hotspots that induce pulsatile contractions
Pulsatile contractions have been observed in many biological contexts and usually depend on the medial assembly of myosin II minifilaments20–25. In contrast, cell extrusion depends on the formation of a junctional actomyosin that contracts to eject the cell from the epithelium (Figure S1A, S1D)1–3. We next asked which mode of actomyosin organization occurred in the pulses uncovered here.
To determine whether pulses are actomyosin driven, we inhibited myosin phosphorylation and actin polymerization using the ROCK inhibitor Y-27632 and cytochalasin, respectively. Pulsatile contractions and subsequent extrusion were inhibited (Figure 3A, S3A; Video S3), indicating that actomyosin contractility is required for pulsing. We next assessed F-actin and myosin localization and dynamics during pulsing. Medial myosin foci coalesced before the peak of area contraction (Figure 3B), suggesting that myosin contraction drives cell constriction similarly to the mechanism described during Drosophila gastrulation20, 26. Myosin foci accumulated at the cells’ apical side (Figure S3B), reminiscent of apical actin structures prior to apoptotic extrusion27. Importantly, neighboring cells did not accumulate myosin foci (Figure S3C), indicating no active contractility originating from these cells as suggested by our previous results. While medial myosin was enriched prior to pulsing, junctional myosin followed the opposite trend and decreased (Figure 3B, S3D). Given our fast acquisition parameters (5s intervals), this suggests that myosin flows from the junctions to the apico-medial part of the cell prior to contractions. Fluctuations in myosin fluorescence were due to a change in molecular concentration, as videos using larvae with membrane localized GFP showed that pulses did not correspond to changes in slow-recycling junctional fluorescence (Figure S3E).
Figure 3 – Tension at the tissue scale is reduced following damage but increases locally to produce pulsing.

A) Quantification of the relative amplitude of pulses in larvae treated with MTZ vs MTZ+Y-27632 (left) or MTZ vs MTZ+cytochalasin (right). See also Video S3 and Figure S3A for analysis of the number of extruding cells.
B) Left: Time-lapse sequence of a pulsing cell expressing Myosin II-GFP. Purple and yellow colors represent low and high fluorescence intensities respectively. Time is in minutes and seconds MM:SS. Right: Scatter dot graph correlating the area fold change (left axis; grey line) and myosin fluorescence fluctuation (left axis, red and pink lines) of pulsing cells. Analysis was performed on n=3 larvae and dots represent average values of 79 pulses +/− SEM. Blue arrowheads indicate the peak value of each curve. Green brackets represent the increase in junctional myosin fluorescence at the end of pulsing. See figure S3D for data from single cells.
C) Left: Time-lapse sequence of a pulsing cell expressing LifeAct-GFP. Purple and yellow colors represent low and high fluorescence intensities respectively. Time is in minutes and seconds MM:SS. Right: Scatter dot graph correlating the area fold change (left axis; grey line) and F-actin fluorescence fluctuation (right axis; red line) of pulsing cells. Analysis was performed on n=3 larvae and dots represent average values of 182 pulses +/− SEM. Green brackets represent the increase in junctional F-actin fluorescence at the end of pulsing. See figure S3F for data from single cells.
D) Time-lapse sequence of a cell expressing LifeAct-GFP where microridges dissipate overtime. Time is in hours and minutes HH:MM.
E) Left: MIP of epithelial cells expressing LifeAct-GFP before (green) and after (magenta) laser ablation. Scale bar = 40µm. Red dot represents ablated region. Right: Quantification of the recoil rate in pulsing and non-pulsing regions.
F) Left: MIP of epithelial cells expressing LifeAct-GFP before (green) and after (magenta) laser ablation. White and red lines contour cell edges before and after ablation respectively. Scale bar = 40µm. Red dot represents ablated region. Right: Quantification of the recoil rate in DMSO and MTZ-treated larvae.
G) Left: 2D slice of epithelial cells expressing NTR-mCherry (magenta). Phosphorylated myosin (P-MLC) is immunostained (green). Scale bar = 20µm. Right: Quantification of junctional P-MLC fluorescence of DMSO and MTZ-treated larvae. Analysis was performed on 10–20 cells/larva averaged over n=5–7 larvae/condition over N=3 separate experiments.
H) Quantification of the apparent stiffness of epithelia in DMSO and MTZ-treated larvae. See Figure S3I for representative AFM image.
In contrast, junctional F-actin was enriched during contraction with a peak that coincided with the minimum cell area (Figure 3C, S3F). Medial F-actin microridges dissipated overtime (Figure 3D), suggesting that these structures do not play a role in pulsing. Microridges in DMSO-treated cells did not colocalize with phosphorylated myosin (Figure S3G), and are therefore unlikely to be the sites of force generation. Although junctional F-actin and myosin fluorescence followed opposing trends during pulsing, they were both enriched at the end of each pulse compared to the start (Figure 3B, 3C). This is reminiscent of pulses in the Drosophila germband where medial myosin II flows towards the junctions28, and suggests that cells accumulate junctional actomyosin after each pulse leading to cumulative formation of the actomyosin ring and extrusion.
Changes in the structure and dynamics of the actomyosin cytoskeleton can influence the mechanical properties of epithelia and change cell and tissue shape to drive biological functions29–32. Medial myosin coalescence prior to pulsing suggests that area reduction is driven by contractile forces. We observed that cell-cell junctions exhibited a “wavy” conformation during pulsing suggesting junctions being pulled from the medial part of the cell (Figure S3H). To confirm this and rule out the possibility of compressive forces from neighboring cells, we performed laser ablation in MTZ-treated larvae on cells undergoing contraction compared to cells that were not. Ablation of both regions resulted in a recoil of the surrounding tissue, demonstrating that the tissue is under tension even when not pulsing33, 34. However, pulsing regions recoiled faster (Figure 3E), confirming that contractions are driven by increased tension.
Given that pulsing arose from the appearance of high-tension regions, we next asked whether tension was altered in damaged vs non-damaged tissues. The recoil velocity after ablation of DMSO-treated larvae was significantly higher than in MTZ-treated larvae (Figure 3F), suggesting that although pulsing is driven by local increases in tension, damage induces an overall reduction in the tensile state of the tissue. Indeed, while phosphorylated myosin was localized at the junctions in control cells, it appeared more cytoplasmic in MTZ-treated cells (Figure 3G), indicating that damage alters levels of junctional myosin, thereby lowering tension.
We confirmed this result using atomic force microscopy (AFM). This technique has the advantage of directly measuring the mechanical properties of the tissue without invasive cutting (Figure S3I). Given the quick and dynamic nature of pulses, AFM measurements on contracting vs non-contracting cells were technically challenging and we could only compare damaged vs non-damaged conditions. AFM measurements revealed a decrease in stiffness in the epithelium of MTZ-treated larvae (Figure 3H). Both the actively generated tissue tension and the tissue’s Young’s Modulus can contribute to the resistance met by the cantilever and it is challenging to decouple both effects35, 36. We therefore refer to the measure as “apparent stiffness”. The change in apparent stiffness is therefore compatible with laser ablation results. Together, these results show that damage induces an overall decrease in tension within the epithelium. In addition, tension is heterogeneous within damaged tissues, as pulsing is led by localized increases in tension generated by myosin coalescence.
Pulsatile contractions are driven by caspase activation and S1P phosphorylation
We next investigated the molecular mechanisms governing pulsatile contractions and their link to extrusion. Because our data suggest that pulses are predictive of cell extrusion, we hypothesized that both pulsing and extrusion might be downstream of the same signaling cascade2. Evaluating the levels of S1P expression following damage revealed that S1P was enriched 1h post-MTZ treatment (Figure 4A), preceding cell extrusion and correlating with the appearance of pulses (−1h on Figure S1C). Enrichment in S1P was significantly reduced following sphingosine-kinase 1 inhibition (Figure S4A), and both pulsing and extrusion were inhibited (Figure 4B, 4C, Video S4), indicating that S1P phosphorylation governs both pulsatile contractions and extrusion.
Figure 4 – Pulsatile contractions are driven by caspase activity and S1P phosphorylation.

A) Upper: MIP of the tail of larvae treated with MTZ overtime. Epithelial cells express NTR-mCherry (magenta) and S1P is immunostained (green). Scale bar = 100µ m. Lower: Scatter dot graph correlating S1P fluorescence of DMSO and MTZ-treated larvae where t = −2h represents addition of MTZ and t = 0 corresponds to the start of microscope acquisition. Analysis was performed on n=30–40 larvae/condition and dots represent average values +/− SEM. See Figure S4A for control analyses of S1P fluorescence.
B) Quantification of the relative amplitude of pulses in larvae treated with MTZ vs MTZ+SKI. See also Video S4.
C) Quantification of the number of extruding cells in larvae treated with MTZ vs MTZ+SKI. See also Video S4.
D) Quantification of the relative amplitude of pulses in NTR vs NTR+Bcl2 overexpressing larvae treated with MTZ.
E) Quantification of the number of extruding cells in in NTR vs NTR+Bcl2 overexpressing larvae treated with MTZ. See Figure S4B, S4C for control analyses of S1P fluorescence and caspase 3 positive cells.
F) Quantification of the relative amplitude of pulses in larvae treated with MTZ, MTZ+Apoptosis Inhibitor (NS3694), and MTZ+zDVED. See also Video S4.
G) Quantification of the number of extruding cells in larvae treated with MTZ, MTZ+Apoptosis Inhibitor (NS3694) and MTZ+zDEVD. See also Video S4. See Figure S4D, S4E for control analyses of S1P fluorescence and caspase 3 positive cells.
H) Left: Time-lapse sequence of epithelial cells from larva treated with MTZ and soaked in NucView 405. Epithelial cells express LifeAct-GFP (green) and cleaved caspase 3 is fluorescently labelled (Magenta). Scale bar = 20µm. Time is in hours and minutes HH:MM. See also Video S5. Right: Scatter dot graph representing the number of caspase 3+ cells overtime. Analysis was performed on n=6 larvae and dots represent average values +/− SEM. See Figure S4F for immunofluorescence-based quantification of caspase 3 positive cells.
To block putative damage signals that would promote S1P phosphorylation, we genetically overexpressed Bcl2 under the hsp70l promoter8. Following exposure to increased temperature to induce Bcl2 expression and EGFP membrane fluorescence, S1P phosphorylation and caspase 3 activity were abolished, and pulsing and subsequent extrusion were abrogated (Figure 4D–E, S4B–C).
As Bcl2 overexpression inhibited caspase 3 cleavage (Figure S4C), we addressed the role of caspase activity in pulsing. We used an inhibitor of caspase activity (z-DEVD-fmk) as well as a suppressor of the formation of the apoptosome (NS3694), both of which reduced the amount of detectable cleaved caspase 3 (Figure S4D). Both pulsing and extrusion were inhibited (Video S4, Figure 4F–4G), indicating that caspase activation induced pulsatile contractions and extrusion as shown in cultured cells2. Both inhibitors also reduced S1P levels (Figure S4E), indicating that caspase activation induces S1P phosphorylation37. Tracking the expression levels of cleaved caspase 3 through both antibody staining and a fluorescent indicator dye revealed that cleaved caspase 3 was only detected 1–2h post-imaging following extrusion (Video S5; Figure 4H, S4F). It is therefore likely that initiator caspases such as caspase 9 and/or caspase 838 are responsible for increased levels of S1P and pulsing, while caspase 3 cleavage happens later, after extrusion has started. Importantly, caspase activation has been shown to reduce cell volume39, suggesting that the reduction in tissue area in our system (Figure 2D) could be the result of both early caspase activity and/or the ratcheting behavior of cells following each pulse. Altogether, these results show that damage signals lead to caspase activity that induces S1P phosphorylation, which in turn leads to pulsing and extrusion.
Damage signals and S1P phosphorylation induce tension reduction within the epithelium
Because pulsatile contractions also correlate with a change in tissue tension (Figure 3F, 3H), we next addressed whether S1P phosphorylation could also alter tension within the epithelium. Both inhibition of S1P phosphorylation and Bcl2 overexpression restored the tension and apparent stiffness of the epithelium (Figure 5A–5D) to levels similar to that observed in DMSO-treated tissues (Figure 3F, 3H).
Figure 5 -. Caspase activation and S1P phosphorylation alter the mechanical state of the tissue following damage.

A) Quantification of the apparent stiffness of epithelia of larvae treated with MTZ vs MTZ+SKI.
B) Quantification of the apparent stiffness of epithelia in NTR vs NTR+Bcl2 overexpressing larvae treated with MTZ.
C) Quantification of the recoil rate in MTZ vs MTZ+SKI treated larvae.
D) Quantification of the recoil rate in NTR vs NTR+Bcl2 overexpressing larvae treated with MTZ.
E) Quantification of the recoil rate in MTZ, MTZ+Y-27632, or MTZ+cytochalasin treated larvae.
F) Quantification of the recoil rate in MTZ vs MTZ+BAPTA treated larvae.
G) Quantification of the relative amplitude of pulses in MTZ vs MTZ+BAPTA treated larvae. See also Video S6.
H) Quantification of the number of extruding cells in MTZ vs MTZ+BAPTA treated larvae. See also Video S6.
I) Upon MTZ treatment, damaged epithelial cells get enriched in S1P. Damage and S1P enrichment lead to decrease in tension within the tissue and induce pulsatile contractions through medio-apical myosin coalescence. Cells that pulse with higher dynamics and are under the highest amount of tension preferentially extrude.
These results suggest that tension reduction rather than pulsing could lead to extrusion. To answer this question, we reduced tension in MTZ-treated larvae and assessed the consequence on pulsing and extrusion. Targeting actin polymerization or myosin phosphorylation leads to reduced tension (Figure 5E), however we could not accurately evaluate the effect on pulsing and extrusion as both processes depend on the formation of myosin coalescence and actomyosin ring formation, respectively. We utilized the tetrasodium salt BAPTA, a calcium chelator, to disrupt cell-cell contacts and decrease tension40. Because BAPTA is not cell permeant, it only affects extracellular calcium thus circumventing potential side- effects due to reduction of intracellular calcium levels. Recoil rate was reduced in larvae treated with BAPTA (Figure 5F), indicating that disrupting cell-cell junctions alters tension40. When adding BAPTA to non-damaged larvae, we detected pulses in a small number of cells (Video S6). Here, pulsing could emerge either as a consequence of tension reduction or altered contractility following adherens junction disruption41. Pulsing cells did not extrude in this context, suggesting that tension reduction is not sufficient to induce extrusion as previously suggested42, 43, and that further damage signals (e.g. caspase activity and S1P enrichment) are required. In support of this, combining BAPTA and MTZ treatments revealed an increase in pulse amplitude and consequently extrusion (Video S6; Figure 5G, 5H). The number of extrusion events here was evaluated during the first 3h of imaging, before delamination of the epithelium.
These results show that Bcl2 expression and S1P phosphorylation reduce tension in epithelia. While tension decrease is not sufficient to promote extrusion, coupling caspase activity with reduced tension increases pulsing and thereby promoting extrusion.
DISCUSSION
Pulsatile contractions occur during development and homeostasis and have been suggested to drive morphogenetic cell and tissue shape changes20, 21, 23, 44–46. In the context of cell extrusion, pulses have been described during neuroblast ingression13, 14 and larval epidermal cell extrusion15, suggesting that this process is conserved across organisms and physiologically relevant for cell elimination. Yet, whether pulsing plays a role in promoting apoptotic cell extrusion was unknown. Our study describes a novel context for pulsing when homeostasis is perturbed and establishes pulses as a predictive mechanism of cell extrusion. We show that cells fated to extrude pulse with a longer duration and a higher amplitude compared to their neighbors, thus displaying net area losses following each contraction. While cell area returned to its initial value after the release of short pulses in non-extruding cells, longer pulses produced irreversible area changes leading to extrusion. This could be a consequence of viscous dissipation of stress: due to the viscoelastic properties of epithelia, pulses of force of sufficient duration can result in persistent deformations of cells that escape elastic recoil once forces are no longer applied44. A recent study utilized optogenetic-induction of RhoA at cell-cell junctions to modulate the duration of pulsing in Caco-2 cells and showed that irreversible junction shortening is achieved following long timescale activation47. Increased frequency of pulsing did not affect junction length in this context47, supporting our results that extruding cells do not pulse with the highest frequency.
In our experiments, while both extruding and non-extruding cells pulsed, it was only in extruding cells that the small area losses following individual pulses accumulated to result in large area reductions. This suggests that damage signals may alter actomyosin dynamics in order to produce larger and longer pulses that are more effective at reducing area. Indeed, before extrusion onset, these cells had lost on average 40% of their initial area and were significantly smaller than cells that would not extrude. This raises the possibility that the function of pulsing is to reduce cell area, resulting in a cell shape more amenable for extrusion. Since contraction during pulsing stretches the surrounding tissue, it will be interesting to ask whether pulsing cells could compete with each other to reduce cell area and ultimately extrude the most damaged cells. Importantly, cell area loss does not negate the requirement of the actomyosin ring during extrusion2. Given that both pulsing and ring formation are driven by the actomyosin cytoskeleton, it would be difficult to decouple both processes. A recent study suggests that apical and junctional contractility are controlled by distinct RhoGEFs during morphogenesis of the Drosophila ectoderm48. It will be interesting to test whether specific myosin activators act on inducing pulsatile contractions vs ring formation.
While pulses were driven by local increases in tension, AFM and laser ablation experiments showed that damage reduced overall tissue tension following a decrease in junctional myosin. This could be due to a caspase-dependent downregulation of E-cadherin levels49 which would then influence myosin localization and cell contractility41, 50. In support of this, we found reducing tension through perturbation of cell-cell junctions induced pulsing. Although this is likely due to the formation of myosin clusters following E-cadherin reduction50, tension reduction could also facilitate area reduction as pulses would meet less resistance from the surrounding tissue.
Changes in the mechanical properties of damaged epithelia and extruding cells could be attributed to characteristic features of cell death, such as externalization of phosphatidylserines following membrane flipping51. However, this event takes place in late stages of extrusion together with caspase cleavage2, 52. Conversely, we show that pulsing and tension reduction occur before the onset of extrusion, suggesting that the signaling pathway leading to mechanical changes in epithelia and pulsing are upstream of extrusion. Phosphorylation of the bioactive lipid S1P is the first known step of the extrusion cascade8. We show that caspase activation induces S1P phosphorylation which in turn promotes pulsing and extrusion and reduces tension across the epithelium. How this signaling is achieved, and whether caspase activation leads to stimulation of sphingosine kinase will be important to investigate.
Although S1P has been shown to specifically localize to basally extruding oncogenic cells53, our results show a homogeneous distribution of S1P throughout the epithelium, suggesting a permissive rather than localized role of S1P during extrusion. S1P secretion results in the formation of spatial gradients through activation of S1P receptors both in neighboring cells and in an autocrine fashion54–56, supporting the notion that S1P could spread in the tissue and stimulate pulsing in all cells regardless of their fate to extrude. This is in line with our observation that pulses appear to be transmitted and travel sequentially across neighbors. This behavior is reminiscent of the calcium waves observed in oncogenic cells prior to extrusion6. As calcium fluxes have also been shown to induce pulsing during neural tube closure in Xenopus 57, calcium seems like a good candidate to further link pulsatile contractions, S1P phosphorylation and apoptotic cell extrusion.
In conclusion our study provides an in-depth description of epithelial cell behavior following damage: caspase activity leads to S1P phosphorylation, which induces tension reduction in the epithelium and stimulates actomyosin-based contractions. We propose that this phenomenon provides a predictive model for cell extrusion in a stochastically damaged epithelium: cells that pulse with the longest duration undergo irreversible cell shape changes to eventually extrude (Figure 5I).
STAR Methods
RESOURCE AVAILABILITY
Lead Contact
Further information and requests for resources and reagents should be directed to and will be fulfilled by the Lead Contact, George Eisenhoffer (gteisenhoffer@mdanderson.org).
Materials Availability
The transgenic zebrafish lines used in this paper are available from the Lead Contact upon request.
Data and Code Availability
The published article includes supplemental videos of the imaging datasets analyzed during this study. The raw imaging datasets and code for visualization of the divergence maps overlaid onto the microscopy data have not been deposited in a public repository, but are available from the Lead Contact upon request.
EXPERIMENTAL MODEL AND SUBJECT DETAILS
Experiments were conducted on 4 dpf larval zebrafish (Danio rerio) maintained under standard laboratory conditions with a cycle of 14 h of light and 10 h of darkness. Larvae were collected and kept in E3 larva medium at 28.5 °C and staged as described in 58. The zebrafish used in this study were handled in accordance with the guidelines of the University of Texas MD Anderson Cancer Center Institutional Animal Care and Use Committee.
METHOD DETAILS
Epithelial damage assay
The GAL4 enhancer trap line Et(Gal4-VP16)zc1044a was used to drive expression of Tg(UAS-E1b:nsfB-mCherry) and Tg(UAS-E1b:Lifeact-EGFP)utm1 in surface epithelial cells 18. The Et(Gal4-VP16)zc1044a; Tg (UAS: nfsB-mCherry) line was also used in combination with Tg(actb1:myl12.1-GFP) 40, 59, Tg(−8.0cldnB:lyn-EGFP)zf10660 or Tg((HSP70):Bcl2–2A-CAAX-EGFP). The Et(Gal4-VP16)zc1044a; Tg (UAS: nfsB-mCherry); Tg((HSP70):Bcl2–2A-CAAX-EGFP) line was heat-shocked twice, 18h and 6h prior to the experiment at 37°C for 1h. MTZ (Sigma, M3761) was made fresh for each assay at a 1M concentration diluted in dimethyl sulfoxide (DMSO). 4 dpf larvae were treated with 10mM MTZ for 2h and then imaged for 2–10h.
Time-lapse confocal microscopy
Zebrafish were anesthetized with 0.04% tricaine in E3 and mounted in 0.5% low melt agarose in a 10 mm MatTek culture dish. The mounted specimen was imaged using a Zeiss LSM 800 laser scanning confocal microscope using a 20x/0.8 NA air objective or 40×/1.1 NA water immersion objective. Fluorescence channels were recorded simultaneously using the excitation wavelengths 488nm and 561 nm. Images were recorded every 1s, 5s, 15s or 5min depending on the assay, for up to 10h. 3D stacks were obtained at a step size of 1–2µm intervals.
Analysis of cell area changes
Images were processed with Fiji (ImageJ, https://imagej.net/Fiji). Area and fluorescence analyses were performed using the plugin Tissue Analyzer 19. Briefly, Tissue Analyzer detects outlines of epithelial cells and relies on a watershed algorithm 61 to segment epithelial cells in each frame of time-lapse acquisitions. Each frame was manually verified and validated before further analysis. Post-segmentation, Tissue Analyzer provided automatic single cell tracking and analysis of parameters, notably cell area, perimeter and junction fluorescence intensity. Because zebrafish epidermal cells are very flat, it was quite difficult to assess volume changes and apical area change was analyzed instead. Single cells were analyzed in individual x/y plots and pulses were defined as periods of time above 3 consecutive time-lapses where cell area was consistently reduced and expanded. In each cell, areas were normalized to initial cell area value in order to avoid mistakes due to variations of cell sizes. Pulses were then aligned by overlapping the minimal area values to generate average area change plots (Figure 1B). Corresponding junction fluorescence values were overlaid to generate myosin, actin and claudin junctional fluorescence plots. Cytoplasmic myosin fluorescence was the difference between overall cell fluorescence and junctional fluorescence values given by Tissue Analyzer. Fluorescence values were also normalized to initial fluorescence in each cell in order to avoid mistakes due to intrinsic fluorescence intensity variations between fish and differences in time-lapse acquisitions. Onset of extrusion was defined as the last value before cell area was consistently reduced to 0. In Figure 2C, we compared the kinetics of pulsing (duration, amplitude, area loss) in single cell pulses vs single cells within collective pulses. We did not compare a pulse of a single cell to that of a total of 2–3 cells pulsing together. In Figure S3H, the minimal perimeter (dashed blue line) was measured manually as the shortest straight line between cell vertices and cell perimeter (red line) was the value given by tissue analyzer.
Pharmacological treatments
The ROCK inhibitor Y-27632 (Sigma, Y-0503) and cytochalasin B (Sigma, C-6762) were diluted in DMSO as a 100mM stocks rand were added to larvae at a concentration of 100µM. The sphingosine kinase inhibitor SKI 5C (Sigma, S8326) was diluted in DMSO as a 10mM stock and was added to larvae at a concentration of 20µ M. The Apoptosis Inhibitor (AI) (Santa Cruz, NS3694) was diluted in DMSO as a 10mM stock and was added to larvae at a concentration of 2µM. The caspase inhibitor zDEVD-fmk (Sigma, CAS210344–95–9) was diluted in DMSO as a 10mM stock and was added to larvae at a concentration of 10µM. 25 mg of BAPTA (Invitrogen; B1204) were diluted in 10mL of E3 to achieve a final concentration of 10mM. Except for BAPTA that was only added after mounting larvae in agarose, larvae were treated with the inhibitors simultaneously as MTZ, and fresh inhibitor was added after MTZ washout in both agarose and E3 for live-imaging experiments and in E3 for immunofluorescence assays. Of note, laser ablations and analyses of pulses and extrusions were performed throughout the 2h window following MTZ treatment during which cell-cell junctions and tissue integrity are not compromised, and extrusion events occur following typical rosette pattern formation
Atomic force microscopy
AFM measurements were conducted in the UT-Health Science Center AFM Core Facility using a BioScope II™ Controller (Bruker Corporation; Santa Barbara, CA). The acquisition of elastic measurements was taken with the Research NanoScope software version 7.30. This system was integrated to a Nikon TE2000-E inverted optical microscope (Nikon Instruments Inc.; Melville, NY) to facilitate the selection of specific areas on each fish. During AFM measurements zebrafish were kept alive in E3 buffer + 0.04% tricaine at room temperature and were immobilized in immersion using a 26Gx1mmx1mm grid in a 60×15mm tissue culture dish (Falcon, 353002). Because measurements were challenging and time-consuming, we were only able to perform experiments 2–3 larvae/condition/day which is why we could only compare 2 conditions together. Force curves from 5 randomly chosen points on the dorsal epithelium of each fish were registered using AFM non-conductive silicon nitride DNP-S cantilevers (fo=40–75 kHz, k=0.32 N/m, ROC=10nm) purchased from Bruker Corporation (Santa Barbara, CA). Indentation curves were probed using a ramp size of 5 µm and scan rate of 0.5 Hz, with a maximum force load of 10 nN. Each cantilever was calibrated for its laser sensitivity using the thermal oscillation method prior to each experiment. Young’s modulus was calculated by fitting to a standard Sneddon model for a triangular indenter (radius of 10 nm) and a Poisson’s ratio of 0.5 (constant for tissue samples). AFM data analysis was performed with the NanoScope Analysis data processing software (version 1.50, copyright 2015 Bruker Corporation) to estimate the Young’s Modulus for each treatment.
Tension measurements
Images were acquired with a water-immersion Plan Apo VC 60× 1.2 NA Nikon objective using a Yokogawa CSU-X1 spinning disk that is currently integrated to an inverted Nikon Ti-microscope by 3i (Intelligent Imaging Innovations). Samples were excited with a 3i 488-nm solid-state laser line, and emission was collected with a 525/30 nm emission filter. Ablation was performed with a 3i 532-nm solid-state pulsed laser (>60 µJ pulses at 200 Hz) that is integrated to a 3i Vector, which is a diffraction-limited high-speed X,Y scanner that allows interactive examination of living specimens with a rapid single-point seek time of 0.3 ms and fast ROI scanning (1500 lines/s). The system comprises a 3i mSwitcher unit that enabled simultaneous use with Spinning Disk Confocal for this multimodal acquisition. Photoablations were conducted by aiming a laser of 193/200 of power of a duration of 6ms and raster block size 10 at a 0.52-µm spot at epithelial cells of day 4 Et(Gal4-VP16)zc1044A; Tg (UAS: nfsB-mCherry); Tg(UAS:Lifeact-GFP) larvae or Et(Gal4-VP16)zc1044A; Tg (UAS: nfsB-mCherry); Tg((HSP70):Bcl2–2A-CAAX-EGFP) that were anesthetized and mounted as previously described. Because of the high amount of laser power needed to perform ablations in the epidermis, laser ablation impacted several cells, leading us to measure recoil outside of the region of dissociation (see boundaries in Figure 3F). For larvae treated with BAPTA, the tissue was fragile and using the previously established laser power caused large-scale damage and disaggregation of the tissue. We therefore optimized laser power for which recoil could be measured and laser power was reduced to 191/200. For comparison of pulsing vs non-pulsing cells (Figure 3E), only cells that were in the process of contraction were accounted as pulsing cells. For all other ablation experiments we did not discriminate between pulsing and non-pulsing cells and randomly performed ablations. Time-lapse images acquired continuously as 10-slice z-stacks every 3s. Recoil was calculated on Fiji ImageJ by measuring the average area displacement of cell junctions immediately encircling the ablation site 3s after photomanipulation.
PIV measurements
The velocity field for 40X and 5s interval time-lapse images on the Et(Gal4-VP16)zc1044A; Tg (UAS: nfsB-mCherry); Tg(UAS:Lifeact-GFP) line was obtained using an open source MATLAB code (PIVlab) 62, with four passes (128 × 128, 64 × 64, 32 × 32, and 16 × 16 pixel-size interrogation window with 50% overlap each).
Visualizations of the divergence maps overlaid onto the microscopy data were produced using custom made software written using the Python language and its scientific libraries NumPy, SciPy and Scikit-image 63–65. Convergence and divergence values were assigned to each image pixel via cubic interpolation of the calculated divergence map. The overlay was created via alpha compositing using the ‘over’ operation (with divergence placed over the cell images). Positive and negative pixel values were separated accordingly into RGB channels and the alpha value of each pixel was set as the absolute value of the divergence at that pixel. Regions of high contraction were then defined by converting the interpolated divergence maps into binary masks via an image thresholding technique. First, the 3 time-point moving average of the divergence maps was calculated to smooth the image. Next the image was thresholded to produce a binary mask. The threshold value was set to double the mean value of divergence after removal of all positive divergence values (i.e. expansion). This threshold value represents a suitable choice for the exclusion of noise since the large majority of cells at any given time point are not pulsing. Finally, the binary mask was processed with morphological closing followed by opening using a circular structuring element of radius 18 pixels to further reduce noise and produce contiguous regions. Pulses were then defined and automatically detected from these masks as any region which overlapped over 4 consecutive time points. The number 4 was chosen to match the average time period of contraction as measured from cell area dynamics. The percentage of coverage of the pulse region over the cell area and the percentage of the region that spilled into neighboring cells was then measured in image j. Values represent mean +/− SD.
To calculate the fraction of pulses that would be expected to be found to neighbor another pulse if pulses did not influence the probability of pulsing of neighboring cells, we made a statistical calculation. In a given imaging session, we assume that a pulse can occur in any nc of the cells in the field of view and can start at any of the nt time-points. Therefore, in total there are nc * nt ‘cell-time’ locations that a pulse can occupy. If a pulse lasts on average for t time-points and a cell has on average c neighbouring cells, then there are t * c cell-time locations in which a subsequent pulse must occupy for a ‘multi-pulse’ to be formed. Therefore, if the total number of pulses is given by np, the probability p that a given pulse will be neighbored by another is given by:
This number can be considered a good estimate of the total expected fraction of pulses to neighbor another pulse in the limit that the total number of cell-time locations is much greater that the final number of cell-time locations occupied by pulses.
Generation of the Bcl2 transgenic line
The Tg(Hsp70l:zBcl2–2A-EGFP-CAAX) transgenic line was generated by combining p5E–hsp70l, pME-zBcl2 (no stop), and p3E-2A-EGFPCAAXpA into the pDestTol2CG2 destination vector 66. Injections were performed with 25 pg of the purified plasmid along with 50 pg of Tol2 transposase mRNA into wild-type AB strain developing zebrafish embryos at the one-cell stage. Potential carriers were identified by fluorescence expression and raised to adulthood.
Larvae fixation and immunofluorescence
Zebrafish larvae were fixed for 4h at room temperature or overnight at 4°C with 0.4% paraformaldehyde (4% PFA), rinsed with phosphate-buffered saline (PBS), washed in PBS+0.5% Triton X-100 (PBSTX 0.5%) and blocked for 1–2h at room temperature in 1% DMSO+2mg/mL bovine serum albumin (BSA)+PBSTX 0.5%+10% heat inactivated goat serum. Specimens were incubated at room temperature overnight with primary antibodies in block solution. Samples were washed in PBSTX 0.5% and incubated overnight at room temperature with secondary antibodies and 4,6-diamidino-2-phenylindole (DAPI). Samples were prepped and the tail was mounted on microscope slides using glycerol with 22×22 coverslips.
Antibodies
Activate caspase-3 (BD Biosciences, 559565, 1:700), Sphingosine 1-Phosphate (Echelon Biosciences, ZP-300, 1:100) and Phospho-myosin antibody (Sigma Millipore, PA5–17727, 1:100) were used. Secondary antibodies (Thermo Fisher, A-21235 and A27040) were diluted at 1/250.
NucView treatment
3dpf larvae were soaked in DMSO (1:100 dilution) 24h prior to the experiment to dissolve the mucus layer covering the epithelium and allow better incorporation of the dye. At 4dpf, larvae were treated with MTZ as described in our epithelial damage assay, together with a NucView Caspase-3 enzyme substrate (Biotium, #10405, 1:1000). Nucview was also added to E3 media at 1:1000 during imaging.
QUANTIFICATION AND STATISTICAL ANALYSES
All experiments were performed on a minimum of 3 larvae and for a minimum of 3 independent experiments. All statistical analysis and graphic representations were performed using Prism software (GraphPad). Most data are represented as box and whiskers (minimum to maximum with all points) unless stated otherwise in the figure legend. To show area and fluorescence fluctuations, data are represented as xy coordinates (mean ± SEM). For pairwise comparisons P-values were calculated using the Mann–Whitney t test and for multiple comparisons, statistical analyses were performed using one-way ANOVA and P-values were calculated using the Newman-Keuls test multiple comparison test (*, P<0.05; **, P<0.01; ***, P<0.001; ****, P<0.0001).
Supplementary Material
Upper Panel: MIP of the tail fin of a 4dpf 4dpf Et(Gal4-VP16)zc1044A; Tg (UAS: nfsB-mCherry); Tg(UAS:Lifeact-GFP)utm1 zebrafish larva treated with 10mM of MTZ for 2h. Epithelial cells express NTR-mCherry (magenta) and LifeAct-GFP (green). Time is in hours and minutes HH:MM. 3D stacks were obtained at a step size of 2µm intervals. Scale bar = 50µm. Lower Panel: MIP of the tail fin of 4dpf Et(Gal4-VP16)zc1044A; Tg (UAS: nfsB-mCherry); Tg(UAS:Lifeact-GFP)utm1 larvae treated with 10mM of MTZ for 1h or 5mM of MTZ for 2h. Epithelial cells express NTR-mCherry (magenta) and LifeAct-GFP (green). Time is in hours and minutes HH:MM. 3D stacks were obtained at a step size of 3µm intervals. Scale bar = 100µm.
MIP of epithelial cells expressing LifeAct-GFP. Overlaid color map represents divergence field where blue is convergence and red is divergence. Time is in minutes and seconds MM:SS. 3D stacks were obtained at a step size of 2µm intervals. Scale bar = 20µm.
MIP of the tail fin of 4dpf larvae treated with MTZ, MTZ + cytochalasin or MTZ + Y-27632. Epithelial cells express NTR-mCherry (magenta) and LifeAct-GFP (green). Time is in hours and minutes HH:MM. 3D stacks were obtained at a step size of 2µm intervals. Scale bar = 100µm.
Upper Panel: MIP of the tail fin of 4dpf larvae treated with MTZ or MTZ + Sphingosine Kinase Inhibitor (SKI). Epithelial cells express NTR-mCherry (magenta) and LifeAct-GFP (green). Lower Panel: MIP of the tail fin of 4dpf larvae treated with MTZ, MTZ + Apoptosis Inhibitor (NS3694) or MTZ + Caspase Inhibitor (zDEVD-fmk). Epithelial cells express NTR-mCherry (magenta) and LifeAct-GFP (green). Time is in hours and minutes HH:MM. 3D stacks were obtained at a step size of 2µm intervals. Scale bar = 100µm.
MIP of epithelial cells treated with MTZ and soaked in NucView 405. Epithelial cells express NTR (not shown), LifeAct-GFP (green) and cleaved caspase 3 is fluorescently labelled (Magenta). Time is in hours and minutes HH:MM. 3D stacks were obtained at a step size of 2µm intervals. Scale bar = 20µm.
Upper Panel: MIP of the tail fin of 4dpf larvae treated with MTZ or MTZ + BAPTA. Lower Panel: MIP of the tail fin of 4dpf larva treated with BAPTA. Zoom-in regions represent pulsing epithelial cells. Epithelial cells express NTR-mCherry (magenta) and LifeAct-GFP (green). Time is in hours and minutes. HH:MM. 3D stacks were obtained at a step size of 2µm intervals. Scale bar = 100µm.
KEY RESOURCES TABLE
| REAGENT or RESOURCE | SOURCE | IDENTIFIER |
|---|---|---|
| Antibodies | ||
| Activate caspase-3 | BD Biosciences | 559565 |
| Sphingosine 1-Phosphate | Echelon Biosciences | ZP-300 |
| Phospho-myosin | Sigma Millipore | PA5–17727 |
| Experimental Models: Organisms/Strains | ||
| Zebrafish: Et(Gal4-VP16)zc1044a; Tg(UAS-E1b:nsfB-mCherry) | 18 | N/A |
| Zebrafish: Et(Gal4-VP16)zc1044a; Tg(UAS-E1b:nsfB-mCherry); Tg(UAS-E1b:Lifeact-EGFP)utm1 | 18 | N/A |
| Zebrafish: Tg(actb1:myl12.1-GFP) | 40, 59 | N/A |
| Zebrafish: Tg(−8.0cldnB:lyn-EGFP)zf106 | 60 | N/A |
| Zebrafish: Tg((HSP70):Bcl2–2A-CAAX-EGFP) | This study | N/A |
| Software and Algorithms | ||
| MATLAB R2019a | Mathworks | https://www.mathworks.com/products/matlab.html |
| PIVLab | 62 | https://www.mathworks.com/matlabcentral/fileexchange/27659-pivlab-particle-image-velocimetry-piv-tool-with-gui |
| Fiji | ImageJ | https://imagej.net/Fiji |
| Tissue Analyzer | 19 | https://grr.gred-clermont.fr/labmirouse/software/WebPA/index.html |
| Python | Scikit Image | https://scikit-image.org/ |
| Prism version 8 | GraphPad | https://www.graphpad.com/scientific-software/prism/ |
| Chemicals, Peptides, and Recombinant Proteins | ||
| Metronidazole (MTZ) | Sigma | M-3761 |
| NucView 405 | Biotium | 10405 |
| Y-27632 | Sigma | Y-0503 |
| Cytochalasin B | Sigma | C-6762 |
| SKI 5C | Sigma | S8326 |
| Apoptosis Inhibitor (AI) | Santa Cruz | NS3694 |
| zDEVD-fmk | Sigma | CAS210344–95–9 |
| BAPTA | Invitrogen | B1204 |
Highlights.
Cell extrusion is preceded by actomyosin pulsatile contractions
Kinetics of pulsatile contractions are predictive of cell extrusion
Pulsatile contractions are generated by an apico-medial myosin network
Caspase activation and S1P enrichment induce pulsatile contractions
ACKNOWLEDGEMENTS
We would like to thank Oscar Ruiz, Krystin Samms and Philip Kahan for their excellent care and maintenance of the zebrafish. We thank members of the MD Anderson Genetics Department for scientific discussions, suggestions, and comments. We especially thank Drs. Swathi Arur, Richard Behringer and Pierre McCrea for critical reading of the manuscript. The Tg(actb1:myl12.1-GFP) embryos were a gift from Carl-Philip Heisenberg. We acknowledge the AFM core facility at the University of Texas Health Science Center at Houston for acquisition and analyses of data. We also thank Adriana Paulucci-Holthauzen and the MD Anderson Department of Genetics Microscopy Facility for training and support. This work was supported by the Cancer Prevention Institute of Texas, RR140077, the National Institute of General Medical Sciences, National Institutes of Health, R01GM124043, and the Mark and Linda Quick Basic Science Award to G.T.E. Y. A. is an Odyssey fellow and was supported by the Odyssey program and the Houston Endowment, Inc. at the University of Texas MD Anderson Cancer Center.
Footnotes
Publisher's Disclaimer: This is a PDF file of an unedited manuscript that has been accepted for publication. As a service to our customers we are providing this early version of the manuscript. The manuscript will undergo copyediting, typesetting, and review of the resulting proof before it is published in its final form. Please note that during the production process errors may be discovered which could affect the content, and all legal disclaimers that apply to the journal pertain.
DECLARATION OF INTERESTS
The authors declare no competing financial interests.
REFERENCES
- 1.Eisenhoffer GT, Loftus PD, Yoshigi M, Otsuna H, Chien CB, Morcos PA, et al. Crowding induces live cell extrusion to maintain homeostatic cell numbers in epithelia. Nature. 2012;484(7395):546–9. [DOI] [PMC free article] [PubMed] [Google Scholar]
- 2.Rosenblatt J, Raff MC, Cramer LP. An epithelial cell destined for apoptosis signals its neighbors to extrude it by an actin- and myosin-dependent mechanism. Curr Biol. 2001;11(23):1847–57. [DOI] [PubMed] [Google Scholar]
- 3.Hogan C, Dupre-Crochet S, Norman M, Kajita M, Zimmermann C, Pelling AE, et al. Characterization of the interface between normal and transformed epithelial cells. Nat Cell Biol. 2009;11(4):460–7. [DOI] [PubMed] [Google Scholar]
- 4.Slattum G, Gu Y, Sabbadini R, Rosenblatt J. Autophagy in oncogenic K-Ras promotes basal extrusion of epithelial cells by degrading S1P. Curr Biol. 2014;24(1):19–28. [DOI] [PMC free article] [PubMed] [Google Scholar]
- 5.Marshall TW, Lloyd IE, Delalande JM, Nathke I, Rosenblatt J. The tumor suppressor adenomatous polyposis coli controls the direction in which a cell extrudes from an epithelium. Mol Biol Cell. 2011;22(21):3962–70. [DOI] [PMC free article] [PubMed] [Google Scholar]
- 6.Takeuchi Y, Narumi R, Akiyama R, Vitiello E, Shirai T, Tanimura N, et al. Calcium Wave Promotes Cell Extrusion. Curr Biol. 2020;30(4):670–81 e6. [DOI] [PubMed] [Google Scholar]
- 7.Teo JL, Gomez GA, Weeratunga S, Davies EM, Noordstra I, Budnar S, et al. Caveolae Control Contractile Tension for Epithelia to Eliminate Tumor Cells. Dev Cell. 2020;54(1):75–91 e7. [DOI] [PubMed] [Google Scholar]
- 8.Gu Y, Forostyan T, Sabbadini R, Rosenblatt J. Epithelial cell extrusion requires the sphingosine-1-phosphate receptor 2 pathway. J Cell Biol. 2011;193(4):667–76. [DOI] [PMC free article] [PubMed] [Google Scholar]
- 9.Swindle EJ, Collins JE, Davies DE. Breakdown in epithelial barrier function in patients with asthma: identification of novel therapeutic approaches. J Allergy Clin Immunol. 2009;124(1):23–34; quiz 5–6. [DOI] [PubMed] [Google Scholar]
- 10.Herszterg S, Pinheiro D, Bellaiche Y. A multicellular view of cytokinesis in epithelial tissue. Trends Cell Biol. 2014;24(5):285–93. [DOI] [PubMed] [Google Scholar]
- 11.Pinheiro D, Hannezo E, Herszterg S, Bosveld F, Gaugue I, Balakireva M, et al. Transmission of cytokinesis forces via E-cadherin dilution and actomyosin flows. Nature. 2017;545(7652):103–7. [DOI] [PMC free article] [PubMed] [Google Scholar]
- 12.Marinari E, Mehonic A, Curran S, Gale J, Duke T, Baum B. Live-cell delamination counterbalances epithelial growth to limit tissue overcrowding. Nature. 2012;484(7395):542–5. [DOI] [PubMed] [Google Scholar]
- 13.An Y, Xue G, Shaobo Y, Mingxi D, Zhou X, Yu W, et al. Apical constriction is driven by a pulsatile apical myosin network in delaminating Drosophila neuroblasts. Development. 2017;144(12):2153–64. [DOI] [PubMed] [Google Scholar]
- 14.Simoes S, Oh Y, Wang MFZ, Fernandez-Gonzalez R, Tepass U. Myosin II promotes the anisotropic loss of the apical domain during Drosophila neuroblast ingression. J Cell Biol. 2017;216(5):1387–404. [DOI] [PMC free article] [PubMed] [Google Scholar]
- 15.Michel M, Dahmann C. Tissue mechanical properties modulate cell extrusion in the Drosophila abdominal epidermis. Development. 2020;147(5). [DOI] [PubMed] [Google Scholar]
- 16.Eisenhoffer GT, Slattum G, Ruiz OE, Otsuna H, Bryan CD, Lopez J, et al. A toolbox to study epidermal cell types in zebrafish. J Cell Sci. 2017;130(1):269–77. [DOI] [PMC free article] [PubMed] [Google Scholar]
- 17.Curado S, Anderson RM, Jungblut B, Mumm J, Schroeter E, Stainier DY. Conditional targeted cell ablation in zebrafish: a new tool for regeneration studies. Dev Dyn. 2007;236(4):1025–35. [DOI] [PubMed] [Google Scholar]
- 18.Davison JM, Akitake CM, Goll MG, Rhee JM, Gosse N, Baier H, et al. Transactivation from Gal4-VP16 transgenic insertions for tissue-specific cell labeling and ablation in zebrafish. Dev Biol. 2007;304(2):811–24. [DOI] [PMC free article] [PubMed] [Google Scholar]
- 19.Aigouy B, Umetsu D, Eaton S. Segmentation and Quantitative Analysis of Epithelial Tissues. Methods Mol Biol. 2016;1478:227–39. [DOI] [PubMed] [Google Scholar]
- 20.Martin AC, Kaschube M, Wieschaus EF. Pulsed contractions of an actin-myosin network drive apical constriction. Nature. 2009;457(7228):495–9. [DOI] [PMC free article] [PubMed] [Google Scholar]
- 21.Coravos JS, Mason FM, Martin AC. Actomyosin Pulsing in Tissue Integrity Maintenance during Morphogenesis. Trends Cell Biol. 2017;27(4):276–83. [DOI] [PMC free article] [PubMed] [Google Scholar]
- 22.Sedzinski J, Biro M, Oswald A, Tinevez JY, Salbreux G, Paluch E. Polar actomyosin contractility destabilizes the position of the cytokinetic furrow. Nature. 2011;476(7361):462–6. [DOI] [PubMed] [Google Scholar]
- 23.Maitre JL, Niwayama R, Turlier H, Nedelec F, Hiiragi T. Pulsatile cell-autonomous contractility drives compaction in the mouse embryo. Nat Cell Biol. 2015;17(7):849–55. [DOI] [PubMed] [Google Scholar]
- 24.He L, Wang X, Tang HL, Montell DJ. Tissue elongation requires oscillating contractions of a basal actomyosin network. Nat Cell Biol. 2010;12(12):1133–42. [DOI] [PMC free article] [PubMed] [Google Scholar]
- 25.Solon J, Kaya-Copur A, Colombelli J, Brunner D. Pulsed forces timed by a ratchet-like mechanism drive directed tissue movement during dorsal closure. Cell. 2009;137(7):1331–42. [DOI] [PubMed] [Google Scholar]
- 26.Coravos JS, Martin AC. Apical Sarcomere-like Actomyosin Contracts Nonmuscle Drosophila Epithelial Cells. Dev Cell. 2016;39(3):346–58. [DOI] [PMC free article] [PubMed] [Google Scholar]
- 27.Gagliardi PA, Somale D, Puliafito A, Chiaverina G, di Blasio L, Oneto M, et al. MRCKalpha is activated by caspase cleavage to assemble an apical actin ring for epithelial cell extrusion. J Cell Biol. 2018;217(1):231–49. [DOI] [PMC free article] [PubMed] [Google Scholar]
- 28.Rauzi M, Lenne PF, Lecuit T. Planar polarized actomyosin contractile flows control epithelial junction remodelling. Nature. 2010;468(7327):1110–4. [DOI] [PubMed] [Google Scholar]
- 29.Gorfinkiel N, Blanchard GB. Dynamics of actomyosin contractile activity during epithelial morphogenesis. Curr Opin Cell Biol. 2011;23(5):531–9. [DOI] [PubMed] [Google Scholar]
- 30.Heer NC, Martin AC. Tension, contraction and tissue morphogenesis. Development. 2017;144(23):4249–60. [DOI] [PMC free article] [PubMed] [Google Scholar]
- 31.Acharya BR, Yap AS. Pli Selon Pli: Mechanochemical Feedback and the Morphogenetic Role of Contractility at Cadherin Cell-Cell Junctions. Curr Top Dev Biol. 2016;117:631–46. [DOI] [PubMed] [Google Scholar]
- 32.Roh-Johnson M, Shemer G, Higgins CD, McClellan JH, Werts AD, Tulu US, et al. Triggering a cell shape change by exploiting preexisting actomyosin contractions. Science. 2012;335(6073):1232–5. [DOI] [PMC free article] [PubMed] [Google Scholar]
- 33.Bonnet I, Marcq P, Bosveld F, Fetler L, Bellaiche Y, Graner F. Mechanical state, material properties and continuous description of an epithelial tissue. J R Soc Interface. 2012;9(75):2614–23. [DOI] [PMC free article] [PubMed] [Google Scholar]
- 34.Wyatt TPJ, Fouchard J, Lisica A, Khalilgharibi N, Baum B, Recho P, et al. Actomyosin controls planarity and folding of epithelia in response to compression. Nat Mater. 2020;19(1):109–17. [DOI] [PubMed] [Google Scholar]
- 35.Harris AR, Daeden A, Charras GT. Formation of adherens junctions leads to the emergence of a tissue-level tension in epithelial monolayers. J Cell Sci. 2014;127(Pt 11):2507–17. [DOI] [PMC free article] [PubMed] [Google Scholar]
- 36.Krieg M, Arboleda-Estudillo Y, Puech PH, Kafer J, Graner F, Muller DJ, et al. Tensile forces govern germ-layer organization in zebrafish. Nat Cell Biol. 2008;10(4):429–36. [DOI] [PubMed] [Google Scholar]
- 37.Gude DR, Alvarez SE, Paugh SW, Mitra P, Yu J, Griffiths R, et al. Apoptosis induces expression of sphingosine kinase 1 to release sphingosine-1-phosphate as a “come-and-get-me” signal. FASEB J. 2008;22(8):2629–38. [DOI] [PMC free article] [PubMed] [Google Scholar]
- 38.Riedl SJ, Shi Y. Molecular mechanisms of caspase regulation during apoptosis. Nat Rev Mol Cell Biol. 2004;5(11):897–907. [DOI] [PubMed] [Google Scholar]
- 39.Saias L, Swoger J, D’Angelo A, Hayes P, Colombelli J, Sharpe J, et al. Decrease in Cell Volume Generates Contractile Forces Driving Dorsal Closure. Dev Cell. 2015;33(5):611–21. [DOI] [PubMed] [Google Scholar]
- 40.Maitre JL, Berthoumieux H, Krens SF, Salbreux G, Julicher F, Paluch E, et al. Adhesion functions in cell sorting by mechanically coupling the cortices of adhering cells. Science. 2012;338(6104):253–6. [DOI] [PubMed] [Google Scholar]
- 41.Priya R, Gomez GA, Budnar S, Verma S, Cox HL, Hamilton NA, et al. Feedback regulation through myosin II confers robustness on RhoA signalling at E-cadherin junctions. Nat Cell Biol. 2015;17(10):1282–93. [DOI] [PubMed] [Google Scholar]
- 42.Curran S, Strandkvist C, Bathmann J, de Gennes M, Kabla A, Salbreux G, et al. Myosin II Controls Junction Fluctuations to Guide Epithelial Tissue Ordering. Dev Cell. 2017;43(4):480–92 e6. [DOI] [PMC free article] [PubMed] [Google Scholar]
- 43.Grieve AG, Rabouille C. Extracellular cleavage of E-cadherin promotes epithelial cell extrusion. J Cell Sci. 2014;127(Pt 15):3331–46. [DOI] [PubMed] [Google Scholar]
- 44.Clement R, Dehapiot B, Collinet C, Lecuit T, Lenne PF. Viscoelastic Dissipation Stabilizes Cell Shape Changes during Tissue Morphogenesis. Curr Biol. 2017;27(20):3132–42 e4. [DOI] [PubMed] [Google Scholar]
- 45.Martin AC, Goldstein B. Apical constriction: themes and variations on a cellular mechanism driving morphogenesis. Development. 2014;141(10):1987–98. [DOI] [PMC free article] [PubMed] [Google Scholar]
- 46.Baird MA, Billington N, Wang A, Adelstein RS, Sellers JR, Fischer RS, et al. Local pulsatile contractions are an intrinsic property of the myosin 2A motor in the cortical cytoskeleton of adherent cells. Mol Biol Cell. 2017;28(2):240–51. [DOI] [PMC free article] [PubMed] [Google Scholar]
- 47.Cavanaugh KE, Staddon MF, Munro E, Banerjee S, Gardel ML. RhoA Mediates Epithelial Cell Shape Changes via Mechanosensitive Endocytosis. Dev Cell. 2020;52(2):152–66 e5. [DOI] [PMC free article] [PubMed] [Google Scholar]
- 48.Garcia De Las Bayonas A, Philippe JM, Lellouch AC, Lecuit T. Distinct RhoGEFs Activate Apical and Junctional Contractility under Control of G Proteins during Epithelial Morphogenesis. Curr Biol. 2019;29(20):3370–85 e7. [DOI] [PMC free article] [PubMed] [Google Scholar]
- 49.Hoshika S, Sun X, Kuranaga E, Umetsu D. Reduction of endocytic activity accelerates cell elimination during tissue remodeling of the Drosophila epidermal epithelium. Development. 2020;147(7). [DOI] [PubMed] [Google Scholar]
- 50.Levayer R, Lecuit T. Oscillation and polarity of E-cadherin asymmetries control actomyosin flow patterns during morphogenesis. Dev Cell. 2013;26(2):162–75. [DOI] [PubMed] [Google Scholar]
- 51.Zhang Y, Chen X, Gueydan C, Han J. Plasma membrane changes during programmed cell deaths. Cell Res. 2018;28(1):9–21. [DOI] [PMC free article] [PubMed] [Google Scholar]
- 52.Duszyc K, Gomez GA, Schroder K, Sweet MJ, Yap AS. In life there is death: How epithelial tissue barriers are preserved despite the challenge of apoptosis. Tissue Barriers. 2017;5(4):e1345353. [DOI] [PMC free article] [PubMed] [Google Scholar]
- 53.Gu Y, Shea J, Slattum G, Firpo MA, Alexander M, Mulvihill SJ, et al. Defective apical extrusion signaling contributes to aggressive tumor hallmarks. Elife. 2015;4:e04069. [DOI] [PMC free article] [PubMed] [Google Scholar]
- 54.Cartier A, Hla T. Sphingosine 1-phosphate: Lipid signaling in pathology and therapy. Science. 2019;366(6463). [DOI] [PMC free article] [PubMed] [Google Scholar]
- 55.Proia RL, Hla T. Emerging biology of sphingosine-1-phosphate: its role in pathogenesis and therapy. J Clin Invest. 2015;125(4):1379–87. [DOI] [PMC free article] [PubMed] [Google Scholar]
- 56.Maceyka M, Spiegel S. Sphingolipid metabolites in inflammatory disease. Nature. 2014;510(7503):58–67. [DOI] [PMC free article] [PubMed] [Google Scholar]
- 57.Christodoulou N, Skourides PA. Cell-Autonomous Ca(2+) Flashes Elicit Pulsed Contractions of an Apical Actin Network to Drive Apical Constriction during Neural Tube Closure. Cell Rep. 2015;13(10):2189–202. [DOI] [PubMed] [Google Scholar]
- 58.Kimmel CB, Ballard WW, Kimmel SR, Ullmann B, Schilling TF. Stages of embryonic development of the zebrafish. Dev Dyn. 1995;203(3):253–310. [DOI] [PubMed] [Google Scholar]
- 59.Behrndt M, Salbreux G, Campinho P, Hauschild R, Oswald F, Roensch J, et al. Forces driving epithelial spreading in zebrafish gastrulation. Science. 2012;338(6104):257–60. [DOI] [PubMed] [Google Scholar]
- 60.Haas P, Gilmour D. Chemokine signaling mediates self-organizing tissue migration in the zebrafish lateral line. Dev Cell. 2006;10(5):673–80. [DOI] [PubMed] [Google Scholar]
- 61.Vincent LaS P Watersheds in Digital Spaces: An Efficient Algorithm Based on Immersion Simulations. IEEE Transactions on Pattern Analysis and Machine Intelligence. 1991;13(6):583–98. [Google Scholar]
- 62.Thielicke WS EJ PIVlab–Towards user-friendly, affordable and accurate digital particle image velocimetry in MATLAB. J Open Res Softw. 2014;2.
- 63.van der Walt S, Schonberger JL, Nunez-Iglesias J, Boulogne F, Warner JD, Yager N, et al. scikit-image: image processing in Python. PeerJ. 2014;2:e453. [DOI] [PMC free article] [PubMed] [Google Scholar]
- 64.Virtanen P, Gommers R, Oliphant TE, Haberland M, Reddy T, Cournapeau D, et al. SciPy 1.0: fundamental algorithms for scientific computing in Python. Nat Methods. 2020;17(3):261–72. [DOI] [PMC free article] [PubMed] [Google Scholar]
- 65.Van der Walt SC, C.S; Varoquaux G. The NumPy Array: A Structure for Efficient Numerical Computation. Computing in Science & Engineering. 2011;13(2):22–30. [Google Scholar]
- 66.Kwan KM, Fujimoto E, Grabher C, Mangum BD, Hardy ME, Campbell DS, et al. The Tol2kit: a multisite gateway-based construction kit for Tol2 transposon transgenesis constructs. Dev Dyn. 2007;236(11):3088–99. [DOI] [PubMed] [Google Scholar]
Associated Data
This section collects any data citations, data availability statements, or supplementary materials included in this article.
Supplementary Materials
Upper Panel: MIP of the tail fin of a 4dpf 4dpf Et(Gal4-VP16)zc1044A; Tg (UAS: nfsB-mCherry); Tg(UAS:Lifeact-GFP)utm1 zebrafish larva treated with 10mM of MTZ for 2h. Epithelial cells express NTR-mCherry (magenta) and LifeAct-GFP (green). Time is in hours and minutes HH:MM. 3D stacks were obtained at a step size of 2µm intervals. Scale bar = 50µm. Lower Panel: MIP of the tail fin of 4dpf Et(Gal4-VP16)zc1044A; Tg (UAS: nfsB-mCherry); Tg(UAS:Lifeact-GFP)utm1 larvae treated with 10mM of MTZ for 1h or 5mM of MTZ for 2h. Epithelial cells express NTR-mCherry (magenta) and LifeAct-GFP (green). Time is in hours and minutes HH:MM. 3D stacks were obtained at a step size of 3µm intervals. Scale bar = 100µm.
MIP of epithelial cells expressing LifeAct-GFP. Overlaid color map represents divergence field where blue is convergence and red is divergence. Time is in minutes and seconds MM:SS. 3D stacks were obtained at a step size of 2µm intervals. Scale bar = 20µm.
MIP of the tail fin of 4dpf larvae treated with MTZ, MTZ + cytochalasin or MTZ + Y-27632. Epithelial cells express NTR-mCherry (magenta) and LifeAct-GFP (green). Time is in hours and minutes HH:MM. 3D stacks were obtained at a step size of 2µm intervals. Scale bar = 100µm.
Upper Panel: MIP of the tail fin of 4dpf larvae treated with MTZ or MTZ + Sphingosine Kinase Inhibitor (SKI). Epithelial cells express NTR-mCherry (magenta) and LifeAct-GFP (green). Lower Panel: MIP of the tail fin of 4dpf larvae treated with MTZ, MTZ + Apoptosis Inhibitor (NS3694) or MTZ + Caspase Inhibitor (zDEVD-fmk). Epithelial cells express NTR-mCherry (magenta) and LifeAct-GFP (green). Time is in hours and minutes HH:MM. 3D stacks were obtained at a step size of 2µm intervals. Scale bar = 100µm.
MIP of epithelial cells treated with MTZ and soaked in NucView 405. Epithelial cells express NTR (not shown), LifeAct-GFP (green) and cleaved caspase 3 is fluorescently labelled (Magenta). Time is in hours and minutes HH:MM. 3D stacks were obtained at a step size of 2µm intervals. Scale bar = 20µm.
Upper Panel: MIP of the tail fin of 4dpf larvae treated with MTZ or MTZ + BAPTA. Lower Panel: MIP of the tail fin of 4dpf larva treated with BAPTA. Zoom-in regions represent pulsing epithelial cells. Epithelial cells express NTR-mCherry (magenta) and LifeAct-GFP (green). Time is in hours and minutes. HH:MM. 3D stacks were obtained at a step size of 2µm intervals. Scale bar = 100µm.
Data Availability Statement
The published article includes supplemental videos of the imaging datasets analyzed during this study. The raw imaging datasets and code for visualization of the divergence maps overlaid onto the microscopy data have not been deposited in a public repository, but are available from the Lead Contact upon request.