Abstract
Aims:
The depot-specific differences in lipidome of visceral adipose tissue (VAT) and subcutaneous adipose tissue (SAT) reflect heterogeneity of white adipose tissue (WAT), which plays a central role in its distinct response to outside stimuli. However, the detailed lipidome of depot-specific WAT is largely unknown, especially the minor constitutes including phospholipid and sphingolipid.
Materials and Methods:
To investigate this field, we applied a high-coverage targeted lipidomics approach of VAT and SAT in male C57BL/6J mice to compare the basal level of their lipid profiles.
Key findings:
In total, 342 lipid species from 19 lipid classes were identified. Our results showed the composition of TAG and FFA was different in length of chain and saturation. Interestingly, low abundance phospholipid, sphingolipid and cardiolipin were significantly higher in SAT. Lipid correlation network analysis vindicated that TAG and phospholipid formed distinct subnet and had more connections with other lipid species. Enriched ontology analysis of gene screened from LIPID MAPS and microarray suggested the differences were mainly involved in lipid metabolism, insulin resistance and inflammatory response.
Significance:
Our comprehensive lipidomics and transcriptomics analyses revealed differences in lipid composition and lipid metabolism of two depot-specific WAT, which would offer new insights into the investigation of heterogeneity of visceral and subcutaneous white adipose tissue.
Keywords: white adipose tissue heterogeneity, lipidomics, transcriptomics, visceral adipose tissue, subcutaneous adipose tissue
1. Introduction
Obesity has reached epidemic proportions worldwide and caused 2.8 million death per year, which is associated with various comorbidities, including cardiovascular diseases, diabetes and cancer[1]. White adipose tissue (WAT) is known for it is the primary site for energy storage and has stimulated great interest in exploring its’ endocrine function beyond merely an inert storage for excess lipids[2]. The highly heterogeneous of WAT has drawn great attention in illustrating the metabolic and hormonal character in their depot-specific differences. Over the past two decades, it is well recognized that the location of fat accumulation is correlated with metabolic diseases risk. In fact, visceral adipose tissue (VAT) accumulation of central obesity, other than subcutaneous adipose tissue (SAT) accumulation of peripheral obesity, contributes to the high risk of metabolic diseases[3], including dyslipidemia, atherosclerosis, hypertension and diabetes[4].
The signatures of visceral and subcutaneous white adipose tissue display in many aspects, including adipogenesis, insulin sensitivity, adipokines endocrine[5]. These depot-specific differences have been uncovered through many approaches and therefore provide clues to elucidate the potential mechanisms responsible for the heterogeneities. The lineage tracing studies demonstrated the origins of VAT and SAT are from diversities of adipocyte precursors developmental lineages[6, 7]. Systematic biology-based approaches including transcriptomics and proteomics have been applied to demonstrate the functional variations between these two fat depots. Transcriptomics investigation revealed the variances mainly involved in lipid metabolism[8]. Correspondently, proteomics showed a higher metabolic activity in VAT evidenced by increasing proteins responsible for lipid transportation, oxidation-reduction, lipogenesis, and lipolysis[9]. These studies indicated the core differences of lipids metabolism between two white adipose tissues. However, besides energy storage, lipids are also dominant constituents of cellular and organellar membranes, and are pivotal to signaling transduction. Thus, understanding the differences in lipid composition of WAT is of paramount importance for studying their specialized functions and exploring the potential mechanism of white adipose tissue heterogeneities.
Regarding their dynamic and interactive nature, lipids can represent an important class of metabolites with versatile functions. Lipidomics analysis is a powerful approach to detect and monitor exquisite changes in various array of lipid species at molecular level. A global snapshot of adipose tissue lipidome therefore provides new insights for understanding the different signature of WAT. Moreover, recent decades have witnessed a successful application of lipidomics in clarifying the lipid profile changes of brown adipose tissue (BAT) and WAT after endurance exercise training[10], cold exposure[11] and different diet[12]. These studies highlighted the significant remodeling of triacylglycerols (TAGs) in BAT. There are also several studies that analyzed the lipidome of different depots of WAT in primary adipocyte, high-fat feeding mice and human[12–14]. These studies demonstrated the main differences in selective enrichment of specific TAGs, saturation of fatty acid, glycerophospholipids and sphingolipids, which responded differently to obesity, oxidative stress or beta-adrenergic stimulation.
Nonetheless, previously studies were limited in the numbers of detected lipids species, and mainly focused on the glyceride or fatty acid. The detailed changes of side chain composition of low abundance phospholipid and sphingolipids haven’t been thoroughly studied yet. Moreover, the basal level of lipid composition may largely determine their response to lipolysis-regulating hormones on metabolic activity including lipolytic rate and glucose uptake. These basal differences could be key factors of heterogeneity WAT. In the present work, we applied targeted lipidomics analysis to explore the lipidomes of C57BL/6J mice thoroughly to illustrate the basal differences between two lipid depots. Combining transcriptomics analysis, we enriched the lipidome of depot specific WAT and provided clues to construct a more comprehensive view of WAT heterogeneity.
2. Materials and Methods
2.1. Internal standards
Internal standards for quantification of various lipids are TAG: d5-TAG(16:0), d5-TAG(14:0), d5-TAG(18:0); diacylglycerols (DAG): d5-DAG(1,3-16:0), d5-DAG(1,3-18:1); cholesterol (Cho) and cholesteryl esters (CE): cholesterol-26,26,26,27,27,27-d6 and cholesteryl-2,2,3,4,4,6-d6, octadeconate; phosphatidylcholine (PC): PC-d31(16:0/18:1); phosphatidylethanolamine (PE): PE-d31(16:0/18:1); phosphatidylserines (PS): PS-d31 (16:0/18:1); phosphatidylinositols (PI): PI-d31 (16:0/18:1); phosphatidic acids (PA): PA-d31 (16:0/18:1) and PA: (17/0:17:0); phosphatidylglycerols (PG): PG-d31 (16:0/18:1); lyso-bisphosphatidic acids (LBPA): LBPA (14:0/14:0); lyso-PC (LPC): LPC-17:0; lyso-PE (LPE): LPE-17:1; lyso-PS (LPS): LPE-17:1; ceramides (Cer): Cer-d18:1/17:0; glucosylceramides (GluCer): GluCer-d18:1/8:0; galactosylceramides (GalCer): GalCer-d18:1/8:0, d31-16:0, and d8-20:4. All internal standards were obtained from Avanti Polar Lipids (Alabaster, AL, USA). d31-palmitic acid (Sigma-Aldrich, St Louis, MO) and d8-arachidonic acid (Cayman Chemicals, Ann Arbor, MI) were used for quantitation of saturated and polyunsaturated fatty acids, respectively
2.2. Animal tissue processing and lipid extraction
Animal tissue processing
Eight-week-old male C57BL/6J mice (25–26 g) were purchased from Beijing Huafukang Bioscience Co. Ltd (Beijing, China). The mice were held in a SPF environment under temperature of 22–25 °C and humidity of 60–70% with 12 hours-light/dark cycle. All animals were handled under the guidance of animal care committee of the Institute of Materia Medica, Chinese Academy of Medical Sciences. After acclimatization for one week, the mice were anesthetized and blood was removed. SAT from inguinal region and VAT from epididymal were quickly excised and frozen in liquid nitrogen for further lipid extraction.
RNA extraction and quantitative real-time PCR.
Total RNA of adipose tissue was extracted using TRIzol (Life Technologies, Grand Island, NY), followed by reverse transcription of total RNA to cDNA using a high-capacity cDNA reverse transcription kit (Takara, Japan). cDNA subsequently underwent quantitative real-time polymerase chain reaction (QPCR) with TB green. (Takara, Japan). QPCR reactions were run in triplicate and quantitated using CFX96™real-timesystem (Bio-Rad, Singapore). Relative amounts of mRNA were normalized to TATA box-binding protein (TBP) expression and expressed as arbitrary units.
qPCR analyzed the following genes: glyceride metabolism related genes: adipose triglyceride lipase (Atgl), hormone-sensitive lipase (Hsl), fatty acid synthase (Fasn), elongation of very long-chain fatty acids family member 6 (Elovl6), carbohydrate responsive-element binding protein (Chrebp), sterol regulatory element-binding protein 2 (Srebp2), apolipoprotein (Apoe) and low density lipoprotein receptor (Ldr); ceramide synthesis related genes: small subunit of serine palmitoyltransferase A/B (Sptssa/b), serine palmitoyltransferase long chain base subunit 1/2(Sptlc1/2), ceramide synthesis (Cers), glucosylceramide synthase (Ugcg) and galactosylceramide synthase (Ugt8a); cardiolipin synthesis related genes: phosphatidylglycerophosphate synthase 1 (Pgs1), Tam41, protein tyrosine phosphatase mitochondrial 1 (Ptpmt1), cardiolipin synthase 1 (Crls1), Tafazzin and CL acyltransferases: lysocardiolipin acyltransferase 1 (Alcat1); phospholipid interconversion related genes: palmitoyltransferase 1p (Cpt1p), phosphatidylserine synthase 1/2 (Ptdss1/2), phosphatidylinositol synthase (Pis), phospholipid. phospholipase D1 (Pld1), lysophosphatidylcholine acyltransferase converting (Lpcat), phosphatidylserine decarboxylase (Psd1), and phosphatidylethanolamine N-methyltransferase (pemt); adipocyte differentiation related genes CCAAT/enhancer binding protein alpha, beta, delta (Cebp α/β/δ), adaptor-related protein complex 2 (AP2), peroxisome proliferator activated receptor gamma (Pparg); and thermogenesis related genes: uncoupling protein 1 (Ucp1), peroxisome proliferative activated receptor gamma coactivator 1 alpha (Pgc-1α), cytochrome c oxidase subunit 8B (Cox8b), deiodinase iodothyronine type II (Dio2), adrenergic receptor beta 3 (Adrb3), peroxisome proliferator activated receptor alpha (Ppara), cell death-inducing DNA fragmentation factor, alpha subunit-like effector A (Cidea). The sequences of the primers are provided in Supplemental Table S1.
Lipid extraction
Lipids extraction were performed as previously reported by Lam with minor modification[15]. Briefly, 10 mg of frozen adipose tissue was deactivated by 900 μL mixture of chloroform: methanol (1:2) with 10% deionized water. Then the mixture was homogenized by OMNI Bead Ruptor (OMNI, USA). After incubating at 4°C for 1 h, 400 μL deionized water and 300 μL chloroform were added to the mixture, then vortexed for 10 min and centrifuged at 10000 rpm, 4°C for 15 min. Transfer the under layer organic phase and repeated last step with 500 μL chloroform. Combine the two steps’ products, dry with SpeedVac (Genevac, UK) and store the sample at −80°C until later analysis.
2.3. Lipidomics analysis
Lpidomics approach was conducted by Exion UPLC-QTRAP 6500PLUS (Sxiex) via electrospray ionization (ESI) iron source under conditions as follows: curtain gas = 20, ion spray voltage = 5500 V, temperature = 400 °C, ion source gas 1 = 35, ion sourcegas 2 = 35. Specifically, TAG and DAG were detected by a modified version based on previously research[16] using reverse phase high performance liquid chromatography (HPLC)-electrospray ionization- mass spectrometry (MS) with Phenomenex Kinetex 2.6 μm C18 column (inner diameter 4.6×100 mm). The glyceride lipids were separated by isocratic elution mode with chloroform, methanol, 0.1 mol/L ammonium acetate (100:100:4) at a flow rate of 160 μL/min for 20 min. Quantitative analysis of TAG and DAG were conducted applying Neutral Loss MS/MS technology by referencing internal standards. Free cholesterol, sterols and corresponding esters were analyzed using HPLC tandem MS analysis through atmospheric pressure chemical ionization (APCI) mode, and quantified by referencing internal standards.
Lipids with different polarity including phospholipids and sphingolipids, as well as free fatty acids were separated by NP-HPLC according to previously reported[17] using Phenomenex Luna 3 μm silica column (inner diameter 150×2.0 mm). HPLC condition was set as follows: mobile phase A (chloroform: methanol: ammonium hydroxide, 89.5:10:0.5), B (chloroform: methanol: ammonium hydroxide: water, 55: 39: 0.5: 5.5). 95 % A run for 5 min then linearly reduced to 60% in 7 min, after continuing for another 5 min changed to 30% and maintained for 15 min, then changed back to initial gradient and kept for 5 min. Individual polar lipid species were quantified using multiple reaction monitoring transitions by referencing their internal standards.
2.4. Lipid correlation network analysis
The lipid correlation network was analyzed as previously reported with minor modification by using Metscape[18, 19]. Briefly, “correlation calculator” tool (http://metscape.med.umich.edu/calculator.html) was used to calculate the enjamini-Hochberg-adjusted partial correlations between each pair of lipids that displayed a significant difference between VAT and SAT based on desparsified graphical lasso modeling procedure. Then correlation network was built by Mescape.
2.5. Transcriptomics and network analysis
Total RNA was extracted from visceral and subcutaneous white adipose tissue as described by the manufacturer’s protocols (Qiagen). Then the cRNA of VAT and SAT were prepared and hybridized as described previously[20]. Microarray hybridizations and analysis were performed at Genomics Facility of The University of Chicago. Gene chips were scanned and analyzed using Illumina IScan. The signals of microarray were then analyzed through GenomeStudio Gene Expression Module data analysis software (GSGX), version 1.9.0 (Illumina). LIPID MAPS Gene/Proteome Database (LMPD) was downloaded from LIPID MAPS at http://lipidmaps.org/resources/downloads/LMPD_040215.zip. 51 mouse genes that exist in both LMPD and VAT-SAT-Ctrl-FC-2+and+FDR-0.05.xlsx were extracted. The results further were performed gene ontology (GO) and modular analyses using Metascape[21](http://metascape.org) and Cytoscape[22].
2.6. Statistical analysis
Individual lipid classes and species levels for each sample were displayed as molar fraction calculated by per unit of wet tissue weight. The differences between VAT and SAT were determined statistically using unpaired Student’s t test. False discovery rate (FDR) adjustment <0.05 was considered statistically significant. MetaboAnalyst version 4.0 were applied for the analysis.
3. Results
3.1. Comparative lipidomics of subcutaneous and visceral white adipose tissue in C57BL/6J mice
We detected a total of 342 lipid species from 19 major lipid classes by high-coverage targeted lipidomics approach. PCA analysis showed that two different types of WAT were well separated, indicating a distinguished lipidome signature of VAT and SAT (Fig. 1A). Loading scores of PCA analysis for main lipid classes demonstrated that the major lipid classes in SAT were obviously different from VAT, including more content of the phospholipid, sphingomyelin in SAT. Whereas, DAG in SAT exhibited the least alteration compared with VAT (Fig. 1B). Volcano plot of all detailed lipid species reconfirmed the similar findings of PCA analysis (Fig. 1C). After quality control and further volcano plot analysis with FDR<0.05, and FC>1.5 using student’s t-test, 104 lipidomic metabolites from 15 lipid classes were significantly higher while only 22 lipidomic metabolite of TAG were significantly lower in SAT than VAT. Figure 1D and 1E exhibited the definite alteration of lipid composition. As expected, TAG comprised the bulk of lipids in both WAT, constituting approximately 95%~97% of the total lipids present. Cho, CE and other glycerolipids including DAG and FFA were also important composition, making up approximately to 2.21%~4.24% of both WAT lipidome. Notably, we observed distinct differences in sphingolipids and glycerophospholipids, which are involved in pivotal cellular processes such as signal transduction, endocytosis and apoptosis. The proportion of sphingolipids and glycerophospholipids multiplied from 0.32% of VAT to 0.71% of SAT. Different from the trend of TAG, more amount of DAG, Cho, FFA and CE existed in SAT. Taken together, our lipidomics analysis preliminarily revealed the heterogeneity in lipidome of visceral fat and subcutaneous fat.
Figure 1.
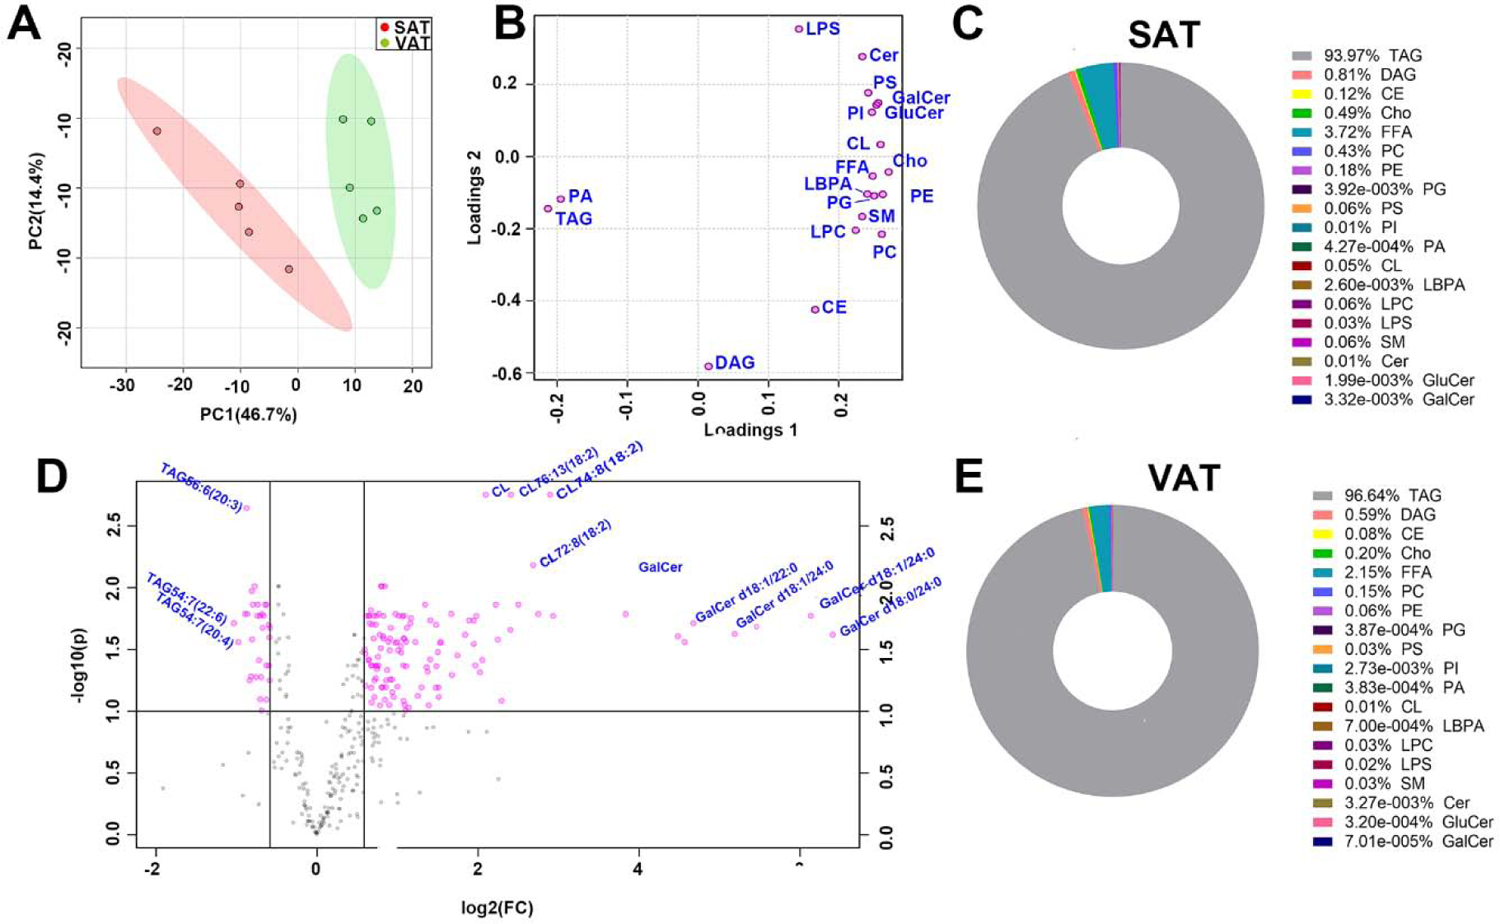
General analysis of subcutaneous and visceral adipose tissue lipidomics profiles in male C57BL/6J mice.(A) PCA analysis of whole lipidome of two WAT, (B) loading scores of PCA analysis for main lipid class, data are showed as SAT/VAT, (C) volcano plot of all lipid species detected from two adipose tissue, data are showed as SAT/VAT, FDR<0.05, fold change >1.5 is high lighted, (D) overall distribution of major lipid classes in SAT, (E) overall distribution of major lipid classes in VAT. n=5 per group.
3.2. Differences of glyceride and fatty acid between two white adipose tissue.
TAG, DAG, and FFA are the main components of adipose tissue and major substrates for lipid oxidation. 110 TAG species were analyzed by using targeted approaches and the detailed changes of species were displayed in figure 2A. The results demonstrated that TAG in VAT was pronouncedly more abundant than SAT. Consistent with the trend of total TAG, species with chain lengths of 54–56 carbons with more than 4 double bonds were homogeneously higher in VAT. Interestingly, TAG with chain lengths of 56 carbons with 2–3 double bonds, including their different isomers: C56:3(20:0), C56:3(20:1), C56:3(18:1), C56:3(18:2), C56:2(20:1), C56:2(18:1), were significantly lower in VAT. However, species analysis of DAG, as the precursor of TAG, exhibited none significant differences between VAT and SAT (Fig. 2B). Notably, 12 species of FFA that we detected were all increased, 8 of which were polyunsaturated (Fig. 2C). These results were in accordance with the tendency of total carbons showed in figure 2D that the 16C, 20C and 22C of FFA were significantly higher in SAT while TAG of 50C, 52C, 54C were significantly lower in SAT.
Figure 2.
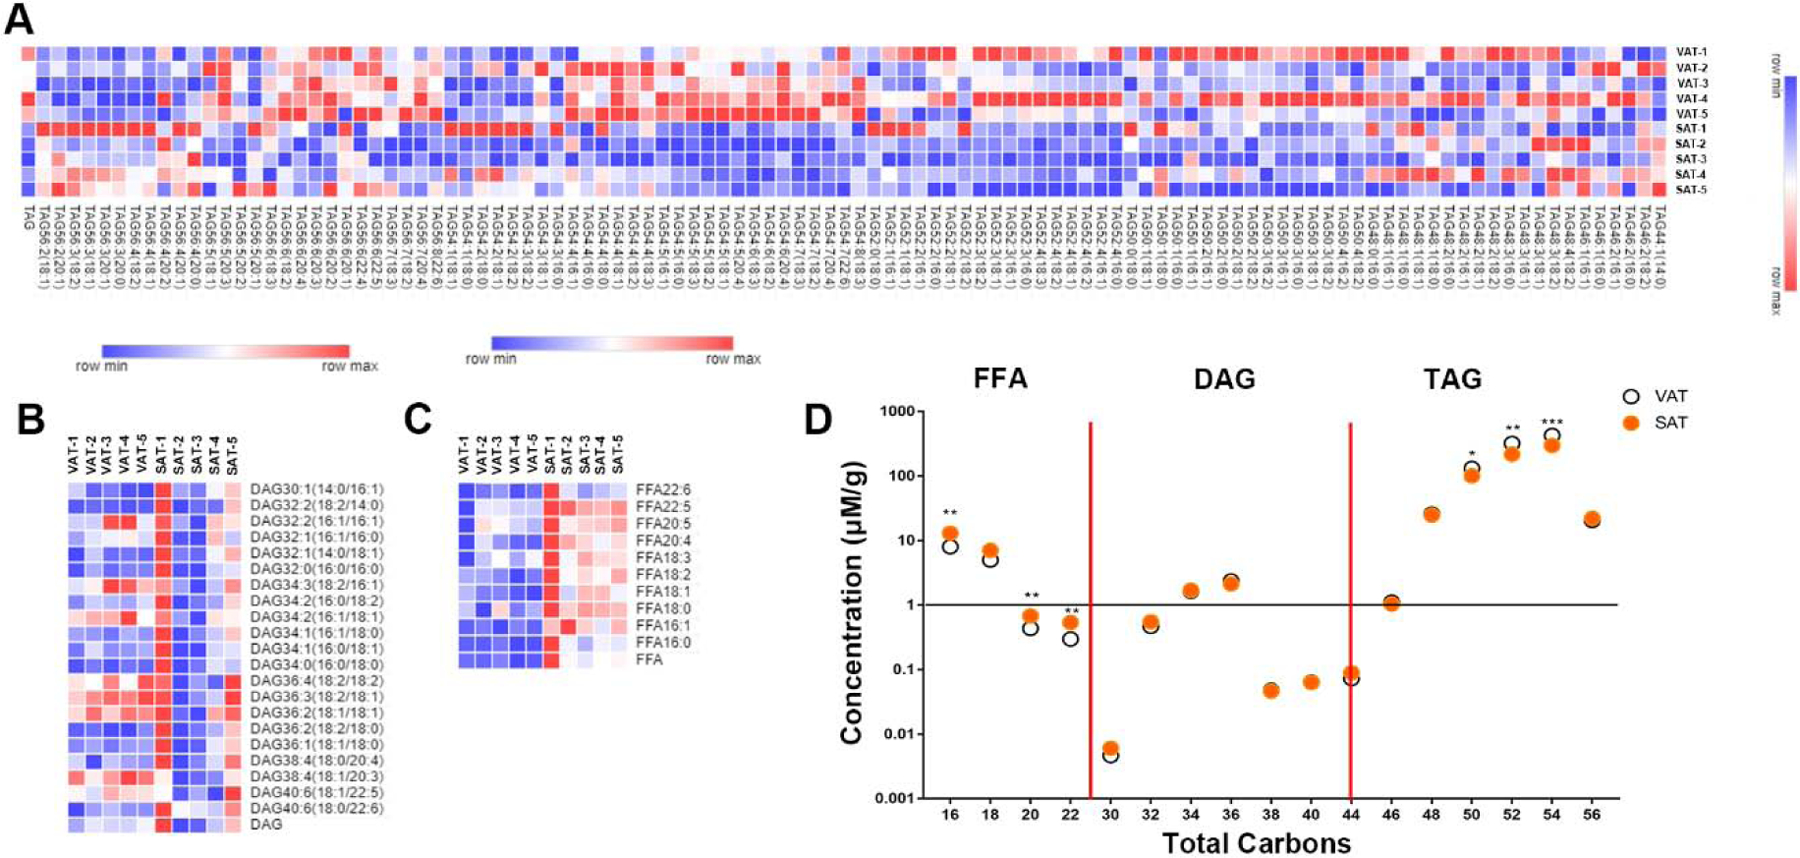
Differences of glyceride and fatty acid between two of WAT. Heatmap analysis of TAG species (A), DAG species (B) and FFA species (C), total carbons changes were analyzed by FFA, DAG, TAG total concentrations (D).Data are presented by mean, n=5 per group, * P<0.05, ** P<0.01, *** P<0.001 compared with VAT.
Consistent with FFA, the content of Cho was also increased significantly in SAT. Several CE species of SAT with higher abundance were displayed in Table 1.
Table 1.
The content of Cho and CE between VAT and SAT.
| Class | Species | Concentration (μmol/g) |
Fold Change of SAT/VAT | Significance | |
|---|---|---|---|---|---|
| VAT | SAT | ||||
| Cho | 1.8345±0.1173 | 2.9672±0.5387 | 1.62 | *** | |
| CE | 0.8269±0.0502 | 0.9048±0.0525 | 1.10 | * | |
| CE-14:0 | 0.0144±0.0016 | 0.0193±0.0027 | 1.34 | ** | |
| CE-15:0 | 0.0105±0.0015 | 0.0124±0.0031 | 1.19 | ||
| CE-16:1 | 0.0549±0.0097 | 0.0791±0.0231 | 1.44 | * | |
| CE-16:0 | 0.0811±0.0148 | 0.1356±0.0210 | 1.67 | *** | |
| CE-17:0 | 0.0065±0.0014 | 0.0078±0.0022 | 1.19 | ||
| CE-18:3 | 0.0120±0.0017 | 0.0171±0.0052 | 1.43 | * | |
| CE-18:2 | 0.2047±0.0413 | 0.2804±0.0389 | 1.37 | * | |
| CE-18:1 | 0.1152±0.0171 | 0.1869±0.0473 | 1.62 | ** | |
| CE-18:0 | 0.0089±0.0028 | 0.0193±0.0055 | 2.17 | ** | |
| CE-20:4 | 0.0548±0.0154 | 0.0686±0.0196 | 1.25 | ||
| CE-20:3 | 0.0166±0.0033 | 0.0191±0.0052 | 1.15 | ||
| CE-20:2 | 0.0040±0.0016 | 0.0045±0.0009 | 1.15 | ||
| CE-20:1 | 0.0047±0.0008 | 0.0093±0.0031 | 2.01 | ** | |
| CE-22:6 | 0.0262±0.0016 | 0.0263±0.0040 | 1.00 | ||
| CE-22:5 | 0.0191±0.0041 | 0.0179±0.0012 | 0.94 | ||
| CE-22:4 | 0.0078±0.0026 | 0.0082±0.0013 | 1.05 | ||
Data are presented by mean ± SD, n=5 per group
P<0.05
P<0.01
P<0.001 compared with VAT.
3.3. Phospholipid composition feature of subcutaneous and visceral white adipose tissues
Despite of the fact that phospholipid constitutes the minority of lipidome in both VAT and SAT, we observed the significant disparity of phospholipid distribution. To further acquire a better understanding of the differences between SAT and VAT in phospholipid composition, we performed a comprehensive analysis. The results exhibited variable raise in major phospholipid class in SAT. PS compromises 5–10% of total phospholipids and is the major source of regulating molecules in lipid synthesis and lipid transportation[23]. As showed in figure 3A–3C, total PS, PI and PG and their species exhibited a higher level in SAT. Interestingly, PA, which is a central intermediate for the synthesis of PS, PC, PE[24, 25], reduced nearly 20% in SAT(Fig. 3D). However, the content of LBPA with chain of 32–34C was significantly raised in VAT (Fig. 3I). In addition, the abundance of PC and PE was especially higher in SAT. Furthermore, most of PC and PE species with ester bond and plasmalogen bond were significantly elevated in SAT (Fig. 3E–3F). Consistent with the high level of its precursor of PC, the content of LPC was also higher in SAT (Fig. 3G). Nonetheless, LPS content showed little difference between SAT and VAT (Fig. 3H).
Figure 3.
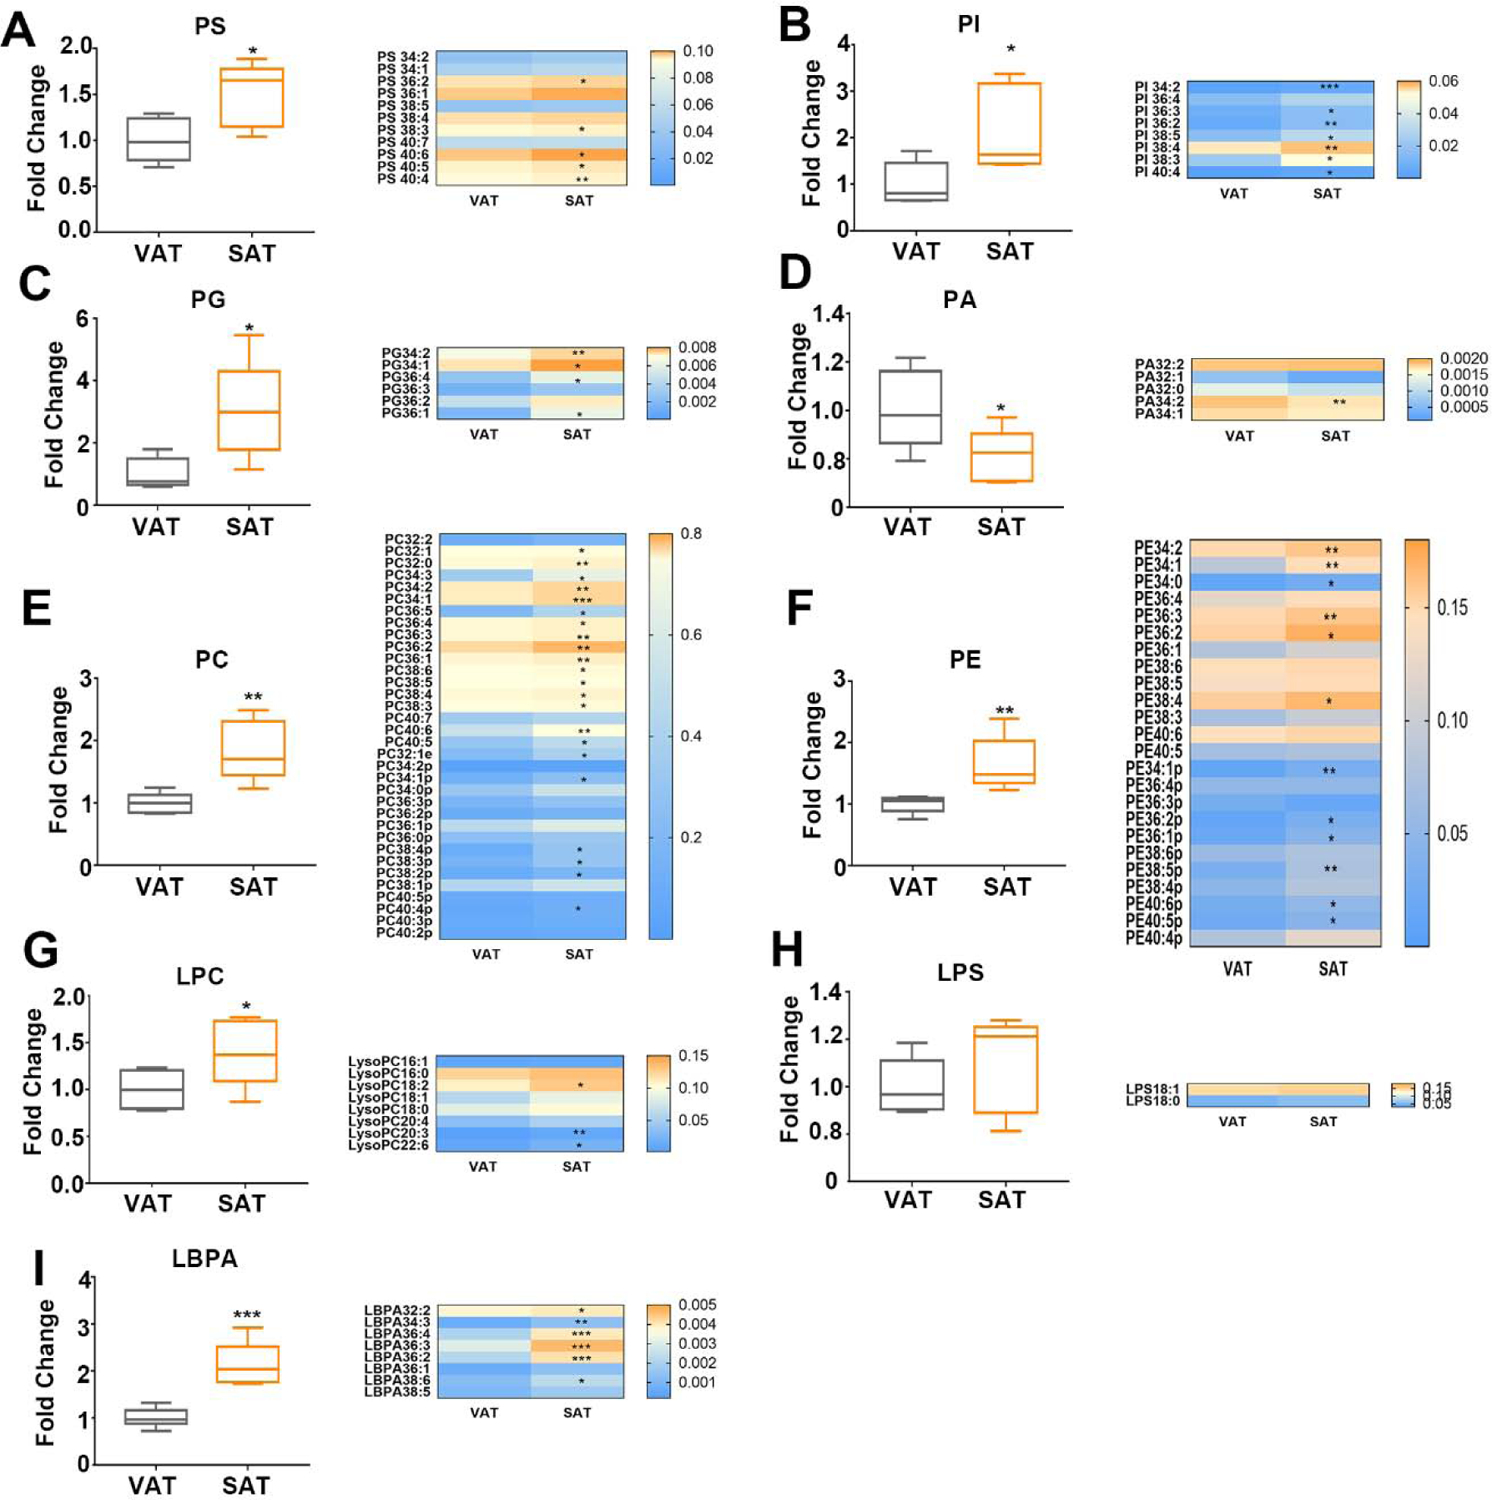
Phospholipid composition feature of subcutaneous and visceral white adipose tissues in mice. Total classes content and mean species content of (A) PS, (B) PI, (C) PG, (D) PA, (E) PC, (F) PE, (G) LPC, (H) LPS, (I)LBPA were analyzed. Data are presented by mean ± SD, n=5 per group, * P<0.05, ** P<0.01, *** P<0.001 compared with VAT.
3.4. Ceramide was significantly more abundant in SAT than VAT
Ceramide, the simplest class of sphingolipids, is responsible for regulating a broad range of cellular signaling including pro-inflammatory cytokine activation. In the current comparative lipid analyses, we found a remarkable elevation of ceramide. The total Cer in SAT was 1.72 times of that in VAT, besides, Cer with long chains of 22C-24C increased significantly in SAT (Fig. 4A, 4B). Strikingly, GalCer in SAT increased 42.99 times, which elevated most significantly among all the sphingomyelin and phospholipid classes (Fig. 4C). We observed all GalCer species in SAT were 2.73 – 84.52 times higher than VAT. In particularly, GalCer d18:1/24:1, and GalCer d18:0/24:1 in SAT were 84.52 and 71.27 times higher than VAT, respectively (Fig. 4D). Moreover, as was consistent with GalCer, the similar elevated trend of GluCer in SAT was observed (Fig. 4E, 4F). As the unsaturation degree and chain numbers of GluCer grew, greater fold change of SAT/VAT ratio was observed. Taken together, compared with VAT, ceramide was significantly more abundant in SAT.
Figure 4.
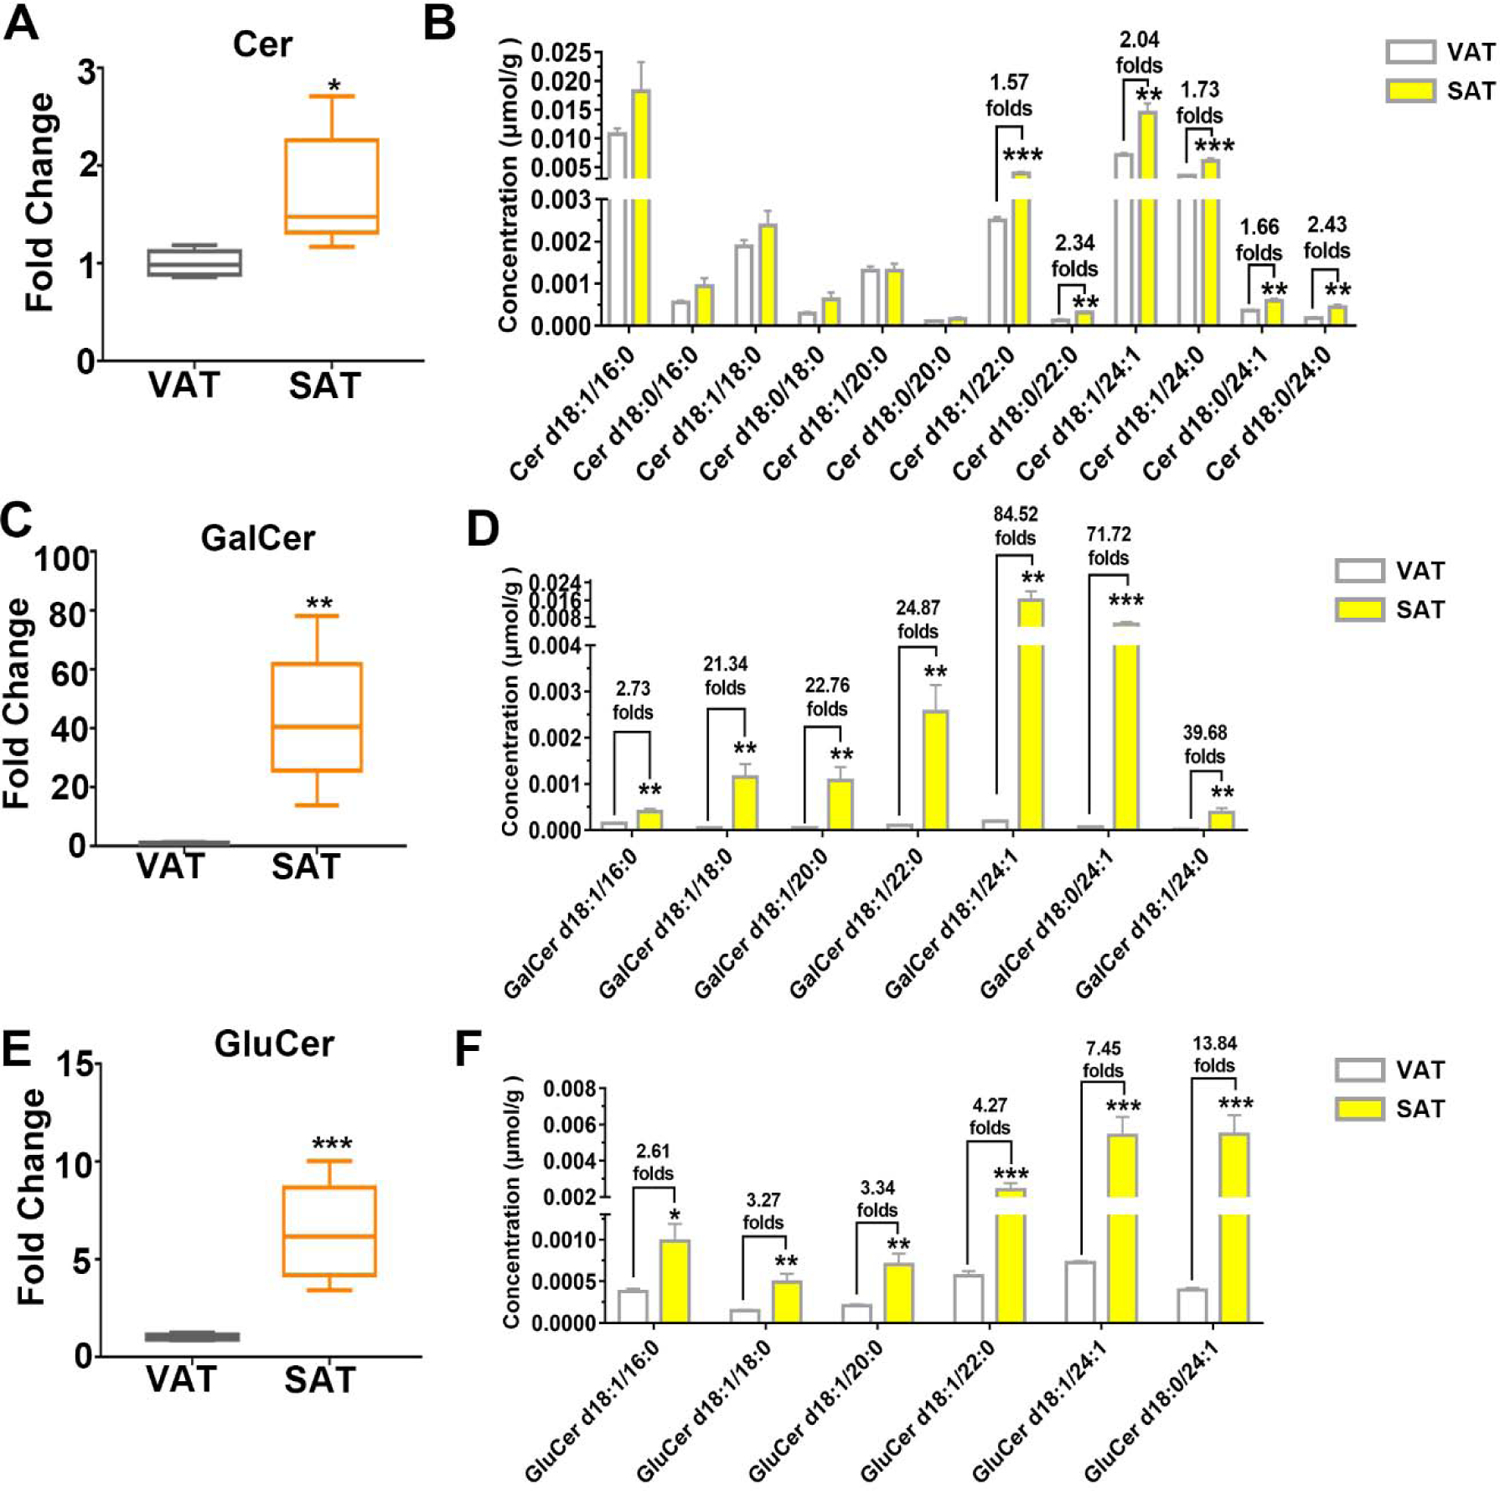
Ceramide was significantly more abundant in SAT than VAT. Content of total classes and specific species of Cer (A) (B), GalCer (C) (D) and GluCer (E) (F) were analyzed. Data are presented by mean ± SD, n=5 per group, * P<0.05, ** P<0.01, *** P<0.001 compared with VAT.
3.5. Cardiolipin metabolism exhibited differences between SAT and VAT
Cardiolipin comprised minority of WAT, however it is largely correlated with thermogenesis and mitochondrial function. In fact, we observed total CL was significantly higher in SAT (Fig. 5A). Among 35 detected species of CL, 33 species showed elevation. CL72:8(18:2) and CL76:13(18:2) were 694% and 551% higher in SAT. More strikingly, CL species containing 18:2 sphingoid base were more abundant in SAT and CL species with 16:1 chain also showed remarkable differences between SAT and VAT(Fig. 5B). We illustrated the concentration of detailed CL species with chain 18:2 and 16:1 in figure 5C and 5D. Most of CL with chain 16:1 was higher in SAT, especially CL68:6(16:1), CL70:6(16:1) and CL70:7(16:1). Consistent with the results of CL 16:1 and the bubble analysis, almost all of CL species with 18:2 in SAT increased significantly except individual species.
Figure 5.
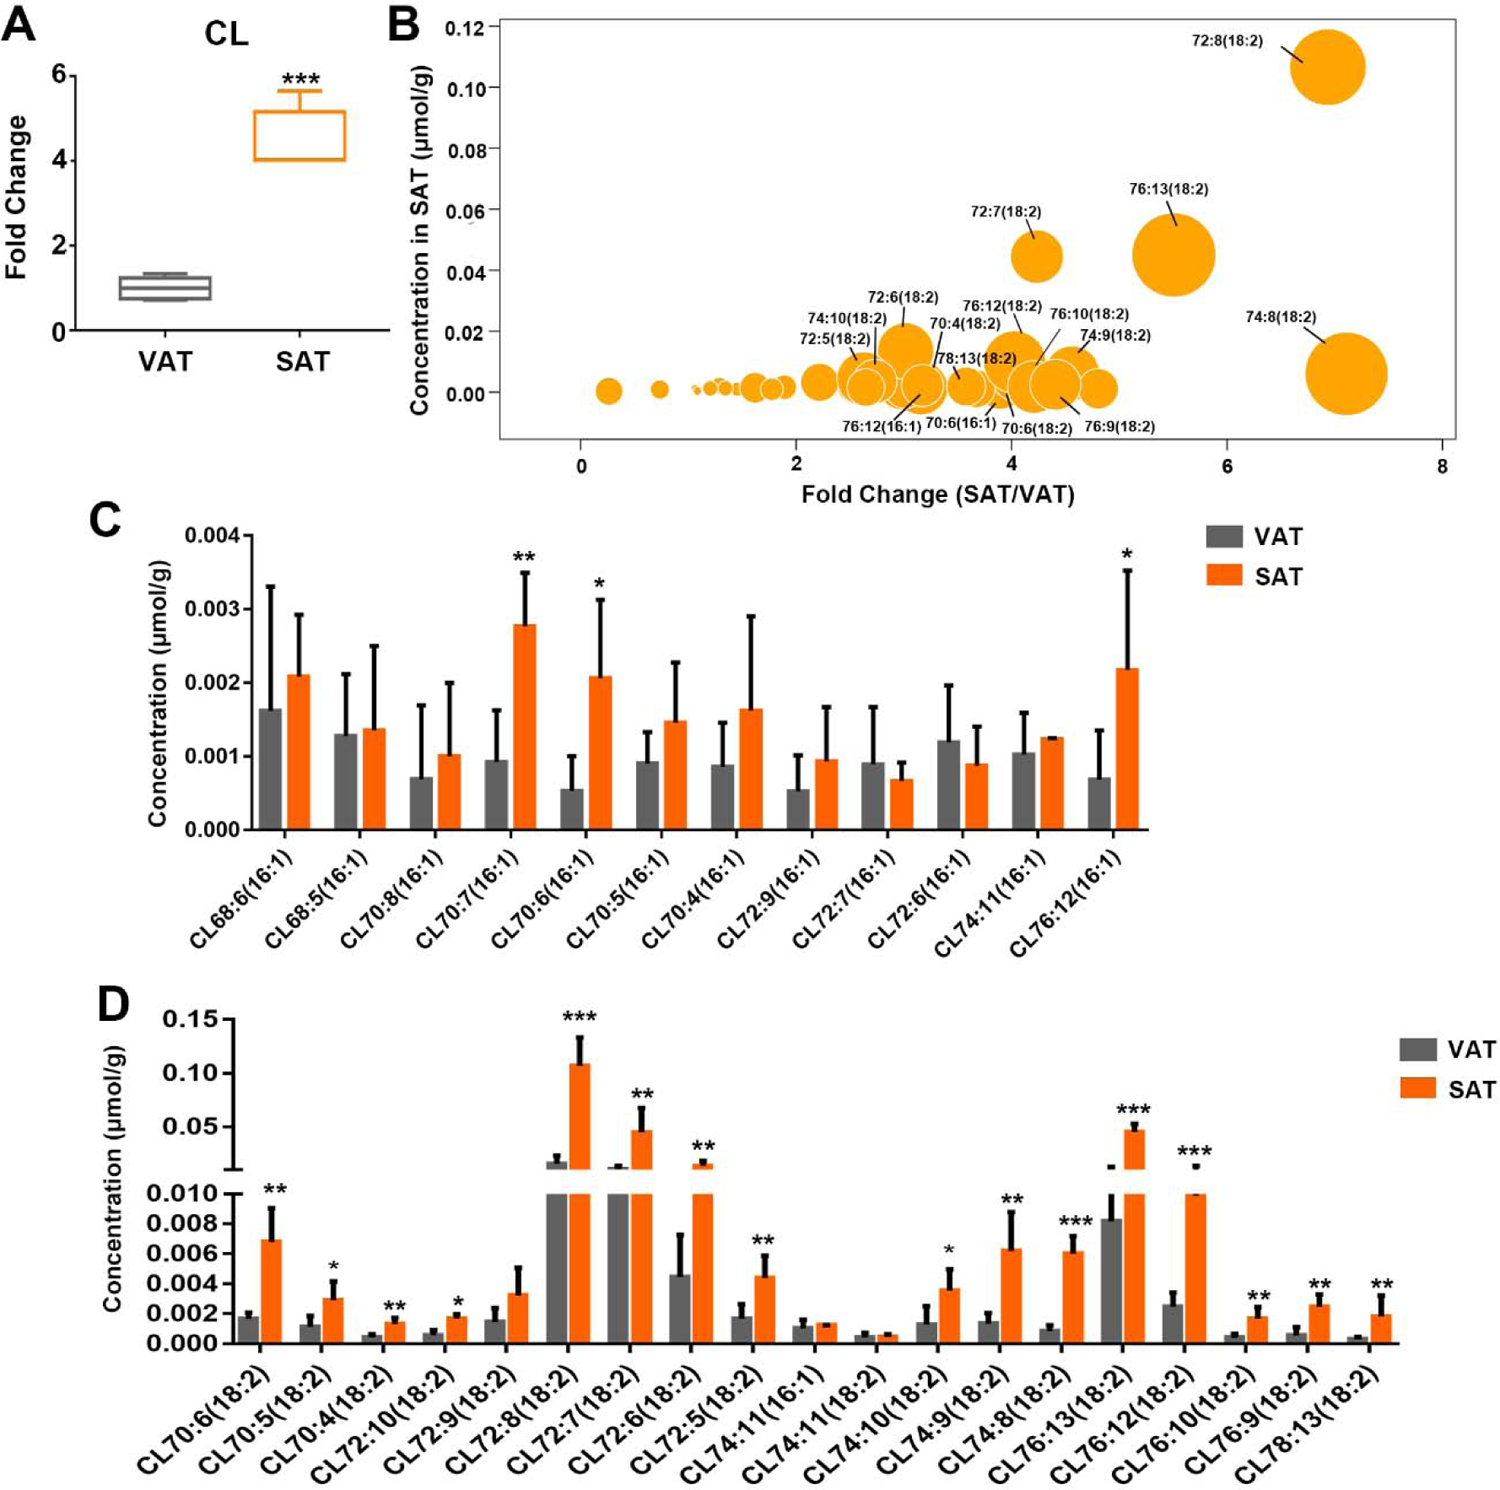
Cardiolipin metabolism exhibited differences between SAT and VAT. (A) Total content of cardiolipin, (B) bubble map of the difference of CL species content between two adipose tissues. Size of circle represented the level of significance calculated by -log 2(p). The content of CL species with 16:1 chain (C), and 18:2 (D) in SAT and VAT was analyzed, respectively. Data are presented by mean ± SD, n=5 per group, * P<0.05, ** P<0.01, *** P<0.001 compared with VAT.
3.6. Network analysis of lipidomics and transcriptomics
The correlation network analysis of top 126 different species was performed from whole lipidome of both WAT. As shown in figure 6A, TAG, which was lower in SAT, formed two distinct subnet work: one containing less unsaturated bonds with shorter carbons chains (C50–C52), the other containing more unsaturated bonds (5–7) with longer carbons chains (C50–C52). However, TAG species which was elevated in SAT such as TAG 56:2(20:1) and TAG 56:4(20:0), had more connection to other lipid species with higher relative value. Although GluCer and GalCer changed most significantly among the whole lipidome, they formed a separated network with less connection with other lipid. In addition, PE, PG and CL were more interactive with other species.
Figure 6.
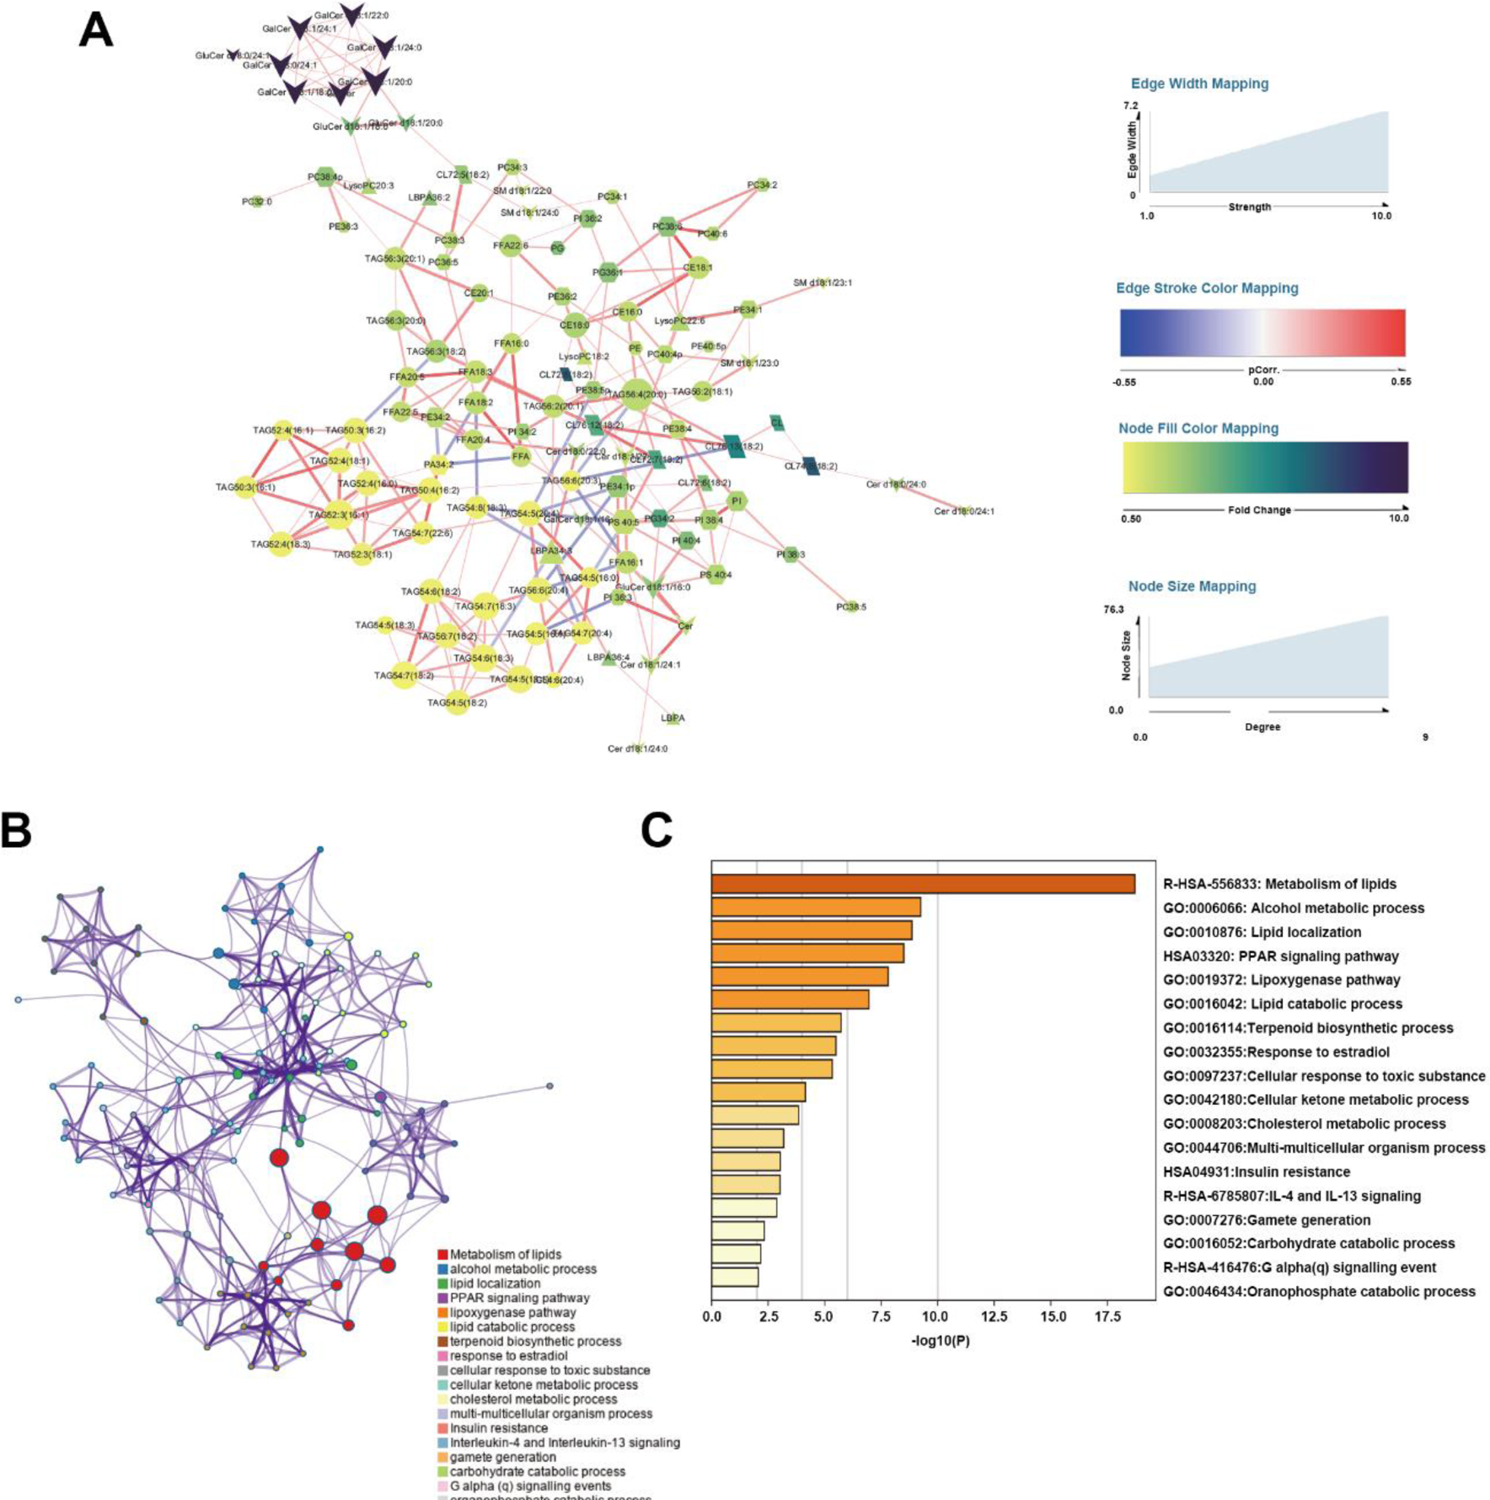
Integrated transcriptomics and lipidomic network analysis. (A) Differential correlation of lipidomic network. Each nude with different shapes represented a lipid species. The size and color represented the connection degree and fold change of SAT/VAT respectively. The thickness of edges expressed the connection strength. The edge stroke color represented the p.correlation calculated as described in method. (B) Enriched Ontology Clusters, terms including GO/KEGG terms, canonical pathways, hall mark gene sets, etc., were represented by a circle node, where its size was proportional to the number of input genes fall into that term, and its color represented its cluster identity. Terms with a similarity score > 0.3 were linked, the thickness of edge represents the similarity score. (C) Heatmap of selected enrichment ontology
We then applied transcriptomic analysis as the supplement of the observations from the metabolomic investigations. Fifty-one genes that existed both in LIPID MAPS and in microarray results with fold change > 2 as well as FDR < 0.05 were screened and analyzed by Metascape. The Enriched ontology clusters (Fig. 6B) and heatmap analysis (Fig. 6C) vindicated that the differences of gene expression were mainly involved in lipid metabolism, lipid localization, lipoxygenase and cholesterol metabolic process. Notably, insulin resistance and inflammatory signaling were also largely involved. Taken together, the lipid correlation network combined enriched ontology suggested a complementary consistence of the heterogeneity of WAT involved in lipid metabolism, while the interaction between glycerolipid, phospholipid and sphingolipid may also play an important role.
3.7. Gene expression of synthesis and breakdown pathways for differential lipids in VAT and SAT
To further verify the transcriptional profiles, we assayed the gene expression of important enzymes and regulators for synthesis and breakdown pathways of glyceride, cardiolipin, ceramide and phospholipid interconversion. As shown in figure 7A, fatty acid synthesis related genes including Fasn and Elovl6 markedly increased in SAT, which could be correlational to higher level of polyunsaturated FFA in SAT. Accordantly, Chrebp, which is a major determinant in adipose tissue of fatty acid synthesis and systemic insulin sensitivity, escalated in SAT.
Figure 7.
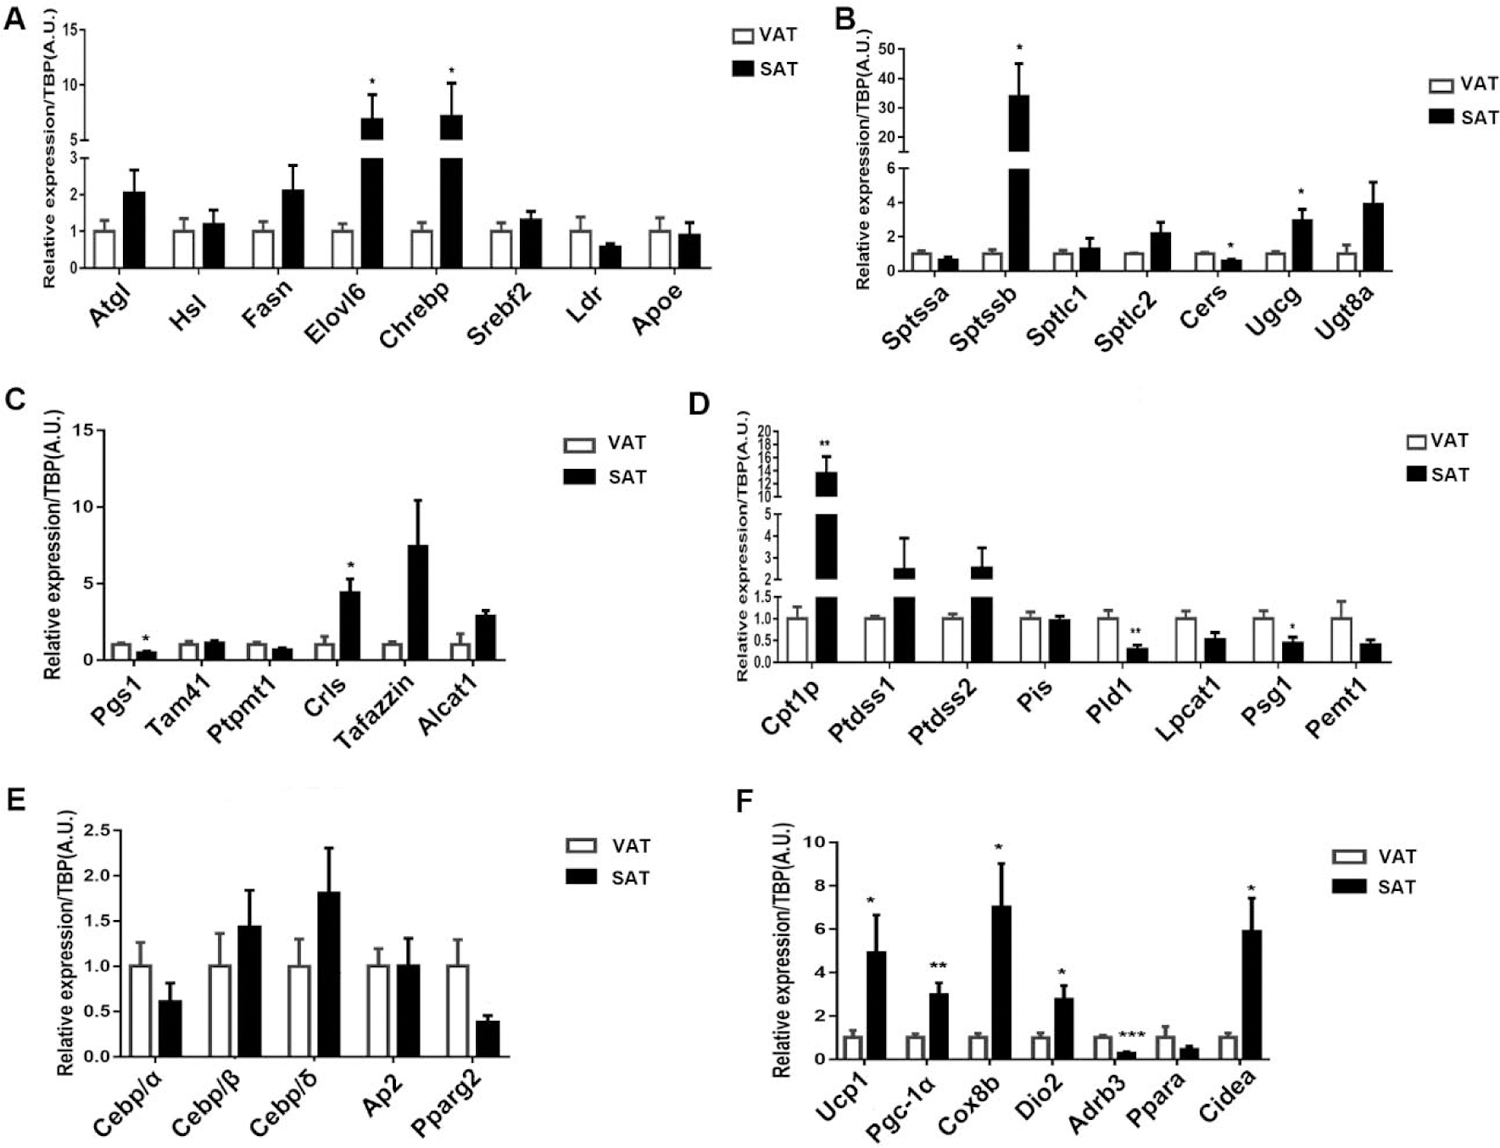
Gene of lipid synthesis and breakdown pathways expressed differently in in VAT and SAT. qPCR analysis of (A) glyceride metabolism related genes, (B) ceramide synthesis related genes, (C) cardiolipin synthesis related genes, (D) phospholipid interconversion related genes, (E) adipocyte differentiation related genes and (F) thermogenesis related genes. qPCR data are normalized to TBP and presented as mean ± SD, n = 6. * P<0.05, ** P<0.01, *** P<0.001 compared with VAT.
As for Cer synthesis, most of key proteins regulating Cer’s chain length and its degree of desaturation expressed higher in SAT especially Sptssb. Also, the higher levels of glucosylceramide synthase (Ugcg) and galactosylceramide synthase (Ugt8a) were related with more abundant of GalCer and GluCer in SAT (Fig. 7B). Figure 7C displayed the key genes in de novo synthesis and remodeling of CL. Interestingly, Pgs1 which catalyzes the precursor of CL formation was significantly lower in SAT, while Crls1 catalyzing the final reaction of de novo synthesis of CL was higher in SAT. Moreover, genes mediated CL remodeling shifts acyl composition towards unsaturation including Tafazzin and Alcat1 expressed higher in SAT. These results suggested the final synthesis and remodeling of CL might be enhanced in SAT. Cpt1p and Ptdss1/2, genes of synthesis of PC and PS were highly expressed in SAT. Nonetheless, genes in interconversion of phospholipid, including Pld1 hydrolyzing PC to PA and Psd1 converting PS to PE, were lower in SAT (Fig. 7D).
We next examined the basal level of gene expression in adipocyte differentiation and thermogenesis. The result of genes involved in adipocyte differentiation showed little difference between two depots adipose tissue. However, significantly increase of thermogenesis genes in SAT were observed, indicating a prominent ability of thermogenesis of SAT. (Fig. 7E–7F).
4. Discussion
Lipidomics analysis serves as a powerful approach to illustrate the interrelation between mechanism and phenotype directly. Depot-specific lipidome is prerequisite for revealing the heterogeneity of WAT and understanding their specialized functions. In the current study, we analyzed the basal level of lipid composition of two white fat depots from male C57BL/6J mice through targeted lipidomics approaches and generated detailed lipid profiles, including total 342 lipid species from 19 major lipid classes. In addition to glycerolipid and sterol lipid, phospholipid and sphingolipid classes were identified as well. The lipid correlation network combined with transcriptomics analysis displayed integrative connection of TAG with phospholipid and genes in regulating lipid metabolism.
It has been reported that accumulation in VAT of central fat is associated with metabolic disease including diabetes, while the excess SAT accumulation may even be protective against metabolic syndrome[3]. However, does this mean VAT always contain the “bad lipid” which may be positively related with insulin resistance or inflammation? The basal lipidome of two adipose tissue exhibited distinctive heterogeneity of WAT, and we will discuss this in the following content.
The most abundant lipid we examined in both WAT was TAG, which comprised more than 95% of VAT and SAT. Nonetheless, TAG’s chain length and saturation were quite different. This composition pattern was consistent with lipidomic studies of WAT in human[14]. The increase of TAG (C56:3) is reported to be positively correlated with T2DM[26], however, we observed that TAG of 56 carbons with 2–3 double bonds were significantly lower in VAT. In adipose tissue, TAG is hydrolyzed into DAG and FFA. Our results showed that Atgl and Hsl, which are responsible for hydrolysis of about 95% TAG, expressed higher in SAT. Meanwhile, the expression of gens regulating fatty acid synthesis especially unsaturated fatty acids synthesis such as Elovl6 increased in SAT, which could be related with significantly higher polyunsaturated FFA in SAT. In fact, elevated fatty acid efflux from adipose tissue triggers endoplasmic reticulum (ER) stress and inflammation in adipose tissues[4, 5]. VAT is the main contributor for making up 40% of increasing FFA to induce ER stress and inflammation[27]. In the current study, higher basal level of glycerolipid were observed in SAT, further investigations to elucidate the regulation of stress-responding in metabolic syndrome are needs.
Phospholipids are important lipid classes involved in cellular inflammatory response[28]. Thus, phospholipid composition of depot-specific adipose tissue is important for understanding the link between inflammation and disease susceptibility. In the current study, 187 species from 14 phospholipid class were detected, including sphingolipid, cardiolipin, PG, PI, PE and PS. The results of phospholipid displayed a distinct distribution in VAT and SAT. Previous studies proved that VAT was susceptible to inflammation with higher macrophage infiltration rate[29] and was more likely to secrete pro-inflammatory cytokines in stimuli response[30]. In SAT, the majority of PC and PE contained polyunsaturated bonds, ether bonds and plasmalogen bonds. These highly active side chains of phospholipids in cellular membranes or lipoproteins can be oxidatively modified during inflammation or oxidative stress[31]. In addition, the enriched ontology analysis of LIPID MAPS and microarray showed that IL-4 and IL-13 signaling pathways were largely involved. IL-4 and IL-13 together with apoptotic cells induced tissue repair program in macrophage[32]. These results indicated divergent abilities of WAT in response to inflammatory stimuli but requires further mechanism investigations.
Interestingly, we observed sphingolipid ceramide increased markedly in SAT, particularly GalCer d18:1/24:1 which was almost 84.52 times higher than VAT. Sphingolipids are crucial for adipocytes in nutrient-sensing and adjusting their function of thermogenic and metabolic activities[33]. Previously study found that increasing GluCer by overexpression of GluCer synthase enhanced insulin signaling[34]. In Schweizer’s lipidomic analysis of white preadipocytes and differentiated adipocytes, they found Cer species of 20:0, 22:0, and 24:1 correlated with adipose browning[13]. In this study, it was notable that GluCer and GalCer containing side chain of 22:0 and 24:1 were significantly increased in SAT. Meanwhile, the higher genes expression of regulating biosynthesis and conversion of Cer to GalCer and GluCer was also related with this lipidomic results. These results suggested SAT might be more active in thermogenic and metabolic activities from the basal lipidomic point of view.
White fat browning occurred after cold exposure, exercise or beta 3-adrenergic agonists stimulation[35, 36], leading to the increased thermogenesis and reinforced mitochondrial function. The heterogeneity of WAT is also displayed as browning is easy for SAT but hard for VAT. As hallmark of thermogenic activation[37], cardiolipin is highly accumulated in BAT[38]. In the current study, we found that the distribution of CL in two depots of white adipose tissue was quite distinct. CL was 4.48 times higher in SAT than VAT. Interestingly, the expression of Crls1, which catalyze the final step of de novo synthesis of CL, was higher in SAT. In the current study, we also observed the basal levels of thermogenic genes such as Ucp1, Pgc-1α and Dio2 were significantly higher in SAT, which could be correlational with the findings in lipidomic profile.
The linoleic acid (18:2) makes up 80–90% of the total CL acyl chains. In fact, (18:2)4CL is known for directly affecting the mitochondrial cristae formation[39]. Moreover, Matthew D. Lynes reported the increase of CL with 16:1 acyl chain increased after cold exposure[40]. Our another striking observation was that CL with 18:2 or 16:1 acyl chain were significantly higher in SAT. This signature of CL side chain composition could be correlational with a higher expression of Tafazzin and Alcat1, which mediated CL remodeling shifts acyl composition towards unsaturation. In addition, the elevated PC and PE, which compromised 40% and 30% of mitochondrial inner membrane, suggested a higher mitochondrial function in SAT. More specifically, the highly expression of Cox8b, gene encoding mitochondrial “respiratory chain complex V (ATP synthase subunits) may also related with a reinforced mitochondrial activities. Collectively, the great differences of CL composition and basal levels of thermogenic genes may offer new insight in understanding intrinsic mechanism of WAT browning heterogeneity.
The correlation network analysis suggested TAG interacted more with phospholipid and sphingolipid, indicating TAG played an important role in the intrinsic network of interaction glyceride with phospholipid and sphingolipid. This was supplemented by the enriched gene ontology analysis, which showed that lipid metabolism related genes expression was significantly different in VAT and SAT. The important enzymes of lipids synthesis and breakdown pathways also expressed distinctly in VAT and SAT. Lipid metabolism is flexible and influenced by energy balance to adapt the surplus energy storage[12]. However, the unbalanced energy status induced by obesity, diabetes or hyperlipidemia will affect the lipogenesis and consequently influence the phospholipid and sphingolipid network we discussed above. The divergent lipid composition and lipid metabolism genes expression between SAT and VAT reflected their different abilities in sensing, responding and adapting to the energy status.
In summary, the current study presented a comprehensive analysis of lipidome in depot-specific adipose tissue on scale of the entire lipidome combined with transcriptomics analysis, providing new insight in comprehensive understanding of the WAT heterogeneity. The differences of lipidome composition between VAT and SAT reflected the heterogeneity of WAT in lipidolysis, lipogenesis, inflammatory response and thermogenesis. The lipidome of depot-specific adipose tissue might serve as a reference lipid bank for further studies. More researches deciphering the connection of lipidome to their heterogeneity are needed. Taken together, our work will facilitate identifying new therapeutic targets and developing new strategies to combat metabolic diseases.
Supplementary Material
Funding:
This project was funded by National Natural Science Foundation of China (81770847), the Drug Innovation Major Project (2018ZX09711001-003-005), the CAMS Innovation Fund for Medical Sciences (CIFMS) (2017-I2M-1-010, 2016-I2M-3-007) and National Key Research and Development Plan (2016YFC1000905). R00 DK090210, R01 DK109015, Center for Society for Clinical and Translational Research Early Career Development Award and UIC Startup fund (C.W.L.)
Footnotes
Publisher's Disclaimer: This is a PDF file of an unedited manuscript that has been accepted for publication. As a service to our customers we are providing this early version of the manuscript. The manuscript will undergo copyediting, typesetting, and review of the resulting proof before it is published in its final form. Please note that during the production process errors may be discovered which could affect the content, and all legal disclaimers that apply to the journal pertain.
Conflicts of Interest: The authors declare that the research was conducted in the absence of any commercial or financial relationships that could be construed as a potential conflict of interest. Author Bowen Li was employed by company LipidALL Technologies Ltd.. All other authors declare no competing interests.
References
- [1].Kitahara CM, et al. Association between class III obesity (BMI of 40–59 kg/m2) and mortality: a pooled analysis of 20 prospective studies. PLoS medicine, 2014, 11(7): e1001673. [DOI] [PMC free article] [PubMed] [Google Scholar]
- [2].Kwok KH, et al. Heterogeneity of white adipose tissue: molecular basis and clinical implications. Experimental & molecular medicine, 2016, 48(3): e215. [DOI] [PMC free article] [PubMed] [Google Scholar]
- [3].Fox CS, et al. Abdominal visceral and subcutaneous adipose tissue compartments: association with metabolic risk factors in the Framingham Heart Study. Circulation, 2007, 116(1): 39–48 [DOI] [PubMed] [Google Scholar]
- [4].Kahn SE, et al. Obesity, body fat distribution, insulin sensitivity and islet β-cell function as explanations for metabolic diversity. The Journal of nutrition, 2001, 131(2): 354S–60S [DOI] [PubMed] [Google Scholar]
- [5].Qiang G, et al. The obesity-induced transcriptional regulator TRIP-Br2 mediates visceral fat endoplasmic reticulum stress-induced inflammation. Nature communications, 2016, 7: 11378. [DOI] [PMC free article] [PubMed] [Google Scholar]
- [6].Tchkonia T, et al. Mechanisms and metabolic implications of regional differences among fat depots. Cell metabolism, 2013, 17(5): 644–56 [DOI] [PMC free article] [PubMed] [Google Scholar]
- [7].Perrini S, et al. Fat depot-related differences in gene expression, adiponectin secretion, and insulin action and signalling in human adipocytes differentiated in vitro from precursor stromal cells. Diabetologia, 2008, 51(1): 155–64 [DOI] [PubMed] [Google Scholar]
- [8].Gesta S, et al. Evidence for a role of developmental genes in the origin of obesity and body fat distribution. Proceedings of the National Academy of Sciences, 2006, 103(17): 6676–81 [DOI] [PMC free article] [PubMed] [Google Scholar]
- [9].Pérez-Pérez R, et al. Differential proteomics of omental and subcutaneous adipose tissue reflects their unalike biochemical and metabolic properties. Journal of proteome research, 2009, 8(4): 1682–93 [DOI] [PubMed] [Google Scholar]
- [10].May FJ, et al. Lipidomic adaptations in white and brown adipose tissue in response to exercise demonstrate molecular species-specific remodeling. Cell reports, 2017, 18(6): 1558–72 [DOI] [PMC free article] [PubMed] [Google Scholar]
- [11].Chondronikola M, et al. Brown adipose tissue activation is linked to distinct systemic effects on lipid metabolism in humans. Cell metabolism, 2016, 23(6): 1200–6 [DOI] [PMC free article] [PubMed] [Google Scholar]
- [12].Caesar R, et al. A combined transcriptomics and lipidomics analysis of subcutaneous, epididymal and mesenteric adipose tissue reveals marked functional differences. PLoS one, 2010, 5(7): e11525. [DOI] [PMC free article] [PubMed] [Google Scholar]
- [13].Schweizer S, et al. The lipidome of primary murine white, brite, and brown adipocytes-Impact of beta-adrenergic stimulation. PLoS Biol, 2019, 17(8): e3000412 [DOI] [PMC free article] [PubMed] [Google Scholar]
- [14].Jove M, et al. Human omental and subcutaneous adipose tissue exhibit specific lipidomic signatures. Faseb j, 2014, 28(3): 1071–81 [DOI] [PubMed] [Google Scholar]
- [15].Lam SM, et al. The brain lipidomes of subcortical ischemic vascular dementia and mixed dementia. Neurobiology of aging, 2014, 35(10): 2369–81 [DOI] [PMC free article] [PubMed] [Google Scholar]
- [16].Shui G, et al. Toward one step analysis of cellular lipidomes using liquid chromatography coupled with mass spectrometry: application to Saccharomyces cerevisiae and Schizosaccharomyces pombe lipidomics. Mol Biosyst, 2010, 6(6): 1008–17 [DOI] [PubMed] [Google Scholar]
- [17].Chan RB, et al. Comparative lipidomic analysis of mouse and human brain with Alzheimer disease. Journal of Biological Chemistry, 2012, 287(4): 2678–88 [DOI] [PMC free article] [PubMed] [Google Scholar]
- [18].Basu S, et al. Sparse network modeling and metscape-based visualization methods for the analysis of large-scale metabolomics data. Bioinformatics, 2017, 33(10): 1545–53 [DOI] [PMC free article] [PubMed] [Google Scholar]
- [19].Afshinnia F, et al. Lipidomic Signature of Progression of Chronic Kidney Disease in the Chronic Renal Insufficiency Cohort. Kidney Int Rep, 2016, 1(4): 256–68 [DOI] [PMC free article] [PubMed] [Google Scholar]
- [20].Fic A, et al. Genome-wide gene expression profiling of low-dose, long-term exposure of human osteosarcoma cells to bisphenol A and its analogs bisphenols AF and S. Toxicology in Vitro, 2015, 29(5): 1060–9 [DOI] [PubMed] [Google Scholar]
- [21].Zhou Y, et al. Metascape provides a biologist-oriented resource for the analysis of systems-level datasets. Nat Commun, 2019, 10(1): 1523. [DOI] [PMC free article] [PubMed] [Google Scholar]
- [22].Shannon P, et al. Cytoscape: a software environment for integrated models of biomolecular interaction networks. Genome Res, 2003, 13(11): 2498–504 [DOI] [PMC free article] [PubMed] [Google Scholar]
- [23].Cifkova E, et al. Hydrophilic interaction liquid chromatography-mass spectrometry of (lyso)phosphatidic acids, (lyso)phosphatidylserines and other lipid classes. J Chromatogr A, 2016, 1439: 65–73 [DOI] [PubMed] [Google Scholar]
- [24].Gibellini F and Smith TK. The Kennedy pathway--De novo synthesis of phosphatidylethanolamine and phosphatidylcholine. IUBMB Life, 2010, 62(6): 414–28 [DOI] [PubMed] [Google Scholar]
- [25].Haucke V and Di Paolo G. Lipids and lipid modifications in the regulation of membrane traffic. Curr Opin Cell Biol, 2007, 19(4): 426–35 [DOI] [PMC free article] [PubMed] [Google Scholar]
- [26].Al-Sulaiti H, et al. Triglyceride profiling in adipose tissues from obese insulin sensitive, insulin resistant and type 2 diabetes mellitus individuals. Journal of translational medicine, 2018, 16(1): 175. [DOI] [PMC free article] [PubMed] [Google Scholar]
- [27].Meek SE, et al. Insulin regulation of regional free fatty acid metabolism. Diabetes, 1999, 48(1): 10–4 [DOI] [PubMed] [Google Scholar]
- [28].Calderon CL, et al. Involvement of protein kinase C and not of NFκB in the modulation of macrophage nitric oxide synthase by tumor-derived phosphatidyl serine. International journal of oncology, 2008, 32(3): 713–21 [PubMed] [Google Scholar]
- [29].Pou KM, et al. Visceral and subcutaneous adipose tissue volumes are cross-sectionally related to markers of inflammation and oxidative stress: the Framingham Heart Study. Circulation, 2007, 116(11): 1234–41 [DOI] [PubMed] [Google Scholar]
- [30].Fain JN, et al. Comparison of the release of adipokines by adipose tissue, adipose tissue matrix, and adipocytes from visceral and subcutaneous abdominal adipose tissues of obese humans. Endocrinology, 2004, 145(5): 2273–82 [DOI] [PubMed] [Google Scholar]
- [31].Freigang S The regulation of inflammation by oxidized phospholipids. European journal of immunology, 2016, 46(8): 1818–25 [DOI] [PubMed] [Google Scholar]
- [32].Bosurgi L, et al. Macrophage function in tissue repair and remodeling requires IL-4 or IL-13 with apoptotic cells. Science, 2017, 356(6342): 1072–6 [DOI] [PMC free article] [PubMed] [Google Scholar]
- [33].Chaurasia B, et al. Adipocyte ceramides regulate subcutaneous adipose browning, inflammation, and metabolism. Cell Metabolism, 2016, 24(6): 820–34 [DOI] [PubMed] [Google Scholar]
- [34].Chavez JA, et al. Ceramides and glucosylceramides are independent antagonists of insulin signaling. Journal of Biological Chemistry, 2014, 289(2): 723–34 [DOI] [PMC free article] [PubMed] [Google Scholar]
- [35].Otero-Díaz B, et al. Exercise induces white adipose tissue browning across the weight spectrum in humans. Frontiers in physiology, 2018, 9: 1781. [DOI] [PMC free article] [PubMed] [Google Scholar]
- [36].Harms M and Seale P. Brown and beige fat: development, function and therapeutic potential. Nature medicine, 2013, 19(10): 1252. [DOI] [PubMed] [Google Scholar]
- [37].Sustarsic EG, et al. Cardiolipin synthesis in brown and beige fat mitochondria is essential for systemic energy homeostasis. Cell Metabolism, 2018, 28(1): 159–74. e11 [DOI] [PMC free article] [PubMed] [Google Scholar]
- [38].Faber C, et al. Cardiolipin profiles as a potential biomarker of mitochondrial health in diet-induced obese mice subjected to exercise, diet-restriction and ephedrine treatment. J Appl Toxicol, 2014, 34(11): 1122–9 [DOI] [PubMed] [Google Scholar]
- [39].Schlame M and Ren M. The role of cardiolipin in the structural organization of mitochondrial membranes. Biochimica et Biophysica Acta (BBA)-Biomembranes, 2009, 1788(10): 2080–3 [DOI] [PMC free article] [PubMed] [Google Scholar]
- [40].Lynes MD, et al. Cold-activated lipid dynamics in adipose tissue highlights a role for cardiolipin in thermogenic metabolism. Cell reports, 2018, 24(3): 781–90 [DOI] [PMC free article] [PubMed] [Google Scholar]
Associated Data
This section collects any data citations, data availability statements, or supplementary materials included in this article.


