

Abstract
Memory B cells (MBCs) have enhanced capabilities to differentiate to plasma cells and generate a rapid burst of antibodies upon secondary stimulation. To determine if MBCs harbor an epigenetic landscape that contributes to increased differentiation potential, we derived the chromatin accessibility and transcriptomes of influenza-specific IgM and IgG MBCs compared to naïve cells. MBCs possessed an accessible chromatin architecture surrounding plasma cell specific genes, as well as altered expression of transcription factors and genes encoding cell cycle, chemotaxis, and signal transduction processes. Intriguingly, this MBC signature was conserved between humans and mice. MBCs of both species possessed a heightened heme signature compared to naïve cells. Differentiation in the presence of hemin enhanced oxidative phosphorylation metabolism and MBC differentiation into antibody secreting plasma cells. Thus, these data define conserved MBC transcriptional and epigenetic signatures that include a central role for heme and multiple other pathways in augmenting MBC reactivation potential.
INTRODUCTION
Long-lived humoral immunity is realized through the joint functions of memory B cells (MBCs) and plasma cells (PCs). Naïve B cells (nBs) and MBCs have similar fates upon T-dependent stimulation although MBCs respond more quickly and with greater magnitude to antigenic challenge (1, 2). For the most part, MBCs tend to be affinity matured with class-switched BCRs (3–5) and gain unique surface markers, such as CD73, PD-L2, and CD80 (6, 7). It is now also appreciated that IgM+ MBCs are also key players in memory responses (8, 9). For class-switched MBCs, enhanced immune responses have been attributed in part to the signaling capacity of the IgG versus IgM BCR (4). However, naïve cells genetically engineered to express the IgG BCR respond similarly to IgM+ nBs (10). Together, these data suggest that alternative mechanisms function to promote heightened MBC functional responses.
One possibility is that MBCs have acquired epigenetic programming that distinguishes them from their naïve precursors. Evidence supporting this hypothesis includes the role of the monocytic leukemia zinc finger protein (MOZ), a histone acetyltransferase that targets H3K9 and is required for high affinity class-switched MBCs (11). Human MBCs harbor an unique DNA methylation profile compared to naïve, germinal center (GC) B cells, and PCs (12, 13). In a similar manner, memory CD8 T cells maintain a primed chromatin accessibility architecture at key effector genes (14). Changes in the levels of transcription factors also correlate with MBC properties. For example, Krüppel-like factor 4 (KLF4) restricts the proliferative response and is decreased in expression in MBCs compared to naïve. Similarly, down regulation of BACH2, a repressor of BLIMP-1 and the PC fate, has been proposed as one mechanism for enhanced MBC differentiation potential (10). In contrast, upregulation of ZBTB32 restrains MBC secondary responses (15). Despite this understanding, the molecular programming of MBC subsets remains incomplete.
Here, we define the transcriptional and chromatin accessibility profiles of IgM and IgG MBC subsets compared to nBs. We found that MBCs harbor distinct epigenetic programming from nBs that is conserved between the MBCs of mice and humans. This programming includes the priming of accessible chromatin surrounding PC specific genes, some of which are BLIMP-1 targets. Moreover, we found that heme biosynthesis was a conserved key feature of the MBC state, in which augmented differentiation to PCs was observed in the presence of the iron-containing complex hemin. In summary, our findings describe unique epigenetic parameters and features of MBC programming that allow these cells to respond more quickly and vigorously to secondary immune challenges.
MATERIALS AND METHODS
Data availability
Sequencing data generated in this study have been deposited in the NCBI Gene Expression Omnibus (https://www.ncbi.nlm.nih.gov/geo/) and are available under accession GSE164173. Code used to analyze the data and generate the figures is available from http://github.com/cdschar and upon request.
Mouse influenza infection
C57BL/6J wild-type mice were obtained from The Jackson Laboratory (000664). All experiments were performed with a mix of male and female mice that were between 8–10 weeks of age. All animals were housed in specific pathogen-free cages by the Emory Division of Animal Resources and all protocols were approved by the Emory Institutional Animal Care and Use Committee (IACUC). Both male and female mice that were between 8–10 weeks of age were infected with influenza A/PR8/34 (PR8) at 15,000 virus forming units (vfu) per dose. Greater than 35 days post infection, mice were sacrificed or challenged with a 0.1 median lethal dose (LD50) of influenza A/HK-X31 (X31). For all infections, mice were anesthetized with vaporized isofluorane and 30 μl of PR8 or 100 μl of X31 were administered intranasally.
Mouse B cell isolation
Splenic cell suspensions were made by mechanically forcing spleens through a 40 μm filter and lysing red blood cells with ACK lysis buffer (0.15 M NH4Cl, 10 mM KHCO3, 0.1 mM EDTA) for 3 mins before quenching the reaction with four volumes of complete RPMI media: RPMI 1640 (Corning Cellgro, 50-020-PC), 10% heat-inactivated FBS (Sigma-Aldrich), 1% MEM non-essential amino acids (Sigma, ENBF3930-01), 100 μM sodium pyruvate (Sigma, RNBF6686), 10 mM HEPES (HyClone, SH30237), 1x Penicillin-Streptomycin-Glutamine (Gibco, 10378016), 0.0035% β-mercaptoethanol (Sigma-Aldrich). Naive B cells were isolated using negative selection for CD43 (Miltenyi, 130-090-862) following the manufacturer’s protocol. Purity was confirmed by flow cytometry. B cell antigen tetramers were described previously (16). Influenza nucleoprotein (NP)-specific memory B cells were enriched using B cell tetramer pull-downs. Cells were stained with 1:100 NP-phycoerythrin (PE) for 30 mins, washed, and incubated with anti-PE microbeads (Miltenyi, 130-105-639) before positive selection with magnetic columns. Memory B cells for ex vivo cultures were enriched using the Memory B cell Isolation Kit, Mouse (Miltenyi, 130-095-838) following manufacturer’s protocol.
Mouse ex vivo T-dependent stimulation
Naïve B cells and total enriched memory B cells were isolated as described above, resuspended at 0.5 × 10⁶ cells per ml, and stimulated with 500 ng/ml soluble CD40L (R&D Systems, 8230-CL), 10ng/ml IL-4 (R&D Systems, 404-ML), and 10 ng/ml IL-5 in complete RPMI. Cultures were fed on each subsequent day with 10 ng/ml IL-4 and 10 ng/ml IL-5 until harvest at the indicated time points. For hemin experiments, 60 μM hemin (Sigma) or vehicle (NH4OH) was added to cultures on day 1.
Human B cell isolation
Peripheral blood mononuclear cells (PBMCs) were obtained from deidentified healthy donors according to approved protocols from the Emory Institutional Review Board (IRB). For each isolation, 40 ml of blood 1:2 with PBS, followed by layering over a 50% volume of Ficoll (17-1440-02), and centrifuged at 1850 rpm for 30 mins with minimal acceleration and deceleration. The lymphocyte layer was removed, and human memory B cells enriched using the human memory B cell kit (Miltenyi, 130-093-546) following the manufacturer’s protocol.
Human MBC ex vivo stimulation
Enriched human memory B cells were cultured at 0.2 × 10⁶ cells per ml in complete RPMI supplemented with 1 mg/ml R848 (Invivogen), 1 mg/ml soluble CD40L (Fitzgerald), 10 ng/ml IL-21, 50 U/ml IL-2, 10 ng/ml BAFF (Peprotech), and 0.8 μl/ml human insulin for 6 days. On day 2 of the culture, vehicle or 60 μM hemin was added as indicated.
Flow cytometry
Staining panels for mouse included anti-Fc (anti-CD16/CD32) (Tonbo Biosciences, 2.4G2), anti-CD11b (Tonbo Biosciences, M1/70), anti-CD11c (Tonbo Biosciences, N418), anti-F4/80 (Biolegend, BM8), and Thy1/2 (Biolegend, 30-H12) conjugated to APC-Cy7 each at a concentration of 0.25 μg per 1 × 10⁶ cells to remove dendritic cells, macrophages, and T cells. The following stains and antibody-fluorophore combinations were used to assess cellular phenotype: anti-B220-PE-Cy7 or -AlexaFluor700 (Tonbo Biosciences, RA3-6B2) at 0.5 μl per 1 × 10⁶ cells; anti-CD138-APC, or -BV711 (BD, 281-2) at 0.125 μl per 1 × 10⁶ cells; anti-GL7-PerCp-Cy5.5, -PE, or -e450 (Biolegend, GL7) at 0.25 μl per 1 × 10⁶ cells; anti-CD38-Pacific Blue (Biolegend, 90); anti-IgD-BV711 (BD, 11-26c.2a); anti-IgM-FITC (Invitrogen, II/41); anti-IgG-PerCp-Cy5.5 (Biolegend, Poly4053); Zombie Yellow (BV570) (Biolegend, 77168), and CTV (Life Technologies, C34557). CTV was used at 10 μM per 1 × 10⁷ cells/ml. Human staining panels included anti-CD3-Alexa 700 (Invitrogen, UCHT1), anti-CD19-APC (Biolegend, SJC25C1), anti-CD27-BV786 (BD L128), anti-IgD-APC-Cy7 (Biolegend, IA6-2), anti-CD38-PE-Cy7 (Biolegend, HIT2), and anti-CD138-PerCp-Cy5.5 (BD, MI15) or anti-CD138-Alexa700 (Biolegend, MI15), all used at 5 μl per 1 × 10⁶ cells. Intracellular HO-1 staining for human and mouse was performed using the Invitrogen FIX & PERM Kit (GAS003) using HO-1 PE at 1:100 dilution (Abcam, ab83214) and PE IgG2b isotype (Abcam, ab91532) for gating. Staining panels included fluorescence minus one (FMO) controls to ensure that correct compensation and gating were applied. BD LSR II or BD LSR Fortessa X-20 was used for analysis and a FACSAria II was used for sorting (BD Biosciences). All flow cytometry data were analyzed with FlowJo v10.
RNA-seq
Naïve B cells were isolated from the draining lymph node of age-matched naïve mice and sorted as follows: Live CD11b–F4/80–Thy1.2–B220+CD38+GL7–IgM+. Memory B cells were isolated from 4 pooled memory mice and sorted as follows: Live CD11b–F4/80–Thy1.2–B220+CD38+GL7–NP-PE+NP-APC+IgM+ or IgG+. 500 cells were isolated via FACS into 300 μl RLT buffer (Qiagen) containing 1% βME. At the time of RNA isolation, 3 μl of a 1:400,000 dilution of ERCC synthetic mRNAs (ThermoFisher) were added and total RNA was isolated using a Quick-RNA MicroPrep Kit (Zymo Research, 11–328M) and all subsequent RNA used for cDNA synthesis using the SMART-seq v4 kit (Takara) and 10 cycles of PCR. To generate final libraries 200 pg of cDNA was used as input for the NexteraXT DNA Library kit (Illumina) using 10 additional cycles of PCR. An Agilent Bioanalyzer was used to quality control check each library. Libraries were pooled at an equimolar ratio and sequenced on a NextSeq 500 (Illumina) using 75 base pair paired-end chemistry.
RNA-seq analysis
Raw sequencing reads were mapped to the mm10 genome using STAR (17). Gene counts were determined with the Bioconductor package GenomicAlignments (18) using the mm10 transcriptome database. The Bioconductor package edgeR (19) was used to determine differentially expressed genes (false discovery rate (FDR) ≤ 0.05, absolute log2FC ≥ 1). All differentially expressed genes are listed in Supplemental Table 1. Hierarchical clustering boostrapping analysis was performed using the pvclust v2.2-0 R package with 1000 replications. GO analysis was performed with DAVID (20). Preranked Gene Set Enrichment Analysis (21) was performed on all detected transcripts ranked by multiplying the sign of fold change by the −log10 of the edgeR P value. Normalized mRNA content was calculated as previously described (22). To compare gene expression between species the ENTREZ ID for both human and mouse was used as input for the NCBI HomoloGene database (23). Only unique matches were used for downstream analysis resulting in 8,639 unique genes that were detected in both species.
ATAC-seq
Naïve and memory B cells were sorted as defined above. At least 1,000 cells for each cell type were isolated via FACS for ATAC-seq. Libraries were generated as described in detail previously (24). Briefly, cells were centrifuged at 500 × g for 10 min at 4°C. The supernatant was removed with a pipette and cells resuspended in 25 μl Tn5 Reaction Buffer (2.5 μl Tn5, 12.5 μl 2x TD buffer, 5 μl molecular grade H2O, 2.5 μl 1% Tween-20, and 2.5 μl 0.2% Digitonin) and incubated at 37°C for 1 hr. Cells were lysed by adding 2 μl 10 mg/ml Proteinase-K and 23 μl Lysis Buffer (326 mM NaCl, 109 mM EDTA, 0.63% SDS) and incubated for 30 min at 40°C. Large molecular weight DNA was removed by addition of 0.7x volumes of AMPureXP SPRI-beads (Invitrogen Agencourt, A63880) and low molecular weight DNA isolated for downstream analysis using a 1.2x volumes AMPureXP SPRI-beads and eluted in 15 μl EB buffer (Qiagen). ATAC-seq libraries were amplified using 5 μl each of the i5 and i7 Nextera Indexing primers and 25 μl of 2x HiFi HotStart ReadyMix (Roche Diagnostics, KK2601). Final libraries were purified using 1x volumes of AMPureXP SPRI-beads and sequence using 75bp paired-end reads on an Illumina NextSeq500.
ATAC-seq analysis
Raw sequencing reads were mapped to the mm10 genome using Bowtie (25). Peaks were called using MACS2 (26) and annotated to the nearest transcription start site using HOMER (27). Data were normalized to reads per peak per million (rppm) as previously described (28) and all samples demonstrated a fraction of reads in peaks (FRiP) score of 21% or greater. The coverage for all peaks was annotated using the GenomicRanges (18) package and edgeR (19) waw used to determine differential accessibility between samples (FDR ≤ 0.05, absolute log2FC ≥ 1). All DAR are listed in Supplemental Table 2. Motif analysis was performed with the HOMER program findMotifsGenome.pl using randomly generated genomic sequences as background. PageRank analysis (29) was performed using the default parameters and transcription factors with a PageRank score >0.001 in at least one sample group of the indicated comparison were included for all downstream analysis.
Quantitative RT-PCR
Cells were lysed in 300 μl RLT buffer (Qiagen) containing 1% βME and total RNA was isolated using the Quick-RNA MicroPrep Kit (Zymo Research, 11–328M). All subsequent RNA was used for reverse transcription using random hexamer and oligo dT primers with SuperScriptII (ThermoFisher, 18064022). cDNA was diluted 1:5 and gene expression quantitated by real-time PCR using SYBR Green incorporation on a Bio-Rad iCycler. Gene expression was quantitated as a percentage of 18S rRNA. All primer sets are listed in Supplemental Table 3.
ELISPOTS
For ELISPOT assays, multiscreen HA plates (Millipore, MAHAS4510) were coated with purified NP at 1 μg/ml in PBS overnight at 4°C. Plates were washed four times with PBS and blocked with complete RPMI. Single-cell suspensions were washed, diluted in complete RPMI, and cultured on coated plates overnight in a 37°C incubator with 5% CO2. Cells were aspirated, and plates were washed with 0.2% Tween-20 in PBS. Bound IgG was detected using alkaline phosphatase–conjugated goat anti–mouse kappa (Southern Biotech, diluted 1:1000) in 0.5% BSA, 0.05% Tween-20 in PBS for 1 hr at 37°C. Plates were washed with 0.2% Tween-20 in PBS and developed with BCIP/NBT (Moss Substrates) substrate for 1 hr. ImmunoSpot S6 ULTIMATE Analyzer (Cellular Technology Limited; CTL) and quantified using ImmunoSpot software v5.0.9.21 using the Basic Count feature with the following parameters: Sensitivity: 165; Background balance: 162; Diffuse Processing: Largest; Spot size range: 0.0201 mm2 – 9.626 mm2; Spot Separation: 1.
Metabolism assays
A FluxPack cartridge was hydrated for 12 hours prior to each assay with 200 μl dH2O at 37°C in a non-CO2 incubator. Approximately 1 hr prior to each assay, dH2O was replaced with pre-warmed Seahorse calibrant solution (Agilent, 103059-000). Cell cultures were washed in Seahorse XF Assay media supplemented with 1 mM sodium pyruvate, 2 mM L-glutamine, and 5.5 mM glucose. Cells concentrations were determined by flow cytometry using AccuCheck counting beads (Invitrogen, PCB100). CellTak (Corning, 354420) was diluted in sterile 1xPBS to a final concentration of 22.4 μg/ml and 25 μl added to each well of a Seahorse XFe96 cell culture plate and incubated for 20 min at room temperature. Following the incubation, CellTak was washed out with 200 μl dH2O and 250,000 cells were plated per well. The resulting plate was incubated at 37°C in a non-CO2 incubator for 45 min. Each drug was diluted in Seahorse media and loaded onto the following ports: Port A, 2 μM Oligomycin (Sigma, 75351); Port B, 2.5 μM FCCP (Sigma, C2920); Port C, 1 μM Rotenone (Sigma, R8875) and 1 μM Antimycin A (Sigma, A8674). Following the incubation, the Mitochondrial Stress Test was performed on a Seahorse Bioanalyzer XFe96 instrument.
Statistical analysis
The statistical tests and exact group sizes are indicated in each figure legend. Statistical tests were performed in Prism v8.4.1, Excel v16.35, or R v3.5.3. Analysis of differentially expressed genes or accessible regions was performed using edgeR (19) and the Bonferroni FDR correction in R. Differentially expressed genes and differentially accessible regions were determined based on both a false discovery rate (FDR) ≤ 0.05 and absolute log2FC ≥ 1. GSEA P-values are determined by permutation testing. Significance between time course qRT-PCR data was determined by two-way ANOVA with Tukey’s post-hoc correction.
RESULTS
Memory mice respond with increased magnitude and rapid B cell differentiation kinetics to a secondary influenza challenge
The murine model of influenza infection using heterosubtypic A/PR8/34 (PR8) and A/HK-X31 (X31) viral strains allows for the tracking of memory B cell responses to the shared nucleoprotein (NP) segment of influenza (16, 30, 31). To characterize the differentiation capacity between MBCs and nBs, C57BL/6J mice were infected with a primary dose of PR8 and allowed to rest for 35 days to generate antigen-experienced memory mice. Memory and naïve C57BL/6J mice were then challenged with X31 and the early differentiation kinetics (days 4–7) were monitored by flow cytometry. Memory mice showed enhanced generation of GL7+FAS+ GC B cells by both frequency and cell number in the spleen and mediastinal draining lymph node (dLN) at all time points assayed (Fig. 1A, Supplemental Fig. 1). PC differentiation was low in both naïve and memory mice at day 4, but significantly increased in memory mice compared to naïve at days 5 and 6 post X31 challenge. Naïve mice showed similar frequencies and numbers of CD138+ PCs at later time points in the spleen and dLN.
Figure 1. Memory mice show increased kinetics of differentiation and generate more antigen-specific, isotype switched plasma cells.
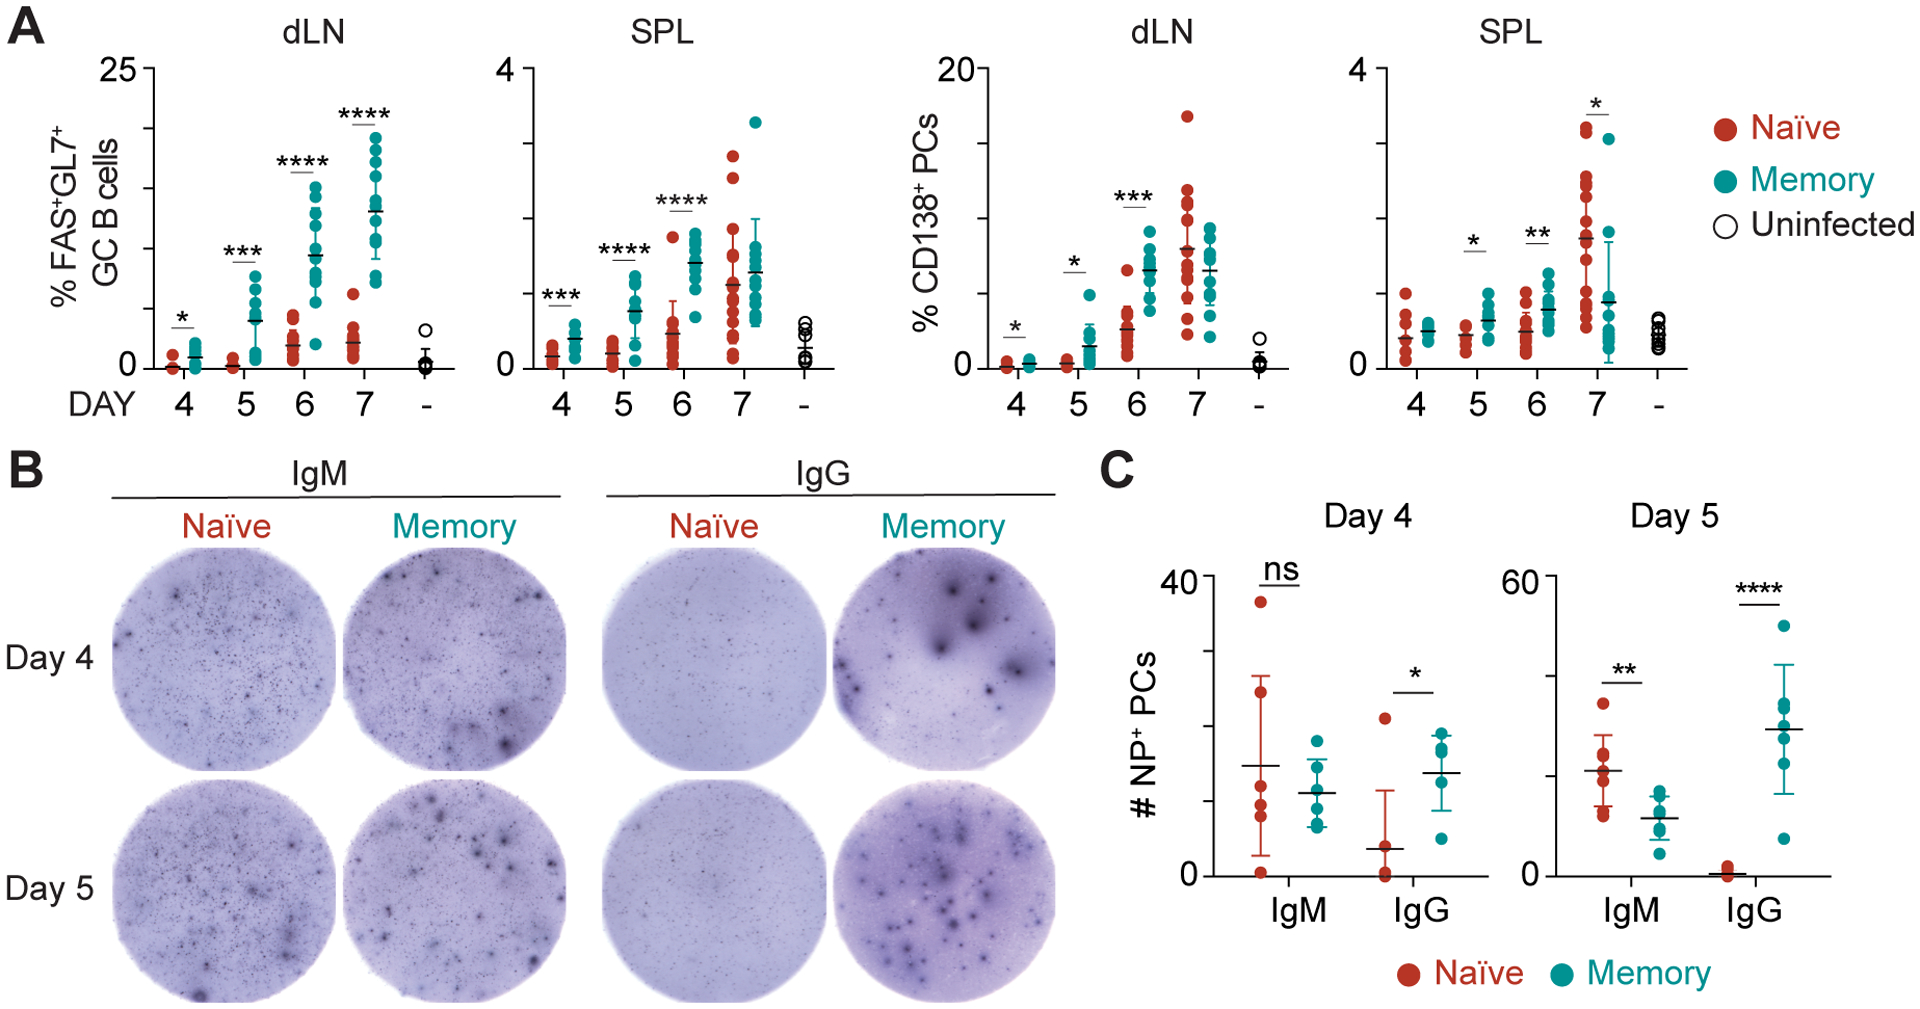
(A) Frequency of FAS+GL7+ germinal center (GC) B cells or CD138+ plasma cells (PC) from naïve or memory mice challenged with 0.1 LD50 influenza X31 at the indicated time point. Data were collected from the mediastinal draining lymph node (dLN) or spleens (SPL) and are representative of 2 independent experiments with 4–5 mice per group. (B) ELISPOT analysis of nucleoprotein (NP)-specific IgM (right) or IgG (left) antibody secreting cells at days 4 or 5 post X31 challenge. Spleens and dLN were pooled, and 500,000 total cells were plated per well. (C) Quantitation of IgM and IgG NP-specific ELISPOTS per 500,000 cells. Significance determined using two-tailed Student’s t-test. See also Supplemental Fig. 1.
To further elucidate differences in influenza-specific PC differentiation, naïve and memory mice were infected with X31 and NP-specific ELISPOTs were performed at days 4 and 5 post infection. NP-specific IgM spots were similar between naïve and memory mice at day 4 post challenge (Fig. 1B, 1C). However, there were significantly more NP-specific IgG spots from pooled spleens and dLNs isolated from PR8-primed memory mice than from naïve mice. Thus, as expected from the reports using model antigens and malaria infection (6, 8, 10, 32), the system employed here allows the elucidation of MBCs that form following a viral infection.
Isotype and influenza-specific MBCs have distinct gene expression profiles
To investigate the molecular properties that underlie enhanced MBC differentiation compared to nBs; at day 35 post PR8 infection, influenza-specific MBCs were isolated using NP B cell tetramers (16). MBCs were subsetted into those that expressed either an IgM or IgG BCR (Supplemental Fig. 2). In addition, follicular IgM+ nBs from the dLN were isolated from naïve mice and the transcriptome of each population determined by RNA-seq. Principal component analysis (PCA) of all 10,324 detected genes from the RNA-seq data showed that each of the three subsets segregated into discrete clusters (Fig. 2A). Principal component 1 (PC1) separated the two MBC populations from the nBs and PC2 distinguished IgM MBCs from the other two subsets. Hierarchical clustering followed by bootstrapping analysis of the differentially expressed genes (DEG; absolute log2FC > 1 and FDR < 0.05) revealed that IgM MBCs were a transcriptionally distinct MBC population with both unique and shared gene expression patterns compared with both nBs and IgG MBCs (Fig. 2B, Supplemental Table 1). Analysis of the DEG overlap between MBCs and nBs showed 191 signature genes that were similarly expressed in both IgM and IgG MBCs (Fig. 2C). Synthetic spike-in mRNAs were used to normalize and quantitate the global mRNA content (22) and revealed a significant increase in IgM and IgG MBCs as compared to nBs (Fig. 2D).
Figure 2. Memory B cells have distinct transcriptional signatures.
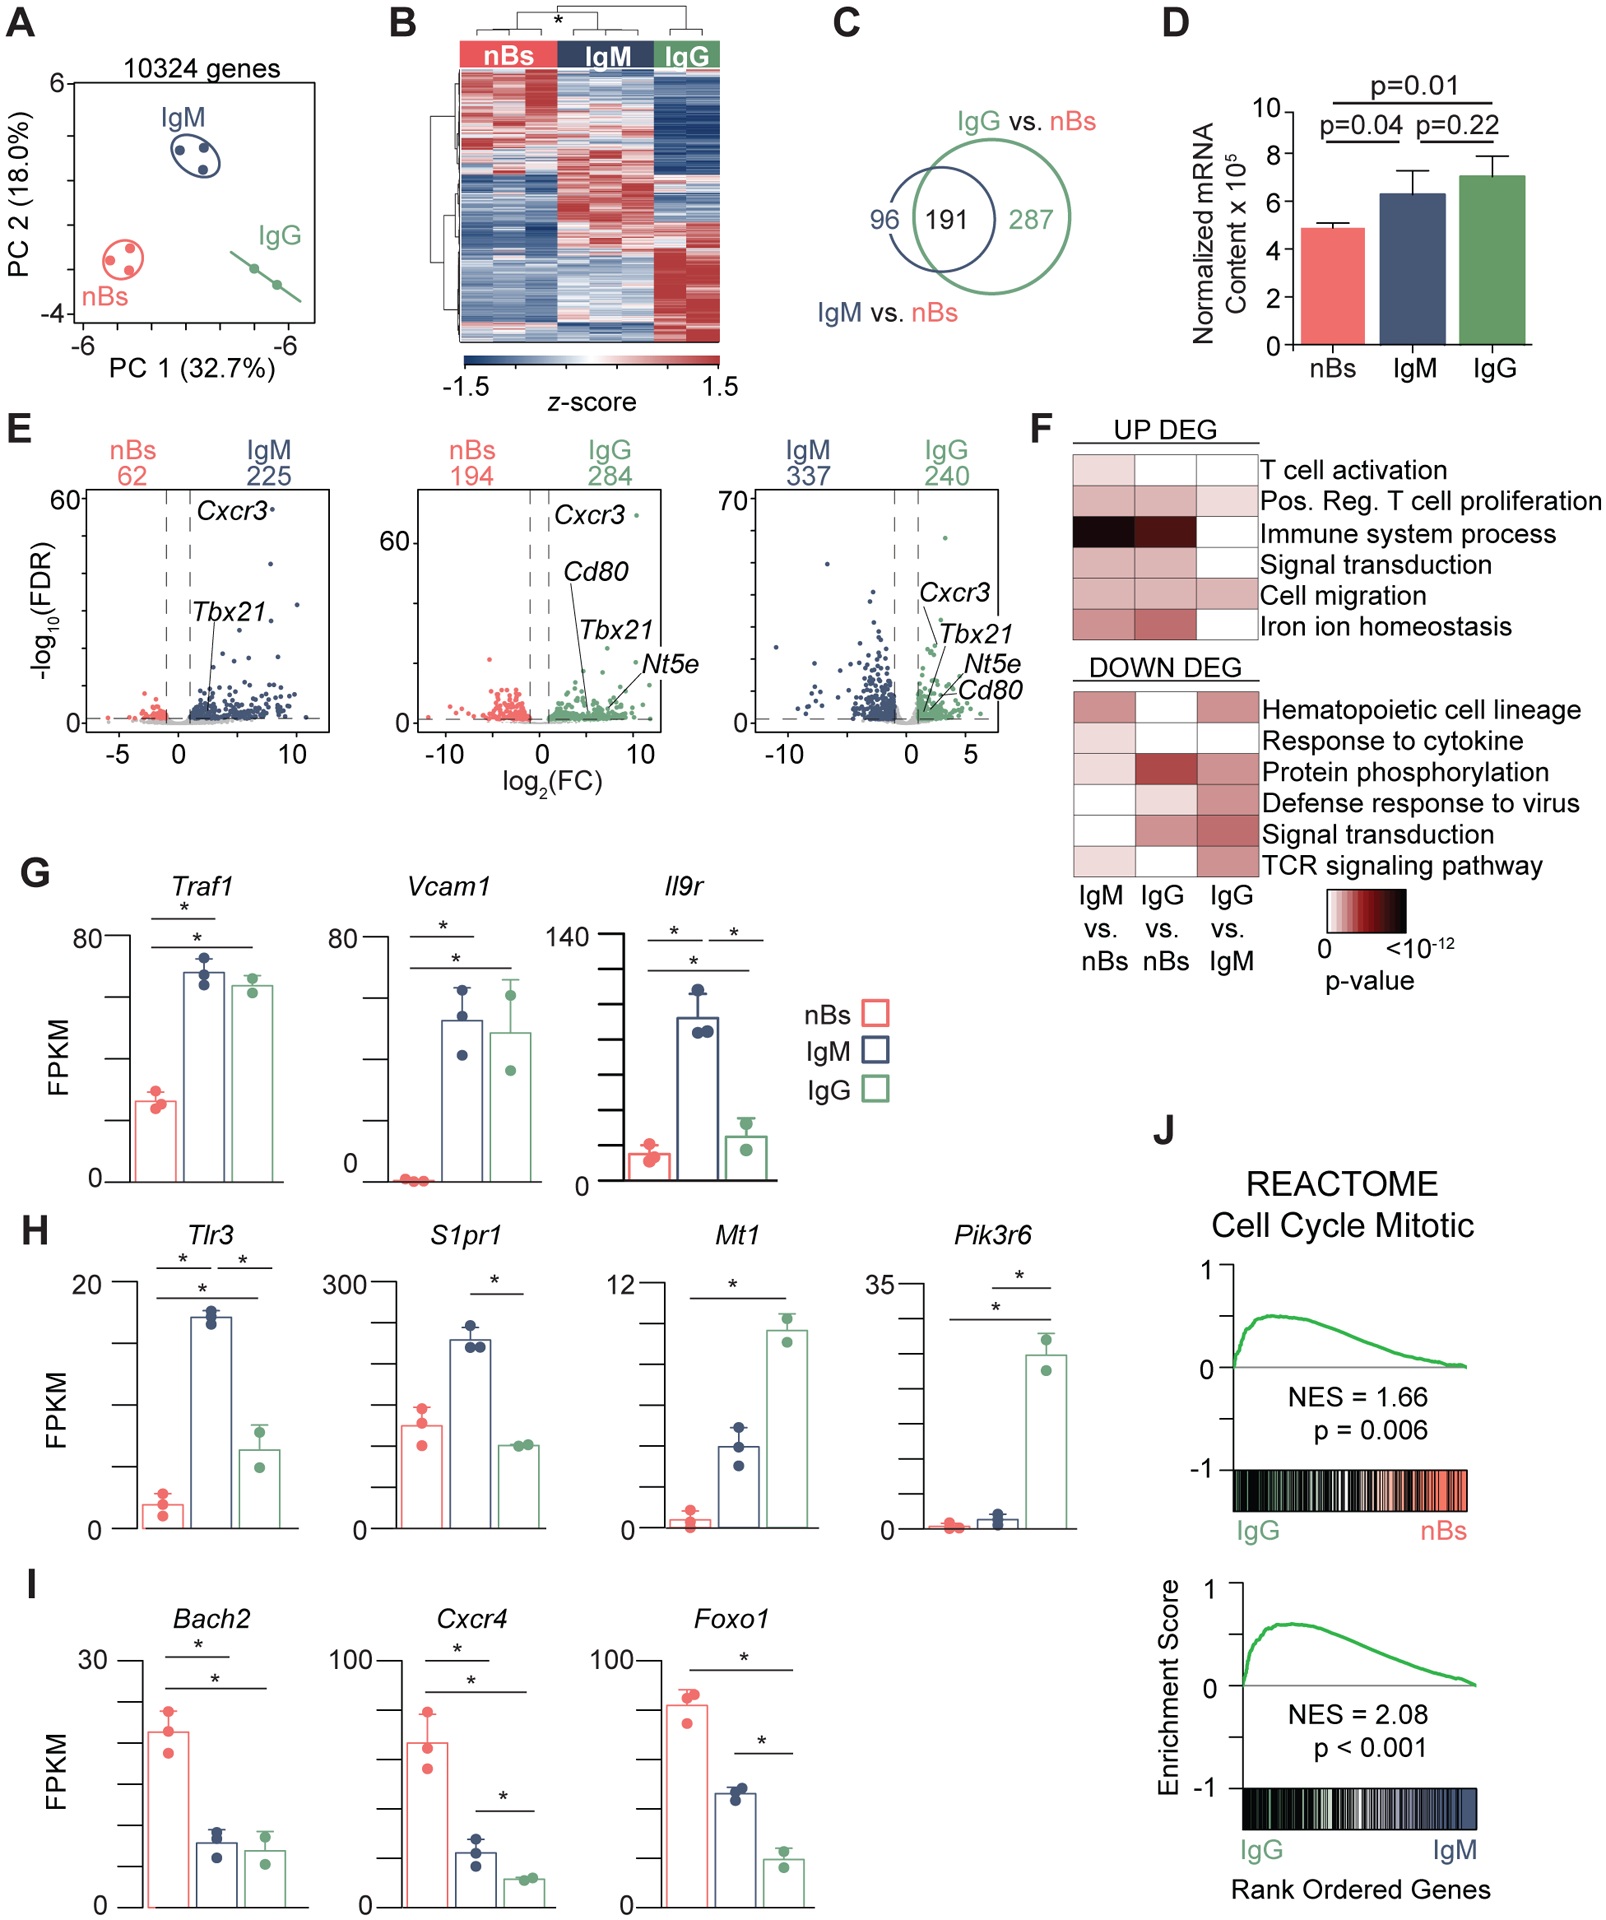
(A) Principal component analysis (PCA) of 10,324 detected genes in follicular IgM+ nB (n = 3) from naïve mice and influenza NP-specific IgM (n = 3) and IgG (n = 2) MBC 35 days post-PR8 infection. See also Supplemental Fig. 2. (B) Heatmap analysis of 901 differentially expressed genes (DEGs). * indicates 100% reproducibility based on bootstrapping analysis. (C) Venn diagram showing the overlap of 287 IgM vs. nB DEG (blue circle) with 478 IgG vs. nB DEG (green circle). (D) Normalized mRNA content calculated as the sum of all transcripts in a given subset. (E) Volcano plots for each comparison with relevant genes upregulated in the MBC subsets indicated. (F) Gene ontology (GO) analysis of DEGs in every comparison. Bar plots for key genes highly expressed in: both MBC populations compared to nB (G); IgM or IgG MBC (H); or downregulated in both MBC populations (I). (J) Gene set enrichment analysis (GSEA) of the REACTOME Cell Cycle Mitotic gene set in each comparison. NES, Normalized Enrichment Score. * in G - I indicates significant differential expression (FDR < 0.05, absolute log2FC > 1). See also Supplemental Fig. 3.
To further explore the specific differences between subsets, the relationship between fold change (FC) and significance (FDR) was plotted and gene ontology (GO) (33) analysis was performed on the DEG sets from each comparison group. Both IgM and IgG MBCs showed upregulation of GO terms describing activation, proliferation, and immune system processes, highlighted by Tbx21 and Cd80 (Fig. 2E, 2F). Tbx21, which encodes the transcription factor T-bet, promotes the expression of the chemokine receptor Cxcr3 (34), which was also upregulated in both MBC subsets, and is required for secondary PC responses to influenza (35). Additional genes that have similar expression patterns in both IgM and IgG MBCs included Traf1, Vcam1, and Il9r (Fig. 2G). Traf1 is a member of the tumor necrosis factor (TNF) receptor family and heterodimerizes with TRAF2 to mediate TNFα-induced NF-κB (36). Similar to Traf1, the adhesion molecule Vcam1 is upregulated in response to NF-κB signaling (37). IL-9R was previously shown to be critical for MBC differentiation from the GC (38). Intriguingly, Il9r expression was found to be >3-fold higher in IgM compared to IgG MBCs in our data.
DEGs uniquely enriched in MBC subsets included Tlr3 and S1pr1 in IgM and Nte5, Mt1, and Pik3r6 in IgG MBCs (Fig. 2H). Toll-Like Receptor-3, encoded by Tlr3, senses intracellular dsRNA and is upregulated in murine B cells upon BCR stimulation (39). S1PR1 is important for egress of lymphocytes from the lymph nodes (40), as well as release of developing B cells from the bone marrow (41). Consistent with its expression on class-switched MBCs (32), Nt5e, which encodes CD73, was found to be more highly expressed by IgG MBCs as compared to both nBs and IgM MBCs. Mt1 plays a role in iron ion homeostasis (42), and Pik3r6 regulates phosphoinositide 3-kinase signaling, which is activated downstream of BCR triggering (43). The unique expression of Pik3r6 in IgG MBCs suggests a differential role for this protein downstream of IgM and IgG BCRs (2, 3). Further functional exploration of the DEG using gene set enrichment analysis (GSEA) (44) identified that cell cycle genes were upregulated in IgG MBCs compared to both IgM MBCs and nBs, underscoring their rapid responses to stimulation (Fig. 2J). Examples include Ube2c, a ubiquitin conjugating enzyme important for degrading target proteins during cell cycle progression (45) and cell cycle genes Cdc20 and Mcm10 (Supplemental Fig. 3A).
Genes downregulated in both MBC subsets compared to nBs functioned in protein phosphorylation and cellular response to cytokine stimulus (Fig. 2F) and included Bach2, Cxcr4, and Foxo1 (Fig. 2I). Reduced expression of Bach2 in MBCs confirms previous observations using model antigens (10). Cxcr4 is a homing receptor for migration to the bone marrow and between the dark and light zones of the GC. Foxo1 is critically important for B cell development and maintenance (46). Together, these data indicate that MBCs harbor a gene expression program that is distinct from nBs and sustained following antigen clearance.
MBCs are epigenetically primed to differentiate to plasma cells
The assay for transposase-accessible chromatin sequencing (ATAC-seq) (47) was performed to interrogate the epigenetic landscape of MBCs and nBs on the same three populations of cells as above. PCA of the 42,231 accessible regions identified revealed that PC1 separated MBCs from nBs and PC2 separated IgM-expressing populations from IgG (Fig. 3A). A heatmap of all significant differentially accessible regions (DAR; absolute log2FC > 1 and FDR < 0.05) demonstrated a large number of regions in MBC with gains in accessibility compared to nBs (Fig. 3B, Supplemental Table 2). Annotation of the chromatin accessibility for 2 kb surrounding all DAR revealed that IgM and IgG MBCs both had overall increased accessibility compared to nBs, with IgG MBCs also displaying a small but significant increase in accessibility over IgM MBCs (Fig. 3C). Zbtb32, which has been implicated in MBC reactivation (15), showed increased accessibility and a corresponding increase in expression that peaked in IgG MBCs (Supplemental Fig. 3B). Additionally, consistent with gene expression changes, DAR were observed surrounding the genes Tbx21, Nt5e (CD73), and Cxcr3.
Figure 3. Memory B cells are epigenetically primed to differentiate to plasma cells.
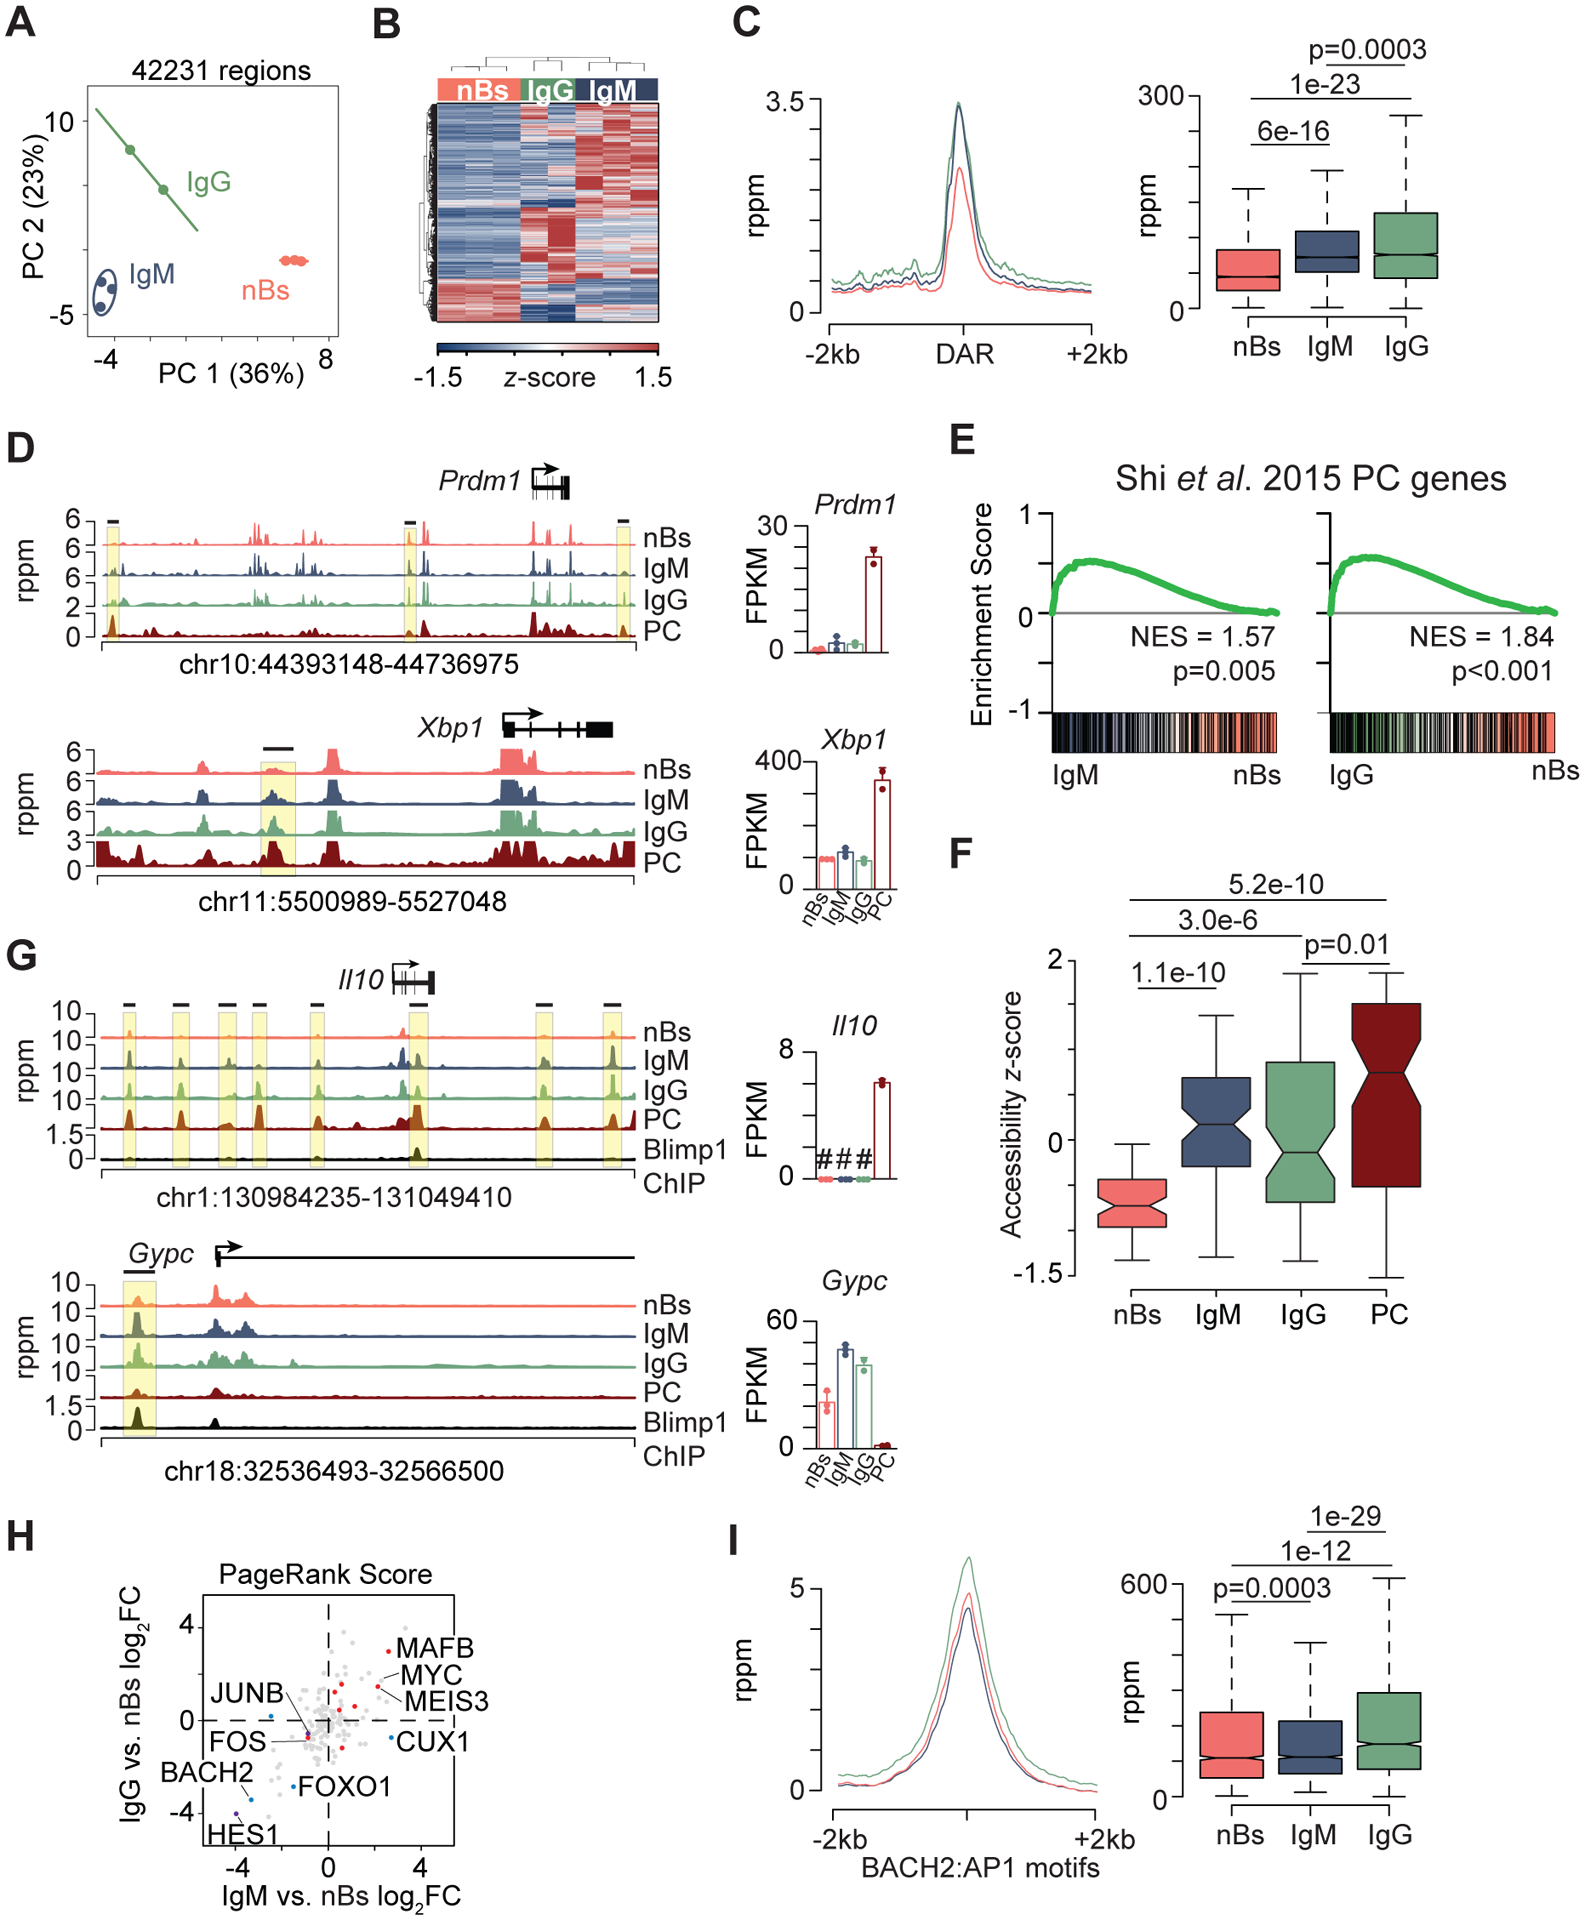
(A) PCA analysis of 42,231 accessible regions for nB (n = 3) and IgM (n = 3) and IgG (n = 2) MBC defined in Fig. 2 and Supplemental Fig. 2. (B) Heatmap showing 6,948 DAR. (C) Histogram of all DAR identified in nB, IgM, and IgG MBCs (left) and boxplot quantitating chromatin accessibility (right). (D) Genome plots of accessible chromatin (left) and gene expression (right) for select genes. DAR are indicated by a black horizontal bar and yellow box and the upper scale limit was set to show the changes at DAR in MBCs. PC RNA-seq (22) and ATAC-seq (49) datasets were described previously. (E) GSEA plots analyzing the Shi et al. 2015 PC signature gene set (48) showing enrichment for IgM (right) or IgG (left) MBCs compared to nBs. (F) Boxplot of z-score normalized accessibility for all DAR that map to the Shi et al. 2015 PC genes from E. (G) Genome plots for indicated gene locus showing accessibility (left) and gene expression (right). BLIMP-1 ChIP-seq data was described previously (50). # denotes genes not detected by RNA-seq for the indicated cell type. DAR are indicated by a black horizontal bar and yellow box and the upper scale limit was set to show the changes at DAR in MBCs. (H) Scatterplot of the PageRank fold change for the IgM vs. nB compared to IgG vs. nB. DEG up in nB are indicated in blue, DEG up in IgG only are indicated in purple, and DEG up in both IgM and IgG are indicated in red. (I) Histogram (left) and boxplot (right) of accessibility at all BACH2:AP1 binding motifs identified in nB, IgM, and IgG MBCs. Significance for C, F, I determined by two-tailed Student’s t-test. See also Supplemental Fig. 3.
The rapid formation of PCs in memory mice suggested the hypothesis that MBCs might harbor a distinct programming related to PC differentiation. In support of this, DAR were observed that mapped to key PC transcription factors: Xbp1, Prdm1, and Irf4 (Fig. 3D, Supplemental Fig. 3C). To examine other genes, a transcription signature derived from genes expressed in PC (48) was used in a GSEA. This analysis revealed that PC genes were significantly enriched in both IgM and IgG MBC populations compared to nB (Fig. 3E). The change in chromatin accessibility at DAR mapping to PC signature genes was compared between nBs, MBCs, and previously generated PC data (49). nBs displayed the lowest accessibility with both IgM and IgG MBC subsets exhibiting intermediate levels compared to PC (Fig. 3F), indicating that the MBCs may be primed for expression of PC genes. Examples include the plasma cell expressed genes Prdm1 and Xbp1, which displayed regions with higher accessibility in MBCs and little to no accessibility in nBs. While annotated as DEG in our dataset, the overall MBC expression for these genes was low compared to PCs, suggesting chromatin accessibility changes precedes expression changes.
To further examine how the observed accessibility patterns corresponded to PC programming events, BLIMP-1 ChIP-seq data (50) was analyzed along with accessibility data in nBs and MBCs. Both repressed and activated BLIMP-1 target genes displayed a pattern of increased accessibility at the same genomic location that contained a BLIMP-1 binding site and where PC also have open chromatin (Fig. 3G, Supplemental Fig. 3B). The BLIMP-1 repressed genes Gypc and Aicda displayed a binding site and open chromatin at a regulatory site proximal to the promoter. Il10 and Tigit each contained loci that were increased in accessibility in MBC that matched the PC profile. Both of these genes are induced by BLIMP-1 in PC, and despite the MBC accessibility profile, expression was not detected in either nBs or MBCs.
To assess the kinetics of gene expression during reactivation MBCs were enriched along with nB and stimulated to differentiate into PC ex vivo using CD40L, IL4, and IL5. At early time points post stimulation, RNA was extracted and the expression of a set of genes displaying MBC-specific accessible chromatin was assessed by qRT-PCR. Consistent with a role for epigenetic priming, Zbtb32, Aicda, Il10, and Xbp1 were significantly induced more rapidly and to higher levels in stimulated MBCs compared to nB (Supplemental Fig. 3D). Importantly, the control gene Gapdh was equally induced in both conditions. Thus, these data indicate that MBCs harbor accessibility changes that resemble the PC chromatin architecture and may prime gene expression programs for rapid induction.
To determine additional transcription factor networks that were differentially regulated in MBCs compared to nBs, the PageRank (29) algorithm, which integrates RNA-seq and ATAC-seq data to define transcription factor importance based on changes in target gene expression, was used. For each transcription factor, the fold change in PageRank score between IgG and nB was correlated with the change between IgM and nB to define common changes. Both MYC and MAFB had a high PageRank score in both MBC subsets (Fig. 3H). Interestingly, Myc was not identified as a DEG in either comparison, despite its target genes and network being activated in MBCs. Consistent with their transcriptional down regulation, BACH2 and FOXO1 were less important in MBC transcriptional networks. In memory CD8 T cells, BACH2 has been shown to repress the activity of AP-1 factors through binding to a similar consensus motif (51). This suggested that lower expression of BACH2 may allow for increased AP-1 activity and therefore accessibility at these motifs. When accessibility was annotated for all instances of the BACH2:AP-1 composite motif in DAR, IgG MBCs displayed significantly increased accessibility compared to both IgM MBCs and nBs (Fig. 3I), suggesting there may be a similar mechanism at play in MBCs as in memory CD8 T cells.
Plasma cell differentiation is enhanced by heme
Intriguingly, both GSEA and GO analysis revealed an enrichment of the gene sets related to iron and heme metabolism as being enriched in MBCs compared to nBs (Fig. 2F, Fig. 4A). Examples of iron pathway genes include Slc40a1, Trf, and Hmox1, which were all significantly upregulated and expressed in both MBC subsets with near background expression in nBs (Fig. 4B). Additionally, Hmox1 displayed promoter chromatin accessibility increases that correlated with its unique expression in MBCs (Fig. 4C). HO-1, encoded by Hmox1, is a heme-response gene that facilitates its recycling to biliverdin, ferrous iron, and CO (52) and can be used as a readout for intracellular heme levels (53). In agreement with the interpretation that the heme uptake pathway is upregulated in MBCs, paramagnetic bead enriched class switched MBCs displayed significantly higher levels of HO-1 than nBs (Fig. 4D), indicating that MBCs retain higher levels of intracellular heme.
Figure 4. Hemin increases plasma cell formation of murine memory B cells.
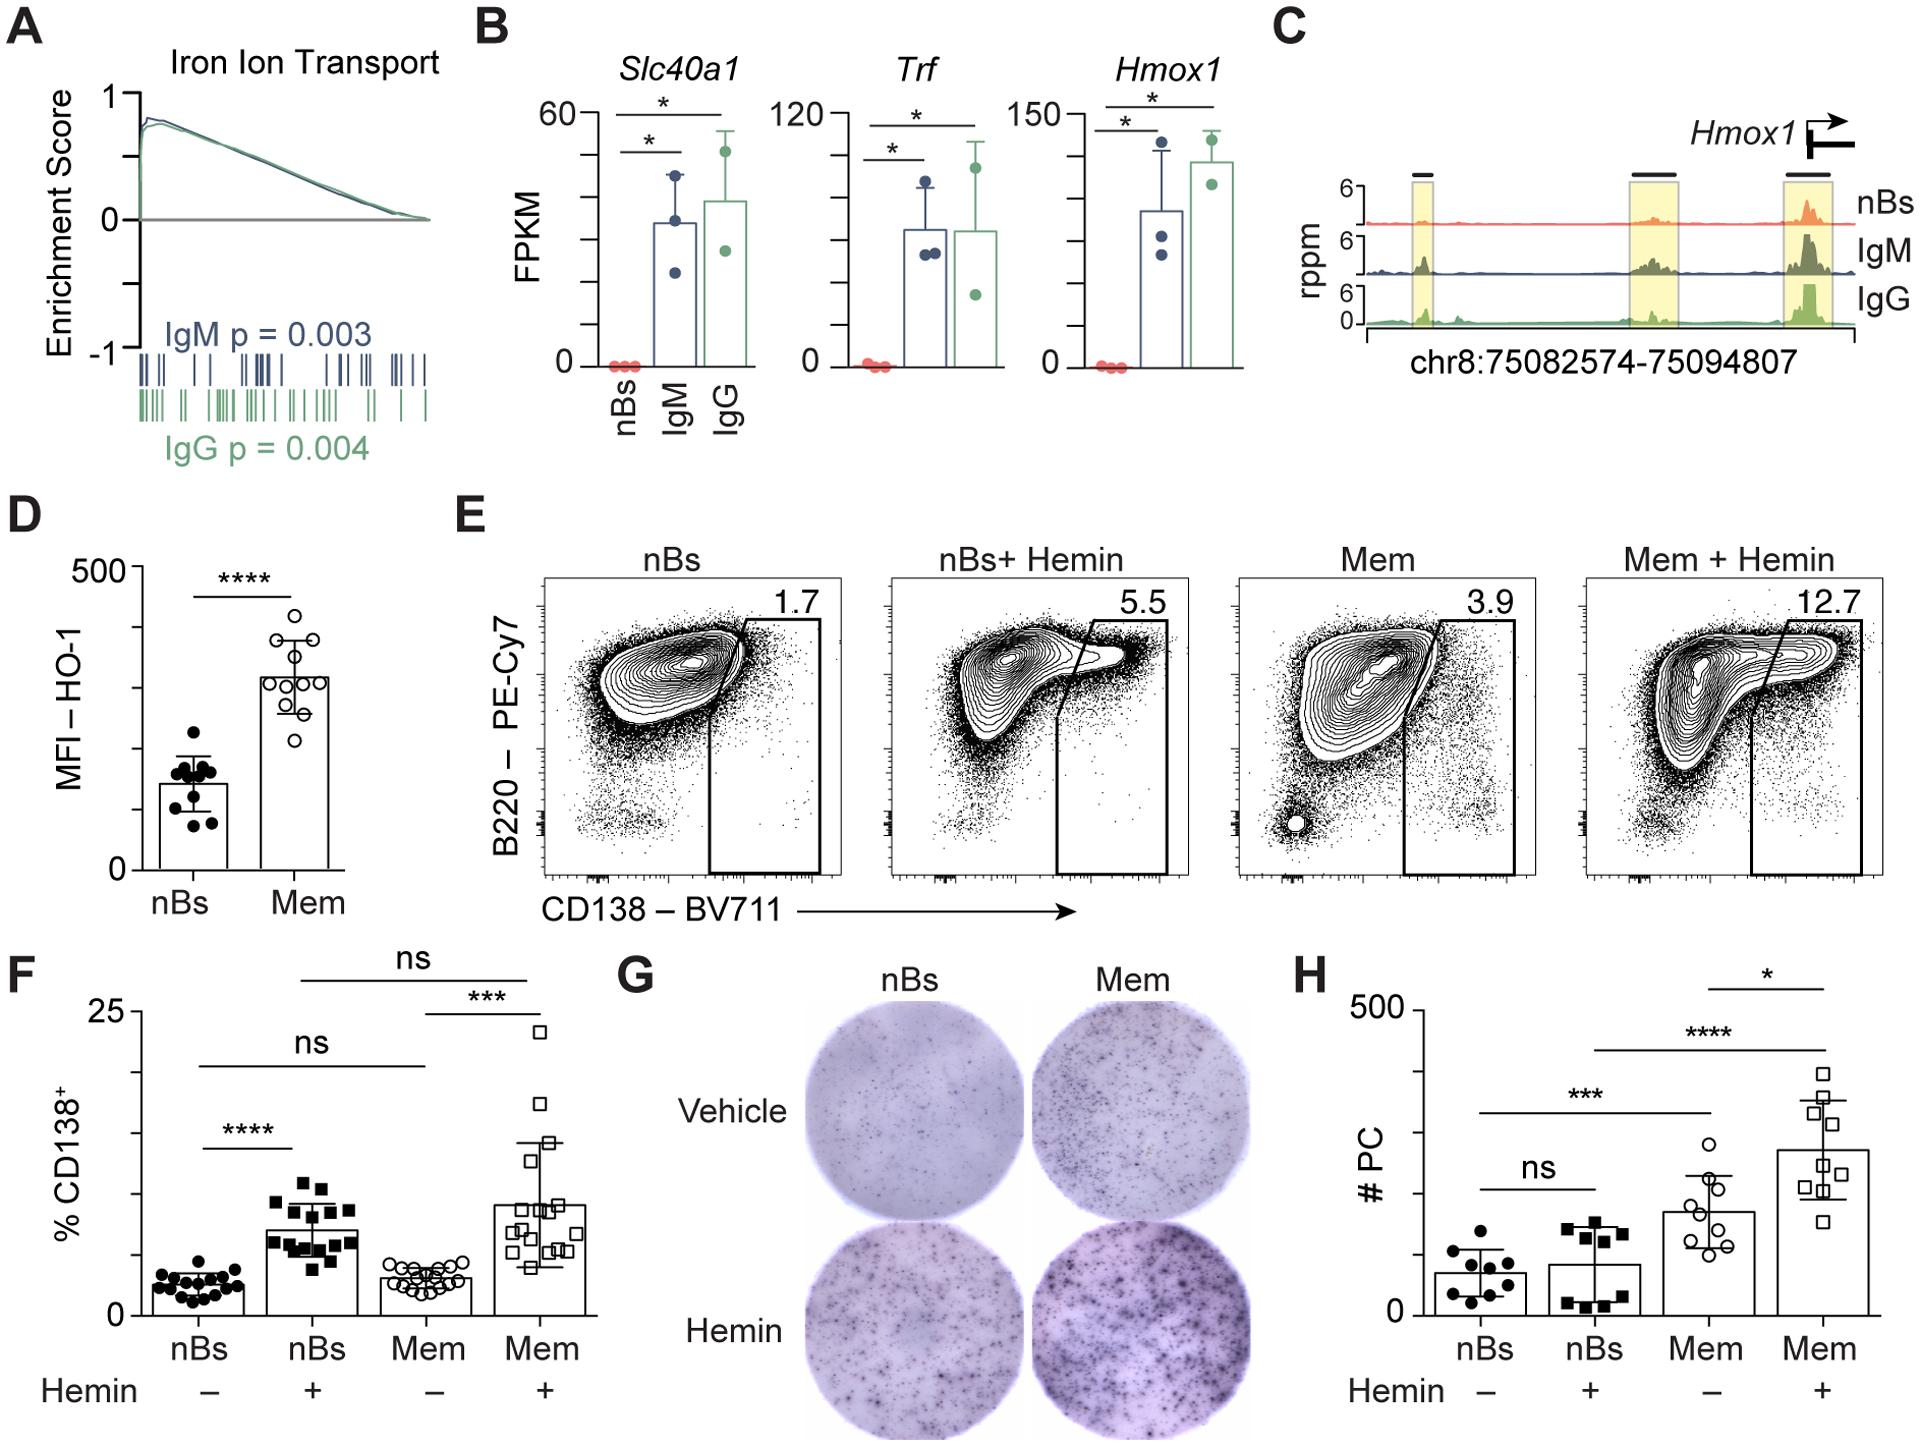
(A) GSEA showing the enrichment of the Iron Ion Transport gene set for IgM (blue) and IgG (green) MBCs compared to nBs. (B) Bar plot showing expression of select genes from the Iron Ion Transport gene set in A. * indicates significant differential expression (FDR < 0.05, absolute log2FC > 1). (C) Genome plot of the Hmox1 locus showing the location of DAR compared to nB. (D) Flow cytometry (MFI) quantitation of heme oxygenase-1 (HO-1) in nBs isolated from naïve mice and isotype-switched memory B cells (Mem) that were enriched from PR8-primed mice. (E) nBs and Mem were stimulated with CD40L, IL-4, and IL-5 for three days with vehicle or hemin added to the cultures at day 1 as indicated. The formation of CD138+ PC was analyzed at day 3 by flow cytometry. (F) Quantitation of CD138+ PC from E. Data are from 3 independent experiments with n = 11. (G) Representative ELISPOT wells showing antibody spots per 6250 cells plated from day 3 cultures as in E. (H) Quantification of ELISPOT data from G. Data are from 3 independent experiments with 3–4 samples per group. Significance for D, F, H determined by two-tailed Student’s t-test.
To determine if heme modulated PC differentiation, MBCs and nBs were isolated for ex vivo culture and stimulated using CD40L, IL-4, and IL-5 to model T-dependent differentiation conditions. Cultured MBCs differentiated into CD138+ PCs to a higher degree than nBs over three days (Fig. 4E, 4F). To determine the role of heme in PC differentiation, nBs and enriched MBCs were stimulated in the presence of hemin as above. A 3-fold greater induction of CD138+ PCs than matched vehicle treated controls was observed for both nBs and MBCs (Fig. 4E, 4F). Additionally, each culture was subjected to ELISPOT analysis to ensure that hemin treatment produced functional PCs. The addition of hemin significantly enhanced PC formation in MBCs (Fig. 4G, 4H). These data indicate that hemin can augment B cell differentiation and enhance the formation of PCs ex vivo.
Epigenetic signatures of MBCs are conserved between mice and humans
To determine if the epigenetic and transcriptional changes observed in mice were also observed in humans, RNA-seq and ATAC-seq data from resting naïve B cells (rN) and class-switched MBCs (SM) from healthy subjects (54) were compare to the data generated here. Of the 10,324 genes expressed in mouse nBs and MBCs, 84% were also detected in the human SM and rN RNA-seq data (Fig. 5A, pie chart insets). Reciprocally, 76% of the genes expressed in the human cell types had direct homologues that were detected in the mouse. To determine the concordance of the transcriptional changes, the fold-change of mouse IgG MBCs vs. nBs was plotted against human SM vs. rN B cells. 85 genes were called DEG in both comparisons with 53 having a positive fold change (Fig. 5A, red) and 32 having a negative fold change in both species (Fig. 5A, blue). Notably, HMOX1 was among the conserved upregulated genes along with ZBTB32, CXCR3, and SLC11A1. BACH2, CXCR4, and IL21R highlighted the downregulated conserved genes.
Figure 5. Memory B cell epigenetic signatures are conserved between mouse and human.
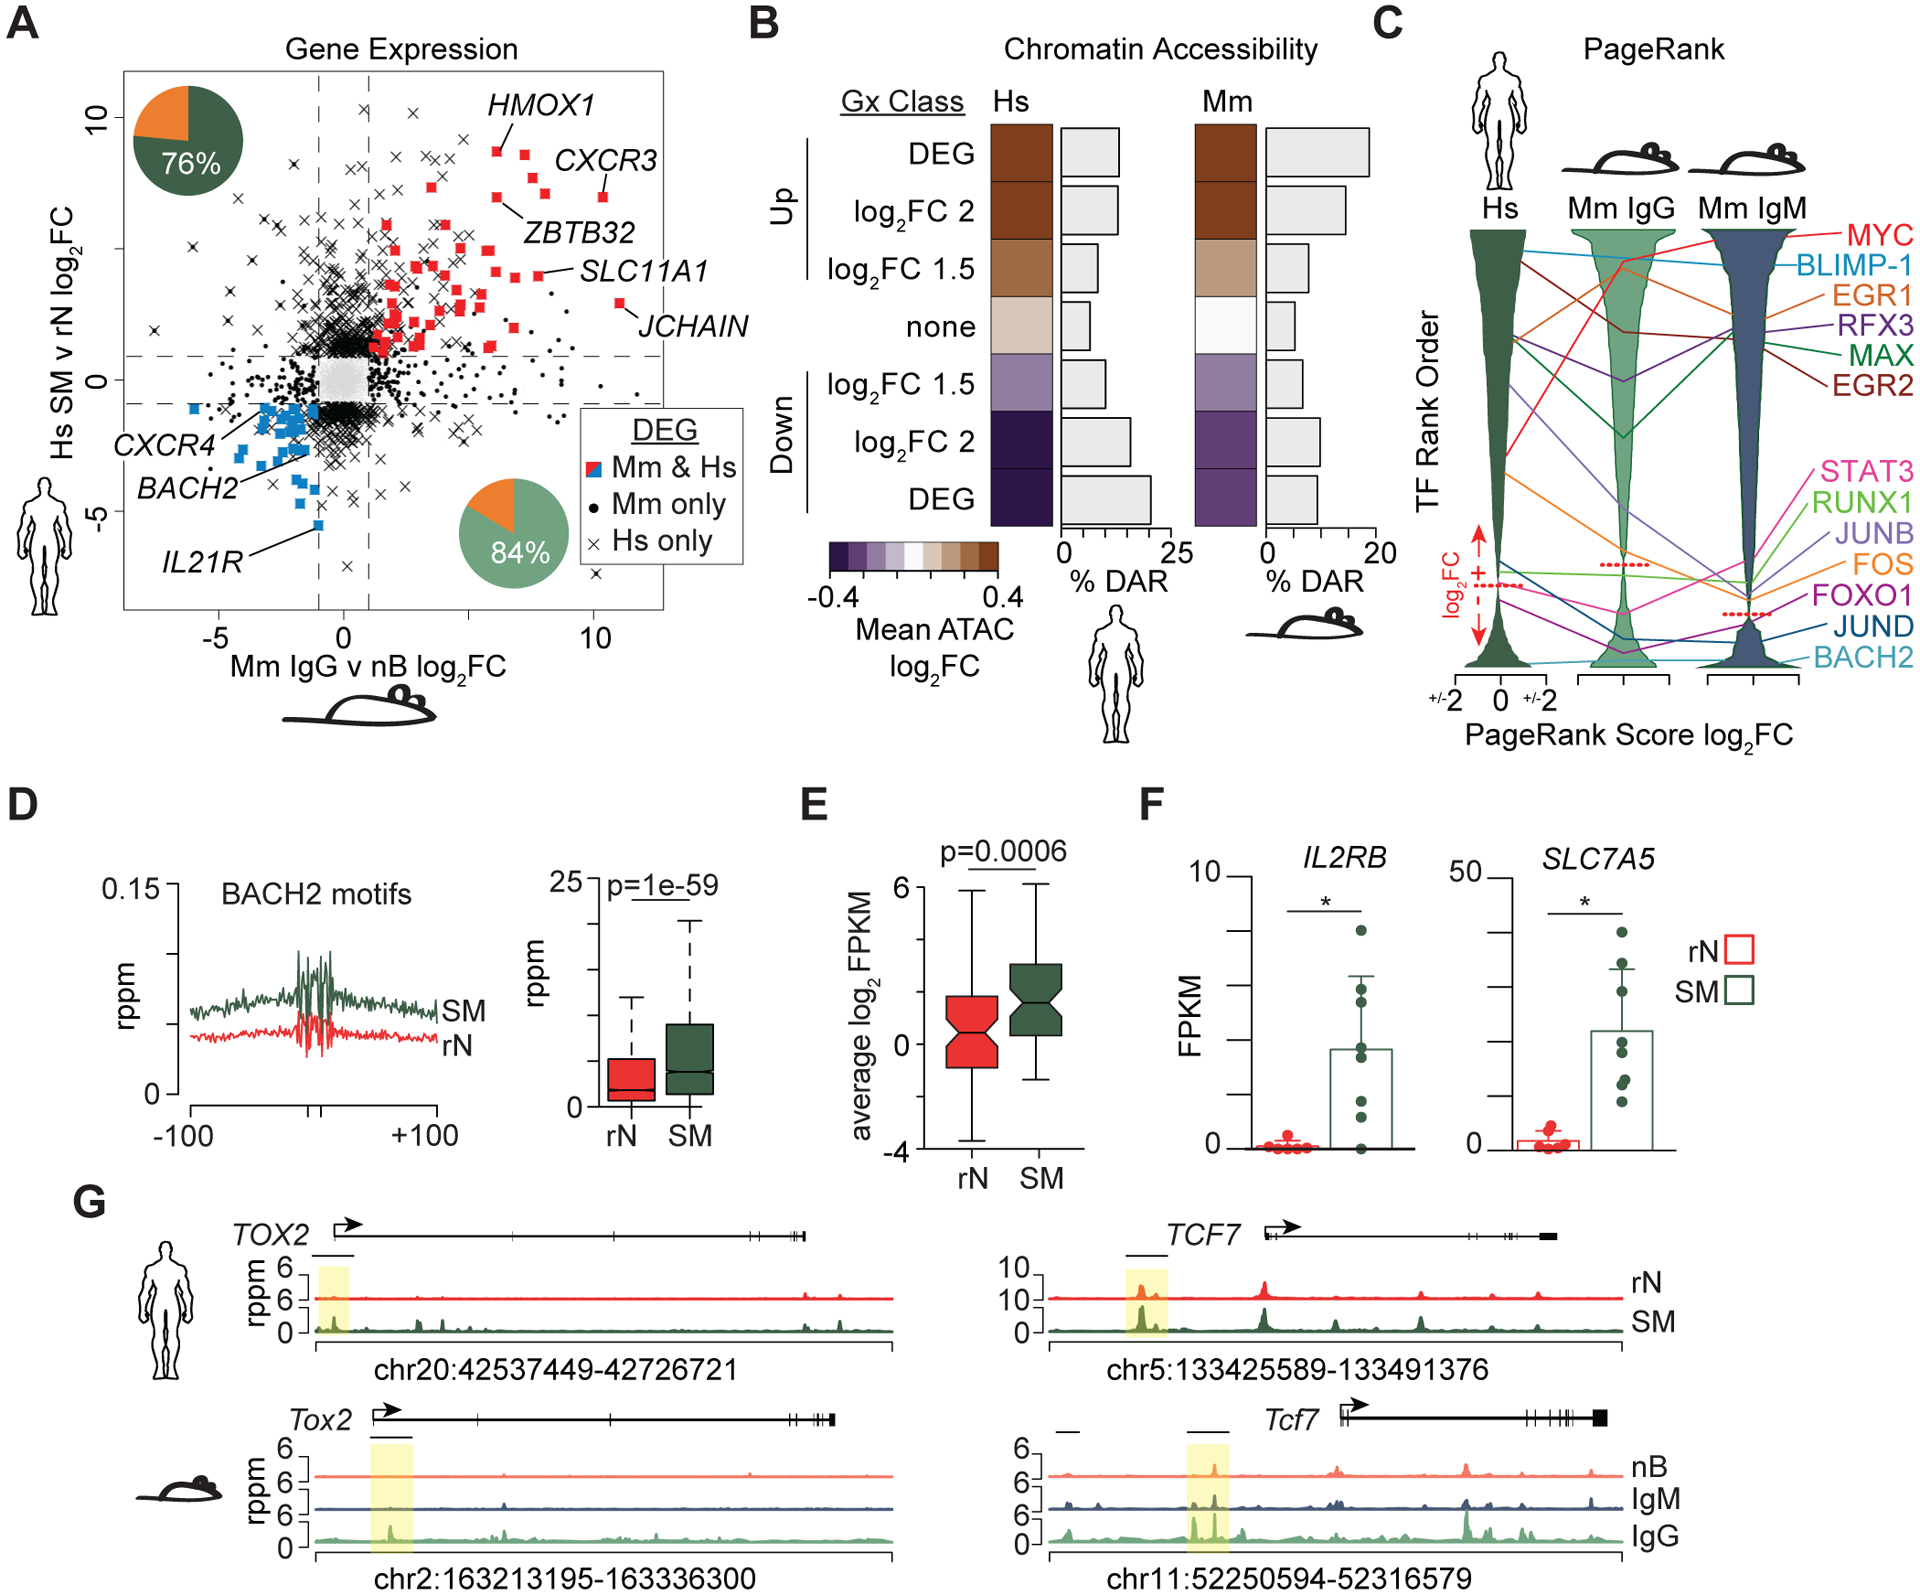
(A) Scatter plot of the fold change for all detected genes between mouse IgG vs. nBs and human isotype-switched memory (SM) vs. resting naïve (rN) reported previously (54). Pie chart indicates the percentage of genes with homologs that were also detected as expressed in the corresponding species. DEG annotations are denoted by symbols shown in the key. (B) Heatmap of corresponding chromatin accessibility in human (left) and mouse (right) cell types for peaks surrounding select gene sets. Genes are subsetted based on seven classifications for changes in expression as indicated. The frequency of accessible regions that are annotated as a DAR for each category is shown to the right of each heatmap. (C) PageRank analysis (29) was performed on each cell subset and the resulting transcription factors ranked by fold change in memory vs. naïve. X-axis scale indicates PageRank log2FC with the dotted line indicating the transition from positive (+) to negative (−) fold changes in the ranked list. Select transcription factors and their location in each list are annotated. (D) Histogram (left) and boxplot (right) of accessibility at BACH2 motifs and surrounding sequences. rppm, reads per peak per million. (E) Average gene expression of log2FPKM normalized data for all BACH2 target genes (55). (F) Gene expression bar plots for examples of two BACH2 target genes in rN and SM B cells. * indicates significant differential expression (FDR < 0.05, absolute log2FC > 1). (G) Genome plots displaying DARs in human (top row) and mouse (bottom row). Highlighted by a yellow box are homologous regions that were identified as DAR. Significance for D, E determined by two-tailed Student’s t-test.
The global chromatin accessibility profiles between the two species were analyzed by clustering the genes that were conserved between mice and humans into seven transcriptional bins based on fold change. For each bin, the chromatin accessibility fold change between memory and naïve B cells was calculated and averaged for all peaks. A concordance between chromatin accessibility and transcription was observed for genes conserved between the MBCs of humans and mice (Fig. 5B). Additionally, up to ~20% of accessible regions were annotated as DAR in the Up and Down DEG bins. Importantly, the genes with no expression changes had the lowest enrichment for accessibility changes.
The PageRank algorithm was applied to the human SM vs. rN comparison and the mouse IgG and IgM MBCs versus nBs. Each transcription factor was ranked from the most important in MBCs to nBs. Many transcription factors showed a similar ranking of importance in each of the three comparisons (Fig. 5C). Among those that had high importance in MBCs included MYC, BLIMP-1, EGR1, RFX3, MAX, and EGR2. Among those that had high importance in nBs were BACH2, FOXO1, and JUND (Fig. 5C). To further explore the change of BACH2 transcriptional networks in MBCs, all peaks were annotated for the presence of a BACH2 binding site motif and the chromatin accessibility in SM and rN calculated (Fig. 5D). We observed significantly more accessibility at BACH2 binding motifs in human SM compared to rN. Additionally, the overall expression of genes that were predicted to be BACH2 targets (55) was increased in SM cells (Fig. 5E). For example, the BACH2 targets, IL2RB, a component of the IL-2 receptor, and SLC7A5, a subunit of the neutral amino acid transporter CD98, were both increased in SM (Fig. 5F). Because BACH2 is described as a transcriptional repressor and its expression is decreased in MBCs, this suggests that the BACH2 binding sites, which are also shared by other members of the AP-1 family of factors, are derepressed.
Examples of regions that are directly conserved between mice and humans and have similar changes in programming include Tox2 and Tcf7 (Fig. 5G). Both of these genes display DAR that have increased accessibility in MBCs compared to naïve cells at syntenic genomic regions. Tox2 drives T follicular helper cell differentiation (56) and is regulated by BACH2 in B cells (55). Tcf7 encodes the gene TCF1 that is required for CD8 memory formation and marks resource stem cells that are capable of reseeding the effector population (57, 58). Thus, human and mouse MBCs share a conserved programming with respect to chromatin accessibility and gene expression.
Hemin enhances plasma cell differentiation of human memory B cells
Consistent with mouse MBCs, the Iron Ion Homeostasis gene set was significantly enriched in MBCs from humans (Fig. 6A). Examples of these genes include HMOX1, HFE, and SLC11A1 (Fig. 6B). HO-1 expression was used as a readout for intracellular heme levels (53) and, as in the mouse, SM cells displayed increased expression of HO-1 compared to rN cells (Fig. 6C). The role of heme in MBC reactivation was evaluated by stimulating SM cells with a cytokine cocktail that promotes PC differentiation over six days (59) in the presence of vehicle or hemin. The MBC cultures that were treated with hemin exhibited increased formation of CD38+CD27+ PC (Fig. 6D, 6E). Additionally, the formation of a more mature population of PC that were CD38+CD138+ (60) was increased in the presence of hemin (Fig. 6F, 6G). ELISPOT analyses of these cultures confirm increased antibody secretion in cultures treated with hemin (Fig. 6H). Thus, hemin directly influences the ex vivo generation of plasma cells from human MBCs.
Figure 6. Hemin augments human plasma cell differentiation and mitochondrial metabolism.
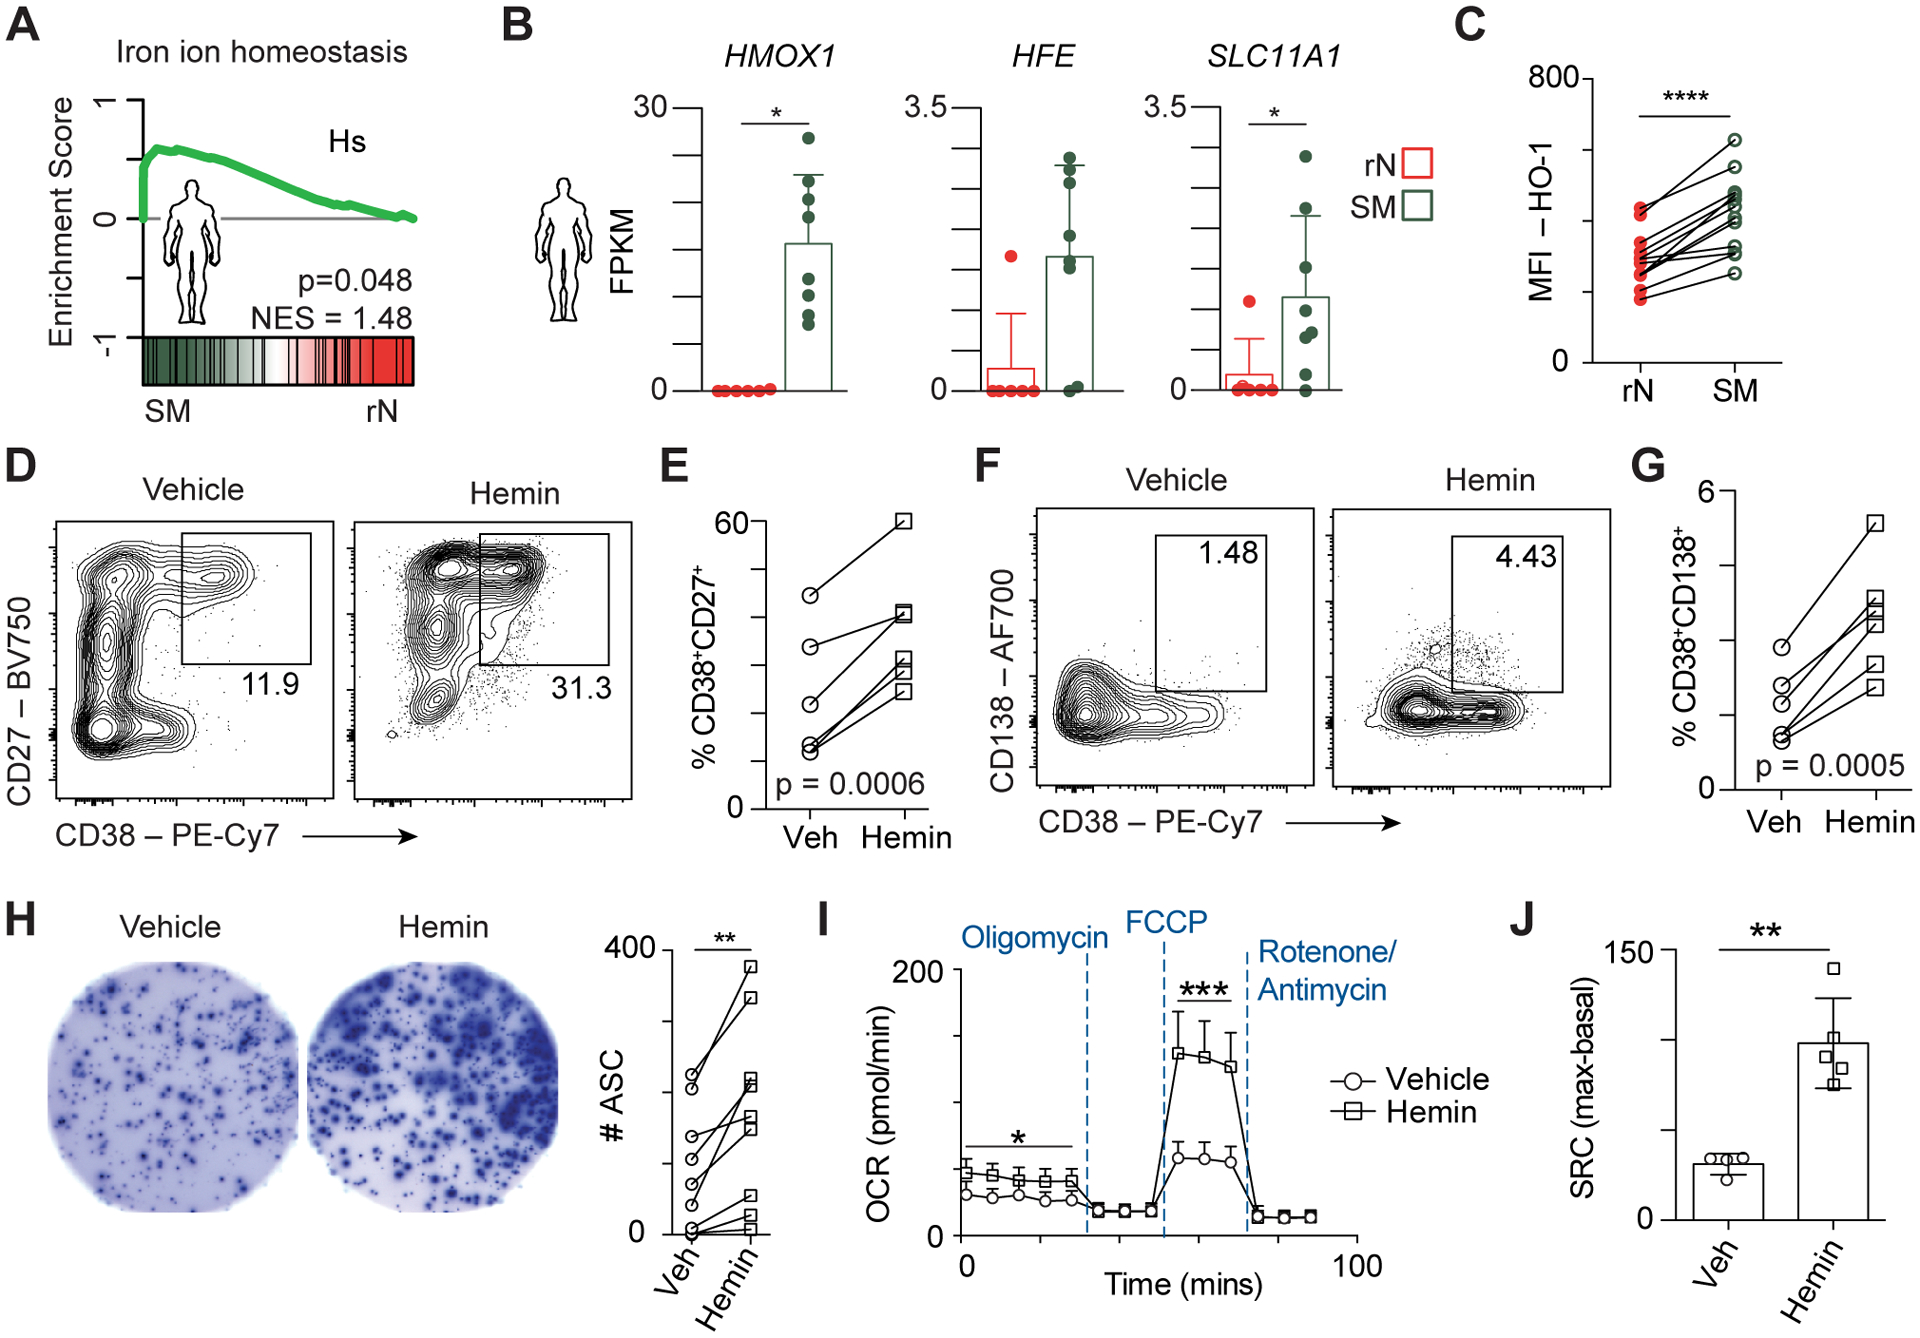
(A) GSEA for the Iron Ion Homeostasis gene set between human SM vs. rN B cells. (B) Bar plots showing gene expression for the indicated genes from the Iron Ion Homeostasis gene set in A. * indicates significant differential expression (FDR < 0.05, absolute log2FC > 1). (C) MFI quantitation of HO-1 in rN and SM cells isolated from total PBMCs from 13 human healthy donors. (D) Representative flow cytometry plots of SM from a single donor stimulated with R848, CD40L, IL-21, IL-2, BAFF, and human insulin as described previously (59) and supplemented with vehicle control or hemin showing the formation of CD38+CD27+ PC. (E) Quantitation of CD38+CD27+ PC from 6 individual donors differentiated as in D. (F) Representative flow cytometry of CD38+CD138+ PC from cultures differentiated as in D. (G) Quantitation of CD38+CD138+ PC from 6 individual donors from F. (H) Representative ELISPOT showing PC antibody spots from 3125 cells plated from the cultures described in D (left) and quantitation of spots from 9 individual donors (right). (I) Memory B cells were differentiated as in D then harvested and washed in Seahorse media before being subjected to a Mitochondrial Stress Test on a Seahorse Bioanalyzer. (J) Spare respiratory capacity was quantified as the difference between first measurement following FCCP injection and the last measurement before oligomycin injection and shown as a bar plot. Data are representative of five patients from two independent experiments. Significance in C, E, G, H, J determined by two-tailed Student’s t-test.
Hemin treatment augments mitochondrial metabolism
The mitochondria is the primary place that iron resides within cells where it is integral to the functions of the electron transport chain and the ability of cells to perform oxidative phosphorylation (52). Previous observations showing that oxidative phosphorylation promotes PC differentiation (61) suggested that the increased PC differentiation in the presence of heme may be accompanied by metabolic changes. To test this, SM B cells were enriched from human PBMCs, stimulated to differentiate (59) in the presence or absence of hemin as above, and the resulting cultures were analyzed for their usage of oxidative phosphorylation by extracellular flux assay on a Seahorse bioanalyzer. Hemin treated samples showed significantly higher basal and maximal respiration (Fig. 6I), which also resulted in increased spare respiratory capacity (Fig. 6J). These data indicate that hemin facilitates increased mitochondrial metabolism and oxidative phosphorylation ex vivo.
DISCUSSION
To distinguish the epigenetic and transcriptional properties contributing to B cell memory, the chromatin accessibility and transcriptome profiles of influenza-specific IgM and IgG MBCs were determined and compared to those of nBs. An overall increase in MBC accessibility was identified that correlated with PC programming and indicated that prior B cell activation imparted an epigenetic state that was distinct from antigen-inexperienced nBs. IgM and IgG MBCs were also distinct from each other, agreeing with previous observations that each MBC subset may be predisposed for different reactivation fates (62). Importantly, MBC programming was largely conserved between mice and humans with the heme and iron homeostasis pathways significantly upregulated in both species. Increased MBC heme content was validated and ex vivo differentiation in the presence of hemin enhanced PC differentiation. Together, these data identify an epigenetic programming that is unique to MBCs and highlight mechanisms for enhanced recall responses upon secondary antigen exposure.
The chromatin accessibility data provide evidence for a primed epigenetic architecture as one mechanism that allows for more rapid responses for MBCs compared to nBs. The maintenance of accessible chromatin at specific loci in MBCs may act to reduce the number of reprogramming steps necessary for many functions, including the formation of GC and PC following reactivation. Indeed, MBC displayed higher expression of genes related to the cell cycle, B cell activation, signal transduction, and migration. Many of these genes showed a graded expression that was high in IgM and maximal in IgG MBCs compared to nBs. Of particular interest was the enhanced expression and accessibility surrounding genes unique to PC in MBCs. PageRank analysis of both mouse and human MBCs revealed BLIMP-1 as an enriched regulator of the MBC transcriptional network, indicating that aspects of the PC program is partially engaged or primed in MBCs. In support of this, the 3D architecture of the Prdm1 locus, which encodes BLIMP-1, is reorganized in activated B cells prior to Prdm1 expression in PC (63). Chromatin accessibility priming was also observed in memory CD8 T cells and helped facilitate rapid induction of effector responses upon secondary stimulation (64). Similar to memory CD8 T cells, a set of primed genes demonstrated rapid induction and higher expression in MBC compared to nB. Therefore, in a similar manner, MBCs maintain an accessibility programming that serves as a molecular signature of prior activation and may improve the fidelity and speed of differentiation during secondary antigen encounters.
The presence of differentially accessible chromatin implies that transcription factor activity is different between MBCs and nBs. Consistent with previous findings (10), both human and mouse MBCs displayed lower expression of Bach2. BACH2 functions by partnering with various AP-1 factors and represses its target genes (51). Both species displayed increased accessibility at BACH2/AP-1 binding motifs. Intriguingly, such target genes such as Prdm1 (mouse) and SLC7A5 and IL2RB (human) were increased in expression, indicating BACH2 activity was reduced in MBCs and that other AP-1 family members were dictating the change in expression. This was supported by PageRank analysis, which found both MYC and a set of AP-1 factors to be more important in MBCs and might allow more rapid induction of metabolic changes, proliferation, and differentiation to PC. Altered MBC metabolic states were indicated by enhanced mRNA and heme content compared to nBs. Additionally, activation of the AKT pathway, which regulates cellular metabolism through mTOR was indicated by reduced expression and network importance of Foxo1 (65). Furthermore, Zbtb32, which acts to restrict secondary responses (15), was upregulated in IgM and was maximally expressed in IgG MBC. Thus, altered MBC transcription factor networks provide mechanisms to rapidly modify metabolism, differentiate to PC, and ultimately regulate humoral responses.
One of the most striking conserved differences between MBCs and nBs was the increased expression of heme biosynthetic genes in MBCs. Heme enhanced the formation of PC from both human and mouse MBCs during ex vivo differentiation. Heme is synthesized and primarily found in the mitochondria where it is an essential component of cytochrome proteins that function in the electron transport chain during oxidative phosphorylation (52). BACH2 and BACH1 both negatively regulate heme biosynthesis in part through direct binding to the Hmox1 promoter (55, 66). Heme can also directly bind BACH2 leading to its degradation and derepression of the heme biosynthesis pathway (53). Heme binding is not the only mechanism controlling BACH2 activity, as the PI3K pathway can also lead to phosphorylation of and decreased nuclear localization of BACH2 (67). Given that heme is an essential component of the electron transport chain and our previous findings linking PC differentiation to oxidative phosphorylation (61), this relationship was explored ex vivo. Differentiation in the presence of heme resulted in increased oxidative phosphorylation. In T cells iron is important for activation induced proliferation and mitochondrial function (68). Thus, by upregulation of the components to import and generate heme, MBCs are primed to rapidly increase their metabolism towards modes that promote PC differentiation and support the demands of antibody secretion.
The importance of heme and iron biogenesis for MBCs is also observed in many human disorders. Patients with combined immunodeficiency caused by a missense mutation in TFRC, the transferrin receptor, have reduced MBC frequencies as a proportion of total B cells (69). TFRC is required for iron uptake and this observation suggests that iron is important in either the formation or maintenance of MBCs. In multiple myeloma, the iron exporter ferroportin-1 (SLC40A1) is decreased, resulting in increased cell-associated iron and poor prognosis (70, 71). Consistent with previous reports (53), administration of heme to mice had no measurable effect on the immune response to influenza (data not shown). However, mice deficient in HO-1, which degrades heme, have increased serum antibody titers (72), indicating heme regulates B cell function in vivo. Thus, targeted modulation of iron metabolism and biogenesis may be a mechanism to promote antibody responses, as well as limit PC differentiation and cell survival in cancer and potentially autoimmune settings. In summary, these data define a conserved epigenetic state centered around primed chromatin accessibility in MBC that provides a molecular history of prior activation and likely contributes to enhanced functions and responses upon secondary challenge.
Supplementary Material
Key Points.
Influenza-specific memory B cells have accessible chromatin structure.
Human and mouse memory B cells upregulate heme metabolic pathways.
Heme enhances PC differentiation and augments mitochondrial metabolism in ex vivo.
ACKNOWLEDGMENTS
We thank R. Butler for animal husbandry and care; R. Karaffa for cell sorting at the Emory Flow Cytometry Core; and Drs. E. Zumaquero and F.E. Lund (University of Alabama, Birmingham) for guidance with human ex vivo MBC cultures and differentiation.
This work was supported by NIH grants to J.M.B. (1 R01 AI148471 and 5 P01 AI125180), C.D.S. (1 R01 AI148471), and M.J.P. (1 F31 AI138391).
ABBREVIATIONS
- ATAC-seq
Assay for transposase accessible sequencing
- DAR
differentially accessible region
- DEG
differentially expressed gene
- dLN
draining lymph node
- FC
fold-change
- FDR
false-discovery rate
- GO
gene ontology
- SEA
gene set enrichment analysis
- MBCs
memory B cells
- nBs
naïve B cells
- NP
nucleoprotein
- rN
resting naïve B cells
- PC
principal component
- PCA
principal component analysis
- PCs
plasma cells
- SM
class-switched memory B cells
REFERENCES
- 1.Kurosaki T, Kometani K, and Ise W. 2015. Memory B cells. Nat Rev Immunol 15: 149–159. [DOI] [PubMed] [Google Scholar]
- 2.Wienands J, and Engels N. 2016. Control of memory B cell responses by extrinsic and intrinsic mechanisms. Immunol Lett 178: 27–30. [DOI] [PubMed] [Google Scholar]
- 3.Moens L, Kane A, and Tangye SG. 2016. Naive and memory B cells exhibit distinct biochemical responses following BCR engagement. Immunol Cell Biol 94: 774–786. [DOI] [PubMed] [Google Scholar]
- 4.Wakabayashi C, Adachi T, Wienands J, and Tsubata T. 2002. A distinct signaling pathway used by the IgG-containing B cell antigen receptor. Science 298: 2392–2395. [DOI] [PubMed] [Google Scholar]
- 5.Wan Z, Chen X, Chen H, Ji Q, Chen Y, Wang J, Cao Y, Wang F, Lou J, Tang Z, and Liu W. 2015. The activation of IgM- or isotype-switched IgG- and IgE-BCR exhibits distinct mechanical force sensitivity and threshold. Elife 4. [DOI] [PMC free article] [PubMed] [Google Scholar]
- 6.Tomayko MM, Steinel NC, Anderson SM, and Shlomchik MJ. 2010. Cutting edge: Hierarchy of maturity of murine memory B cell subsets. J Immunol 185: 7146–7150. [DOI] [PMC free article] [PubMed] [Google Scholar]
- 7.Zuccarino-Catania GV, Sadanand S, Weisel FJ, Tomayko MM, Meng H, Kleinstein SH, Good-Jacobson KL, and Shlomchik MJ. 2014. CD80 and PD-L2 define functionally distinct memory B cell subsets that are independent of antibody isotype. Nat Immunol 15: 631–637. [DOI] [PMC free article] [PubMed] [Google Scholar]
- 8.Krishnamurty AT, Thouvenel CD, Portugal S, Keitany GJ, Kim KS, Holder A, Crompton PD, Rawlings DJ, and Pepper M. 2016. Somatically Hypermutated Plasmodium-Specific IgM(+) Memory B Cells Are Rapid, Plastic, Early Responders upon Malaria Rechallenge. Immunity 45: 402–414. [DOI] [PMC free article] [PubMed] [Google Scholar]
- 9.Reynaud CA, Descatoire M, Dogan I, Huetz F, Weller S, and Weill JC. 2012. IgM memory B cells: a mouse/human paradox. Cell Mol Life Sci 69: 1625–1634. [DOI] [PMC free article] [PubMed] [Google Scholar]
- 10.Kometani K, Nakagawa R, Shinnakasu R, Kaji T, Rybouchkin A, Moriyama S, Furukawa K, Koseki H, Takemori T, and Kurosaki T. 2013. Repression of the transcription factor Bach2 contributes to predisposition of IgG1 memory B cells toward plasma cell differentiation. Immunity 39: 136–147. [DOI] [PubMed] [Google Scholar]
- 11.Good-Jacobson KL, Chen Y, Voss AK, Smyth GK, Thomas T, and Tarlinton D. 2014. Regulation of germinal center responses and B-cell memory by the chromatin modifier MOZ. Proc Natl Acad Sci U S A 111: 9585–9590. [DOI] [PMC free article] [PubMed] [Google Scholar]
- 12.Lai AY, Mav D, Shah R, Grimm SA, Phadke D, Hatzi K, Melnick A, Geigerman C, Sobol SE, Jaye DL, and Wade PA. 2013. DNA methylation profiling in human B cells reveals immune regulatory elements and epigenetic plasticity at Alu elements during B-cell activation. Genome Res 23: 2030–2041. [DOI] [PMC free article] [PubMed] [Google Scholar]
- 13.Kulis M, Merkel A, Heath S, Queiros AC, Schuyler RP, Castellano G, Beekman R, Raineri E, Esteve A, Clot G, Verdaguer-Dot N, Duran-Ferrer M, Russinol N, Vilarrasa-Blasi R, Ecker S, Pancaldi V, Rico D, Agueda L, Blanc J, Richardson D, Clarke L, Datta A, Pascual M, Agirre X, Prosper F, Alignani D, Paiva B, Caron G, Fest T, Muench MO, Fomin ME, Lee ST, Wiemels JL, Valencia A, Gut M, Flicek P, Stunnenberg HG, Siebert R, Kuppers R, Gut IG, Campo E, and Martin-Subero JI. 2015. Whole-genome fingerprint of the DNA methylome during human B cell differentiation. Nat Genet 47: 746–756. [DOI] [PMC free article] [PubMed] [Google Scholar]
- 14.Scharer CD, Bally AP, Gandham B, and Boss JM. 2017. Cutting Edge: Chromatin Accessibility Programs CD8 T Cell Memory. J Immunol 198. [DOI] [PMC free article] [PubMed] [Google Scholar]
- 15.Jash A, Wang Y, Weisel FJ, Scharer CD, Boss JM, Shlomchik MJ, and Bhattacharya D. 2016. ZBTB32 Restricts the Duration of Memory B Cell Recall Responses. J Immunol 197: 1159–1168. [DOI] [PMC free article] [PubMed] [Google Scholar]
- 16.Allie SR, Bradley JE, Mudunuru U, Schultz MD, Graf BA, Lund FE, and Randall TD. 2019. The establishment of resident memory B cells in the lung requires local antigen encounter. Nat Immunol 20: 97–108. [DOI] [PMC free article] [PubMed] [Google Scholar]
- 17.Dobin A, Davis CA, Schlesinger F, Drenkow J, Zaleski C, Jha S, Batut P, Chaisson M, and Gingeras TR. 2013. STAR: ultrafast universal RNA-seq aligner. Bioinformatics 29: 15–21. [DOI] [PMC free article] [PubMed] [Google Scholar]
- 18.Lawrence M, Huber W, Pages H, Aboyoun P, Carlson M, Gentleman R, Morgan MT, and Carey VJ. 2013. Software for computing and annotating genomic ranges. PLoS Comput Biol 9: e1003118. [DOI] [PMC free article] [PubMed] [Google Scholar]
- 19.Robinson MD, McCarthy DJ, and Smyth GK. 2010. edgeR: a Bioconductor package for differential expression analysis of digital gene expression data. Bioinformatics (Oxford, England) 26: 139–140. [DOI] [PMC free article] [PubMed] [Google Scholar]
- 20.Huang da W, Sherman BT, and Lempicki RA. 2009. Systematic and integrative analysis of large gene lists using DAVID bioinformatics resources. Nat Protoc 4: 44–57. [DOI] [PubMed] [Google Scholar]
- 21.Mootha VK, Lindgren CM, Eriksson KF, Subramanian A, Sihag S, Lehar J, Puigserver P, Carlsson E, Ridderstrale M, Laurila E, Houstis N, Daly MJ, Patterson N, Mesirov JP, Golub TR, Tamayo P, Spiegelman B, Lander ES, Hirschhorn JN, Altshuler D, and Groop LC. 2003. PGC-1alpha-responsive genes involved in oxidative phosphorylation are coordinately downregulated in human diabetes. Nat Genet 34: 267–273. [DOI] [PubMed] [Google Scholar]
- 22.Barwick BG, Scharer CD, Bally APR, and Boss JM. 2016. Plasma cell differentiation is coupled to division-dependent DNA hypomethylation and gene regulation. Nat Immunol 17: 1216–1225. [DOI] [PMC free article] [PubMed] [Google Scholar]
- 23.Sayers EW, Agarwala R, Bolton EE, Brister JR, Canese K, Clark K, Connor R, Fiorini N, Funk K, Hefferon T, Holmes JB, Kim S, Kimchi A, Kitts PA, Lathrop S, Lu Z, Madden TL, Marchler-Bauer A, Phan L, Schneider VA, Schoch CL, Pruitt KD, and Ostell J. 2019. Database resources of the National Center for Biotechnology Information. Nucleic Acids Res 47: D23–D28. [DOI] [PMC free article] [PubMed] [Google Scholar]
- 24.Guo M, Price MJ, Patterson DG, Barwick BG, Haines RR, Kania AK, Bradley JE, Randall TD, Boss JM, and Scharer CD. 2018. EZH2 Represses the B Cell Transcriptional Program and Regulates Antibody-Secreting Cell Metabolism and Antibody Production. J Immunol 200: 1039–1052. [DOI] [PMC free article] [PubMed] [Google Scholar]
- 25.Langmead B, Trapnell C, Pop M, and Salzberg SL. 2009. Ultrafast and memory-efficient alignment of short DNA sequences to the human genome. Genome Biol 10: R25. [DOI] [PMC free article] [PubMed] [Google Scholar]
- 26.Zhang Y, Liu T, Meyer CA, Eeckhoute J, Johnson DS, Bernstein BE, Nusbaum C, Myers RM, Brown M, Li W, and Liu XS. 2008. Model-based analysis of ChIP-Seq (MACS). Genome Biol 9: R137. [DOI] [PMC free article] [PubMed] [Google Scholar]
- 27.Heinz S, Benner C, Spann N, Bertolino E, Lin YC, Laslo P, Cheng JX, Murre C, Singh H, and Glass CK. 2010. Simple combinations of lineage-determining transcription factors prime cis-regulatory elements required for macrophage and B cell identities. Mol Cell 38: 576–589. [DOI] [PMC free article] [PubMed] [Google Scholar]
- 28.Scharer CD, Blalock EL, Barwick BG, Haines RR, Wei C, Sanz I, and Boss JM. 2016. ATAC-seq on biobanked specimens defines a unique chromatin accessibility structure in naive SLE B cells. Sci Rep 6: 27030. [DOI] [PMC free article] [PubMed] [Google Scholar]
- 29.Zhang K, Wang M, Zhao Y, and Wang W. 2019. Taiji: System-level identification of key transcription factors reveals transcriptional waves in mouse embryonic development. Sci Adv 5: eaav3262. [DOI] [PMC free article] [PubMed] [Google Scholar]
- 30.Kees U, and Krammer PH. 1984. Most influenza A virus-specific memory cytotoxic T lymphocytes react with antigenic epitopes associated with internal virus determinants. J Exp Med 159: 365–377. [DOI] [PMC free article] [PubMed] [Google Scholar]
- 31.Ballesteros-Tato A, Leon B, Lee BO, Lund FE, and Randall TD. 2014. Epitope-specific regulation of memory programming by differential duration of antigen presentation to influenza-specific CD8(+) T cells. Immunity 41: 127–140. [DOI] [PMC free article] [PubMed] [Google Scholar]
- 32.Pape KA, Taylor JJ, Maul RW, Gearhart PJ, and Jenkins MK. 2011. Different B cell populations mediate early and late memory during an endogenous immune response. Science 331: 1203–1207. [DOI] [PMC free article] [PubMed] [Google Scholar]
- 33.Ashburner M, Ball CA, Blake JA, Botstein D, Butler H, Cherry JM, Davis AP, Dolinski K, Dwight SS, Eppig JT, Harris MA, Hill DP, Issel-Tarver L, Kasarskis A, Lewis S, Matese JC, Richardson JE, Ringwald M, Rubin GM, and Sherlock G. 2000. Gene ontology: tool for the unification of biology. The Gene Ontology Consortium. Nat Genet 25: 25–29. [DOI] [PMC free article] [PubMed] [Google Scholar]
- 34.Lord GM, Rao RM, Choe H, Sullivan BM, Lichtman AH, Luscinskas FW, and Glimcher LH. 2005. T-bet is required for optimal proinflammatory CD4+ T-cell trafficking. Blood 106: 3432–3439. [DOI] [PMC free article] [PubMed] [Google Scholar]
- 35.Stone SL, Peel JN, Scharer CD, Risley CA, Chisolm DA, Schultz MD, Yu B, Ballesteros-Tato A, Wojciechowski W, Mousseau B, Misra RS, Hanidu A, Jiang H, Qi Z, Boss JM, Randall TD, Brodeur SR, Goldrath AW, Weinmann AS, Rosenberg AF, and Lund FE. 2019. T-bet Transcription Factor Promotes Antibody-Secreting Cell Differentiation by Limiting the Inflammatory Effects of IFN-gamma on B Cells. Immunity 50: 1172–1187 e1177. [DOI] [PMC free article] [PubMed] [Google Scholar]
- 36.Carpentier I, and Beyaert R. 1999. TRAF1 is a TNF inducible regulator of NF-kappaB activation. FEBS Lett 460: 246–250. [DOI] [PubMed] [Google Scholar]
- 37.Shu HB, Agranoff AB, Nabel EG, Leung K, Duckett CS, Neish AS, Collins T, and Nabel GJ. 1993. Differential regulation of vascular cell adhesion molecule 1 gene expression by specific NF-kappa B subunits in endothelial and epithelial cells. Mol Cell Biol 13: 6283–6289. [DOI] [PMC free article] [PubMed] [Google Scholar]
- 38.Takatsuka S, Yamada H, Haniuda K, Saruwatari H, Ichihashi M, Renauld JC, and Kitamura D. 2018. IL-9 receptor signaling in memory B cells regulates humoral recall responses. Nat Immunol 19: 1025–1034. [DOI] [PubMed] [Google Scholar]
- 39.Browne EP 2012. Regulation of B-cell responses by Toll-like receptors. Immunology 136: 370–379. [DOI] [PMC free article] [PubMed] [Google Scholar]
- 40.Matloubian M, Lo CG, Cinamon G, Lesneski MJ, Xu Y, Brinkmann V, Allende ML, Proia RL, and Cyster JG. 2004. Lymphocyte egress from thymus and peripheral lymphoid organs is dependent on S1P receptor 1. Nature 427: 355–360. [DOI] [PubMed] [Google Scholar]
- 41.Allende ML, Tuymetova G, Lee BG, Bonifacino E, Wu YP, and Proia RL. 2010. S1P1 receptor directs the release of immature B cells from bone marrow into blood. J Exp Med 207: 1113–1124. [DOI] [PMC free article] [PubMed] [Google Scholar]
- 42.Alam J, and Smith A. 1992. Heme-hemopexin-mediated induction of metallothionein gene expression. J Biol Chem 267: 16379–16384. [PubMed] [Google Scholar]
- 43.Wang Y, Brooks SR, Li X, Anzelon AN, Rickert RC, and Carter RH. 2002. The physiologic role of CD19 cytoplasmic tyrosines. Immunity 17: 501–514. [DOI] [PubMed] [Google Scholar]
- 44.Subramanian A, Tamayo P, Mootha VK, Mukherjee S, Ebert BL, Gillette MA, Paulovich A, Pomeroy SL, Golub TR, Lander ES, and Mesirov JP. 2005. Gene set enrichment analysis: a knowledge-based approach for interpreting genome-wide expression profiles. Proc Natl Acad Sci U S A 102: 15545–15550. [DOI] [PMC free article] [PubMed] [Google Scholar]
- 45.Stegmeier F, Rape M, Draviam VM, Nalepa G, Sowa ME, Ang XL, McDonald ER 3rd, Li MZ, Hannon GJ, Sorger PK, Kirschner MW, Harper JW, and Elledge SJ. 2007. Anaphase initiation is regulated by antagonistic ubiquitination and deubiquitination activities. Nature 446: 876–881. [DOI] [PubMed] [Google Scholar]
- 46.Dengler HS, Baracho GV, Omori SA, Bruckner S, Arden KC, Castrillon DH, DePinho RA, and Rickert RC. 2008. Distinct functions for the transcription factor Foxo1 at various stages of B cell differentiation. Nat Immunol 9: 1388–1398. [DOI] [PMC free article] [PubMed] [Google Scholar]
- 47.Buenrostro JD, Giresi PG, Zaba LC, Chang HY, and Greenleaf WJ. 2013. Transposition of native chromatin for fast and sensitive epigenomic profiling of open chromatin, DNA-binding proteins and nucleosome position. Nat Methods 10: 1213–1218. [DOI] [PMC free article] [PubMed] [Google Scholar]
- 48.Shi W, Liao Y, Willis SN, Taubenheim N, Inouye M, Tarlinton DM, Smyth GK, Hodgkin PD, Nutt SL, and Corcoran LM. 2015. Transcriptional profiling of mouse B cell terminal differentiation defines a signature for antibody-secreting plasma cells. Nat Immunol 16: 663–673. [DOI] [PubMed] [Google Scholar]
- 49.Scharer CD, Barwick BG, Guo M, Bally APR, and Boss JM. 2018. Plasma cell differentiation is controlled by multiple cell division-coupled epigenetic programs. Nat Commun 9: 1698. [DOI] [PMC free article] [PubMed] [Google Scholar]
- 50.Minnich M, Tagoh H, Bonelt P, Axelsson E, Fischer M, Cebolla B, Tarakhovsky A, Nutt SL, Jaritz M, and Busslinger M. 2016. Multifunctional role of the transcription factor Blimp-1 in coordinating plasma cell differentiation. Nat Immunol 17: 331–343. [DOI] [PMC free article] [PubMed] [Google Scholar]
- 51.Roychoudhuri R, Clever D, Li P, Wakabayashi Y, Quinn KM, Klebanoff CA, Ji Y, Sukumar M, Eil RL, Yu Z, Spolski R, Palmer DC, Pan JH, Patel SJ, Macallan DC, Fabozzi G, Shih HY, Kanno Y, Muto A, Zhu J, Gattinoni L, O’Shea JJ, Okkenhaug K, Igarashi K, Leonard WJ, and Restifo NP. 2016. BACH2 regulates CD8(+) T cell differentiation by controlling access of AP-1 factors to enhancers. Nat Immunol 17: 851–860. [DOI] [PMC free article] [PubMed] [Google Scholar]
- 52.Igarashi K, and Watanabe-Matsui M. 2014. Wearing red for signaling: the heme-bach axis in heme metabolism, oxidative stress response and iron immunology. Tohoku J Exp Med 232: 229–253. [DOI] [PubMed] [Google Scholar]
- 53.Watanabe-Matsui M, Muto A, Matsui T, Itoh-Nakadai A, Nakajima O, Murayama K, Yamamoto M, Ikeda-Saito M, and Igarashi K. 2011. Heme regulates B-cell differentiation, antibody class switch, and heme oxygenase-1 expression in B cells as a ligand of Bach2. Blood 117: 5438–5448. [DOI] [PubMed] [Google Scholar]
- 54.Scharer CD, Blalock EL, Mi T, Barwick BG, Jenks SA, Deguchi T, Cashman KS, Neary BE, Patterson DG, Hicks SL, Khosroshahi A, Eun-Hyung Lee F, Wei C, Sanz I, and Boss JM. 2019. Epigenetic programming underpins B cell dysfunction in human SLE. Nat Immunol 20: 1071–1082. [DOI] [PMC free article] [PubMed] [Google Scholar]
- 55.Hipp N, Symington H, Pastoret C, Caron G, Monvoisin C, Tarte K, Fest T, and Delaloy C. 2017. IL-2 imprints human naive B cell fate towards plasma cell through ERK/ELK1-mediated BACH2 repression. Nat Commun 8: 1443. [DOI] [PMC free article] [PubMed] [Google Scholar]
- 56.Xu W, Zhao X, Wang X, Feng H, Gou M, Jin W, Wang X, Liu X, and Dong C. 2019. The Transcription Factor Tox2 Drives T Follicular Helper Cell Development via Regulating Chromatin Accessibility. Immunity 51: 826–839 e825. [DOI] [PubMed] [Google Scholar]
- 57.Zhou X, Yu S, Zhao DM, Harty JT, Badovinac VP, and Xue HH. 2010. Differentiation and persistence of memory CD8(+) T cells depend on T cell factor 1. Immunity 33: 229–240. [DOI] [PMC free article] [PubMed] [Google Scholar]
- 58.Im SJ, Hashimoto M, Gerner MY, Lee J, Kissick HT, Burger MC, Shan Q, Hale JS, Lee J, Nasti TH, Sharpe AH, Freeman GJ, Germain RN, Nakaya HI, Xue HH, and Ahmed R. 2016. Defining CD8+ T cells that provide the proliferative burst after PD-1 therapy. Nature 537: 417–421. [DOI] [PMC free article] [PubMed] [Google Scholar]
- 59.Zumaquero E, Stone SL, Scharer CD, Jenks SA, Nellore A, Mousseau B, Rosal-Vela A, Botta D, Bradley JE, Wojciechowski W, Ptacek T, Danila MI, Edberg JC, Bridges SL Jr., Kimberly RP, Chatham WW, Schoeb TR, Rosenberg AF, Boss JM, Sanz I, and Lund FE. 2019. IFNgamma induces epigenetic programming of human T-bet(hi) B cells and promotes TLR7/8 and IL-21 induced differentiation. Elife 8. [DOI] [PMC free article] [PubMed] [Google Scholar]
- 60.Garimalla S, Nguyen DC, Halliley JL, Tipton C, Rosenberg AF, Fucile CF, Saney CL, Kyu S, Kaminski D, Qian Y, Scheuermann RH, Gibson G, Sanz I, and Lee FE. 2019. Differential transcriptome and development of human peripheral plasma cell subsets. JCI Insight 4. [DOI] [PMC free article] [PubMed] [Google Scholar]
- 61.Price MJ, Patterson DG, Scharer CD, and Boss JM. 2018. Progressive Upregulation of Oxidative Metabolism Facilitates Plasmablast Differentiation to a T-Independent Antigen. Cell Rep 23: 3152–3159. [DOI] [PMC free article] [PubMed] [Google Scholar]
- 62.Harms Pritchard G, and Pepper M. 2018. Memory B cell heterogeneity: Remembrance of things past. J Leukoc Biol 103: 269–274. [DOI] [PMC free article] [PubMed] [Google Scholar]
- 63.Johanson TM, Lun ATL, Coughlan HD, Tan T, Smyth GK, Nutt SL, and Allan RS. 2018. Transcription-factor-mediated supervision of global genome architecture maintains B cell identity. Nat Immunol 19: 1257–1264. [DOI] [PubMed] [Google Scholar]
- 64.Scharer CD, Bally AP, Gandham B, and Boss JM. 2017. Cutting Edge: Chromatin Accessibility Programs CD8 T Cell Memory. J Immunol 198: 2238–2243. [DOI] [PMC free article] [PubMed] [Google Scholar]
- 65.Boothby M, and Rickert RC. 2017. Metabolic Regulation of the Immune Humoral Response. Immunity 46: 743–755. [DOI] [PMC free article] [PubMed] [Google Scholar]
- 66.Sun J, Hoshino H, Takaku K, Nakajima O, Muto A, Suzuki H, Tashiro S, Takahashi S, Shibahara S, Alam J, Taketo MM, Yamamoto M, and Igarashi K. 2002. Hemoprotein Bach1 regulates enhancer availability of heme oxygenase-1 gene. EMBO J 21: 5216–5224. [DOI] [PMC free article] [PubMed] [Google Scholar]
- 67.Ando R, Shima H, Tamahara T, Sato Y, Watanabe-Matsui M, Kato H, Sax N, Motohashi H, Taguchi K, Yamamoto M, Nio M, Maeda T, Ochiai K, Muto A, and Igarashi K. 2016. The Transcription Factor Bach2 Is Phosphorylated at Multiple Sites in Murine B Cells but a Single Site Prevents Its Nuclear Localization. J Biol Chem 291: 1826–1840. [DOI] [PMC free article] [PubMed] [Google Scholar]
- 68.Yarosz EL, Ye C, Kumar A, Black C, Choi EK, Seo YA, and Chang CH. 2020. Cutting Edge: Activation-Induced Iron Flux Controls CD4 T Cell Proliferation by Promoting Proper IL-2R Signaling and Mitochondrial Function. J Immunol 204: 1708–1713. [DOI] [PMC free article] [PubMed] [Google Scholar]
- 69.Jabara HH, Boyden SE, Chou J, Ramesh N, Massaad MJ, Benson H, Bainter W, Fraulino D, Rahimov F, Sieff C, Liu ZJ, Alshemmari SH, Al-Ramadi BK, Al-Dhekri H, Arnaout R, Abu-Shukair M, Vatsayan A, Silver E, Ahuja S, Davies EG, Sola-Visner M, Ohsumi TK, Andrews NC, Notarangelo LD, Fleming MD, Al-Herz W, Kunkel LM, and Geha RS. 2016. A missense mutation in TFRC, encoding transferrin receptor 1, causes combined immunodeficiency. Nat Genet 48: 74–78. [DOI] [PMC free article] [PubMed] [Google Scholar]
- 70.Gu Z, Wang H, Xia J, Yang Y, Jin Z, Xu H, Shi J, De Domenico I, Tricot G, and Zhan F. 2015. Decreased ferroportin promotes myeloma cell growth and osteoclast differentiation. Cancer Res 75: 2211–2221. [DOI] [PMC free article] [PubMed] [Google Scholar]
- 71.Zhan X, Yu W, Franqui-Machin R, Bates ML, Nadiminti K, Cao H, Amendt BA, Jethava Y, Frech I, Zhan F, and Tricot G. 2017. Alteration of mitochondrial biogenesis promotes disease progression in multiple myeloma. Oncotarget 8: 111213–111224. [DOI] [PMC free article] [PubMed] [Google Scholar]
- 72.Shen X, Liu Y, Hsu YJ, Fujiwara Y, Kim J, Mao X, Yuan GC, and Orkin SH. 2008. EZH1 mediates methylation on histone H3 lysine 27 and complements EZH2 in maintaining stem cell identity and executing pluripotency. Mol Cell 32: 491–502. [DOI] [PMC free article] [PubMed] [Google Scholar]
Associated Data
This section collects any data citations, data availability statements, or supplementary materials included in this article.
Supplementary Materials
Data Availability Statement
Sequencing data generated in this study have been deposited in the NCBI Gene Expression Omnibus (https://www.ncbi.nlm.nih.gov/geo/) and are available under accession GSE164173. Code used to analyze the data and generate the figures is available from http://github.com/cdschar and upon request.