Abstract
Purpose:
The LI-RADS Treatment Response (LR-TR) algorithm was introduced in 2017 to assist radiologists in assessing hepatocellular carcinoma (HCC) response following locoregional therapy. The objective of this study was to evaluate the associations between pre-treatment LI-RADS diagnostic categories, post-treatment LR-TR categories, and mRECIST response categories with overall survival (OS) of patients with HCC.
Methods:
This retrospective study included untreated patients with one or two lesions who underwent transarterial embolization with or without concomitant ablation from December 2003–December 2017. Two radiologists (R1 and R2) reviewed pre- and post-treatment CT imaging. Associations between pre- and post-treatment variables, including post-treatment LR-TR categories (Viable, Equivocal, Nonviable), with OS were assessed using the Kaplan–Meier method and Cox proportional hazards regression.
Results:
85 patients were included (median age = 71 years, range 50–87; 17 women). The median OS from first embolization was 43.92 months. Pre- and post-treatment tumor size, pre-treatment LR-TIV (compared with LR-5), and post-treatment LR-TR Viable (compared with LR-TR Nonviable) were associated with OS (p<0.05 for all). Median OS was shorter for LR-TR Viable patients (R1, 25.64 months, 95% CI: 18.58–35.70; R2, 26.43 months 95% CI: 20.68–43.92) than for LR-TR Nonviable patients (64.21 months R1 and R2, 95% CI: 42.71–92.45 and 36.30–94.09, respectively). mRECIST categories showed similar associations with OS. Inter-reader agreement was moderate for LI-RADS categories (κ=0.57, 95% CI: 0.35–0.78) and substantial for LR-TR categories (κ=0.68, 95% CI: 0.55–0.81).
Conclusions:
LR-TR categories show a strong association with OS in HCC patients treated with transarterial embolization.
Keywords: locoregional therapy, treatment response, RECIST, computed tomography
Introduction
Hepatocellular carcinoma (HCC) is the second most common cause of cancer-related death worldwide [1], and its incidence and mortality rates are increasing [2–4]. Transcatheter embolization is one of many locoregional therapies available for the treatment of HCC, with the goal of prolonging survival [5–7]. However, it is challenging to assess survival in the HCC patient population for many reasons; tumor burden, tumor aggressiveness, and severity of the underlying liver disease vary between patients. The development of surrogate endpoints, such as imaging features following treatment, is therefore an essential component of both patient care and for evaluating treatment efficacy [7].
Since HCC typically display arterial phase hyperenhancement at the time of diagnosis [7], mRECIST was developed specifically to assess HCC treatment response, thereby accounting for changes in enhancement of measurable tumors after locoregional therapy [8,9]. While mRECIST has been applied increasingly in clinical studies of HCC patients undergoing locoregional therapy, it remains challenging to apply in clinical practice. The LI-RADS Treatment Response (LR-TR) algorithm was thus developed to standardize the clinical reporting of patients undergoing locoregional therapy, such as embolization and ablation [9–11]. While it is similar to mRECIST in the assessment of residual enhancing tumor, it provides categories of viability for individually treated tumors rather than patient-level response categories. It also provides an “equivocal” category for cases of uncertainty (i.e., when expected enhancement and viable disease cannot be reliably distinguished). There is developing evidence that the LR-TR categories are accurate for predicting viable tumor after locoregional therapy [12–14]. However, the association of these categories with clinical outcomes (e.g., overall survival) is unknown. Overall survival (OS) is an important marker of clinical benefit of therapeutic interventions [15]. There is little published literature correlating the LR-TR categories with OS [16], and no evidence in relation to treatment with bland transarterial embolization (TAE) +/− ablation.
We hypothesized that pre- and post-treatment LI-RADS and mRECIST categories assigned before and after completion of locoregional therapy with TAE +/− ablation will be associated with OS in HCC patients. The purpose of this study was to evaluate the associations between pre-treatment LI-RADS diagnostic categories, post-treatment LR-TR categories, and mRECIST response categories with overall survival (OS) of patients with HCC who underwent TAE +/− ablation.
Materials and Methods
Patients
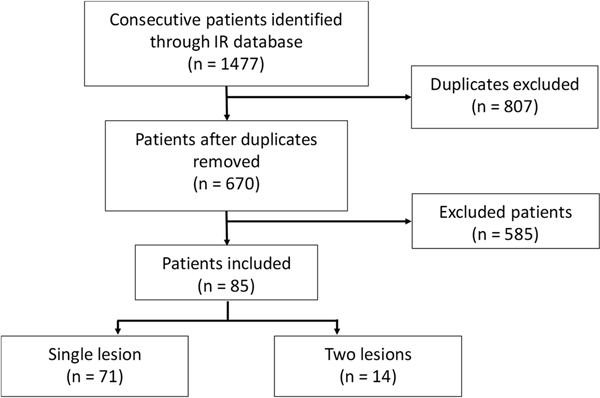
After obtaining institutional review board approval and waiver of written consent, a retrospective analysis of 1477 consecutive patients who underwent TAE from December 1, 2003, to December 31, 2017, was performed. This study was compliant with the United States Health Insurance Portability and Accountability Act and the 1975 Declaration of Helsinki.
A total of 85 patients with 99 total lesions were included (see Figure 1 for patient flowchart and Supplemental Table 1 in Online Resource 1 for patient numbers for each reason for exclusion). All patients had TAE, with some patients having additional microwave ablation, radiofrequency ablation, or percutaneous ethanol ablation, according to institutional preference.
Fig. 1.
Flowchart for study inclusion. (Abbreviations: IR, interventional radiology)
Patients were selected based on the following inclusion criteria: a) biopsy-confirmed HCC, or in the case of non-biopsied lesions, either an agreement by both readers or final arbitration in discrepant reads by a third reader with 10 years of post-fellowship experience as LR-5 or LR-Tumor in Vein (TIV); b) at most two lesions targeted by TAE, with the second lesion as either biopsy confirmed or LR-4/−5; and c) multiphasic CT (either 3- or 4-phase CT) within six months prior to TAE and within two months after the completion of TAE. Due to the retrospective nature of this study spanning 14 years, the indications for and modality of treatments were varied and based on multidisciplinary discussion and interventional radiologist discretion. In patients with disease in only one lobe, completion was after the first TAE; in patients with bilobar disease, completion was at the time of the second TAE. Demographics and survival data were derived from the electronic medical record.
Patients were excluded if they had: a) greater than two treated lesions; b) metastatic disease at baseline; c) previous percutaneous or surgical treatments; d) selective internal radiation therapy at the time of embolization; e) embolization for a reason other than HCC; f) a second active malignancy; or g) incomplete follow-up.
Image analysis
For each patient, the multiphasic CT immediately prior to treatment (pre-treatment CT) and the first multiphasic CT immediately following the treatment episode (post-treatment CT) were assessed. Due to the retrospective nature of this study, there was some heterogeneity of the CT acquisitions; however, all CTs met the inclusion and exclusion criteria described above. The date of each CT was recorded, and the lesion(s) were assessed by two radiologists who participate in the institution’s hepatobiliary tumor board (SK and ML, both with 11 years of post-fellowship experience and less than 1 year of experience applying LI-RADS in clinical reports). The radiologists (randomly assigned R1 and R2) were aware that each patient had undergone TAE for HCC but were blinded to clinical variables and outcomes.
Pre-treatment CTs were evaluated for LI-RADS category (version 2018), single greatest diameter of each observation, presence of non-rim arterial phase hyperenhancement, capsule, washout, and threshold growth. Post-treatment CTs were evaluated for LR-TR category (Viable, Equivocal, Nonviable, Nonevaluable), single greatest diameter, presence of non-rim arterial phase hyperenhancement, washout, and enhancement similar to pre-treatment. For patients with two treated lesions, a summary LR-TR category was determined (Nonviable if both lesions were assessed as Nonviable, Viable if either lesion was assessed as Viable, and Equivocal otherwise) and the post-treatment diameters were summed as a single measurement. Post-treatment CTs were also evaluated for mRECIST category (complete response, partial response, stable disease, progression of disease) based on the measurements of the viable tumor, as per the mRECIST algorithm.
Statistical analysis
The objectives of the statistical analysis were: 1) Evaluate the associations between survival endpoints and pre- and post-treatment assessments, including LI-RADS, LR-TR, and mRECIST categories, 2) Examine the inter-reader agreement in LR-TR categories.
Kaplan–Meier survival curves and cumulative incidence functions were generated to examine the survival and incidence experiences of the sample level with respect to OS. Univariable Cox proportional hazards regression was used to analyze OS. Baseline time for analyses involving pre-treatment variables was defined as date of first embolization. Baseline time for analyses involving post-treatment measurements was defined as end of treatment data, with the assumption that the response to treatment was immediate after TAE and remained stable until the follow-up scan (within 2 months of the last treatment). A significance level of p < 0.05 was used throughout.
Kendall’s Tau and Spearman rank correlation coefficients were used to examine the relationships between summary LR-TR categories and mRECIST categories for each reader. We used the kappa statistic and interclass correlation (ICC) to assess inter-reader agreement across pre- and post-treatment CT findings. All statistical computations were performed and all output generated using SAS Software Version 9.4 (The SAS Institute, Cary, NC) and R version 3.5.3.
Results
Patient characteristics
A total of 85 patients (median age 71 years; range 50–87) with 99 total lesions were included in the study (Figure 1). The majority of patients had a single lesion (n = 71, 84%). Patient characteristics are summarized in Table 1.
Table 1.
Patient characteristics
| Characteristic | N (%) |
|---|---|
| Sample size | 85 |
| Median age at embolization (range) | 71 (50–87) |
| Sex | |
| Male | 68 (80) |
| Female | 17 (20) |
| Biopsy | |
| Positive for HCC | 68 (80) |
| Inconclusive | 3 (3.5) |
| No biopsy | 14 (16.5) |
| Cause of liver disease | |
| Hepatitis B/C | 35 (41.1) |
| Alcohol | 26 (30.6) |
| Hemochromatosis | 3 (3.5) |
| NASH | 6(7.1) |
| Alpha-1-antitrypsin | 1 (1.1) |
| Primary biliary cirrhosis | 1 (1.1) |
| Other/unknown | 14 (16.4) |
| Laboratory data | |
| AFP (median (range)) | 9 (2–47652) |
| Bilirubin (median (range)) | 1 (0–4) |
| Albumin (median (range)) | 4 (1–6) |
| INR (median (range)) | 1 (1–3) |
| Child Pugh score | |
| A | 50 (58.8) |
| B | 19 (22.4) |
| C | 16 (18.9) |
| ECOG | |
| 0 | 55 (64.7) |
| 1 | 30 (35.3) |
| BCLC stage | |
| A0 | 5 (5.9) |
| B1 | 39 (45.9) |
| C2 | 15 (17.6) |
| D3 | 26 (30.6) |
Abbreviations: AFP, alpha-fetoprotein; BCLC, Barcelona Clinic Liver Cancer; ECOG, Eastern Cooperative Oncology Group; HCC, hepatocellular carcinoma; INR, international normalized ratio; NASH, nonalcoholic steatohepatitis
Of the 85 patients, 68 (80%) had at least one lesion which was biopsy-confirmed as HCC, 3 (4 %) had an inconclusive biopsy result and 14 (17 %) were not biopsied. Of the patients without biopsy confirmation, 12 (71%) patients were read as LR-5 and 2 (12%) as LR-TIV by both readers; in three discrepant reads, two were read as LR-TIV and one as LR-5 by the third reader.
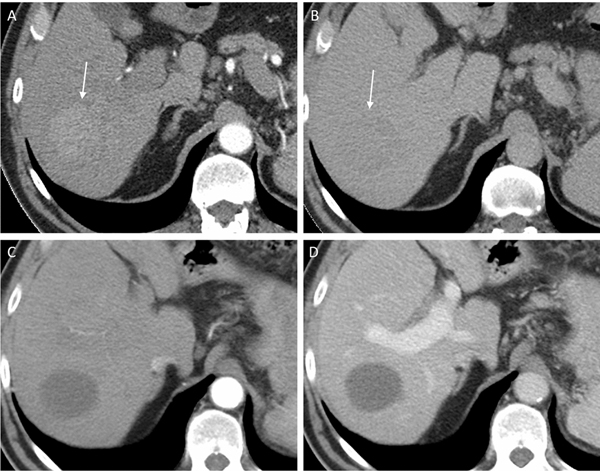
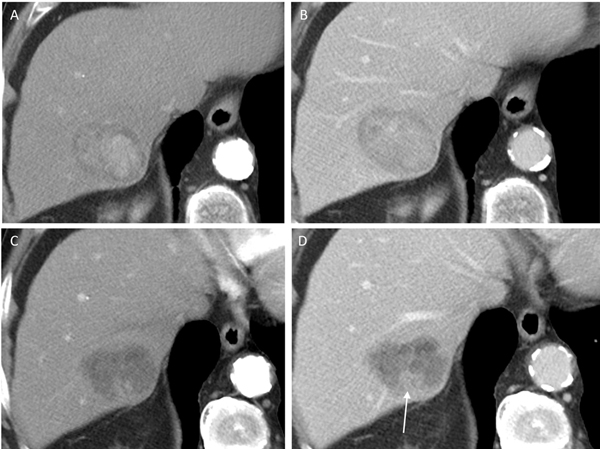
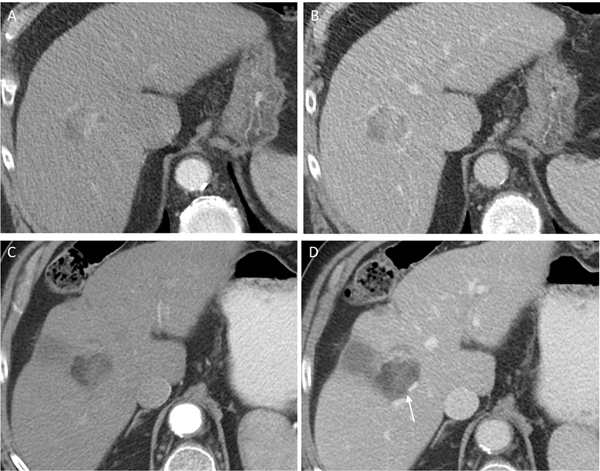
The majority of the patients had underlying liver disease caused by either Hepatitis B or C or alcohol (n = 61, 70%). All patients had an Eastern Cooperative Oncology Group (ECOG) score of 0 or 1, and the majority were of low Barcelona Clinic Liver Cancer (BCLC) stage and Child Pugh score. For reader 1 (R1), the summary LR-TR category was Nonviable for 50 patients (59%), Equivocal for 9 patients (11%), and Viable for 26 patients (31%). For reader 2 (R2), the summary LR-TR category was Nonviable for 37 patients (44%), Equivocal for 13 patients (15%), and Viable for 34 patients (40%), and Nonevaluable for one patient (1%). The majority of patients were treated with a single episode of TAE (72/85, 85%). Figures 2–4 are representative images of LR-TR Nonviable, LR-TR Equivocal, and LR-TR Viable, respectively.
Fig. 2.
77-year-old man with LR-5 observation (arrows) on pre-treatment CT showing (a) arterial phase hyperenhancement and (b) washout on delayed phase. Following the completion of treatment, the lesion was assessed as LR-TR Nonviable with no enhancement seen on the (c) arterial and (d) portal venous phases
Fig. 4.
79-year-old man with LR-5 observation on pre-treatment CT showing (a) arterial phase hyperenhancement and (b) washout. Post treatment, the lesion was assessed as LR-TR Viable with no arterial phase hyperenhancement on arterial phase (c), but nodular washout on portal venous phase (arrow) (d)
Survival analysis
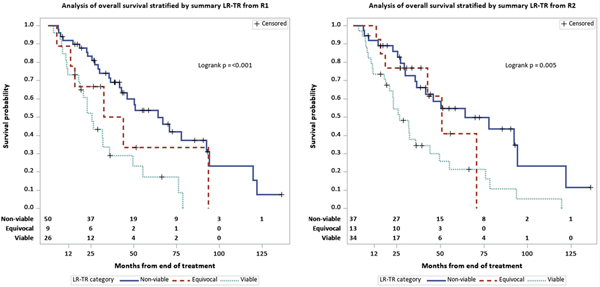
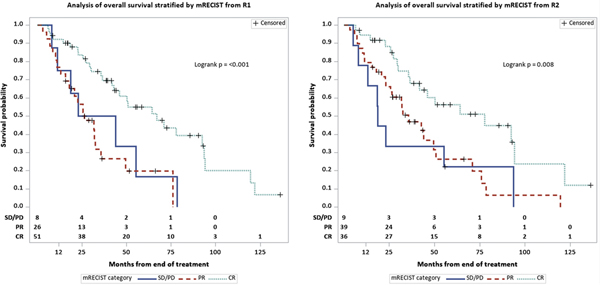
At the last follow-up, 54/85 (64%) patients had died. Median follow up was 38.8 months (range 8.42– 11.36). OS characteristics are summarized in Table 2, including a median OS from first embolization of 43.9 months (95% CI: 33.9–66.9). Kaplan–Meier curve representation of OS were generated for each reader for both LR-TR categories (Figure 5) and mRECIST categories (Figure 6).
Table 2.
OS and cumulative incidence estimates by outcome and reader
| Stratum | Estimate | Reader | |
|---|---|---|---|
| R1 | R2 | ||
| Non-viable | Median survival in months (95% CI) | 64.21 (42.71–92.45) | 64.21 (36.30–94.09) |
| 12-month survival (95% CI) | 0.92 (0.84–1.00) | 0.92 (0.83-NR) | |
| 36-month survival (95% CI) | 0.71 (0.58–0.85) | 0.69 (0.53–0.85) | |
| Equivocal | Median survival in months (95% CI) | 38.15 (15.58–93.60) | 50.73 (42.71–70.82) |
| 12-month survival (95% CI) | 0.89 (0.68-NR) | 1.00 (NR-NR) | |
| 36-month survival (95% CI) | 0.50 (0.13–0.87) | 0.77 (0.54–1.00) | |
| Viable | Median survival in months (95% CI) | 25.64 (18.58–35.70) | 26.43 (20.68–43.92) |
| 12-month survival (95% CI) | 0.73 (0.56–0.90) | 0.74 (0.59–0.88) | |
| 36-month survival (95% CI) | 0.29 (0.10–0.48) | 0.34 (0.18–0.51) | |
Abbreviations: NR, not reached
Fig. 5.
Kaplan–Meier curves of overall survival stratified by LR-TR categories for (a) R1 and (b) R2
Fig. 6.
Kaplan–Meier curves of overall survival stratified by mRECIST categories for (a) R1 and (b) R2
Pre-treatment findings and their associations with OS are summarized in Supplemental Table 2 in Online Resource 1. In terms of LI-RADS categories, LR-TIV was associated with a worse OS as opposed to LR-5 for both readers (R1: Hazard Ratio (HR) 3.7 (95% CI: 1.7–8.1); R2: HR 2.2 (95% CI: 1.1–4.9), p < 0.05). Pre-treatment tumor size was also associated with a worse OS for both readers (R1: HR 1.1 (95% CI: 1.0–1.2); R2: HR 1.1 (95% CI: 1.0–1.2), p < 0.05). For clinical (non-radiologic) variables, only higher alpha-fetoprotein was associated with worse OS (HR on log-transformed alpha-fetoprotein 1.7, 95% CI: 1.3–2.2 (p < 0.001) (Supplemental Table 3 in Online Resource 1).
Post-treatment findings and their associations with OS are summarized in Table 3. In terms of LR-TR categories, the median OS for patients with LR-TR Viable lesions was shorter at 25.7 (R1, 95% CI: 18.6–35.7) and 26.4 months (R2, 95% CI: 20.7–43.9), versus 38.2 (R1, 95% CI: 15.6–93.6) and 50.7 months (R2, 95% CI: 42.7–70.8) for patients with Equivocal lesions, and 64.2 months for both readers (R1: 95% CI: 42.7–92.5; R2: 95% CI: 36.3–94.1) for patients with Nonviable lesions. There was no significant difference in OS between patients with Equivocal and Nonviable lesions. Viable disease had a higher hazard of death when compared to Nonviable disease (HR: 3.0, 95% CI: 1.6–5.5). In terms of mRECIST categories, mRECIST nonresponders (stable disease or progression of disease) demonstrated a worse OS compared with complete responders (complete response) for both readers (R1: HR 2.6, 95% CI: 1.1–6.2; R2: HR 2.9, 95% CI: 1.3–6.9). Results for LR-TR and mRECIST categories did not change substantially when the baseline time was defined as the date of scan used to evaluate response. As with pre-treatment tumor size, post-treatment tumor size was also associated with OS for both readers (R1: HR 1.2, 95% CI: 1.1–1.2; R2: HR 1.1, 95% CI: 1.1–1.2) (p < 0.05) (Table 3). The following post-treatment variables were also associated with OS for both readers: Lesion 1 post-treatment non-rim arterial phase hyperenhancement, washout, and enhancement similar to pre-treatment.
Table 3.
Post-treatment measurement associations with overall by reader (time 0 = end of treatment date)
| Variable | R1 | R2 | ||||
|---|---|---|---|---|---|---|
| N(#Events) | HR (95% CI) | p-value | N(#Events) | HR (95% CI) | p-value | |
| PostTx total size | 85 (54) | 1.15 (1.07–1.24) | < 0.001 | 84 (53) | 1.13 (1.05–1.22) 0.002 | 0.002 |
| L1 PostTx APHE | 85 (54) | < 0.001 | 85 (54) | 0.001 | ||
| Present | 32 (25) | Ref. | 38 (28) | Ref. | ||
| Not present | 53 (29) | 0.36 (0.20–0.63) | 47 (26) | 0.38 (0.21–0.69) | ||
| L1 PostTx WO | 85 (54) | < 0.001 | 85 (54) | < 0.001 | ||
| Present | 22 (18) | Ref. | 30 (23) | Ref. | ||
| Not present | 63 (36) | 0.32 (0.18–0.57) | 55 (31) | 0.34 (0.19–0.60) | ||
| L1 PostTx ESTPT | 85 (54) | < 0.001 | 85 (54) | 0.002 | ||
| Not present | 57 (32) | Ref. | 51 (29) | Ref. | ||
| Present | 28 (22) | 2.78 (1.61–4.78) | 34 (25) | 2.43 (1.37–4.30) | ||
| L1 PostTx LR-TR category | 85 (54) | 0.001 | 84 (53) | 0.003 | ||
| Non-viable | 51 (28) | Ref. | 36 (18) | Ref. | ||
| Equivocal | 8 (5) | 2.47 (0.92–6.61) | 13 (6) | 1.40 (0.55–3.62) | ||
| Viable | 26 (21) | 3.08 (1.68–5.63) | 35 (29) | 2.81 (1.54–5.15) | ||
| L2 PostTx LR-TR category | 14 (8) | 0.38 | 14 (8) | 0.76 | ||
| Non-viable | 8 (4) | Ref. | 9 (5) | Ref. | ||
| Equivocal | 3 (2) | 1.55 (0.25–9.74) | 0.00 (0.00–.) | |||
| Viable | 3 (2) | 3.99 (0.58–27.59) | 4 (3) | 1.77 (0.38–8.17) | ||
| Summary PostTx LR-TR category | 85 (54) | 0.002 | 84 (53) | 0.006 | ||
| Non-viable | 50 (27) | Ref. | 37 (19) | Ref. | ||
| Equivocal | 9 (6) | 1.78 (0.73–4.38) | 13 (6) | 1.32 (0.52–3.39) | ||
| Viable | 26 (21) | 2.98 (1.64–5.45) | 34 (28) | 2.57 (1.41–4.67) | ||
Abbreviations: APHE, nonrim-like enhancement in the arterial phase; ESTPT, enhancement similar to pre-treatment; HR, Hazard Ratio; Tx, treatment; L1, lesion 1; L2, lesion 2; LR-TR, LI-RADS treatment response; WO, washout
Inter-reader agreement
Table 4 shows the inter-reader agreement results, where inter-reader agreement was moderate for pre-treatment LR categories (κ = 0.57, 95% CI: 0.35–0.78) and substantial for post-treatment LR-TR categories (κ = 0.68, 95% CI: 0.55–0.81). LR-TR post-treatment imaging features showed substantial agreement. Pre- and post-treatment size measurements showed excellent agreement (ICC = 0.97, 95% CI: 0.96–0.98, and ICC = 0.87, 95% CI: 0.81–0.91, respectively).
Table 4.
Inter-reader agreement
| Variable | Agreement statistics | Variable | Agreement statistics | ||
|---|---|---|---|---|---|
| L1 PreTx LI-RADS category | Weighted κ (95% CI) | 0.57 (0.35–0.78) | L1 LR-TR category | Weighted κ (95% CI) | 0.65 (0.51–0.78) |
| Percent agree | 83.5 | Percent agree | 74.1 | ||
| L1 PreTx APHEa | L1 PostTx APHE | Simple κ (95% CI) | 0.66 (0.5–0.82) | ||
| Percent agree | 92.9 | Percent agree | 83.5 | ||
| L1 PreTx TG | Simple κ (95% CI) | 0.5 (0.13–0.87) | L1 PostTx ESTPT | Simple κ (95% CI) | 0.65 (0.48–0.81) |
| Percent agree | 91.1 | Percent agree | 83.5 | ||
| L1 PreTx WO | Simple κ (95% CI) | 0.16 (−0.18 to 0.49) | L1 PostTx WO | Simple κ (95% CI) | 0.62 (0.44–0.79) |
| Percent agree | 90.6 | Percent agree | 83.5 | ||
| L1 PreTx capsule | Simple κ (95% CI) | 0.38 (0.18–0.59) | Summary PostTx LR-TR category | Weighted κ (95% CI) | 0.68 (0.55–0.81) |
| Percent agree | 72.9 | Percent agree | 75.3 | ||
| PreTx total size | ICC (95% CI) | 0.97 (0.96–0.98) | PostTx total size | ICC (95% CI) | 0.87 (0.81–0.91) |
| Limits of agreement | (−1.79 to 1.63) | Limits of agreement | (−2.91 to 3.24) | ||
κ could not be computed because there was no variation in this variable for R1.
Abbreviations: APHE, nonrim-like enhancement in the arterial phase; CPE, Concordance Probability Estimate; HR, Hazard Ratio; TG, threshold growth; Tx, treatment; LR-TR; LI- RADS treatment response; WO, washout
Discussion
In patients with HCC lesions treated with transarterial embolization, with or without ablation, we found that both pre-treatment LI-RADS categories as well as post-treatment LI-RADS treatment response (LR-TR) categories were associated with overall survival. mRECIST categories also showed associations with OS similar to LR-TR categories. On post-treatment CT imaging, the presence of measurable tumor with non-rim arterial phase hyperenhancement, washout, or enhancement similar to pre-treatment on post-treatment imaging were associated with poorer survival. Both pre- and post-treatment tumor size on CT imaging was also associated with overall survival.
Our findings that pre-treatment tumor size and LR-TIV were associated with OS are in line with the literature in which associations of pre-treatment tumor size and tumor in vein with OS have been well-documented previously [17,18]. For example, Lee at al. [18] demonstrated associations between tumor in vein and poor prognosis. We also found a strong association of alpha-fetoprotein with OS which was also in line with previous findings in the literature [19]. No other pre-treatment clinical variables predicted OS in our study.
The association of post-treatment features (non-rim arterial phase hyperenhancement, washout, or enhancement similar to pre-treatment) with OS is in line with multiple studies that have investigated the utility of mRECIST to assess OS. The utility of mRECIST is well established. A meta-analysis by Vincenzi et al. [14] in patients undergoing primarily transarterial chemoembolization showed that mRECIST criteria showed a strong prognostic value for OS in HCC patients undergoing loco-regional treatments. Similarly, Lencioni et al. showed that mRECIST could predict OS in those who received systemic therapy [8]. Our results demonstrated a strong association of LR-TR categories with OS on a per-lesion basis, similar to the mRECIST estimation of per-patient response. Given the overlap between the two criteria, further studies comparing mRECIST and LI-RADS treatment response are needed, as potential differences may include the lower specificity of mRECIST for residual disease [20]. As LR-TR categories are increasingly used in routine clinical practice, further validation of our results may be possible with minimal added effort.
Inter-reader agreement was substantial for post-treatment LR-TR categories and moderate for pre-treatment LI-RADS categories. While only two readers assessed response in this study, the substantial inter-reader agreement (κ = 0.68) for post-treatment LR-TR categories in our study is similar to those reported by Shropshire et al. [12] and Seo et al [13]. The moderate inter-reader agreement (κ = 0.57) for pre-treatment LI-RADS categories in our study was also similar to prior smaller studies of treatment response [12,13]. Moderate inter-reader agreement may be a consequence of the relatively recent introduction of the LR-TR categories and may improve with increased experience among radiologists over time. The potential for disagreement among radiologists highlights the need for discussion of challenging cases in a multidisciplinary setting.
Our study has a number of limitations, including its retrospective nature and the heterogeneity of treatments each patient received subsequent to the index embolization. In addition, we limited our analysis to patients with no more than two treated lesions, to avoid the complexity of identifying nontarget lesions when applying mRECIST. Similar approaches to limit the analysis to one or two lesions have been adopted in previous studies, e.g., in a study by Riaz et al. [5] to determine the effect of radioembolization on OS. Our study was also limited to bland TAE with or without ablation, and thus our results may not be generalizable for other locoregional therapies, such as transarterial chemoembolization (TACE) and transarterial radioembolization (TARE). The preference for TAE over transarterial chemoembolization was an institutional one [21]. While radioembolization is increasingly used at our institution, only a small fraction of patients have been treated with radioembolization, with limited follow-up, and thus these were not included by design. We used CT as the sole mode of imaging evaluation, both pre- and post-treatment; therefore, the results may not apply to LR-TR assessment in the post-treatment setting with MRI, which would need to be studied separately. Additionally, we did not have histopathologic confirmation of tumor response, as performed by other studies [12–14], as our patients did not undergo transplantation or liver resection following locoregional therapy. Consequently, the lack of available histopathologic correlate motivated our choice of OS as the primary endpoint of our study.
In conclusion, LI-RADS treatment response categories using CT assessment show a strong association with OS in HCC patients treated with bland transarterial embolization. However, further validation on the utility of LI-RADS treatment response categories as a surrogate endpoint for HCC patients is needed in larger multi-center studies, with both CT and MRI and with other locoregional therapies, including chemo- and radioembolization.
Supplementary Material
Fig. 3.
81-year-old man with LR-5 observation on pre-treatment CT showing (a) arterial phase hyperenhancement and (b) washout. Following the completion of treatment, the lesion was assessed as LR-TR Equivocal with irregular enhancement on (c) arterial and (d) portal venous phase (arrow). A new area of infarction is also seen peripherally
ACKNOWLEDGMENTS
We thank Joanne Chin for editorial assistance.
Funding: This research was funded in part through the NIH/NCI Cancer Center Support Grant P30 CA008748.
Footnotes
DECLARATIONS
Ethics approval: All procedures performed in studies involving human participants were in accordance with the ethical standards of the institutional and/or national research committee (institutional review board at Memorial Sloan Kettering cancer Center, IRB #18–370 and with the 1964 Helsinki declaration and its later amendments or comparable ethical standards. This article does not contain any studies with animals performed by any of the authors.
Consent to participate: For this type of study formal consent is not required.
Consent for publication: Not applicable.
Availability of data and material: The datasets used and/or analyzed during the current study are available from the corresponding author on reasonable request.
Conflicts of interest: The authors declare that they have no conflict of interest.
Publisher's Disclaimer: This Author Accepted Manuscript is a PDF file of an unedited peer-reviewed manuscript that has been accepted for publication but has not been copyedited or corrected. The official version of record that is published in the journal is kept up to date and so may therefore differ from this version.
REFERENCES
- 1.Bray F, Ferlay J, Soerjomataram I, Siegel RL, Torre LA, Jemal A (2018) Global cancer statistics 2018: GLOBOCAN estimates of incidence and mortality worldwide for 36 cancers in 185 countries. CA: a cancer journal for clinicians 68 (6):394–424. doi: 10.3322/caac.21492 [DOI] [PubMed] [Google Scholar]
- 2.Ferlay J, Soerjomataram I, Dikshit R, Eser S, Mathers C, Rebelo M, Parkin DM, Forman D, Bray F (2015) Cancer incidence and mortality worldwide: sources, methods and major patterns in GLOBOCAN 2012. International journal of cancer 136 (5):E359–386. doi: 10.1002/ijc.29210 [DOI] [PubMed] [Google Scholar]
- 3.Golabi P, Fazel S, Otgonsuren M, Sayiner M, Locklear CT, Younossi ZM (2017) Mortality assessment of patients with hepatocellular carcinoma according to underlying disease and treatment modalities. Medicine 96 (9):e5904. doi: 10.1097/md.0000000000005904 [DOI] [PMC free article] [PubMed] [Google Scholar]
- 4.Altekruse SF, McGlynn KA, Reichman ME (2009) Hepatocellular carcinoma incidence, mortality, and survival trends in the United States from 1975 to 2005. Journal of clinical oncology : official journal of the American Society of Clinical Oncology 27 (9):1485–1491. doi: 10.1200/jco.2008.20.7753 [DOI] [PMC free article] [PubMed] [Google Scholar]
- 5.Riaz A, Gabr A, Abouchaleh N, Ali R, Al Asadi A, Mora R, Kulik L, Desai K, Thornburg B, Mouli S, Hickey R, Miller FH, Yaghmai V, Ganger D, Lewandowski RJ, Salem R (2018) Radioembolization for hepatocellular carcinoma: Statistical confirmation of improved survival in responders by landmark analyses. Hepatology (Baltimore, Md) 67 (3):873–883. doi: 10.1002/hep.29480 [DOI] [PubMed] [Google Scholar]
- 6.Llovet JM, Real MI, Montana X, Planas R, Coll S, Aponte J, Ayuso C, Sala M, Muchart J, Sola R, Rodes J, Bruix J (2002) Arterial embolisation or chemoembolisation versus symptomatic treatment in patients with unresectable hepatocellular carcinoma: a randomised controlled trial. Lancet (London, England) 359 (9319):1734–1739. doi: 10.1016/s0140-6736(02)08649-x [DOI] [PubMed] [Google Scholar]
- 7.Kielar A, Fowler KJ, Lewis S, Yaghmai V, Miller FH, Yarmohammadi H, Kim C, Chernyak V, Yokoo T, Meyer J, Newton I, Do RK (2018) Locoregional therapies for hepatocellular carcinoma and the new LI-RADS treatment response algorithm. Abdominal radiology (New York) 43 (1):218–230. doi: 10.1007/s00261-017-1281-6 [DOI] [PMC free article] [PubMed] [Google Scholar]
- 8.Lencioni R, Montal R, Torres F, Park JW, Decaens T, Raoul JL, Kudo M, Chang C, Rios J, Boige V, Assenat E, Kang YK, Lim HY, Walters I, Llovet JM (2017) Objective response by mRECIST as a predictor and potential surrogate end-point of overall survival in advanced HCC. Journal of hepatology 66 (6):1166–1172. doi: 10.1016/j.jhep.2017.01.012 [DOI] [PubMed] [Google Scholar]
- 9.Lencioni R, Llovet JM (2010) Modified RECIST (mRECIST) assessment for hepatocellular carcinoma. Seminars in liver disease 30 (1):52–60. doi: 10.1055/s-0030-1247132 [DOI] [PubMed] [Google Scholar]
- 10.Elsayes KM, Hooker JC, Agrons MM, Kielar AZ, Tang A, Fowler KJ, Chernyak V, Bashir MR, Kono Y, Do RK, Mitchell DG, Kamaya A, Hecht EM, Sirlin CB (2017) 2017 Version of LI-RADS for CT and MR Imaging: An Update. Radiographics : a review publication of the Radiological Society of North America, Inc 37 (7):1994–2017. doi: 10.1148/rg.2017170098 [DOI] [PubMed] [Google Scholar]
- 11.American College of Radiology (ACR). Liver Imaging Reporting and Data System (LI-RADS). (2018). https://www.acr.org/Clinical-Resources/Reporting-and-Data-Systems/LI-RADS. Accessed May 9, 2019
- 12.Shropshire EL, Chaudhry M, Miller CM, Allen BC, Bozdogan E, Cardona DM, King LY, Janas GL, Do RK, Kim CY, Ronald J, Bashir MR (2019) LI-RADS Treatment Response Algorithm: Performance and Diagnostic Accuracy. Radiology 292 (1):226–234. doi: 10.1148/radiol.2019182135 [DOI] [PMC free article] [PubMed] [Google Scholar]
- 13.Seo N, Kim MS, Park MS, Choi JY, Do RKG, Han K, Kim MJ (2020) Evaluation of treatment response in hepatocellular carcinoma in the explanted liver with Liver Imaging Reporting and Data System version 2017. European radiology 30 (1):261–271. doi: 10.1007/s00330-019-06376-5 [DOI] [PMC free article] [PubMed] [Google Scholar]
- 14.Vincenzi B, Di Maio M, Silletta M, D’Onofrio L, Spoto C, Piccirillo MC, Daniele G, Comito F, Maci E, Bronte G, Russo A, Santini D, Perrone F, Tonini G (2015) Prognostic Relevance of Objective Response According to EASL Criteria and mRECIST Criteria in Hepatocellular Carcinoma Patients Treated with Loco-Regional Therapies: A Literature-Based Meta-Analysis. PloS one 10 (7):e0133488. doi: 10.1371/journal.pone.0133488 [DOI] [PMC free article] [PubMed] [Google Scholar]
- 15.Saad ED, Buyse M (2012) Overall survival: patient outcome, therapeutic objective, clinical trial end point, or public health measure? Journal of clinical oncology : official journal of the American Society of Clinical Oncology 30 (15):1750–1754. doi: 10.1200/jco.2011.38.6359 [DOI] [PubMed] [Google Scholar]
- 16.Zhang Y, Wang J, Li H, Zheng T, Jiang H, Li M, Song B (2020) Performance of LI-RADS version 2018 CT treatment response algorithm in tumor response evaluation and survival prediction of patients with single hepatocellular carcinoma after radiofrequency ablation. Annals of translational medicine 8 (6):388. doi: 10.21037/atm.2020.03.120 [DOI] [PMC free article] [PubMed] [Google Scholar]
- 17.Pawlik TM, Delman KA, Vauthey JN, Nagorney DM, Ng IO, Ikai I, Yamaoka Y, Belghiti J, Lauwers GY, Poon RT, Abdalla EK (2005) Tumor size predicts vascular invasion and histologic grade: Implications for selection of surgical treatment for hepatocellular carcinoma. Liver transplantation : official publication of the American Association for the Study of Liver Diseases and the International Liver Transplantation Society 11 (9):1086–1092. doi: 10.1002/lt.20472 [DOI] [PubMed] [Google Scholar]
- 18.Lee YH, Hsu CY, Huang YH, Hsia CY, Chiou YY, Su CW, Lin HC, Huo TI (2014) Vascular invasion in hepatocellular carcinoma: prevalence, determinants and prognostic impact. Journal of clinical gastroenterology 48 (8):734–741. doi: 10.1097/MCG.0b013e3182a8a254 [DOI] [PubMed] [Google Scholar]
- 19.Hameed B, Mehta N, Sapisochin G, Roberts JP, Yao FY (2014) Alpha-fetoprotein level > 1000 ng/mL as an exclusion criterion for liver transplantation in patients with hepatocellular carcinoma meeting the Milan criteria. Liver transplantation : official publication of the American Association for the Study of Liver Diseases and the International Liver Transplantation Society 20 (8):945–951. doi: 10.1002/lt.23904 [DOI] [PMC free article] [PubMed] [Google Scholar]
- 20.Kim SW, Joo I, Kim HC, Ahn SJ, Kang HJ, Jeon SK, Lee JM (2020) LI-RADS treatment response categorization on gadoxetic acid-enhanced MRI: diagnostic performance compared to mRECIST and added value of ancillary features. European radiology 30 (5):2861–2870. doi: 10.1007/s00330-019-066239 [DOI] [PubMed] [Google Scholar]
- 21.Brown KT, Do RK, Gonen M, Covey AM, Getrajdman GI, Sofocleous CT, Jarnagin WR, D’Angelica MI, Allen PJ, Erinjeri JP, Brody LA, O’Neill GP, Johnson KN, Garcia AR, Beattie C, Zhao B, Solomon SB, Schwartz LH, DeMatteo R, Abou-Alfa GK (2016) Randomized Trial of Hepatic Artery Embolization for Hepatocellular Carcinoma Using Doxorubicin-Eluting Microspheres Compared With Embolization With Microspheres Alone. Journal of clinical oncology : official journal of the American Society of Clinical Oncology 34 (17):2046–2053. doi: 10.1200/jco.2015.64.0821 [DOI] [PMC free article] [PubMed] [Google Scholar]
Associated Data
This section collects any data citations, data availability statements, or supplementary materials included in this article.


