

Abstract
Background:
Mouse models of abdominal aortic aneurysm (AAA) and dissection have proven to be invaluable in the advancement of diagnostics and therapeutics by providing a platform to decipher response variables that are elusive in human populations. One such model involves systemic Angiotensin II (Ang-II) infusion into low density-lipoprotein receptor-deficient (LDLr−/−) mice leading to intramural thrombus formation, inflammation, matrix degradation, dilation, and dissection. Despite its effectiveness, considerable experimental variability has been observed in AAAs taken from our Ang-II infused LDLr−/− mice (n=12) with obvious dissection occurring in 3 samples, outer bulge radii ranging from 0.73 to 2.12 mm, burst pressures ranging from 155 to 540 mmHg, and rupture location occurring 0.05 to 2.53 mm from the peak bulge location.
Objective:
We hypothesized that surface curvature, a fundamental measure of shape, could serve as a useful predictor of AAA failure at supra-physiological inflation pressures.
Methods:
To test this hypothesis, we fit well-known biquadratic surface patches to 360° micro-mechanical test data and used Spearman’s rank correlation (rho) to identify relationships between failure metrics and curvature indices.
Results:
We found the strongest associations between burst pressure and the maximum value of the first principal curvature (rho=−0.591, p-val=0.061), the maximum value of Mean curvature (rho=−0.545, p-val=0.087), and local values of Mean curvature at the burst location (rho=−0.864, p-val=0.001) with only the latter significant after Bonferroni correction. Additionally, the surface profile at failure was predominantly convex and hyperbolic (saddle-shaped) as indicated by a negative sign in the Gaussian curvature. Findings reiterate the importance of shape in experimental models of AAA.
Keywords: Mouse Models of Aortopathy, Differential Geometry, Curvature
INTRODUCTION
Abdominal aortic aneurysms (AAA) are life-threatening conditions with diverse etiologies all characterized by a 1.5-fold increase in maximum wall diameter [1-3]. AAAs are a persistent clinical challenge, as interventional risks must outweigh those of rupture, yet decision criteria are based predominantly on only a few measurable geometric parameters, namely aneurysm size and growth rate. These criteria are backed by large cohort studies with a theoretical basis rooted in the Law of Laplace, yet AAAs have complex surfaces limiting the applicable assumptions of this equation [4, 5]. Furthermore, many small AAAs fail unexpectedly before interventional criteria are met therefore it is important to comprehensively understand the roles of more complex, functionally deterministic biomechanical factors, including higher-order descriptions of local vessel geometry [6-12]. Of these, surface curvatures have been identified as having a major role in the biomechanics of AAAs [5, 13-15]. Curvature is a fundamental measure of surface shape, with the first and second principal curvatures representing the maxima and minima values at a point [16]. The Mean and Gaussian curvatures provide additional scalar rotationally-invariant information about the shape of these surfaces [16]. Using a membrane approach, surface curvatures have a direct impact on the orientation and complexity of wall stress distributions for a given load [5, 17, 18]. Overall, the role of surface curvatures in the clinical assessment of AAAs is an emerging field [5, 13, 14, 17, 19, 20], while understanding of the role and scalability of curvatures in animal models of AAAs are limited [13, 21].
Due to the high mortality rates associated with AAA and their prevalence within human populations, numerous animal models have been developed to study the progression of AAAs and dissection [22]. These models provide a viable option to test the material properties of AAAs with in vitro techniques enabling the direct measurement of burst location and pressures under supra-physiological loading [23]. To specifically test the role of surface curvature on failure, we generated aortopathic conditions using Angiotensin-II (Ang-II) infusion of low density-lipoprotein receptor-deficient (LDLr −/−) mice on a high-fat diet. This well-studied model captures many of the features of the human condition but is not prone to spontaneous rupture and unlike the human condition, is normally one of dissection occurring proximal to the renal arteries [22, 24-26]. A false lumen, intramural thrombus, and medial elastin damage; all factors contributing to asymmetrical abdominal aortic aneurysm phenotypes [22, 24, 27-31], henceforth collectively referred to in this manuscript as AAAs. Our study used supra-physiological pressures causing AAAs to rupture in an in vitro setting so that the precise magnitude and location could be recorded using a 360° mechanical test rig with contrast dye. Within the context of a differential geometry framework, profiles of AAAs were recorded, digitized, and fit to well-known “biquadratic” functions serving as continuous surface patches [5, 32]. Global size indices were identified and various curvature indices were found locally (at the burst location but prior to burst) and globally for these surfaces with Spearman’s rank correlation used to determine if trends exist between these indices and burst pressure and/or burst location. The purpose of these experiments and analysis was to better understand the complex relationship between AAA shape, in terms of surface curvatures, and supraphysiologic rupture-potential.
METHODS
Tissue Processing
Two-month-old LDLr−/− mice (n=12) on a C57BL/6 background were implanted with an Ang-II pump (Alzet model 2004, 1,000ng/kg/min) and given high cholesterol and saturated fat diet for 4 wks as described in [33]. The Ang-II pump was removed, and animals were left to stabilize for another 2 wks before sacrifice. A C57BL/6 (n=1) without an Ang-II pump on a normal diet served as a single control but was not used in the regression analysis. All animal procedures were approved by the Clemson University Institutional Animal Care and Use Committee (IACUC). Mouse aortas were harvested at Clemson University and transported to the University of South Carolina in EDTA-free-protease-inhibitor-cocktail on ice overnight. All vessels were pressure tested within 24 hours of animal sacrifice.
Prior to mounting, aortas were cleaned of loose perivascular tissue and branches were ligated using nylon suture. Throughout processing and testing, the vessels remained fully hydrated in phosphate-buffered saline (PBS). The proximal and distal ends were cannulated on 26-gauge needle tips using 7/0 suture and mounted to our multi-axial murine aneurysm mechanical testing device using a single camera setup. Additional details for a stereo version of our multi-axial device can be found in [34]. Vessels then underwent three-cycles of preconditioning via quasi-static pressurization to 120 mmHg and axial stretch to 1.2. Air bubbles were flushed from the system through a bleed-port and replaced with PBS containing phenol red to serve as a marker of burst location. The image profiles of inflated and extended intact vessels were recorded every 45 degrees at a single sub-physiological burst pressure of 20 mmHg to generate intact surface profiles well below rupture thresholds (Figure 1). AAAs were maintained at an axial stretch of 1.2 and then pressurized at a rate of 1-3 mmHg/s until failure. Preliminary experimentation revealed a nearly force invariant pressurization for AAAs at this axial stretch ratio without out-of-plane bending and/or buckling. The control vessel, however, was held at a 1.5 axial stretch ratio. We considered material failure to occur where the PBS containing phenyl-red leaked from the medial layer of the vessel wall into the PBS bath without phenyl-red. Upon bursting, the camera was again revolved to identify the precise location of failure based on the stream of red dye in the bath. The corresponding (peak) pressure was recorded as burst pressure (BP) and its location in the digital image measured in terms of rotational angle and axial position. The peak bulge location was found and the Euclidean distance (ED) represents a straight line between the burst and maximum bulge locations.
Figure 1.
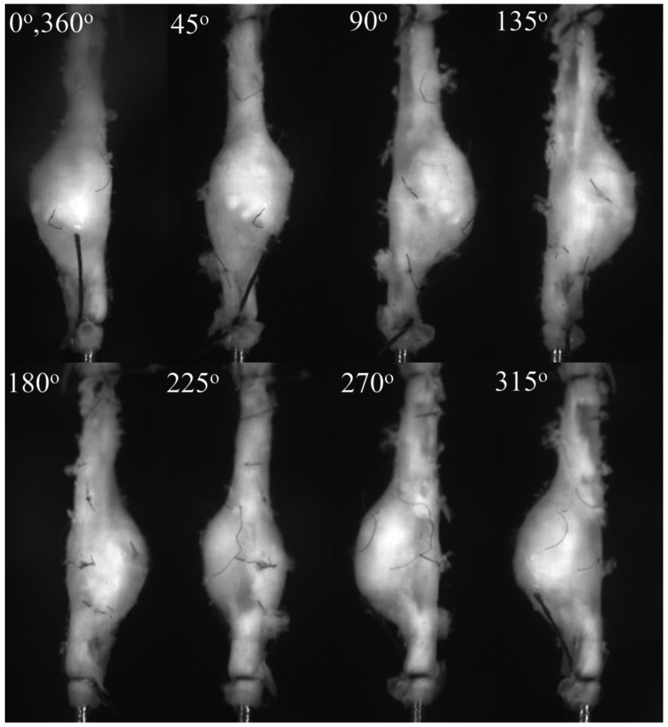
Video microscope images of the surface of a cannulated, pressurized, and axially extended mouse (Mouse 11) abdominal aortic aneurysm (AAA) submerged in a physiological solution at each rotational position (φ). AAAs with or without visible dissection were generated using an Angiotensin II (Ang-II) infusion pump on a low density-lipoprotein receptor-deficient (LDLr−/−) mouse.
Image and Surface Analysis
Images obtained from all eight rotational views (Figure 1) were processed using a custom-written Matlab script used to align the central axis and to estimate the edge coordinates including the base of all branches. Conversion of the pixel-to-mm length was based on the known diameter of the 26-gauge needle (0.460 mm) included in each image as calibration. The spatial coordinates of roughly 100 points located along the rightmost side of the AAA from each image were generated and aligned using this script and exported for surface fitting (Figure 2).
Figure 2.

Digitized profiles of the images shown in Figure 1 and a fully reconstructed mouse AAA (Mouse 11) using biquadratic surface patches.
To fit data to a surface, we defined a 3 x 3 set of nodes centered around p and performed a linear transformation so that p → p' and its surrounding nodes relocated to the origin of the global x-y-z frame with a local u-v tangent plane and normal n. Here, eu, ev, and en describe orthogonal unit vectors along the axis of the local plane (Figure 3). Likewise, the inverse transformation provides a mapping of the patched surface back to the global reference frame.
Figure 3.

A biquadratic surface patch (■) from 9 points (×) described in the global x-y-z (magenta) and local (blue) u-v-n tangent planes. eu, ev, and en are orthogonal unit vectors along the axis of the local plane. The directions of the first e1 and second e2 principal curvatures for this surface are shown. All dimensions are in mm.
Assuming the aneurysmal surface is both smooth and continuous, a biquadratic surface patch of the following form is fit to the local u-v tangent plane using [5, 32],
| (1) |
with a, b, c, d, e, f representing constants identified through a least-squares error minimization identified with the built-in Matlab function “fit” for this custom surface. To promote interface continuity while minimizing fitting errors, surfaces were systematically reconstructed from a quadrant of the moving 3 x 3 node-set. Since surface curvatures involve only second derivatives, the coefficients d, e, and f can be neglected from (1) leaving only the reduced form (see also [32]):
| (2) |
The Gauss-Weingarten map is the Hessian matrix related to equation (2) describing the local curvature of a function of many variables and for this surface is given as
| (3) |
The magnitudes and directions of the first (k1) and second (k2) principal surface curvatures can be calculated from the eigenvalues and eigenvectors of (3), namely:
| (4) |
and their normalized orthogonal vector directions for a ≥ c
| (5) |
and for a < c
| (6) |
Then the Mean and Gaussian curvatures are easily calculated using
| (7) |
and
| (8) |
with the sign of M and G determining the local shape of the surface. To demonstrate continuity in the first and second principal curvature for the course 3D surface plots, an adaptive moving average smoothing method was used around each 9-element window of the colorimetric curvature data used for plotting.
Size Indices
All features analyzed in this study were measured from the outer surface of an inflated and axially extended tissue sample. The AAA peak bulge radius R was measured from the axial centerline of a specimen along with the parent (healthy) vessel radius rp. From these measurements, the dilation ratio was calculated from
| (9) |
Since vessels are considered aneurysmal when δ > 1.5, the length and rotational angle of the aneurysmal tissue where the radius exceeds this critical value was quantified as L and C respectively with the latter being referred to as the “circumferential extent.” The aneurysm length to radius ratio was then calculated from
| (10) |
and axial asymmetry defined as [35],
| (11) |
where rmin is the minimum radius found anywhere along the length of the vessel.
Histology
A single Ang-II infused LDLr−/− mouse aorta, not included elsewhere in this study, was mounted within our multi-axial murine aneurysm mechanical testing device and underwent three-cycles of physiological preconditioning before being extended to an axial stretch of 1.2 and perfused with 4% paraformaldehyde at 100 mmHg for 4 hours to prevent luminal collapse upon unloading. The segment was then removed and marked with black India ink to aid in the orientation of histological sections. The specimen was oriented vertically along its axial direction and embedded in Optimal Cutting Temperature (OCT) compound for cryostat sectioning. Serial sections (5 μm) were cut and stained with Hematoxylin & Eosin (H&E). Images were acquired on an EVOS FL Auto 2 microscope at 20x magnification.
Statistics
Non-parametric two-tailed Spearman’s rank correlation (rho) was used to find associations between the size or curvature index and BP or ED. Statistical significance was initially considered at a level of p-val < 0.1. Although the use of higher p-val can lead to a higher probability of Type I error, it was included to reveal potential trends in our exploratory data. To account for the problem of multiple comparisons, however, Bonferroni correction was used so that the desired significance was divided by the number of hypotheses being tested (i.e., geometric or curvature indices) [36]. After Bonferroni correction with 18 indices used comparison, significance was considered at p-val < 0.006. Significance is reported with or without Bonferroni correction. Control vessels were not included in the calculation of rho.
RESULTS
AAAs were successfully generated in twelve LDLr−/− mice with roughly half exhibiting multiple bulges that were typically found around branching points. One of the twelve vessels was excluded from the analysis due to premature failure at a ligation point. The remaining eleven and a single control were analyzed for burst, size, and shape metrics. Experimental burst pressures range from 155 to 540 mmHg with a mean value of 299.8 ± 111.9 mmHg. The single control vessel failed at 545 mmHg (Table 1) which was close to our prior work where we found the average burst pressure using 4 healthy controls to be 567 mmHg [33]. Only two of the vessels (Mouse 5 & 9; Table 1) failed at or near the peak bulge location with most vessels failing along the necking portion. This resulted in a maximum and average bulge-to-burst ED of 2.53 mm and 1.29 ± 0.90 mm, respectively. No vessels that failed near the cannula ligation point were included in the analysis. Using the visual inspection techniques described in the methods section, a dissection (leak between layers) was observed in only three of the samples tested.
Table 1.
Burst pressure magnitude and the bulge-to-burst Euclidean distance for each mouse AAA sample used in this study. The control vessel was not included in average or standard deviation calculations.
| Mouse # | Burst Pressure (mmHg) |
Bulge-to-Burst Euclidean Distance (mm) |
Notes |
|---|---|---|---|
| - | 545 | - | Control |
| 1 | 225 | 0.789 | |
| 2 | 160 | 1.541 | |
| 3 | 240 | 1.622 | |
| 4 | 383 | 1.302 | |
| 5 | 540 | 0.081 | Dissection |
| 6 | 155 | 0.922 | |
| 7 | 308 | 2.530 | Dissection |
| 8 | 343 | 0.544 | |
| 9 | 380 | 0.047 | |
| 10 | 252 | 2.395 | Dissection |
| 11 | 312 | 2.427 | |
| avg | 299.8 | 1.291 | |
| std | 111.9 | 0.904 |
Reconstructed outer surfaces recapitulated the diversity of AAA phenotypes used in our study and likewise the variations in burst location (Figure 4). All surface fitting algorithms converged with average root-mean-squared fitting errors of 0.003 ± 0.001 mm. Through the calculation of k1 and k2, and subsequently, M and G, local features were found that reveal both concave and convex profiles on the surface of these AAAs. These features, in terms of k1 and k2, are shown for a specimen with medium burst pressure in Figure 5 and include a randomly applied grouping of principal vectors superimposed on their respective surfaces. Principal vector direction histograms illustrate a peak commonly observed around 90 degrees (with respect to the vessel’s axial direction) suggesting a largely circumferential orientation of the first principal curvature (Figure 6). However, a second but much smaller peak was observed between 0 and 45 degrees suggesting that the principal direction can change in the proximity of these AAAs. As expected, the second principal curvature vectors were predominantly orthogonal to the first and experienced similar patterns in distribution but with slight differences appearing due to binning within the histogram.
Figure 4.

All reconstructed mouse AAAs fitted using a biquadratic surface patch illustrate a diverse morphology. Surfaces were measured at common sub-physiologic pressures and reconstructions cropped at proximal and distal ends to avoid cannulation effects on surface curvatures. A white hexagonal star with a red border indicates the burst location with the view facing the burst.
Figure 5.

3D colormaps of the values of (a) the first k1 and (b) the second k2 principal curvatures for a vessel with a medium burst pressure (Mouse 10). Randomly dispersed direction vectors of the first (e1 and second (e2) principal curvatures are shown for each surface patch. The view is facing the peak bulge location.
Figure 6.

The probability density function (pdf) of the angle (φ) formed by the first (blue) and second (red) principal vector directions with the z-axis for each of the mouse AAAs shown in Figure 4.
The Mean (Figure 7) and Gaussian (Figure 8) curvatures are illustrated for specimens experiencing high, medium, and low burst pressures. Features are shown as 3D colormaps and 2D contour plots on the normalized θ–z plane so that reconstructions show the entire specimen surface. Each of these specimens shown in this figure have a burst location occurring in a positive Mean and negative Gaussian curvature. The sample with the lowest burst pressure (Mouse 2) also had diverse surface topography as indicated by the patchwork coloring in the 2D plane.
Figure 7.

Mean curvatures using (top) 3D colormaps and (bottom) 2D contour plots with normalized axial (z/z*) and circumferential (θ/θ*) positions for AAAs with (left) high, (middle) medium, and (right) low burst pressures. The peak bulge location is in the center 3D surface and the dotted line indicates a common position on both 2D and 3D images. A white hexagonal star with a red border indicates the burst location.
Figure 8.

Gaussian curvatures using (top) 3D colormaps and (bottom) 2D contour plots with normalized axial (z/z*) and circumferential (θ/θ*) positions for AAAs with (left) high, (middle) medium, and (right) low burst pressures. The peak bulge location is in the center of the 3D surface and the dotted line indicates a common position in both 2D and 3D. A white hexagonal star with a red border indicates the burst location.
The mean and standard deviation for all AAA size (at the bulge location) and spatially averaged curvature indices are reported in Table 2. AAAs were generally long and asymmetrical and had dilation ratios above the 1.5-fold threshold required for aneurysm classification. The high standard deviations present indicate considerable specimen-to-specimen variation despite similar experimental conditions. High Mean curvatures indicate sharp surfaces while positive Mean curvatures and negative Gaussian curvatures indicate predominantly hyperbolic convex surfaces. High standard deviations in the Gaussian curvature suggest a rapidly changing AAA surface, hypothetical values for an idealized cylinder, sphere, and saddle shape are also given to aid in comparison to these common shapes. Such shapes are often used as assumptions in the analysis of AAAs. Overall, this table provides a benchmark for the magnitude and sign of metrics relevant to burst pressure.
Table 2.
Description and examples of size and curvature indices for an idealized convex cylinder, sphere, or saddle shape each with radius r. Spatial mean and standard deviation (STD) for all vessels used in our study (n=11).
| Idealized Shape (Convex§) | Mouse AAA | ||||
|---|---|---|---|---|---|
| Index | Description | Cylinder | Sphere | Saddle | Mean ± STD |
| Size Indices | |||||
| R | Maximum Radius (mm) | r | r | r | 1.131 ± 0.41 |
| L | Length (mm) | - | - | - | 4.026 ± 1.57 |
| C | Circumferential Extent (Deg) | - | - | - | 260.7 ± 45.5 |
| δ | Dilation ratio (..) | 1 | 1 | - | 3.723 ± 0.73 |
| α | Length-to-radius ratio (..) | - | - | - | 3.147 ± 0.86 |
| β | Axial Asymmetry (..) | 1 | 1 | 1 | 0.296 ± 0.10 |
| Curvature Indices | |||||
| k1 | First Principal Curvature (mm−1) | 1/r | 1/r | 1/r | 2.855 ± 0.64 |
| k2 | Second Principal Curvature (mm−1) | 0 | 1/r | −1/r | −0.651 ± 0.55 |
| M | Mean Curvature§ (mm−1) |
1/(2r) | 1/r | 0 | 1.102 ± 0.27 |
| G | Gaussian Curvature (mm−2) | 0 | 1/r2 | −1/r2 | −2.034 ± 1.97 |
Mean curvature sign is positive indicating concave surface
Using the non-parametric Spearman’s rank without Bonferroni correction (Table 3), only L (rho = 0.491, p-val = 0.065) was found to correlate with ED but R (rho = 0.387, p-val = 0.119) and δ (rho = 0.410, p-val = 0.105) both have borderline associations. No size indices correlated with burst pressure but both α (rho = 0.496, p-val = 0.120) and β (rho = 0.460, p-val = 0.154) trended towards positive relationships. The spatial maximum values of k1 (rho = −0.591, p-val = 0.061) and M (rho = −0.545, p-val = 0.087), as well as the local value of M (rho = −0.864, p-val = 0.001) at the burst location were found to have an inverse relationship with BP. The local value of M was the only variable found to be statistically significant with burst pressure after Bonferroni correction. Table 3 suggests that the maximum values of k1 and M, and the local values of M are inversely related to the sample’s burst pressure. Therefore, a scatter plot of k1,max, Mmax, and Mlocal for individual samples with BP is shown in Figure 9. In all but one sample, the burst occurred on a surface with negative Gaussian curvature indicating a hyperbolic and convex surface profile (Table 4). Other surface descriptions are included in Table 4 for comparison.
Table 3.
Non-parametric Spearman’s rank coefficients for the magnitude of burst pressure (BP) or the Bulge-to-Burst Euclidean Distance (ED) with size or curvature indices for mouse AAAs used in this study. Size indices are maximum values while curvature indices include the spatial maximum, spatial average, or local value at the burst location. The heatmap indicates the direction and magnitude of the trends with * and ** denoting statistical significance at p < 0.1 and after Bonferroni correction at p < 0.006, respectively.
| Spearman's Rho | |||||
|---|---|---|---|---|---|
| (BP) | (ED) | ||||
| Size Indices | R | −0.319 | 0.387 | ||
| L | 0.273 | 0.491 | * | ||
| C | 0.365 | 0.151 | |||
| δ | −0.246 | 0.410 | |||
| α | 0.497 | 0.169 | |||
| β | 0.460 | −0.173 | |||
| Curvature Indices | Maximum | ||||
| k1 | −0.591 | * | −0.155 | ||
| k2 | −0.464 | −0.373 | |||
| M | −0.545 | * | −0.164 | ||
| G | −0.491 | −0.373 | |||
| Averaged | |||||
| k1 | −0.245 | −0.491 | |||
| k2 | 0.445 | 0.191 | |||
| M | 0.155 | −0.445 | |||
| G | 0.455 | 0.209 | |||
| Local | |||||
| k1 | −0.427 | 0.155 | |||
| k2 | −0.127 | 0.218 | |||
| M | −0.864 | ** | 0.309 | ||
| G | 0.136 | 0.318 | |||
Figure 9.

Trends and confidence intervals for (left) first principal curvature, (middle) maximum Mean curvature, and (right) local Mean curvature with burst pressure (BP). Maximum and local Mean curvatures were found to have a statistically significant inverse relationship with BP as assessed using Spearman’s rank correlation (Table 3). Specimen numbers illustrated here (×) correspond with the order of Table 1 & Figure 4.
Table 4.
Description of surfaces with different Mean and Gaussian curvatures. The number (n) of AAA samples with local (burst) characteristics are given for each surface.
| M > 0 | M < 0 | M = 0 | |
|---|---|---|---|
| G > 0 | n=1; control Elliptical (convex) |
n=0 Elliptical (concave) |
n=0 Not possible |
| G < 0 | n=10 Hyperbolic (convex) |
n=0 Hyperbolic (concave) |
n=0 Hyperbolic |
| G = 0 | n=0 Cylindrical (convex) |
n=0 Cylindrical (concave) |
n=0 Planar |
An illustrative example of the rupture process recorded in dissecting and non-dissecting AAAs are shown in Figure 10 a & b respectively. Accumulation of PBS containing phenyl-red provided excellent contrast in dissecting samples when both the intimal and medial layers were breached and colored PBS reached the adventitial layer. Such was not the case, or was not visible, in the non-dissecting samples. Although the precise burst pressure was recorded for each sample, the pressure of the post-burst state in Figure 10 a & b is unknown. FI&E stained cross-sections from the parent vessel to the peak bulge location of a non-ruptured sample reinforced the dissecting pathology and further highlighted the heterogeneity commonly observed in these samples (Figure 11). The histological figure also showed considerable extra-cellular matrix damage, elastin fragmentation, and intramural thrombus.
Figure 10.

Video microscope images of AAAs (a,c) before and (b,d) after supra-physiological pressurization to rupture illustrating (a,b) a partial dissection (Mouse 5) and (c,d) rupture without dissection (Mouse 6).
Figure 11.

Progressive cross-sections of an aorta from a single Ang-II infused LDLr−/− mouse that did not undergo burst pressure testing. Sections were extended and pressure fixed and then stained with Hematoxylin & Eosin (H&E) to illustrate (blue/purple) cell nuclei and (pink) cytoplasm and extracellular matrix. In this sample, a perivascular layer of black India ink was applied regionally to help with orientation during sectioning. Illustrative results show considerable extra-cellular matrix damage, elastin fragmentation, and heterogenous composition including a false lumen and intramural thrombus.
DISCUSSION
Aortic aneurysms take on complex geometries making the ability to predict clinical outcomes difficult. Extracting certain geometric features and their derived quantities, however, may provide insight into the rupture potential of AAAs. Using an Ang-II infused LDLr−/− mouse model we were able to consistently generate stable AAAs but with diverse phenotypes. Inflation to supra-physiological pressures induced failure in terms of rupture, but failure occurred at different inflation pressures and at different locations. Through the careful recording of rupture information and surface properties prior to rupture, our tests revealed three important findings: (1) failure rarely occurred at the peak bulge location, (2) the bulge diameter and/or dilation had little influence on burst pressures, and (3) the maximum and local values of the Mean and the sign of the Gaussian curvature have predictive value for AAA rupture in a murine model.
These findings support important biomechanical studies that have emerged over the last 25 years suggesting that radii alone are poor predictors for AAA outcomes. The idea that AAA shape may be just as important as the peak bulge radius was the focus of early works of Elger et al. [17] who showed that rupture risk, in terms of peak stress in axisymmetric fusiform aneurysms, depends on shape with stress concentrations occurring near inflection points. Yamada and Hasegawa revealed similar analytical findings in bilaterally symmetric AAAs [37]. Contemporary research has since incorporated finite element analysis to further decipher the important relationships between mechanics and shape [14, 20, 38] with many investigations now using curvature as an independent metric in their analysis [5, 13-15]. For example, Lee et al. found measures of Gaussian and Mean surface curvatures, in terms of their nondimensional L2-norm, as important classifiers of AAA populations and rupture potential subgroups [13]. Area-averaged curvatures, on the other hand, are not sufficient to address important localized features [20]. Instead, changes in the sign of the Gaussian curvature can be used to identify regions of complex stress distributions [5]. In this investigation, we present an analysis of geometric factors on the outer surface of the vessel wall but do not link these to explicit mechanical properties or local wall stresses. Stress analysis requires additional information such as constitutive material behavior, boundary conditions, wall thicknesses, and loading conditions that were not within the scope of the current work [38].
Our findings suggest that the Mean curvature, even after Bonferroni correction, is a reasonable predictor of burst pressures but when taken together, the magnitude and sign of the Mean and Gaussian curvatures, respectively, are key factors in determining rupture potential. The specific surface that is most vulnerable to rupture is one of high Mean curvature and negative Gaussian curvature. Such a shape would be characterized as hyperbolic and convex, representing an inflection or saddle point on the surface. A general description of the shape of these and other common surfaces are included in Table 4. Although none of the size indices correlated directly with burst pressure, the length to radius ratio α and the asymmetry value β were close to reaching statistical significance and should not be ignored in future studies.
Many factors involved in the development of experimental murine AAAs can contribute to size and curvatures. Namely, the proximity to the spine, the branching segments, dissection, and the mechanism of AAA initiation (e.g., elastase perfusion, calcium chloride application, Ang-II infusion, genetic mutation) [22, 23, 27, 39]. In terms of focal weakening, microstructural damage has been observed along aortic branches in Ang-II infused Apolipoprotein E (ApoE) mice [40]. Similar areas with high curvatures such as around branches are notably weaker in our model. Regardless, the information contained exclusively on the surface of an AAA is useful but limited [33]. For example, AAAs have considerable material heterogeneity often including, calcification, necrotic material, and an uneven distribution of extra-cellular-matrix components that can contribute to failure [33, 41, 42]. These features generate an uneven wall thickness varying throughout the AAA [19]. Regardless, there is likely interplay between these measurable quantities and their role in AAA initiation and progression. Still, a consensus on which geometric properties should be used to evaluate AAAs is important to advancing prognosis and rupture risk stratification [36, 43-45].
In studies of murine aortic aneurysms, Goergen et al. used a scalar measure of geometric curvature and were able to relate AAA circumferential growth to curvature [21, 46]. To our knowledge, this was the first study of its kind to relate curvature to AAA outcomes in a mouse model with most prior work justifiably focused on human AAAs [5, 13-15]. Yet small animal models play an important role in understanding aneurysmal disease progression and amelioration [21, 22, 26, 33, 47]. Likewise, certain descriptors of vascular biomechanics scale well with animal size/weight [48-50]. The first, second, and Mean curvatures, on the other hand, contain units of 1/length (Gaussian curvatures 1/length2) thus it’s interesting to investigate how rodent studies (ID ~ 0.03 cm) translate to human (ID ~ 3.0 cm). The role of multiple curvature indices and their interaction, such as Mean and Gaussian curvatures, are crucial to elucidating and translating these studies between species.
Considerable research has focused on the Ang-II atherosclerosis prone model and the dissecting phenotype [28-31]. Although aortic dissection and aneurysm can be distinct with unique etiologies and outcomes, our study focused on animals that presented with the defining features of an aneurysm, namely a 1.5-fold increase in diameter (cf., Table 2). Our rudimentary analysis could only identify clear dissections in 3 of 11 samples when the phenyl-red media reached the adventitial layer (Figure 10a). Micro-dissection was also possible in other samples that did not reach visibility in the outer layer. It is also plausible that progressive dissection could be responsible for errors found in burst location. Although microscopy was not the purpose of our study, and more detailed studies would be needed to relate histological features to rupture potential, a single histological sample illustrates well the heterogeneity, damage, and dissection commonplace in the Ang-II infused LDLr−/− model (Figure 11). The presence of a false lumen, intraluminal thrombus, and the location of medial elastin breakage all contribute to material heterogeneity affecting the bulge/shape of our tissues and the analysis performed herein. As supraphysiological pressures are reached, these shape features can be more pronounced.
Given the fibrous outer surface of blood vessels, a limitation in our study pertains to the removal of perivascular material during the sample preparation process [51, 52]. We acknowledge that the dissection, cleaning, and branch ligation process may influence the location and magnitude of tissue failure. Through considerable experience using rodent and porcine models of vascular physiology and disease, any material that is easily removed with gentle tugging is considered perivascular (not adventitial) since small bridging fibers typically bind these layers together [33, 39, 53]. In humans, perivascular support, especially in rigid sections abutting the spine, could be deterministic in rupture outcomes. Unfortunately, these were not investigated in our current study therefore care must be taken in translating these approaches to human populations. Another limitation is the coarseness of data gathered in the circumferential direction due to physical imaging restrictions of these millimeter-scale tissues while submerged in a physiological media bath [34]. The errors that are introduced using our approach will be especially pronounced around imaging interfaces. Other studies using full-field imaging approaches with perivascular speckle-patterning have shown excellent spatial relationships for small mouse blood vessels and blood vessel analogs [28, 34, 54, 55]. Although our coarse-data limitation very likely influences estimates of local curvatures, it would have a diminished effect on global indices used in our study. This shortcoming also limited our analysis to biquadratic surface patching instead of the Biquintic Hermite Finite Element (BQFE) method with the advantage of using higher-order derivatives to fit surfaces without using numerous surface elements [56]. BQFE has been employed in the study of human AAAs [13, 14, 43] but can be unstable when data is sparse [56]. Still, more advanced imaging techniques such as micro-computed tomography could be used in the future to improve resolution. Likewise, other transgenic and surgical approaches to mouse AAA-generation should also be used to improve the robustness of this analysis with increased animal numbers needed to reach significant thresholds of key variables after Bonferroni correction.
In this study, we analyzed and compared various size and curvature indices to determine, for the first time, which had the strongest effect on the rupture potential of murine Ang-II infused LDLr−/− AAAs. We found that in terms of burst pressures a combination of Mean and Gaussian curvatures were the two most important features in the prediction of AAA rupture in mice and that material failure occurred on surfaces demonstrating convex-hyperbolic profile. Although our study was limited to the analysis of outer surfaces and to one type of aneurysm etiology, these emerging trends could provide a powerful tool in the diagnosis of AAAs and the evaluation of animal models used to explore treatment therapies.
Acknowledgments
The authors would like to acknowledge the statistical guidance provided by Dr. Jan M. Eberth, the conceptual contributions of Dr. Susan M. Lessner, and the technical assistance of Liya Du to this project.
Compliance with Ethical Standards
This work was supported by the National Institutes of Health under grant number R01HL133662. The authors have no competing conflicts of interest that could have influenced the findings of this paper. All animal procedures were approved by the Clemson University Institutional Animal Care and Use Committee (IACUC).
Footnotes
Publisher's Disclaimer: This Author Accepted Manuscript is a PDF file of a an unedited peer-reviewed manuscript that has been accepted for publication but has not been copyedited or corrected. The official version of record that is published in the journal is kept up to date and so may therefore differ from this version.
References
- 1.Weiford BC (2005) Braunwald’s Heart Disease: A Textbook of Cardiovascular Medicine. JAMA J. Am. Med. Assoc 294:376–376 [Google Scholar]
- 2.Elefteriades JA, Olin JW, Halperin JL (2011) Chapter 106. Diseases of the Aorta. In: Fuster V, Walsh RA, Harrington RA (eds) Hurst’s The Heart, 13e. The McGraw-Hill Companies, New York, NY [Google Scholar]
- 3.Mamkin I, Heitner JF (2011) Chapter 22. Diseases of the Aorta. In: Pahlm O, Wagner GS (eds) Multimodal Cardiovascular Imaging: Principles and Clinical Applications. The McGraw-Hill Companies, New York, NY [Google Scholar]
- 4.Vorp DA (2007) Biomechanics of Abdominal Aortic Aneurysm. J Biomech 40:1887–1902. 10.1016/j.jbiomech.2006.09.003 [DOI] [PMC free article] [PubMed] [Google Scholar]
- 5.Sacks MS, Vorp D a, Raghavan ML, et al. (1999) In vivo three-dimensional surface geometry of abdominal aortic aneurysms. Ann Biomed Eng 27:469–79 [DOI] [PubMed] [Google Scholar]
- 6.Nordon IM, Hinchliffe RJ, Loftus IM, Thompson MM (2011) Pathophysiology and epidemiology of abdominal aortic aneurysms. Nat Rev Cardiol 8:92–102. 10.1038/nrcardio.2010.180 [DOI] [PubMed] [Google Scholar]
- 7.Kent KC, Zwolak RM, Jaff MR, et al. (2004) Screening for abdominal aortic aneurysm: a consensus statement. J Vasc Surg 39:267–9. 10.1016/j.jvs.2003.08.019 [DOI] [PubMed] [Google Scholar]
- 8.Timaran CH, Veith FJ, Rosero EB, et al. (2007) Endovascular aortic aneurysm repair in patients with the highest risk and in-hospital mortality in the United States. Arch Surg 142:520–4; discussion 524-5. 10.1001/archsurg.142.6.520 [DOI] [PubMed] [Google Scholar]
- 9.Brady AR, Brown LC, Fowkes FGR, et al. (2002) Long-term outcomes of immediate repair compared with surveillance of small abdominal aortic aneurysms. N Engl J Med 346:1445–1452. 10.1056/NEJMoa013527 [DOI] [PubMed] [Google Scholar]
- 10.Koskas F, Kieffer E (1997) Long-term survival after elective repair of infrarenal abdominal aortic aneurysm: Results of a prospective multicentric study. Ann Vasc Surg 11:473–481 [DOI] [PubMed] [Google Scholar]
- 11.Lund GB, Trerotola SO, Scheel PJ (1995) Percutaneous translumbar inferior vena cava cannulation for hemodialysis. Am J Kidney Dis 25:732–737. 10.1016/0272-6386(95)90549-9 [DOI] [PubMed] [Google Scholar]
- 12.Dobrin PB (1989) Pathophysiology and pathogenesis of aortic aneurysms. Current concepts. Surg Clin North Am 69:687–703 [DOI] [PubMed] [Google Scholar]
- 13.Lee K, Zhu J, Shum J, et al. (2013) Surface curvature as a classifier of abdominal aortic aneurysms: A comparative analysis. Ann Biomed Eng 41:562–576. 10.1007/s10439-012-0691-4 [DOI] [PMC free article] [PubMed] [Google Scholar]
- 14.Urrutia J, Roy A, Raut SS, et al. (2018) Geometric surrogates of abdominal aortic aneurysm wall mechanics. Med Eng Phys 59:43–49. 10.1016/j.medengphy.2018.06.007 [DOI] [PMC free article] [PubMed] [Google Scholar]
- 15.Martufi G, Gasser TC, Appoo JJ, Di Martino ES (2014) Mechano-biology in the thoracic aortic aneurysm: a review and case study. Biomech Model Mechanobiol 13:917–928. 10.1007/s10237-014-0557-9 [DOI] [PubMed] [Google Scholar]
- 16.Gray A (1998) Modern Differential Geometry of Curves and Surfaces with Mathematica, Second Edition, Second. CRC Press, Boca Raton, FL [Google Scholar]
- 17.Elger DF, Blackketter DM, Budwig RS, Johansen KH (1996) The influence of shape on the stresses in model abdominal aortic aneurysms. J Biomech Eng 118:326–332. 10.1115/1.2796014 [DOI] [PubMed] [Google Scholar]
- 18.Humphrey JD (2002) Cardiovascular Solid Mechanics: Cells, Tissues, and Organs. Springer, New York, USA [Google Scholar]
- 19.Martufi G, Di Martino ES, Amon CH, et al. (2009) Three-dimensional geometrical characterization of abdominal aortic aneurysms: Image-based wall thickness distribution. J Biomech Eng 131:1–11. 10.1115/1.3127256 [DOI] [PubMed] [Google Scholar]
- 20.Shum J, Martufi G, Di Martino E, et al. (2011) Quantitative Assessment of Abdominal Aortic Aneurysm Geometry. Ann Biomed Eng 39:277–286. 10.1007/s10439-010-0175-3 [DOI] [PMC free article] [PubMed] [Google Scholar]
- 21.Goergen CJ, Barr KN, Huynh DT, et al. (2010) In vivo quantification of murine aortic cyclic strain, motion, and curvature: implications for abdominal aortic aneurysm growth. J Magn Reson Imaging 32:847–858. 10.1002/jmri.22331 [DOI] [PMC free article] [PubMed] [Google Scholar]
- 22.Daugherty A, Cassis LA (2004) Mouse models of abdominal aortic aneurysms. Arterioscler Thromb Vasc Biol 24:429–34. 10.1161/01.ATV.0000118013.72016.ea [DOI] [PubMed] [Google Scholar]
- 23.Lane BA, Wang X, Lessner SM, et al. (2020) Targeted Gold Nanoparticles as an Indicator of Mechanical Damage in an Elastase Model of Aortic Aneurysm. Ann Biomed Eng. 10.1007/s10439-020-02500-5 [DOI] [PMC free article] [PubMed] [Google Scholar]
- 24.Daugherty A, Manning MWW, Cassis LAA (2000) Angiotensin II promotes atherosclerotic lesions and aneurysms in apolipoprotein E-deficient mice. J Clin Invest 105:1605–1612. 10.1172/JCI7818 [DOI] [PMC free article] [PubMed] [Google Scholar]
- 25.Liu J, Sawada H, Howatt DA, et al. (2020) Hypercholesterolemia Accelerates Both the Initiation and Progression of Angiotensin II-induced Abdominal Aortic Aneurysms. Ann Vasc Med Res 6:1099. [PMC free article] [PubMed] [Google Scholar]
- 26.Cassis LA, Gupte M, Thayer S, et al. (2009) ANG II infusion promotes abdominal aortic aneurysms independent of increased blood pressure in hypercholesterolemic mice. Am J Physiol Circ Physiol 296:H1660–H1665. 10.1152/ajpheart.00028.2009 [DOI] [PMC free article] [PubMed] [Google Scholar]
- 27.Phillips EH, Yrineo AA, Schroeder HD, et al. (2015) Morphological and biomechanical differences in the elastase and AngII apoE −/− rodent models of abdominal aortic aneurysms. Biomed Res Int 2015:. 10.1155/2015/413189 [DOI] [PMC free article] [PubMed] [Google Scholar]
- 28.Bersi MR, Acosta Santamaría VA, Marback K, et al. (2020) Multimodality Imaging-Based Characterization of Regional Material Properties in a Murine Model of Aortic Dissection. Sci Rep 10:9244. 10.1038/s41598-020-65624-7 [DOI] [PMC free article] [PubMed] [Google Scholar]
- 29.Saraff K, Babamusta F, Cassis LA, Daugherty A (2003) Aortic dissection precedes formation of aneurysms and atherosclerosis in angiotensin II-infused, apolipoprotein E-deficient mice. Arterioscler Thromb Vasc Biol 23:1621–1626. 10.1161/01.ATV.0000085631.76095.64 [DOI] [PubMed] [Google Scholar]
- 30.Phillips EH, Lorch AH, Durkes AC, Goergen CJ (2018) Early pathological characterization of murine dissecting abdominal aortic aneurysms. APL Bioeng 2:046106. 10.1063/1.5053708 [DOI] [PMC free article] [PubMed] [Google Scholar]
- 31.Adelsperger AR, Phillips EH, Ibriga HS, et al. (2018) Development and growth trends in angiotensin II-induced murine dissecting abdominal aortic aneurysms. Physiol Rep 6:1–17. 10.14814/phy2.13668 [DOI] [PMC free article] [PubMed] [Google Scholar]
- 32.Sacks MS, Chuong CJ, Templeton GH, Peshock R (1993) In vivo 3-D reconstruction and geometric characterization of the right ventricular free wall. Ann Biomed Eng 21:263–275 [DOI] [PubMed] [Google Scholar]
- 33.Wang X, Lane BA, Eberth JF, et al. (2019) Gold nanoparticles that target degraded elastin improve imaging and rupture prediction in an AngII mediated mouse model of abdominal aortic aneurysm. Theranostics 9:4156–4167. 10.7150/thno.34441 [DOI] [PMC free article] [PubMed] [Google Scholar]
- 34.Lane BA, Lessner SM, Vyavahare NR, et al. (2020) Null strain analysis of submerged aneurysm analogues using a novel 3D stereomicroscopy device. Comput Methods Biomech Biomed Engin 23:332–344. 10.1080/10255842.2020.1724974 [DOI] [PMC free article] [PubMed] [Google Scholar]
- 35.Vorp DA, Raghavan ML, Webster MW (1998) Mechanical wall stress in abdominal aortic aneurysm: influence of diameter and asymmetry. J Vasc Surg 27:632–639 [DOI] [PubMed] [Google Scholar]
- 36.Chauhan SS, Gutierrez CA, Thirugnanasambandam M, et al. (2017) The association between geometry and wall stress in emergently repaired abdominal aortic aneurysms. Ann Biomed Eng 45:1908–1916 [DOI] [PMC free article] [PubMed] [Google Scholar]
- 37.Yamada H, Hasegawa Y (2007) A simple method of estimating the stress acting on a bilaterally symmetric abdominal aortic aneurysm. Comput Methods Biomech Biomed Engin 10:53–61. 10.1080/10255840601086531 [DOI] [PubMed] [Google Scholar]
- 38.Azar D, Ohadi D, Rachev A, et al. (2018) Mechanical and geometrical determinants of wall stress in abdominal aortic aneurysms: A computational study. PLoS One 13:. 10.1371/journal.pone.0192032 [DOI] [PMC free article] [PubMed] [Google Scholar]
- 39.Collins MJ, Eberth JF, Wilson E, Humphrey JD (2012) Acute mechanical effects of elastase on the infrarenal mouse aorta: implications for models of aneurysms. J Biomech 45:660–5. 10.1016/j.jbiomech.2011.12.013 [DOI] [PMC free article] [PubMed] [Google Scholar]
- 40.Aslanidou L, Ferraro M, Lovric G, et al. (2019) Co-localization of microstructural damage and excessive mechanical strain at aortic branches in angiotensin-II-infused mice. Biomech Model Mechanobiol 10.1007/s10237-019-01197-3 [DOI] [PubMed] [Google Scholar]
- 41.Vorp DA, Vande Geest JP (2005) Biomechanical determinants of abdominal aortic aneurysm rupture. Arterioscler Thromb Vasc Biol 25:1558–1566. 10.1161/01.ATV.0000174129.77391.55 [DOI] [PubMed] [Google Scholar]
- 42.Di Martino E, Mantero S, Inzoli F, et al. (1998) Biomechanics of abdominal aortic aneurysm in the presence of endoluminal thrombus: experimental characterisation and structural static computational analysis. Eur J Vasc Endovasc Surg 15:290–299 [DOI] [PubMed] [Google Scholar]
- 43.Parikh SA, Gomez R, Thirugnanasambandam M, et al. (2018) Decision tree based classification of abdominal aortic aneurysms using geometry quantification measures. Ann Biomed Eng 46:2135–2147 [DOI] [PMC free article] [PubMed] [Google Scholar]
- 44.Wu W, Rengarajan B, Thirugnanasambandam M, et al. (2019) Wall Stress and Geometry Measures in Electively Repaired Abdominal Aortic Aneurysms. Ann Biomed Eng 47:1611–1625 [DOI] [PMC free article] [PubMed] [Google Scholar]
- 45.Rengarajan B, Wu W, Wiedner C, et al. (2020) A Comparative Classification Analysis of Abdominal Aortic Aneurysms by Machine Learning Algorithms. Ann Biomed Eng 1–11 [DOI] [PMC free article] [PubMed] [Google Scholar]
- 46.Goergen CJ, Azuma J, Barr KN, et al. (2011) Influences of aortic motion and curvature on vessel expansion in murine experimental aneurysms. Arterioscler Thromb Vasc Biol 31:270–279. 10.1161/ATVBAHA.110.216481 [DOI] [PMC free article] [PubMed] [Google Scholar]
- 47.Collins MJ, Bersi M, Wilson E, Humphrey JD (2011) Mechanical properties of suprarenal and infrarenal abdominal aorta: implications for mouse models of aneurysms. Med Eng Phys 33:1262–9. 10.1016/j.medengphy.2011.06.003 [DOI] [PMC free article] [PubMed] [Google Scholar]
- 48.Prim DA, Mohamed MA, Lane BA, et al. (2018) Comparative mechanics of diverse mammalian carotid arteries. PLoS One 13:e0202123. [DOI] [PMC free article] [PubMed] [Google Scholar]
- 49.Cox RH (1978) Passive mechanics and connective tissue composition of canine arteries. Am J Physiol 234:H533–41 [DOI] [PubMed] [Google Scholar]
- 50.Goergen CJ, Johnson BL, Greve JM, et al. (2007) Increased anterior abdominal aortic wall motion: Possible role in aneurysm pathogenesis and design of endovascular devices. J Endovasc Ther 14:574–584. 10.1583/1545-1550(2007)14[574:IAAAWM]2.0.CO;2 [DOI] [PubMed] [Google Scholar]
- 51.Zhou B, Alshareef M, Prim DA, et al. (2016) The perivascular environment along the vertebral artery governs segment-specific structural and mechanical properties. Acta Biomater 45:286–295. [DOI] [PMC free article] [PubMed] [Google Scholar]
- 52.Watson S, Liu P, Peña EA, et al. (2016) Comparison of Aortic Collagen Fiber Angle Distribution in Mouse Models of Atherosclerosis Using Second-Harmonic Generation (SHG) Microscopy. Microsc Microanal 22:55–62. 10.1017/S1431927615015585 [DOI] [PMC free article] [PubMed] [Google Scholar]
- 53.Zhou B, Prim DA, Romito EJ, et al. (2018) Contractile Smooth Muscle and Active Stress Generation in Porcine Common Carotids. J Biomech Eng 140:014501. 10.1115/1.4037949 [DOI] [PMC free article] [PubMed] [Google Scholar]
- 54.Genovese K, Collins M, Lee Y, Humphrey JD (2012) Regional Finite Strains in an Angiotensin-II Induced Mouse Model of Dissecting Abdominal Aortic Aneurysms. Cardiovasc Eng Technol 3:194–202 [Google Scholar]
- 55.Bersi MR, Bellini C, Di Achille P, et al. (2016) Novel Methodology for Characterizing Regional Variations in the Material Properties of Murine Aortas. J Biomech Eng 138:71005–71015 [DOI] [PMC free article] [PubMed] [Google Scholar]
- 56.Smith DB, Sacks MS, Vorp DA, Thornton M (2000) Surface geometric analysis of anatomic structures using biquintic finite element interpolation. Ann Biomed Eng 28:598–611. 10.1114/1.1306342 [DOI] [PubMed] [Google Scholar]