

Abstract
The synthesis quality of artificial inorganic nanocrystals is most often assessed by transmission electron microscopy (TEM) for which high-throughput advances have dramatically increased both the quantity and information richness of metal nanoparticle (mNP) characterization. Existing automated data analysis algorithms of TEM mNP images generally adopt a supervised approach, requiring a significant effort in human preparation of labeled data that reduces objectivity, efficiency, and generalizability. We have developed an unsupervised algorithm AutoDetect-mNP for automated analysis of TEM images that objectively extracts morphological information on convex mNPs from TEM images based on their shape attributes, requiring little to no human input in the process. The performance of AutoDetect-mNP is tested on two data sets of bright field TEM images of Au nanoparticles with different shapes and further extended to palladium nanocubes and cadmium selenide quantum dots, demonstrating that the algorithm is quantitatively reliable and can thus serve as a generalizable measure of the morphology distributions of any mNP synthesis. The AutoDetect-mNP algorithm will aid in future developments of high-throughput characterization of mNPs and the future advent of time-resolved TEM studies that can investigate reaction mechanisms of mNP synthesis and reactivity.
Keywords: transmission electron microscopy, nanoparticles, machine learning, unsupervised learning, image analysis
Introduction
The shape attributes of a metal nanoparticle (mNP) determine many of its physical, chemical, and functional properties, including plasmonic behavior,1−4 catalytic efficiency,5−8 and biological activity.9,10 Significant research effort has focused on developing methods for the shape-controlled synthesis of mNPs, and an accurate and efficient method for their characterization has been indispensable for the success achieved by these studies.11−18 To date, transmission electron microscopy (TEM) remains the most reliable and widely used method for characterizing the morphology of NPs, for which rapid advancement in automated high-throughput electron microscopy has drastically increased both the acquisition rate and the quality of TEM data.19−22 Increased efficiency in TEM data acquisition now enables the scale of NP shape characterization to increase from tens or hundreds of particles to orders of magnitude more, extracting information at the level of more informative statistical distributions. The information from TEM data at such a scale far exceeds the capability of a human analyst, and hence, the development of automated methods for TEM image analysis is imperative.
An ideal algorithm for the automated analysis of TEM images should be able to perform two tasks: particle detection, which includes identification and segmentation of particles of interest, and information extraction, which generally involves the characterization of the shapes of the particles based on their attributes such as aspect ratios and other attributes. A variety of robust algorithms have been developed to perform automated particle detection.21,23−31 However, many existing algorithms analyzed all the detected particles without differentiation or classification of their shape and shape attributes.21,23,24 Such an approach may be acceptable when analyzing homogeneous samples with the aim of quantifying simple metrics such as average particle sizes. However, the assumption of homogeneity is subjective and far from universally applicable. By taking the assumption of homogeneity, other potentially important information may be missed, including the presence of unexpected side products, or the relative populations of different competing products, which may be lost without detailed automated classification of particle shapes. Existing algorithms capable of classifying the particles based on their shapes have thus far adopted supervised approaches, requiring the user to predefine expected categories or shapes of particles.25,26,29,30 While showing outstanding performances for the NP systems they were trained on, these supervised algorithms could be found to be at significant disadvantages when applied to previously unexplored NP systems where little a priori knowledge of the shape distributions are available. With the recent development of automated high-throughput screening and discovery of NPs along with the emergence of the idea of autonomous research in material sciences,32−34 the need for an algorithm capable of analyzing previously unexplored NP systems becomes more and more pressing. To address such a need, an unsupervised TEM data analysis algorithm requiring minimum human input and a priori knowledge of the systems analyzed is required. To our best knowledge, there has not been an unsupervised algorithm capable of analyzing TEM images without significant human input or presumptions.
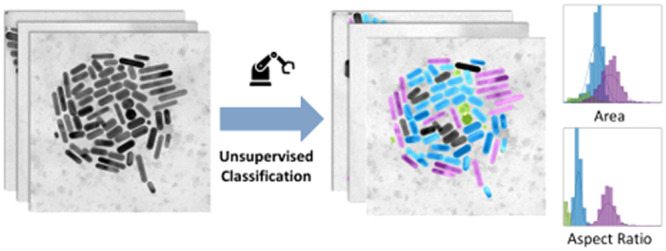
Here, we develop an unsupervised algorithm for the analysis of TEM images and the classification of particle shapes for mNPs, requiring minimum human input in the process (Figure 1). We demonstrate the quantitative reliability of the AutoDetect-mNP algorithm and its potential to serve as an unbiased, general method for the characterization of the shape distributions of nanoparticles using two data sets of gold nanoparticles (AuNPs) with different shapes comprised of short and long rods and triangular prisms. AuNPs have been studied extensively by TEM, and protocols for their synthesis with controlled sizes and shapes are well established,12,15−17,35−39 making them ideal candidates for demonstration of the strengths of the unsupervised algorithm. Furthermore, while shape-controlled synthesis of AuNPs have been extensively reported in the literature, a generalizable quantitative method for the characterization of the shape distribution of these particles on a statistical scale beyond manual analysis of TEM images has yet to be established.12,15−17,35−38 AutoDetect-mNP is capable of processing thousands of particles from over a hundred TEM images in a matter of minutes, extracting morphological descriptors for convex Au nanoparticles and classifying the particles without the need of human intervention, thus greatly increasing the generalizability and efficiency of the process. Application of AutoDetect-mNP to more challenging NP systems beyond AuNPs have also been demonstrated. In the future, AutoDetect-mNP can serve as a general and unbiased metric for reporting shape and shape attribute distributions of mNPs using TEM or other image acquisition strategies and will play an important role in the future development of automated platforms for high-throughput mNP synthesis and time-resolved TEM characterization of mNP reactivity.
Figure 1.

Scheme of the AutoDetect-mNP algorithm. The algorithm can be divided into four parts: particle detection, feature extraction, filtering and resolution of irregularly shaped particles, and classification of particle shapes.
Results and Discussion
AutoDetect-mNP Algorithm
Our goal is to develop an unsupervised algorithm capable of achieving four tasks in an automated manner for mNP particle classification. The components of our algorithm are individual mNP detection, feature extraction of particle shape attributes, the resolution and filtering out of overlapping particles, and finally shape classification and the analysis of their distributions that are interpretable from their features.
Particle detection of mNP requires the segmentation of the foreground from the background of the TEM images and, thus, the isolation of individual particle from the segmented image. A vast library of image segmentation and object detection methods have been established in the existing literature in the computer vision community.40 We chose to use simple traditional computer vision methods rather than the more advanced deep learning based methods that have attracted much research interest recently, primarily for the reason that the more advanced algorithms are based on a predefined collection of objects to be recognized, which do not fit to our unsupervised setting which wishes to avoid labeling and predetermined biases in the data. Since TEM images of Au NPs typically show a sharp contrast between the foreground and background, well-developed algorithms reported in the previous literature generally show satisfactory performance.25 In this study, K-means image segmentation has proven to be sufficient for this step. It is of note that the performance of K-means image segmentation can be dependent on the resolution and contrasts of the TEM images. Users of AutoDetect-mNP may choose to replace K-means image segmentation with image segmentation methods that perform the best on their data set. Six shape descriptors are used to distinguish the mNPs that are segmented from the images: solidity, convexity, area, eccentricity, aspect ratio, and circularity.25,41−44
The first two descriptors are important for cleaning the data set for mNP detection by measuring the degree of convexity of the particles. Since a TEM image can only capture the 2D projections of 3D particles, overlapping particles will appear as the union of their projections. Additionally, particle detection can sometimes fail to render the complete edges of certain particles or identify contamination on TEM sample grids as particles. Fortunately, overlapping and incorrectly detected particles often have nonconvex shapes, allowing them to be easily differentiated from correctly detected mNPs, which typically have convex shapes. In this work, we apply a filter based on solidity and convexity to separate nonconvex particles from correctly detected convex particles. A particle with solidity <0.9 or convexity <0.95 is considered nonconvex. Nonconvex particles are analyzed and resolved by the ultimate erosion of convex shapes (UECS) algorithm reported by Park et al.30 Although we only quantify convex mNPs in this work, which represent a significant proportion of widely studied mNPs, future research efforts can use a similar algorithm and different descriptors to extend the application of the algorithm to nonconvex NPs.
Particles that pass the solidity and convexity filter are then classified based on the four geometrical shape descriptors. The classification process consists of two unsupervised steps: K-means clustering followed by naive Bayes classification. This general approach of unsupervised classification based on geometric descriptors ensures that it can be naturally extended to any convex NP systems. Data points were divided into K classes, assuming features in each class follow a normal distribution. Each data point was then assigned to the class that maximizes the joint probability of all the features belonging to that class. In a standard implementation of K-means clustering and naive Bayes classifier, the number of classes, K, needs to be predefined by the user. To increase the generalizability of our algorithm, we use the Pmax metric to automatically determine the optimal K for each individual data set. For each data set, matrix P(K) is defined as a function of the number of classes, K, such that
, where Pij is the element on the ith row and jth column of P(K), pi(x) is the likelihood of data point x belonging to class i, and xi denotes data points assigned to class i. Maximum entropy Pmax(K) is then defined as the maximum of the off-diagonal elements of P(K). The optimal K is then selected as the value of K that minimizes Pmax(K).
The largest difference between our work and existing works on identifying and classifying NPs from TEM images25,26,29,30 is that we proposed a completely unsupervised approach to cluster and classify extracted particle shapes from their features, without any need of predefining the number of shape classes beforehand, neither do we require any human labeling on the data set at all. We believe the ability to perform completely unsupervised classification is an important strength of our algorithm, since it enables us to detect unexpected synthetic byproducts in a reaction, or analyze the shapes of nanoparticles in a hierarchical structure, as we have discussed and illustrated in this study.
Au Nanorods
To confirm the reliability of the AutoDect-mNP algorithm, we first analyzed TEM images of two pure Au nanorod samples, each with a different aspect ratio of ∼5 (long rods) and ∼2 (short rods), the synthesis of which was previously reported by Ye et al.37 The algorithm yields statistical results on the pure nanorod samples that consistently show nanorods with their known aspect ratios with narrow size and shape distributions as shown in Figures 2 (short rods) and S1 (long rods). However, we also found a non-negligible amount of spheroidal impurities present in both samples. Due to the relatively low concentrations of these nanorod samples, it is unlikely that these spheroidal particles are Au nanorods standing on their tips. We note that the presence of spheroidal impurities during the synthesis of Au nanorods has been previously observed,11,17,37 and the amount of impurities are typically estimated by optical spectroscopy or visual inspection of a few electron microscopic images,12,16,17,35−37 which is both time-consuming and prone to human biases. AutoDetect-mNP determines the impurities of the Au nanorods to be 15% in long rods and 5% in short rods. This shows that the algorithm can potentially serve as a quantitative method for the objective determination of impurity content of a mNP synthesis.
Figure 2.

Detection and classification of Au NPs of different morphologies in short rods. (a) Maximum entropy as a function of the number of classes in which K = 2 was found to be the optimal number of classes. (b, c) Montages of sample particle shapes in each class. (d–f) Classification results denoted by colors overlaid onto original TEM images of Au nanorods (green spheroids, blue short rods). (g–j) Four features used for classification and Gaussian distributions for each class, with classification results denoted by colors. Counts normalized by total number of particles.
Next we examined the accuracy of the algorithm on a sample with a known 1:1 mixture composition of two Au nanorods with different aspect ratios, determined from spectroscopic measurement of their colloidal concentrations using computed extinction coefficients.37 The performance of AutoDetect-mNP on the nanorod mixture is shown in Figure 3 in which it automatically identifies three classes among all the recognized particles as long rods, short rods, and spheroids. Visual inspection of the distributions of the shape descriptors (Figure 3h–k) shows that, similar to the cases of the pure rods (Figures 2g–j and S1g–j), the most prominent distinctions differentiating the three classes are seen in aspect ratio and circularity. To test the quantitative performance of the algorithm, the numbers of detected particles in each class were counted for the mixture sample and compared to the two pure nanorod samples (Table S1). We find that the composition of the nanorod mixture sample is calculated to be 45% long rods and 55% short rods, which matches the spectroscopically determined 1:1 ratio between the two samples reasonably well.
Figure 3.

Classification results of a 1:1 mixture of Au nanorods with different aspect ratios. (a) Maximum entropy as a function of the number of classes in which K = 3 was found to be the optimal number of classes. (b–d) Montages of sample particle shapes in each class. (e–g) Sample TEM images of the mixture with classification results denoted by color (purple long rods, green spheroids, blue short rods). (h–k) Four features used for classification and Gaussian distributions for each class, with classification results denoted by colors. Counts normalized by total number of particles.
The performance of AutoDetect-mNP was also compared to two previous methods25,30 on classifying particles from a set of 20 images randomly selected from the nanorod mixture data set, and the results are provided in Table 1. The ground truth was determined independently by three human experts who were asked to classify the particles into three predefined classes: long rods, short rods, and spheroids. Our algorithm was the only one that could differentiate between long rods and short rods, in comparison to all existing algorithms that have only defined a general rod class. This results amplifies the advantage of our algorithm as an unsupervised approach, since we do not predefine any classes, and the algorithm is capable of differentiating different groups of NPs given that they are statistically different. Even though refs (26) and (31) have defined the classes of NPs, the error between particle counts reported by these two algorithms and the ground truth are still significantly higher than AutoDetect-mNP. We found our algorithm to only have 5%–15% of error compared to the ground truth values for each category of NPs and the total count, which is accurate enough for extracting meaningful feature distributions from the recognized NP collections. Furthermore, we also found our algorithm to run significantly faster than the two other algorithms, which enables our method to run on larger data sets and, when analyzing images with high resolution, avoid the loss of information due to image compression.
Table 1. Comparison of the Counts for Recognized NPs from TEM Images and Execution Time between Methods.
| method | ref (26)a | ref (31)b | this work | ground truth (mean ± std) |
|---|---|---|---|---|
| triangles | 0 | 157 | 0 | 0 |
| rectangles | 0 | 2 | 0 | 0 |
| short rods | 443 | 463 ± 16 | ||
| long rods | 329 | 369 ± 12 | ||
| rods | 85 | 489 | 772 | 832 ± 23 |
| spheroids | 543 | 846 | 88 | 77 ± 11 |
| total | 628 | 1494 | 860 | 915 ± 25 |
| time (min)c | 51.4 | 172.9 | 8.1 |
Results were filtered based on particle area >12.5 nm2 to exclude noise points from the background that were erroneously recognized as particles.
The algorithm was operated on the data set with half resolution (2048 × 2048) to accelerate execution.
All tests performed on a machine with an Intel Core i7-8700K CPU @ 3.70 GHz and 16 GB of memory.
Au Triangular Prisms
After validating the performance of the algorithm on an artificially constructed data set, we demonstrate the potential of AutoDetect-mNP for characterizing and quantifying mNPs for a synthesis of Au triangular prisms as reported by Jones et al.38 We chose Au triangular prisms since they show a relatively high variation in shapes from the synthesis.11,15,38,45 From the 114 TEM images collected for the product, the AutoDetect-mNP algorithm identified two classes from the detected particles: a class of triangular particles (Figure 4b) and a class of rod-shaped impurities (Figure 4c). By visually inspecting the rod-shape impurities, it can be seen that a majority of the rod-shaped mNPs are in fact real impurities, with a much smaller population of artifacts originating from incorrectly detected particles (Figure 4c). We would like to point out that the relative population of the incorrectly detected particles is low enough that their presence would not influence the classification results on a statistical scale.
Figure 4.

Detection and classification of Au NPs of different morphologies in a sample of triangular prisms. (a) Maximum entropy as a function of the number of classes in which K = 2 was found to be the optimal number of classes. (b, c) Montages of sample particle shapes in each class. (d–f) Classification results denoted by colors overlaid onto original TEM images of Au nanorods (green triangular particles, blue rod-shaped impurities). (g–j) Four features used for classification and Gaussian distributions for each class, with classification results denoted by colors. Counts normalized by total number of particles.
While the two classes identified by the algorithm show clear distinctions,
further inspection of the class of triangular particles (Figure 4b) reveals that there
is significant intraclass variations within the triangular particles,
as evident from the non-Gaussian distributions of the features (Figure 4g–j).To quantify
the distinctiveness of the two classes, we evaluate the average cross
entropy from information theory, where the average cross entropy between
two distributions p and q is defined
as  , where N is the number
of elements in distribution p, and pi and qi represent the likelihood of the ith element of distribution p predicted by distribution p and q, respectively. H(p, q) quantifies the distinctiveness
between distribution p and distribution q: the larger H(p, q), the more distinct p is from q. Using this measure, the two classes identified from the triangular
prism sample are found to be much less distinct than the nanorod case.
This can be seen quantitatively by comparing the average cross entropy
with respect to the bulk distribution (Table S3). We hypothesize that the distinctions between the triangular particles
and rod-shaped impurities were so large that the possible presence
of intraclass variations among the triangular particles were weighted
to a lesser degree and thus not identified by the algorithm.
, where N is the number
of elements in distribution p, and pi and qi represent the likelihood of the ith element of distribution p predicted by distribution p and q, respectively. H(p, q) quantifies the distinctiveness
between distribution p and distribution q: the larger H(p, q), the more distinct p is from q. Using this measure, the two classes identified from the triangular
prism sample are found to be much less distinct than the nanorod case.
This can be seen quantitatively by comparing the average cross entropy
with respect to the bulk distribution (Table S3). We hypothesize that the distinctions between the triangular particles
and rod-shaped impurities were so large that the possible presence
of intraclass variations among the triangular particles were weighted
to a lesser degree and thus not identified by the algorithm.
To validate this idea, we applied the automatic classification of AutoDetect-mNP on the triangular particles alone in an attempt to further characterize the variations among these particles (Figure 5). The classification results showed that the triangular particles can indeed be further classified into three subclasses: triangles, symmetrically truncated triangles, and asymmetrically truncated triangles (Figure 5). Compared to the 2-class scenario (triangles and rod-shaped impurities) in the first iteration of classification, classifying the particles into four classes (triangles, symmetrically truncated triangles, asymmetrically truncated triangles, and rod-shaped impurities) in the second iteration significantly improved log-likelihood from 6.58 to 14.89, indicating that the second iteration of classification offered a more detailed and more reasonable classification of the particles in the data set. Upon applying more iterations of classification, the log-likelihood did not improve further, suggesting that there is no more significant intraclass variation to capture and that the algorithm has converged. Applying further iterations of classification on the class of rod-shaped impurities also did not improve the log-likelihood, suggesting that the class has little intraclass variation. In this case, the averaged cross entropy between subclasses are now sufficiently large such that these subclasses are quantifiably distinct from each other. Interestingly, inspection of the distributions of the shape descriptors for the three subclasses originated from the triangular shaped class (Figure 5) shows that none of the four shape descriptors can serve as a good differentiator for the three subclasses alone. However, by taking into account all four descriptors the algorithm was able to make a clear distinction between the three subclasses. This demonstrates the importance of using high-dimensional features for the classification of shapes.
Figure 5.

Further classification of the Au triangular prisms class. Distributions and relative population of particles in each class (red pure triangles, cyan symmetrically truncated triangles, yellow asymmetrically truncated triangles).
The AutoDetect-mNP refined classification of truncated triangular particles in TEM images of Au triangular prisms is supported by previous studies characterizing these particles at both bulk15,38,45−47 and single particle14,25,48 levels. However, Figure 5 also emphasizes that the AutoDetect-mNP algorithm can provide the statistical distributions of each species and their descriptors. These information can potentially be used to interpret kinetically controlled formation mechanisms and relative speed of growth of different facets during the formation of Au nanoparticles by, for example, helping to illuminate the shape transition from 3-fold symmetrical triangular particles to 6-fold symmetrical hexagonal particles (Figure S4). The existence of these potential interpretations of the classification results demonstrated that AutoDetect-mNP is capable of more than just arbitrary assigning NPs to classes but also potentially helping to unveil the underlying physical processes governing the distribution of NP shapes. In future studies, a kinetic growth model, potentially similar to the one previously reported by Handwerk et al.,49 could be established based on the statistical distributions of particle shapes shown herein, which can potentially help to validate or improve existing models of nanoprism growth such as the twinned facets model proposed by Jagannathan et al.15,50
Extending beyond Au NPs
To test the performance of AutoDetect-mNP on NP systems beyond Au NPs, we explored the algorithm’s perfomance on two additional data sets: Palladium (Pd) nanocubes and cadmium selenide/cadmium sulfide core–shell quantum dots (CdSe/CdS QDs). These NP systems have been widely studied in literature for a variety of applications. Being able to analyze these NPs will greatly expand the scope of potential applications of AutoDetect-mNP.
The most significant challenge of extending to NP systems beyond Au NPs is the decrease in image contrasts. As a heavy metal with large nuclear mass and high lattice packing efficiency, Au interacts strongly with incoming electron beams, and thus showing very high contrasts when imaged in TEM. CdSe and Pd, however, interact with electrons much more weakly and, therefore, show much lower contrasts under TEM. Because of the reduced image contrasts, K-means image segmentation no longer showed satisfactory performances on these NPs. Therefore, we instead employed the image segmentation method reported by Powers et al, which is designed to analyze images with low contrasts.51
AutoDetect-mNP’s performance on Pd nanocubes is shown in Figure S5. The algorithm analyzed 18 TEM images of Pd nanocubes containing 1371 NPs. The algorithm identifies two shape classes in the data set: nanocubes and irregularly shaped impurities. Irregularly shaped impurities only took a small part of the entire population, showing that the reaction has good shape control. Upon applying more iterations of classification on the data set, it can be seen that the algorithm further broke down the class of cubes into smaller subclasses based on the nuanced differences among the cubes (Figure S6). In this way, the algorithm is again shown to be capable of providing information on the shape distributions of NPs at different levels of details, from quantifying the yield of the nanocubes to characterizing the nuanced variations in the shapes of the nanocubes.
CdSe/CdS QDs posed more significant challenges for AutoDetect-mNP than the metal NPs because of their significantly smaller sizes and lower contrasts under TEM. However, the algorithm was still found to be capable of analyzing the shapes of these NPs with relatively high accuracy (Figure S7). A total of 25 images of the QDs were analyzed. However, the image segmentation algorithm failed to achieve satisfactory performance on seven of the images, and therefore all analysis was done based on the 18 images successfully segmented, which contain 8045 NPs. Compared to the Au and Pd NPs, the shape distribution of the CdSe/CdS QDs is much closer to a continuum (Figure S7e–h). Therefore, we relied on the log-likelihood metric to determine the optimum number of classes through iterative classifications. Log-likelihood converged to 28.50 after three iterations of classification, and the optimum number of classes was determined to be five. From visual inspection of the shapes of NPs in each class (Figure S7), it can be seen that the classification intuitively makes sense, with NPs in different classes showing different symmetries. It is worth noting that because of the nuanced differences between the shapes of CdSe/CdS QDs, performing such classification manually would be tedious, if not impossible. Therefore, by being able to analyze and classify the shapes of CdSe/CdS QDs, AutoDetect-mNP provides a potentially valuable tool for researchers interested in shape controlled synthesis of CdSe/CdS QDs.
Conclusions
In this work, we developed an unsupervised machine learning algorithm, AutoDetect-mNP, that classifies Au NPs in TEM images based on extracted morphological information without human intervention. AutoDetect-mNP automatically decides the optimal number of classes for clustering based on intra- and interclass feature similarities and provides more relevant statistical distributions of the features for each class generated by the algorithm. The use of classes as a way of characterizing the shape distributions of nanoparticles can also be quantified with a cross-entropy measure post defacto to distinguish it from a more featureless continuum.
By comparing the analysis results on the composition of Au nanorod mixtures with different aspect ratios with human labeling and other existing algorithms, we demonstrated that our method is quantitatively reliable while being much more efficient. Applying the algorithm to the characterization of shape distributions of synthesized Au triangular prisms, the algorithm identified rod-shaped impurities from the triangular main products. Furthermore, running the algorithm iteratively on identified classes can organize the shapes of the particles hierarchically. It is hoped that the quantitative shape distributions provided by the algorithm can potentially help to provide insights into the mechanism of the formation of the nanoparticles.
We have also demonstrated the broader applicability of AutoDetect-mNP using data sets of Pd nanocubes and CdSe Qds. It was shown that, by using different particle detection methods, the algorithm can be applied to much broader categories of NPs. We can imagine future studies using AutoDetect-mNP to answer scientific questions such as optimizing reaction conditions for a high-throughput experimental setup, modeling the reaction mechanism with real-time analysis of particle shapes captured by TEM videos, or studying the self-assembly of NPs with different shapes.
Methods
Chemicals and Materials
Hexadecyltrimethylammonium bromide (CTAB, >98.0%) and sodium oleate (NaOL, >97.0%) were purchased from TCI America. Hydrogen tetrachloroaurate trihydrate (HAuCl4·3H2O, ≥99.9%), l-ascorbic acid (BioXtra, ≥99.0%), silver nitrate (AgNO3, ≥99.0%), sodium borohydride (NaBH4, 99.99%), sodium iodide (NaI, ≥99.5%), sodium hydroxide (NaOH, ≥ 97.0%), sodium citrate tribasic dihydrate (≥99.0%), and hydrochloric acid (36.5–38.0 wt %%) were obtained from Sigma-Aldrich (USA). NaBH4 powder was stored in an argon glovebox. HAuCl4·3H2O, l-ascorbic acid, and AgNO3 were stored in a vacuum desiccator at room temperature. Hexadecyltrimethylammonium chloride (CTAC, >95.0%) was purchased from TCI America. Palladium(II) chloride (PdCl2, 99%) and potassium iodide (KI, >99.0%) were obtained from Sigma-Aldrich (USA). Cadmium oxide (CdO) 99.99% Aldrich; oleic acid 90% (OA) technical grade Aldrich; oleylamine (OAm) technical grade 70% Aldrich; octadecene 90% (ODE) technical grade Aldrich; trioctylphosphine oxide (TOPO) 99% Aldrich; sulfur Aldrich; octadecylphosphonic acid (ODPA) 99%, PCI Synthesis; n-trioctylphosphine 97% (TOP) Strem; 0.2 M Cd(oleate)2 in ODE was prepared by degassing appropriate amounts of CdO, OA, and ODE under vacuum at 110 °C at until all gases and water had evolved. The flask was switched to argon and heated to 240 °C until a clear (slightly yellow) solution solution was obtained. The flask was then cooled to 110 °C and degassed a second time to remove additional water. Deionized water (DI-water, Milipore, Milford, MA, USA) was used for all aqueous solution. All the glassware used for the synthesis of Au NPs was thoroughly cleaned using freshly prepared aqua regia (3:1 volume ratio of HCl and HNO3, respectively) followed by fully rinsing with copious amounts of DI-water. All chemicals were of reagent grade and used without further purification unless specified otherwise.
Synthesis of Gold Nanorods
Two types of AuNRs were synthesized by a facile seed-mediated growth involving a binary surfactant mixture. The seed solution was prepared as follows: 10 mL of 0.1 M CTAB solution was mixed with 100 μL of 25 mM HAuCl4 in a 20 mL scintillation vial under vigorous stirring. A 600 μL portion of ice cooled 10 mM NaBH4 was rapidly injected into the Au-CTAB solution and stirred for 2 min. Upon the addition of NaBH4, the color of the seed solution turned yellow-brownish. Afterward, the seed solution was left undisturbed at 28 °C for 30 min prior to use in the following step.
The growth solution was obtained by first mixing 3.6 g of CTAB and 0.4936 g of NaOL in 196 mL of DI-water in a 500 mL Erlenmeyer flask. The solution was heated with occasional agitation until all the CTAB was dissolved. The mixture was allowed to cool down to 30 °C and 4 mM AgNO3 referred to Table 2 was then added under stir at 700 rpm for 15 min. Afterward, 4 mL of 25 mM HAuCl4 was added to the mixture and kept undisturbed at 28 °C for 90 min. The yellowish color of the growth solution turned to colorless. A certain amount of HCl (Table 2) was added to the solution, and the mixture was stirred at 400 rpm for 15 min. Finally, 500 μL of 0.064 M ascorbic acid was injected into the growth solution, and the mixture was vigorously stirred at 1200 rpm for 30 s. An 80 μL portion of the seed solution was then injected, and the solution was stirred for 30 s before it was left undisturbed at 28 °C for 12 h to complete the growth process. A 40 mL portion of the final products were isolated by centrifugation at 8000 rpm for 15 min followed by careful removal of the supernatant. A 10 mL portion of DI-water was added to the pellet, and the mixture was sonicated briefly to disperse the pellet.
Table 2. Amount of Reagents Used for the Synthesis of Au Nanorods.
| sample | 4 mM AgNO3 (mL) | HCl (mL) |
|---|---|---|
| long rods | 1.45 | 0.84 |
| short rods | 9.6 | 1.2 |
Synthesis of Gold Triangular Prisms
Homogeneous gold triangular prisms were also synthesized by seed-mediated method. The citrate ligand based seed solution was prepared as follows: 500 μL of 10 mM sodium citrate solution was mixed with 250 μL of 10 mM HAuCl4 and 18.95 mL of DI-water in a 20 mL scintillation vial under vigorous stirring. A 300 μL portion of ice cooled 10 mM NaBH4 was rapidly injected into the Au-citrate solution and stirred for 1 min. Upon the addition of NaBH4, the color of the seed solution turned yellow-brownish. Afterward, the seed solution was stirred at 40–45 °C for 15 min and left undisturbed at room temperature prior to use in the following step.
For the growing process, the UV–vis spectra of the seed solution were taken using 1 cm quartz cuvette to determine the concentration of the seed. The extinction coefficient of the seed solution is 9.696 × 10⁶ M–1 cm–1 at its wavelength of maximum optical density, 504 nm. In order to synthesize the triangular prism with edge length in 80 nm, the final concentration of the seed in the growth solution should be 97.7 pM. Prior to preparing the growth solution, the stock mixture of 0.05 M CTAB and 50 μM NaI was prepared at room temperature. The solution was heated with occasional agitation until all the CTAB was dissolved. The mixture was allowed to cool down to 30 °C. The growth solution was prepared by mixing 9 mL of previously made CTAB/NaI stock mixture, 250 μL of 10 mM HAuCl4 solution, 50 μL of 100 mM NaOH solution, and 50 μL of 100 mM ascorbic acid solution. Finally, a certain amount of seed solution was added under vigorous stirring. The nanoparticle solution was then heated around 40 °C for 30 min and was cooled down to room temperature.
For the purification process of Au nanoprisms, 0.6 mL of the growing solution was mixed with 0.4 mL of 1 M NaCl solution into 1.5 mL Eppendorf tubes. The mixture was left undisturbed for 4 h and centrifuged twice at 1000 rpm for 15 s. The supernatant was carefully removed, and 0.6 mL of DI-water was added to the pellet and was sonicated briefly to disperse the pellet.
Synthesis of Pd Nanocubes
Palladium nanocubes were synthesized with a method similar to a previous report.52 A stock solution of 10 mM H2PdCl4 was prepared by dissolving 0.1773 g of PdCl2 in 10 mL of 200 mM HCl. A 50 mL aqueous growth solution was prepared in a 100 mL round-bottom flask containing 12.5 mM CTAC and 2 mM KBr, and 2.5 mL of 10 mM H2PdCl4 was added to this solution. The solution was heated to 95 °C and held at this temperature for 5 min. The solution was stirred with a magnetic stir-bar, and subsequently 400 μL of 100 mM l-ascorbic acid was injected into the solution with a micropipette to initiate growth. The reaction was allowed to proceed for 30 min at 95 °C to complete the growth process. The solution turned into a dark brown color during the growth process. The final products were cooled to room temperature and isolated by centrifugation at 8000 rpm for 15 min followed by removal of the supernatant. The resulting pellet was dispersed in 5 mL of water by sonication.
Synthesis of CdSe/CdS QDs
CdSe cores were synthesized using a modified version of a previously published procedure.53 Typically, 120 mg of CdO, 560 mg of ODPA, and 6 g of TOPO were combined and degassed at 150 °C under vacuum for 1 h. The reaction was then heated to 320 °C under argon and held at that temperature until the solution turned clear, indicative of Cd-ODPA complexation. At 320 °C, 3 g of TOP was injected, and then the solution was heated to 360 °C, at which point a solution of Se (120 mg) dissolved in TOP (0.72 g) was quickly injected. The reaction was stopped after approximately 4 min and quickly cooled. The QDs were purified from free ligand and excess precursors via precipitation with acetone and redispersion in hexanes several times. Sizing and concentrations were determined using previously established calibration curves.54
Samples were prepared according to the work of Ondry et al.55 Samples with a nominal shell thickness of 6 monolayers were synthesized as follows. A 100 nmol portion of wurtzite CdSe seeds (570 nm first exciton), 3 mL ODE, and 3 mL OAm were loaded into a 50 mL three-neck, round-bottom flask and degassed at 110 °C for ∼30 min. Under Ar, the reaction was heated to 310 °C. At 240 °C, slow injection of a 3.14 mL of 0.2 M Cd(oleate)2 in ODE solution and 3.14 mL of 0.2 M TOP-S solution in TOP in separate syringes commenced at a rate of 1 mL/h. TOP-S in TOP was prepared by stirring 20 mg of S in 2.6 g TOP in a glovebox for ∼30 min. After the injection completed, the reaction was kept at 310 °C for 10 min and then rapidly cooled to room temperature. Nanocrystals were isolated from the reaction by precipitating the nanocrystals with acetone and redissolving in hexanes 2×. Finally the nanocrystals were centrifuged at 8000 rpm in hexanes to remove any remaining insoluble impurities.
Preparation of TEM Samples
To prepare the stock sample of Au NPs for TEM analysis, a 50 μL aliquot of the nanoparticle solution was added to 1 mL of DI-water. The sample was centrifuged at 5500 rpm for 8 min, the supernatant was carefully removed, and the isolated product was resuspended in 50 μL of DI-water. We added 200 μL of DI-water to the sample to dilute by a factor of 5 to prevent overlapping particles on the grid. A 5 μL portion of this solution was pipetted onto a standard carbon TEM grid (Electron Microscopy Sciences, CF-400-Cu). The TEM grid with the sample was fully dried in a vacuum desiccator at room temperature before TEM imaging.
In order to calculate the concentration of Au nanorods, we referred to the theoretical extinction coefficient of the AuNR reported by Park et al.56 Each extinction coefficient of long and short AuNR was extracted to 1.4 × 10¹⁰ L mol–1 cm–1 at 1059 nm for long rods, and 1.1 × 10¹⁰ L mol–1 cm–1 at 698 nm for short rods. The optical density of the solution was collected using a Shimadzu UV-3600 UV–vis spectrophotometer with 1 nm resolution. The path length of the cuvette was 1 cm. To make a 50:50 ratio of short and long AuNRs, the concentration of each sample was fixed to 90 pM.
Pd nanocubes samples for TEM analysis were prepared by pipetting 1 μL of the nanocube solution onto a standard carbon TEM grid (Electron Microscopy Sciences, CF-400-CU). The sample was fully dried in a vacuum desiccator before being imaged.
CdSe/CdS QD samples were prepared at the liquid–air interface.57 Briefly, 1 mL of anhydrous DMF was placed in a 1 cm2 square Teflon well. Next CdSe/CdS QDs were diluted in octane to an appropriate concentration to achieve monolayer coverage and 100 μL of the diluted nanocrystal solution in octane was floated on top of the DMF layer. The well was covered with a glass slide to slow solvent evaporation and was allowed to sit for at least 8 h. The samples were transferred via scooping from below to an amorphous carbon coated TEM grid for microscopy. Samples were placed in a vacuum oven under house vacuum at ∼50 °C to remove any remaining subphase solvent.
TEM Imaging
Images of Au NPs were acquired using a FEI Tecnai T20 transmission electron microscope equipped with a Gatan RIO16IS camera and a LaB6 filament. All images were recorded under 200 kV accelerating voltage. Drift correction feature of the imaging software was enabled during the acquisition of all images. For each sample, images were taken from a series of evenly spaced locations on the sample grid, typically resulting in 50–100 images of the sample containing >1000 recognizable NPs. Experimental parameters during the imaging process can impact the performance of the algorithm. The efficiency of particle detection can depend on the resolutions and contrasts of the TEM images. Therefore, optimizing experimental parameters during imaging to improve image resolution and contrast is recommended. We observed that magnification and camera exposure time are two of the most important imaging parameters to fine-tune. Matlab codes for real-time image analysis during imaging are included in the Github repository for AutoDetect-mNP to help the users optimize experimental parameters during imaging. For the data showed in this work, long rods were imaged at 43k× magnification with 1 s exposure time; short rods were imaged at 19k× magnification with 1 s exposure time; mixtures were imaged at 43k× magnification with 1 s exposure time; triangular prisms were imaged at 26k× magnification with 1.5 s exposure time.
AutoDetect-mNP Algorithm
Unprocessed TEM images in dm4 format were loaded into Matlab by the ReadDMFile function available from MathWorks file exchange. Particle detection was performed by Matlab’s built-in function imsegkmeans. Imsegkmeans segments the image by performing a K-means clustering on the pixel intensities of each image. Shape descriptors for each particles were calculated by the regionprops function in Matlab. The definition for each shape descriptors is as follows: Area is defined as the total area, in squared nanometers, of the region encompassed by the edge of the particle; eccentricity is defined as the eccentricity of the smallest ellipse that encapsulates the particle; aspect ratio is defined as the ratio between the major and minor axis lengths of the particle; circularity is defined as the reciprocal of the first Hu’s moment invariant of the particle;43,44 solidity and convexity are defined as the ratio of the areas and perimeters, respectively, between the particle and the smallest convex polygon that encapsulates the particle. Hu’s moment invariants of the particles were calculated by codes available from the MathWorks file exchange.
UECS was implemented using Matlab codes adapted from those published by Park et al. (available from https://aml.engr.tamu.edu/2001/09/01/publications/).30 The UECS algorithm attempts to resolve convex components from nonconvex shapes by iteratively eroding the shapes until convex shapes are obtained. If convex shapes are not obtained after 90% of the area of the original particle has been eroded, the particle will be discarded. Each convex-shaped marker obtained at the end of UECS iterations was then dilated for the same number of times as it has been eroded to recover its original shape.
K-means clustering and naive Bayes classifier used for unsupervised classification are well established clustering algorithms and are implemented in Matlab. An example demonstrating using Pmax(K) to decide the optimal number of classes is shown in Figure 6. In Figure 6, circularity of the Au nanorods was used as an example to demonstrate the selection of optimal K. In this case, K = 3 is selected as the optimal K for this data set, which agrees with the observation that the data set roughly consists of three normal distributions. Of note, particles resolved by UECS were excluded during the automated classification process to avoid skewing of classification results by potential artifacts generated by UECS. Instead, these particles were assigned classes after the normal particles are clustered into different classes.
Figure 6.
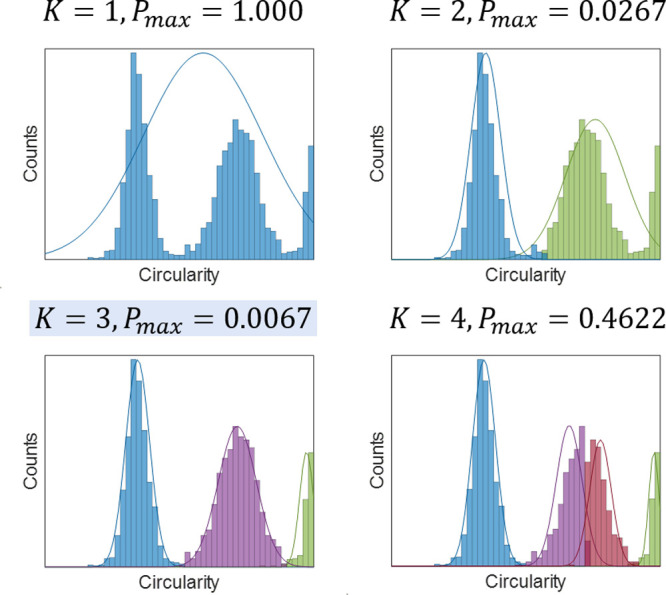
Unsupervised clustering of extracted features and selection of optimal number of clusters (K), using circularity of Au nanorods as an example.
Acknowledgments
X.W., H.D.H., J.C.D., J.C.O., I.M.-H., and A.P.A. thank the U.S. Department of Energy, Office of Science, Office of Basic Energy Sciences, Materials Sciences and Engineering Division, for their support for the nanoparticle synthesis and TEM imaging part of this work under Contract No. DE-AC02-05-CH11231 within the Data Science for Data-Driven Synthesis Science (KCD2S2). J.L. and T.H-.G. thank the National Institutes of Health for their support for the computational and algorithm development part of this work under Grant No 5U01GM121667. We also thank Priyanka Raghavan, Vishnu Dharmaraj, Megan Lim, Adam Rodgers, and Hao Lyu for early work as part of Chem195/295: Machine Learning for the Chemical Sciences taught by T.H-G.. Many users have provided feedback on the class, which is reflected in all of the different demonstrations shown in this document.
Supporting Information Available
The Supporting Information is available free of charge at https://pubs.acs.org/doi/10.1021/jacsau.0c00030.
Additional data and visualization of results, including Figures S1–7 and Tables S1–3 (PDF)
Author Contributions
† X.W. and J.L. contributed equally.
Author Contributions
X.W., J.L., A.P.A., and T.H-G. conceived the scientific direction; X.W., J.L., T.H-G., H.D.H., and J.C.D. wrote the manuscript; X.W. and J.L. provided calculations and created the figures; X.W., J.C.O., and I.M.-H. performed TEM imaging; H.D.H., J.C.O., and I.M.-H. carried out nanoparticle synthesis and prepared TEM samples. All authors contributed insights and discussed and edited the manuscript.
The authors declare no competing financial interest.
Notes
Codes for AutoDetect-mNP is available at: https://github.com/realxingzhiwang/AutoDetect-mNP.
Supplementary Material
References
- Noguez C. Surface plasmons on metal nanoparticles: The influence of shape and physical environment. J. Phys. Chem. C 2007, 111, 3806. 10.1021/jp066539m. [DOI] [Google Scholar]
- Kelly K. L.; Coronado E.; Zhao L. L.; Schatz G. C. The optical properties of metal nanoparticles: The influence of size, shape, and dielectric environment. J. Phys. Chem. B 2003, 107, 668–677. 10.1021/jp026731y. [DOI] [Google Scholar]
- Mock J. J.; Barbic M.; Smith D. R.; Schultz D. A.; Schultz S. Shape effects in plasmon resonance of individual colloidal silver nanoparticles. J. Chem. Phys. 2002, 116, 6755. 10.1063/1.1462610. [DOI] [Google Scholar]
- Orendorff C. J.; Sau T. K.; Murphy C. J. Shape-Dependent Plasmon-Resonant Gold Nanoparticles. Small 2006, 2, 636–639. 10.1002/smll.200500299. [DOI] [PubMed] [Google Scholar]
- Narayanan R.; El-Sayed M. A. Catalysis with transition metal nanoparticles in colloidal solution: Nanoparticle shape dependence and stability. J. Phys. Chem. B 2005, 109, 12663–12676. 10.1021/jp051066p. [DOI] [PubMed] [Google Scholar]
- Narayanan R.; El-Sayed M. A. Shape-dependent catalytic activity of platinum nanoparticles in colloidal solution. Nano Lett. 2004, 4, 1343–1348. 10.1021/nl0495256. [DOI] [Google Scholar]
- Lykaki M.; Pachatouridou E.; Carabineiro S. A.; Iliopoulou E.; Andriopoulou C.; Kallithrakas-Kontos N.; Boghosian S.; Konsolakis M. Ceria nanoparticles shape effects on the structural defects and surface chemistry: Implications in CO oxidation by Cu/CeO2 catalysts. Appl. Catal., B 2018, 230, 18–28. 10.1016/j.apcatb.2018.02.035. [DOI] [Google Scholar]
- King M. E.; Personick M. L. Defects by design: Synthesis of palladium nanoparticles with extended twin defects and corrugated surfaces. Nanoscale 2017, 9, 17914–17921. 10.1039/C7NR06969C. [DOI] [PubMed] [Google Scholar]
- Xie X.; Liao J.; Shao X.; Li Q.; Lin Y. The Effect of shape on Cellular Uptake of Gold Nanoparticles in the forms of Stars, Rods, and Triangles. Sci. Rep. 2017, 7, 1–9. 10.1038/s41598-017-04229-z. [DOI] [PMC free article] [PubMed] [Google Scholar]
- Chithrani B. D.; Ghazani A. A.; Chan W. C. Determining the size and shape dependence of gold nanoparticle uptake into mammalian cells. Nano Lett. 2006, 6, 662–668. 10.1021/nl052396o. [DOI] [PubMed] [Google Scholar]
- Ha T. H.; Koo H. J.; Chung B. H. Shape-controlled syntheses of gold nanoprisms and nanorods influenced by specific adsorption of halide ions. J. Phys. Chem. C 2007, 111, 1123–1130. 10.1021/jp066454l. [DOI] [Google Scholar]
- Lohse S. E.; Murphy C. J. The quest for shape control: A history of gold nanorod synthesis. Chem. Mater. 2013, 25, 1250–1261. 10.1021/cm303708p. [DOI] [Google Scholar]
- Grzelczak M.; Pérez-Juste J.; Mulvaney P.; Liz-Marzán L. M. Shape control in gold nanoparticle synthesis. Chem. Soc. Rev. 2008, 37, 1783–1791. 10.1039/b711490g. [DOI] [PubMed] [Google Scholar]
- Wang S. T.; Lin Y.; Nielsen M. H.; Song C. Y.; Thomas M. R.; Spicer C. D.; Kröger R.; Ercius P.; Aloni S.; Stevens M. M. Shape-controlled synthesis and in situ characterisation of anisotropic Au nanomaterials using liquid cell transmission electron microscopy. Nanoscale 2019, 11, 16801–16809. 10.1039/C9NR01474H. [DOI] [PubMed] [Google Scholar]
- Millstone J. E.; Hurst S. J.; Métraux G. S.; Cutler J. I.; Mirkin C. A. Colloidal gold and silver triangular nanoprisms. Small 2009, 5, 646–664. 10.1002/smll.200801480. [DOI] [PubMed] [Google Scholar]
- Requejo K. I.; Liopo A. V.; Zubarev E. R. Gold Nanorod Synthesis with Small Thiolated Molecules. Langmuir 2020, 36, 3758–3769. 10.1021/acs.langmuir.0c00302. [DOI] [PubMed] [Google Scholar]
- Vigderman L.; Khanal B. P.; Zubarev E. R. Functional gold nanorods: Synthesis, self-assembly, and sensing applications. Adv. Mater. 2012, 24, 4811–4841. 10.1002/adma.201201690. [DOI] [PubMed] [Google Scholar]
- Sau T. K.; Murphy C. J. Room temperature, high-yield synthesis of multiple shapes of gold nanoparticles in aqueous solution. J. Am. Chem. Soc. 2004, 126, 8648–8649. 10.1021/ja047846d. [DOI] [PubMed] [Google Scholar]
- Mulligan S. K.; Speir J. A.; Razinkov I.; Cheng A.; Crum J.; Jain T.; Duggan E.; Liu E.; Nolan J. P.; Carragher B.; Potter C. S. Multiplexed TEM Specimen Preparation and Analysis of Plasmonic Nanoparticles. Microsc. Microanal. 2015, 21, 1017–1025. 10.1017/S1431927615014324. [DOI] [PMC free article] [PubMed] [Google Scholar]
- Tan Y. Z.; Cheng A.; Potter C. S.; Carragher B. Automated data collection in single particle electron microscopy. Microscopy (Oxford, U. K.) 2016, 65, 43–56. 10.1093/jmicro/dfv369. [DOI] [PMC free article] [PubMed] [Google Scholar]
- Schorb M.; Haberbosch I.; Hagen W. J.; Schwab Y.; Mastronarde D. N. Software tools for automated transmission electron microscopy. Nat. Methods 2019, 16, 471–477. 10.1038/s41592-019-0396-9. [DOI] [PMC free article] [PubMed] [Google Scholar]
- House S. D.; Chen Y.; Jin R.; Yang J. C. High-throughput, semi-automated quantitative STEM mass measurement of supported metal nanoparticles using a conventional TEM/STEM. Ultramicroscopy 2017, 182, 145–155. 10.1016/j.ultramic.2017.07.004. [DOI] [PubMed] [Google Scholar]
- Sosa J. M.; Huber D. E.; Welk B.; Fraser H. L. Development and application of MIPARTM: a novel software package for two- and three-dimensional microstructural characterization. Integrating Materials and Manufacturing Innovation 2014, 3, 123–140. 10.1186/2193-9772-3-10. [DOI] [Google Scholar]
- Cervera Gontard L.; Ozkaya D.; Dunin-Borkowski R. E. A simple algorithm for measuring particle size distributions on an uneven background from TEM images. Ultramicroscopy 2011, 111, 101–106. 10.1016/j.ultramic.2010.10.011. [DOI] [PubMed] [Google Scholar]
- Laramy C. R.; Brown K. A.; O’Brien M. N.; Mirkin C. A. High-Throughput, Algorithmic Determination of Nanoparticle Structure from Electron Microscopy Images. ACS Nano 2015, 9, 12488–12495. 10.1021/acsnano.5b05968. [DOI] [PubMed] [Google Scholar]
- Boselli L.; Lopez H.; Zhang W.; Cai Q.; Giannone V. A.; Li J.; Moura A.; de Araujo J. M.; Cookman J.; Castagnola V.; Yan Y.; Dawson K. A. Classification and biological identity of complex nano shapes. Communications Materials 2020, 1, 1–12. 10.1038/s43246-020-0033-2. [DOI] [Google Scholar]
- Groschner C. K.; Choi C.; Scott M. C. Methodologies for Successful Segmentation of HRTEM Images via Neural Network. arXiv.org 2020, 2001.05022. [Google Scholar]
- Qian Y.; Huang J. Z.; Li X.; Ding Y. Robust nanoparticles detection from noisy background by fusing complementary image information. IEEE Transactions on Image Processing 2016, 25, 5713–5726. 10.1109/TIP.2016.2614127. [DOI] [PubMed] [Google Scholar]
- Park C.; Huang J. Z.; Huitink D.; Kundu S.; Mallick B. K.; Liang H.; Ding Y. A multistage, semi-automated procedure for analyzing the morphology of nanoparticles. IIE Transactions (Institute of Industrial Engineers) 2012, 44, 507–522. 10.1080/0740817X.2011.587867. [DOI] [Google Scholar]
- Park C.; Huang J. Z.; Ji J. X.; Ding Y. Segmentation, Inference and Classification of Partially Overlapping Nanoparticles. IEEE Transactions on Pattern Analysis and Machine Intelligence 2013, 35, 669–681. 10.1109/TPAMI.2012.163. [DOI] [PubMed] [Google Scholar]
- Park C.; Ding Y. Automating material image analysis for material discovery. MRS Commun. 2019, 9, 545–555. 10.1557/mrc.2019.48. [DOI] [Google Scholar]
- Stein H. S.; Gregoire J. M. Progress and prospects for accelerating materials science with automated and autonomous workflows. Chemical Science 2019, 10, 9640–9649. 10.1039/C9SC03766G. [DOI] [PMC free article] [PubMed] [Google Scholar]
- Gongora A. E.; Xu B.; Perry W.; Okoye C.; Riley P.; Reyes K. G.; Morgan E. F.; Brown K. A. A Bayesian experimental autonomous researcher for mechanical design. Science Advances 2020, 6, eaaz1708 10.1126/sciadv.aaz1708. [DOI] [PMC free article] [PubMed] [Google Scholar]
- Flores-Leonar M. M.; Mejía-Mendoza L. M.; Aguilar-Granda A.; Sanchez-Lengeling B.; Tribukait H.; Amador-Bedolla C.; Aspuru-Guzik A. Materials Acceleration Platforms: On the way to autonomous experimentation. Current Opinion in Green and Sustainable Chemistry 2020, 25, 100370. 10.1016/j.cogsc.2020.100370. [DOI] [Google Scholar]
- Murphy C. J.; Thompson L. B.; Chernak D. J.; Yang J. A.; Sivapalan S. T.; Boulos S. P.; Huang J.; Alkilany A. M.; Sisco P. N. Gold nanorod crystal growth: From seed-mediated synthesis to nanoscale sculpting. Curr. Opin. Colloid Interface Sci. 2011, 16, 128–134. 10.1016/j.cocis.2011.01.001. [DOI] [Google Scholar]
- Zhao P.; Li N.; Astruc D. State of the art in gold nanoparticle synthesis. Coord. Chem. Rev. 2013, 257, 638–665. 10.1016/j.ccr.2012.09.002. [DOI] [Google Scholar]
- Ye X.; Zheng C.; Chen J.; Gao Y.; Murray C. B. Using binary surfactant mixtures to simultaneously improve the dimensional tunability and monodispersity in the seeded growth of gold nanorods. Nano Lett. 2013, 13, 765–771. 10.1021/nl304478h. [DOI] [PubMed] [Google Scholar]
- Jones M. R.; Mirkin C. A. Bypassing the limitations of classical chemical purification with DNA-programmable nanoparticle recrystallization. Angew. Chem., Int. Ed. 2013, 52, 2886–2891. 10.1002/anie.201209504. [DOI] [PubMed] [Google Scholar]
- Croft S. Colloidal gold. Electron Microscopy Reviews 1992, 5, iii–iv. 10.1016/0892-0354(92)90018-L. [DOI] [Google Scholar]
- O’Mahony N.; Campbell S.; Carvalho A.; Harapanahalli S.; Hernandez G. V.; Krpalkova L.; Riordan D.; Walsh J. Deep Learning vs. Traditional Computer Vision. Advances in Intelligent Systems and Computing 2020, 943, 128–144. 10.1007/978-3-030-17795-9_10. [DOI] [Google Scholar]
- Grulke E. A.; Rice S. B.; Xiong J. C.; Yamamoto K.; Yoon T. H.; Thomson K.; Saffaripour M.; Smallwood G. J.; Lambert J. W.; Stromberg A. J.; Macy R.; Briot N. J.; Qian D. Size and shape distributions of carbon black aggregates by transmission electron microscopy. Carbon 2018, 130, 822–833. 10.1016/j.carbon.2018.01.030. [DOI] [Google Scholar]
- Grulke E. A.; Wu X.; Ji Y.; Buhr E.; Yamamoto K.; Woong Song N.; Stefaniak A. B.; Schwegler-Berry D.; Burchett W. W.; Lambert J.; Stromberg A. J. Differentiating gold nanorod samples using particle size and shape distributions from transmission electron microscope images. Metrologia 2018, 55, 254–267. 10.1088/1681-7575/aaa368. [DOI] [PMC free article] [PubMed] [Google Scholar]
- Hu M. K. Visual Pattern Recognition by Moment Invariants. IEEE Trans. Inf. Theory 1962, 8, 179–187. 10.1109/TIT.1962.1057692. [DOI] [Google Scholar]
- MacSleyne J. P.; Simmons J. P.; De Graef M. On the use of 2-D moment invariants for the automated classification of particle shapes. Acta Mater. 2008, 56, 427–437. 10.1016/j.actamat.2007.09.039. [DOI] [Google Scholar]
- Laramy C. R.; Fong L.-K.; Jones M. R.; O'Brien M. N.; Schatz G. C.; Mirkin C. A. Understanding nanoparticle-mediated nucleation pathways of anisotropic nanoparticles. Chem. Phys. Lett. 2017, 683, 389–392. 10.1016/j.cplett.2017.01.050. [DOI] [Google Scholar]
- O’Brien M. N.; Jones M. R.; Kohlstedt K. L.; Schatz G. C.; Mirkin C. A. Uniform circular disks with synthetically tailorable diameters: Two-dimensional nanoparticles for plasmonics. Nano Lett. 2015, 15, 1012–1017. 10.1021/nl5038566. [DOI] [PubMed] [Google Scholar]
- Sun S.; Yuan D.; Xu Y.; Wang A.; Deng Z. Ligand-Mediated Synthesis of Shape-Controlled Cesium Lead Halide Perovskite Nanocrystals via Reprecipitation Process at Room Temperature. ACS Nano 2016, 10, 3648–3657. 10.1021/acsnano.5b08193. [DOI] [PubMed] [Google Scholar]
- Cho H.; Shin J. W.; Ryoo R. Atomic Scale Mechanisms Underlying Thermal Reshaping of Anisotropic Gold Nanocrystals Revealed by in Situ Electron Microscopy. J. Phys. Chem. C 2020, 124, 12855–12863. 10.1021/acs.jpcc.0c04281. [DOI] [Google Scholar]
- Handwerk D. R.; Shipman P. D.; Whitehead C. B.; Özkar S.; Finke R. G. Mechanism-Enabled Population Balance Modeling of Particle Formation en Route to Particle Average Size and Size Distribution Understanding and Control. J. Am. Chem. Soc. 2019, 141, 15827–15839. 10.1021/jacs.9b06364. [DOI] [PubMed] [Google Scholar]
- Jagannathan R.; Mehta R. V.; Timmons J. A.; Black D. L. Anisotropic growth of twinned cubic crystals. Phys. Rev. B: Condens. Matter Mater. Phys. 1993, 48, 13261. 10.1103/PhysRevB.48.13261. [DOI] [PubMed] [Google Scholar]
- Powers A. S.; Liao H.-G.; Raja S. N.; Bronstein N. D.; Alivisatos A. P.; Zheng H. Tracking Nanoparticle diffusion and interaction during self-assembly in a liquid cell. Nano Lett. 2017, 17, 15–20. 10.1021/acs.nanolett.6b02972. [DOI] [PubMed] [Google Scholar]
- Niu W.; Li Z. Y.; Shi L.; Liu X.; Li H.; Han S.; Chen J.; Xu G. Seed-mediated growth of nearly monodisperse palladium nanocubes with controllable sizes. Cryst. Growth Des. 2008, 8, 4440–4444. 10.1021/cg8002433. [DOI] [Google Scholar]
- Carbone L.; et al. Synthesis and micrometer-scale assembly of colloidal CdSe/CdS nanorods prepared by a seeded growth approach. Nano Lett. 2007, 7, 2942–2950. 10.1021/nl0717661. [DOI] [PubMed] [Google Scholar]
- Jasieniak J.; Smith L.; Van Embden J.; Mulvaney P.; Califano M. Re-examination of the size-dependent absorption properties of CdSe quantum dots. J. Phys. Chem. C 2009, 113, 19468–19474. 10.1021/jp906827m. [DOI] [Google Scholar]
- Ondry J. C.; Philbin J. P.; Lostica M.; Rabani E.; Alivisatos A. P. Colloidal Synthesis Path to 2D Crystalline Quantum Dot Superlattices. ACS Nano 2020, 10.1021/acsnano.0c07202. [DOI] [PubMed] [Google Scholar]
- Park K.; Biswas S.; Kanel S.; Nepal D.; Vaia R. A. Engineering the optical properties of gold nanorods: Independent tuning of surface plasmon energy, extinction coefficient, and scattering cross section. J. Phys. Chem. C 2014, 118, 5918–5926. 10.1021/jp5013279. [DOI] [Google Scholar]
- Dong A.; Chen J.; Vora P. M.; Kikkawa J. M.; Murray C. B. Binary nanocrystal superlattice membranes self-assembled at the liquid-air interface. Nature 2010, 466, 474–477. 10.1038/nature09188. [DOI] [PubMed] [Google Scholar]
Associated Data
This section collects any data citations, data availability statements, or supplementary materials included in this article.