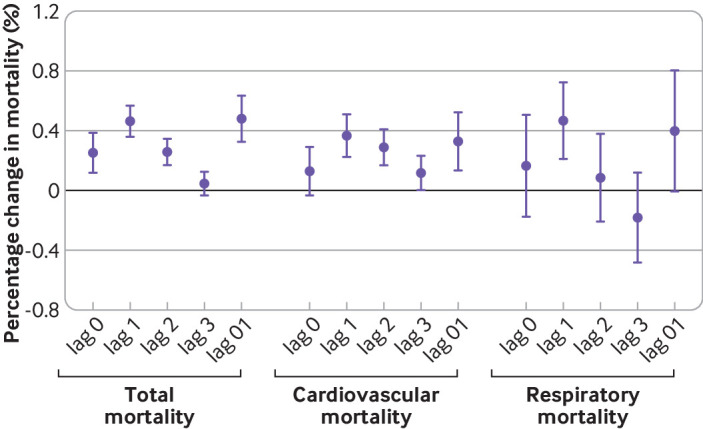
Fig 1.

Relative risks of total, cardiovascular, and respiratory mortality associated with a 10 μg/m3 increase in nitrogen dioxide (NO2) on different lag days for NO2. Lags indicate the time difference between the NO2 exposure and the outcome. Lag 0=the present day; lag 1=the previous day; lag 2=the day before lag 1; lag 3=the day before lag 2; lag 0-1=the two day moving average of the present day and the previous day
