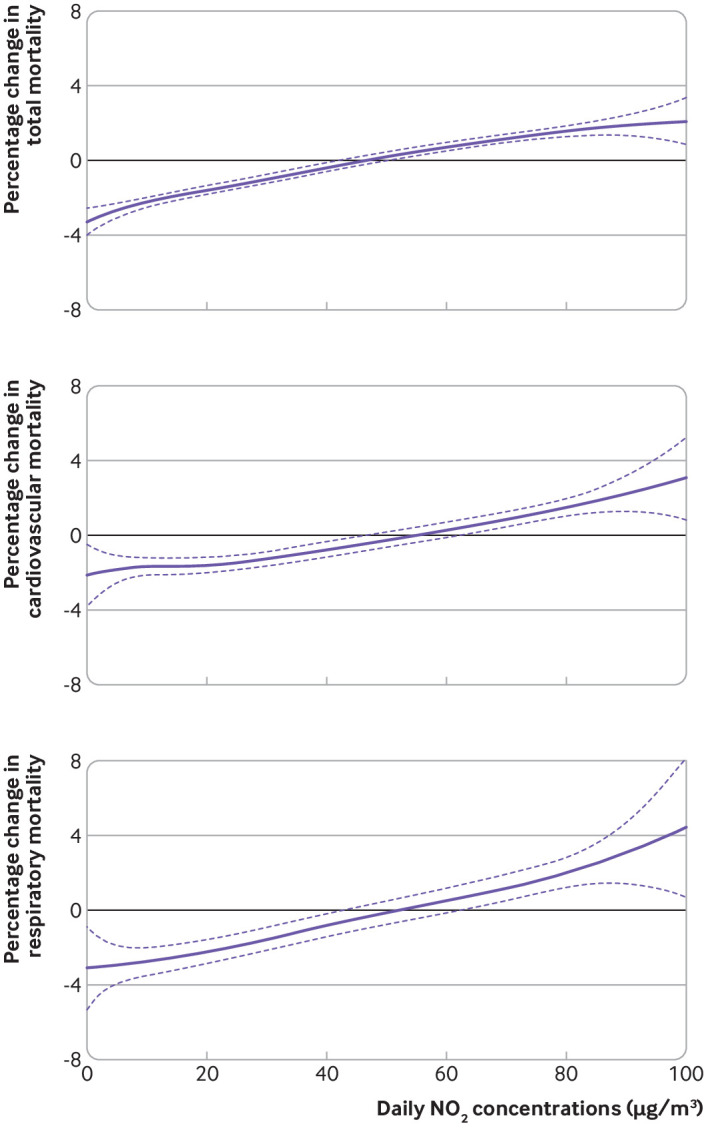
Fig 2.

Concentration-response curve between nitrogen dioxide (NO2) concentrations (lag 1) and total, cardiovascular, and respiratory mortality. The vertical scale can be interpreted as the relative change of the mean effect of NO2 on mortality; the fraction of the curve below zero denotes a smaller estimate than the mean effect
