

Summary
Childhood obesity increases the risk of adulthood obesity and is associated with other adverse health outcomes later in life. It may be influenced by environmental characteristics of neighborhoods where children live, particularly dietary supply–related environmental factors. This study aimed to systematically review the evidence on the association between access to convenience stores and childhood obesity. We searched and filtered relevant literature in PubMed, Embase, Web of Science, and Cochrane Library published before 1 January 2019. Data on the basic characteristics of studies, measures of access to convenience stores, and associations of convenience stores with weight‐related behaviors and outcomes were extracted from 41 included studies. In general, the density of and proximity to convenience stores in children's residential and school neighborhoods were positively associated with unhealthy eating behaviors. However, their associations with children's weight status varied significantly by regions. The association between convenience store access and children's weight status was found to be negative in Canada, rather mixed in the United States and the United Kingdom, and not significant in East Asia. We suggest future research to clearly define the convenience store, better measure the access to convenience store, and also measure children's journey and food purchasing and consumption behaviors, to explain pathways from convenience store access to childhood obesity for designing effective interventions and policies.
Keywords: children, convenience store, obesity, spatial
1. INTRODUCTION
Obesity is a major health issue for children and adolescents worldwide. 1 As a leading cause of morbidity and premature mortality, obesity is linked to various adverse health outcomes, such as hypertension, diabetes, heart disease, stroke, sleep apnea, osteoarthritis, and certain types of cancer. It is also linked to various social and psychological problems. 2 , 3 Childhood and adolescent obesity is more likely to persist into their adulthood. 4 In 2010, about 43 million children, or 6.7% of children or adolescents worldwide, were estimated to be with overweight or obesity. This number is predicted to reach 60 million (9.1%) by 2020. 5
Neighborhood environment is often linked to personal characteristics to affect individual weight status through behaviors. 6 For example, a number of studies have revealed the important influence of dietary supply–related environmental factors on children's body weight through food purchasing and consumption. 7 , 8 , 9 The access to convenience stores is one such obesogenic environmental factor. A convenience store, convenience shop, or corner store is a small retail business that stocks a range of everyday items, such as groceries, snack foods, confectionery, soft drinks, tobacco products, over‐the‐counter drugs, toiletries, newspapers, and magazines. It may be located alongside a busy road, in an urban area, near a railway station, in a gas/petrol station, or at a transport hub. They differ from general stores and village shops in that they are not located in a rural location and are used as a convenient supplement to larger stores. Convenience stores usually charge significantly higher prices than conventional grocery stores or supermarkets; however, they make up for this loss by having longer business hours, serving more locations, and having shorter cashier lines. Usually, they provide access to high‐fat food, sugary drinks, fast food, take‐away or snack food, and other unhealthy food options. 10 , 11 Previous research has reported mixed associations between convenience store access and childhood obesity. For example, the association between the density of convenience stores around a home with children's weight status was reported to be positive, 12 , 13 , 14 , 15 negative, 16 , 17 and not significant in different studies. 18 , 19 , 20 Similarly, the association between the proximity to convenience stores around a home with children's weight status was reported to be positive in some studies 21 , 22 , 23 but not significant in other studies. 24 , 25 , 26 , 27 , 28 , 29 To our knowledge, there has been no literature review focusing on the association between convenience store access and childhood obesity.
To fill this gap, this systematic review comprehensively investigated the association between convenience store access and weight‐related behaviors and weight status. We aimed to study potential patterns across all relevant studies by examining the characteristics of studies showing positive, negative, and nonsignificant associations. Also, subgroup analyses were conducted to examine the variation of this association by location, type of measures, and country. Findings from this study may inform future research and urban planning practices and policies to pay more attention to this type of food outlet, while creating healthy (food) environments and fighting the global obesity pandemic.
2. METHODS
A systematic review was conducted in accordance with the Preferred Reporting Items for Systematic Reviews and Meta‐Analyses (PRISMA). 30
2.1. Search strategy and literature screening
A literature search was conducted in PubMed, Embase, Web of Science, and Cochrane Library for all studies published prior to 1 January 2019. The search strategy included all possible combinations of three groups of keywords related to convenience stores, children, and weight‐related behaviors or outcomes (eg, diet, physical activity, and adiposity measures) (Appendix S2). Duplicate studies were removed before the screening process. Study selection took place in three phases. In phase 1, titles and abstracts were reviewed independently by two authors (J.X. and R.W.). The disagreement between two authors resulted in a third review and inclusion decision by L.Z. In phase 2, full‐text articles were obtained for abstracts that met the inclusion criteria, also for abstracts from which inclusion could not be determined. Each article was independently assessed by two authors (J.X. and R.W.) using the same inclusion criteria, and the disagreement was reconciled by L.Z. The agreement on inclusion was reached through discussion. In phase 3, the reference section of each included study was reviewed to identify additional studies that met inclusion criteria.
2.2. Study selection criteria
Studies that met all of the following criteria were included in the review: (1) study subject: children and adolescents aged <18; (2) study outcome: weight‐related behaviors (eg, diet intake, physical activity, and sedentary behavior) and/or outcomes (eg, overweight and obesity measured by body mass index [BMI, kg/m2], BMI z‐score, waist circumference, waist‐to‐hip ratio, and body fat); (3) study design: longitudinal studies, cross‐sectional studies, and randomized controlled trial (RCT); (4) article type: peer‐reviewed publications; (5) time of publication: from the inception of an electronic bibliographic database to 31 December 2018; and (6) language: written in English.
Studies that met any of the following criteria were excluded from the review: (1) studies that incorporated no measure of access to convenience stores or weight‐related behaviors/outcomes; (2) computer‐based simulation studies without the inclusion of human participants; (3) articles not written in English; or (4) letters, editorials, study/review protocols, or review articles.
2.3. Data extraction and preparation
A content abstraction form was used to collect key data on each publication included in the review, including author(s), year of publication, study area, sampling strategy, sample size, age at baseline, study design, follow‐up years, number of repeated measures, attrition rate, sample characteristics, statistical model, measure(s) of convenience store access, other environmental factors adjusted for in analyses, measures of weight‐related behaviors, measures of body weight status, and key findings on the association between convenience store access and weight‐related behaviors and/or outcomes. Two authors (J.X. and R.W.) independently extracted data from each included study, and discrepancies were resolved by L.Z. Bias ratings were assigned to each article in accordance with the guidelines of the Cochrane risk of bias assessment tool, 31 which outlines qualifications for high, low, or unclear risk of bias. For our included studies, biases considered included “incomplete outcome data” (ie, attrition bias), “selective reporting” (ie, response bias), and “other” categories of the tool. In cases that an author was uncertain about the level of risk for any of these categories, L.Z. provided an additional review of the article and assigned the final rating.
2.4. Study quality assessment
We used the National Institutes of Health's Quality Assessment Tool for Observational Cohort and Cross‐Sectional Studies to assess the quality of each included study. 31 This assessment tool rates each study on the basis of 14 criteria (Appendix S3). For each criterion, a score of 1 was assigned if “yes” was the response, whereas a score of 0 was assigned otherwise (ie, an answer of “no,” “not applicable,” “not reported,” or “cannot determine”). A study‐specific global score ranging from 0 to 14 was calculated by summing up scores across all criteria (Table S7). The study quality assessment helped to measure the strength of scientific evidence but was not used to determine the inclusion of studies.
3. RESULTS
3.1. Study selection
The process of inclusion and exclusion was shown in Figure 1. The initial search identified 783 abstracts for screening across databases. After excluding abstracts that were repeated across databases, 403 unique abstracts were reviewed. Through title and abstract screening, 343 articles were further excluded. The full texts of the remaining 60 articles were reviewed against the study selection criteria. Of these, 19 articles were excluded. The remaining 41 studies that met our inclusion criteria were included.
FIGURE 1.
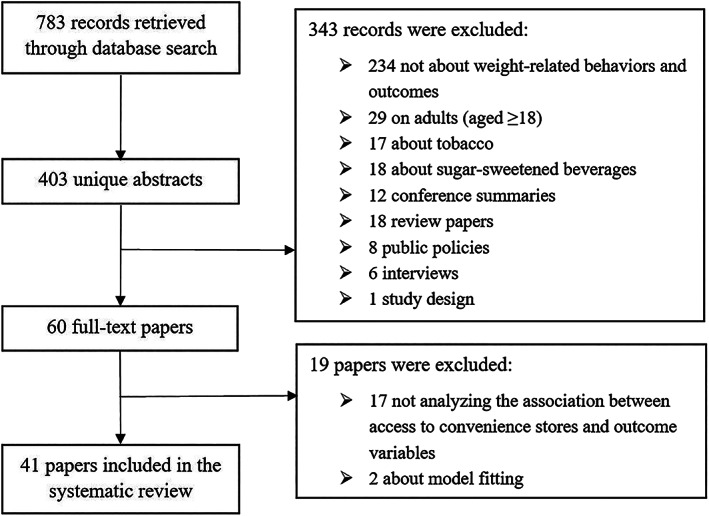
Study exclusion and inclusion flowchart
3.2. Study characteristics
The basic characteristics of 41 included studies were summarized in Table 1. Although the earliest study dated back to 2007, the majority (31 out of 41) of the included studies were published during 2011‐2017. The sample size ranged widely from 126 to >500 000. A total of 34 studies used BMI or BMI z‐score as outcome variables; 16 studies involved weight‐related behaviors. The included studies were conducted in four regions: North America (the United States and Canada), Western Europe (the United Kingdom and Ireland), East Asia (China, Japan, and South Korea), and Australia. Most studies were conducted in the United States (26/41), seven in Canada, two in China, one in each of Australia, Ireland, Japan, South Korea, and the United Kingdom, and one international comparative study in Canada, the United Kingdom, and the United States. Nineteen out of 41 studies were conducted at state/province (or equivalent) level, 10 at national level, eight at city level, and four at county level (Table S1). They were largely cross‐sectional studies (36/41), along with three longitudinal studies and two RCTs. The majority of the studies (30/41) were conducted on children aged 6 to 12. The data of most studies were from large‐scale research projects or surveys (31/41), such as “Early Childhood Longitudinal Study—Kindergarten Class (ECLS‐K)” and “California physical fitness test.”
TABLE 1.
Basic characteristics of 41 studies included in this study
| First Author (Year) | Study Area [Scale] | Sample Size | Age at Baseline (years) | Study Design | Sample Characteristics (Follow‐up Status for Longitudinal Studies and RCT) | Statistical Model |
|---|---|---|---|---|---|---|
| An (2012) 21 | Carolina, US [S] | 13 462 | 8226 aged 5‐11, 5236 aged 12‐17 in 2005‐2007 | [C] | The California Health Interview Survey (CHIS) | Binomial regression |
| Baek (2016) 32 | California, US [S] | 3 193 184 | Grade 7 in 2001‐2009 | [C] | California's 2001‐2009 Fitness Gram testing program | Hierarchical distributed‐lag models |
| Chen (2016) 33 | US [N] | 7090 | Grade 8 in 2004‐2007 | [L] | Nationally representative data from the fifth to eight grade years of the Early Childhood Longitudinal Study—Kindergarten Cohort (ECLS‐K) (followed up from 2004 to 2007 with an attrition rate of 10.7%) | Mixed‐effect models |
| Chiang (2011) 34 | Taiwan [S] | 2283 | 6‐13 in 2001‐2002 | [C] | Elementary school children's Nutrition and Health Survey in Taiwan (NAHSIT) | Multivariable linear regression |
| Choo (2017) 15 | South Korea [N] | 126 | 9‐12 in 2015 | [C] | Vulnerable children form “Development and effects of the Healthy Children, Healthy Families, Healthy Communities Program for Obesity Prevention among Vulnerable Children: Using the Ecological Perspective” | Logistic regression |
| Dengel (2009) 35 | Minneapolis, US [S] | 188 | 10‐16 in 2007 | [C] | Adolescents enrolled in the Trans‐disciplinary Research on Energetic and Cancer—Identifying Determinants of Eating and Activity (TREC‐IDEA) study | Multivariate linear regression models |
| Epstein (2012) 14 | US [C] | 191 | 8‐12 in 2005 | [R] | Participants included overweight or obese (>85th body mass index [BMI] percentile) in four randomized, controlled outcome studies, with 191 families who lived at addresses in Erie County, NY, from which we could calculate all the built environment variables The number of treatment sessions ranged from 16 to 20 in each study (followed up from 2005 to 2007) | Multilevel linear (or logistic) regression |
| Fiechtner (2013) 36 | Eastern Massachusetts, US [S] | 438 | 2‐6.9 in 2006‐2009 | [C] | Children with a BMI 85th percentile participating in an RCT (High Five for Kids study, a cluster‐randomized controlled trial) | Multivariable linear regression |
| Fiechtner (2015) 12 | Eastern Massachusetts, US [CT] | 49 770 | 4‐18 in 2011‐2012 | [C] | Pediatric patients' residences from 14 pediatrics practices in a large multisite, multispecialty physician group practice for well‐child care with a height and weight measurement | Multivariable linear regression |
| Galvez (2009) 24 | East Harlem, US [C] | 323 | 6‐8 | [C] | A 3‐y longitudinal study of East Harlem | NA |
| Ghenadenik (2017) 16 | Quebec, Canada [S] | 391 | 8‐10 in 2005‐2008 | [L] | From Quebec Adipose and Lifestyle Investigation in Youth (QUALITY) (followed up from 2005 to 2008 with two repeated measures) | Multivariable regression |
| Gilliland (2012) 37 | London, Canada [C] | 1048 | 10‐14 in 2011 | [C] | Students at 28 schools | Multilevel structural equation modeling |
| Grafova (2008) 38 | US [N] | 2482 | 5‐18 in 2002‐2003 | [C] | The second wave of the Child Development Supplement (CDS‐II) of the Panel Study of Income Dynamics (PSID) | Logistic regression |
| Hager (2017) 39 | Baltimore, Maryland, US [C] | 634 | Grades 6‐7 in 2009‐2013 | [C] | Early adolescent girls (mean age 12.1 y; 90.7% African American; 52.4% overweight/obese), recruited from 22 urban, low‐income schools | Multiple linear regression |
| Harrison (2011) 34 | Norfolk, UK [S] | 1995 | 9‐10 in 2007 | [C] | From the SPEEDY study (Sport, Physical activity and Eating behavior: Environmental Determinants in Young people) | Multilevel regression |
| He (2012) 22 | Ontario, Canada [S] | 810 | 11‐14 in 2006‐2007 | [C] | Students at 21 elementary schools | Generalized linear regression |
| Heroux (2012) 40 | Canada, Scotland, US [N3] | 26 778 (15 532 in Canada, 4697 in Scotland, and 6867 in the United States) | 13‐15 in 2009‐2010 | [C] | From three countries that participated in the Health Behavior in School‐aged Children (HBSC) survey | Multilevel logistic regression |
| Ho (2010) 41 | Hong Kong, China [S] | 34 369 | 7‐13 in 2006‐2007 | [C] | Part of the Hong Kong Student Obesity Surveillance (HKSOS) project | Logistic regression |
| Howard (2011) 42 | California, US [S] | 416 822 | Grade 9 in 2007 | [C] | From California Department of Education, which administers a physical fitness test (FITNESSGRAM) | Linear regression |
| Hulst (2012) 43 | Quebec, Canada [S] | 512 | 8‐10 in 2005‐2008 | [C] | Data from QUALITY (Quebec Adipose and Lifestyle Investigation in Youth) |
Multivariable logistic regression Generalized estimating equations |
| Hulst (2015) 18 | Quebec, Canada [S] | 512 | 8‐10 in 2005‐2008 | [L] | Quebec youth with a history of parental obesity (QUALITY study [Quebec Adipose and Lifestyle Investigation in Youth]) (followed up from 2005 to 2008 with an attrition rate of 9.7%) | Linear regression |
| Jago (2007) 13 | Greater Houston, US [C] | 204 | 10‐14 in 2003 | [C] | Boy Scout Troops | Linear regression |
| Jilcott (2011) 44 | North Carolina, US [S] | 744 | 8‐18 in 2007 to 2008 | [C] | Brody School of Medicine electronic medical records for pediatric patients with a home address listed with a Pitt County zip code at the ECU Pediatric Outpatient Clinic | Multivariate regression |
| Keane (2016) 45 | Ireland [N] | 8568 | 9 in 2007‐2008 | [C] | Child cohort of the Growing Up in Ireland (GUI) cohort study | Separate fixed effects regression models |
| Koleilatl (2012) 46 | Los Angeles County, US [CT] | 538 555 | 3‐4 in 2008 | [C] | Participants in the special supplemental nutrition program for Women, Infants and Children (WIC) | Linear regression |
| Langellier (2012) 47 | Los Angeles County, US [CT] | 1694 | Grades 5, 7, 9 in 2008‐2009 | [C] | California Department of Education (CDE) physical fitness testing program | Multilevel linear regression |
| Laska (2010) 26 | Minneapolis, US [S] | 349 | 11‐18 in 2007 | [C] | Participation in the identifying determinants of eating and activity study | Generalized estimating equations |
| Le (2016) 27 | Saskatoon, Canada [C] | 1469 | 10‐14 in 2011 | [C] | Smart cities, healthy kids: food environment study in 2011 | Logistic regression |
| Lee (2012) 48 | US [N] | 5350 | 3‐5 in 1999‐2004 | [C] | Early Childhood Longitudinal Study in Kindergarten Cohort (ECLS‐K) | Multilevel linear regression |
| Lent (2014) 49 | US [C] | 767 | Grades 4‐6 in 2008‐2010 | [R] | All fourth to sixth grade students from 10 schools in low‐income neighborhoods in Philadelphia were eligible to participate (followed up from 2008 to 2010 with two repeated measures and an attrition rate of 20.5% an attrition rate of 3.0%) | Generalized linear mixed models |
| Leung (2011) 50 | North Carolina, US [S] | 444 | 6 or 7 in 2005 | [L] | From the Cohort Study of Young Girls' Nutrition, Environment and Transitions (CYGNET) (followed up from 2005 to 2008 with three repeated measures and an attrition rate of 20.5%) | Generalized linear and logistic regression |
| Li (2015) 19 | Alabama, US [CT] | 613 | 4‐13 in 2013 | [C] | African American students in four elementary schools in a rural county (Black Belt region, BBR) | Multilevel linear (or logistic) regression |
| Matanane (2017) 51 | Guam, US [S] | 466 | 2‐8 in 2012‐2013 | [C] | Children were recruited from Head Start, Elementary Schools, and Community Centers in the five communities | Logistic regression |
| Melanie (2012) 52 | Minneapolis, US [S] | 2682 | 14.5 in 2009‐2010 | [C] | Data from Eating and Activity in Teens (EAT) 2010 |
Multivariable linear regression Spatial latent class analysis |
| Ohri‐Vachaspati (2013) 28 | New Jersey, US [C4] | 702 | 3‐18 in 2009‐2010 | [C] | Households having at least one child in four New Jersey cities (Camden, New Brunswick, Newark, and Trenton) | Logistic regression |
| Powell (2007) 53 | US [N] | 73 079 | Grades 8 and 10 in 1997‐2003 | [C] | Students from Monitoring the Future Survey (MFT) study | Empirical model |
| Sanchez (2012) 54 | California, US [S] | 926 018 | Grades 5, 7, 9 in 2007 | [C] | The 2007 California physical fitness test (also known as “Fitness gram”) | Log‐binomial regression |
| Sakai (2013) 55 | Japan [N] | 378 350 | 5‐17 in 2008 (72 380 aged 5; 270 720 aged 6‐11; 225 600 aged 12‐14; 126 900 aged 15‐17) | [C] | “School Health Survey” of The Japanese Ministry of Education, Culture, Sports, Science and Technology since 1948 | Generalized linear regression |
| Seliske (2009) 56 | Canada [N] | 9672 | Grades 6‐10 in 2005‐2006 | [C] | Health Behavior in School‐aged Children (HBSC) survey | Multilevel logistic regression |
| Shier (2012) 20 | US [N] | 6260 | Grades 5‐8 in 2004 | [C] | From the Early Childhood Longitudinal Study—Kindergarten Class (ECLS‐K) | Multivariable linear regression |
| 9610 | Grade 8 in 2007 | [C] | From ECLS‐K | |||
| Timperio (2008) 57 | Australia [N] | 801 | 340 aged 5‐6, 461 aged 10‐12 in 2002‐2003 | [C] | School children | Logistic regression |
Study scale: [N]: national; [S]: state (US) or equivalent unit (eg, province in China); [Sn]: n states or equivalent units; [CT]: county or equivalent unit; [CTn]: n counties or equivalent units; [C]: city; [Cn]: n cities. Study design: [C]: cross‐sectional study; [L]: longitudinal study; [R]: randomized controlled trial.
3.3. Measures of convenience store access
The access to convenience stores in most studies was measured as the number/density of convenience stores within an administrative unit (or a catchment) and/or the proximity to the nearest convenience store in straight‐line or road‐network distances (Table 2). Data on convenience stores were mainly defined according to the North American Industry Classification System (NAICS) codes and obtained from geographic information systems (GISs) data sources or spatialized according to street addresses or (x,y) coordinates, such as Yellow Pages directories and InfoUSA.
TABLE 2.
Measures of access to convenience stores (CSs), weight‐related behaviors, and weight status in 41 included studies
| First Author (Year) | Measures of Access to CS | Other Environmental Factors Adjusted for in the Model | Measures of Weight‐related Behavior | Measures of Weight‐related Outcomes |
|---|---|---|---|---|
| An (2012) 21 |
• ArcMap is used to draw circular buffers with four different radii (0.1, 0.5, 1.0, and 1.5 miles), centered at students' schools and residences • Food outlet data is geocoded to latitude/longitude and overlaid over the buffers, and neighborhood food environment is constructed as the counts of a particular type of food outlet located within each buffer |
• Fast food restaurants • Small food stores • Grocery stores • Large supermarkets |
• Consumption of fruits, vegetables, juice, milk (only for children), soda, high sugar foods, and fast food on the day before the interview was self‐reported for adolescents, and parents reported for children | • Parent‐reported (for children) and self‐reported (for adolescents) height and weight are used to calculate age‐ and gender‐specific BMI percentile |
| Baek (2016) 32 | • Data of convenience stores were purchased from the National Establishment Time‐Series Database (Walls & Associates, Denver, Colorado) | • Urban and suburban assembly districts | NA | NA |
| Chen (2016) 33 | • ZIP‐Code Business Patterns data from the Census Bureau |
• Supermarkets • Limited‐service restaurants • Small‐size grocery |
NA | • Children's body weight and height were measured twice during interviews using standing scale |
| Chiang (2010) 34 | • School addresses were obtained from the NAHSIT data and transferred to a geocoded database using a Geo Gadget designed by the Center for GIS, Academia Sinica, Taiwan | • Region (Hakka; mountainous; Eastern; Penghu; Northern 1‐3; Central 1‐3; Southern 1‐3) |
• Conducted face‐to‐face household interviews to obtain information regarding nutritional attitudes and behaviors, as well as physical activity and diet • The Youth Healthy Eating Index—Taiwan (YHEI‐TW), a scoring system modified from the US YHEI, was used to assess the children's dietary quality |
• Anthropometrics conducted at the schools |
| Choo (2017) 15 |
• Food and activity outlets were captured as geometric points within a 200‐m buffer via direct observations during a walking survey and GIS technology • Sixteen walking survey teams were organized for the 16 buffers corresponding to the community child centers |
• Density and distance of food outlets (fast food outlets, fruit/vegetable outlets including supermarkets and large grocery stores) within a 200‐m Euclidean buffer |
• Eating behaviors comprised fast food, sugar‐sweetened beverage, and fruit/vegetable consumptions, which were self‐reported • Activity behaviors comprised both physical activity and sedentary behaviors, which was self‐reported in response to the question |
• Children's body weight and height were measured using standing scale |
| Dengel (2009) 35 |
• GIS technology was used to calculate the distance to and density of restaurants, food stores, and sources of physical activity from a participant's house • Distances and density were calculated by network and straight‐line route, and buffer distances ranged from 800 m to 3000 m |
• Distance to and density of pedestrian infrastructure features (eg, transit stops) • Land‐use mix (eg, percent land used for commercial business) • Street pattern (eg, median block size) • Restaurants, food stores • Sources of physical activity |
• Participators have a fasting blood sample drawn in addition to measures of weight, height, percent fat, and blood pressure | • The Metabolic Syndrome (MetS) cluster score was derived by calculating the sum of the sample‐specific z‐scores from the percent body fat, fasting glucose, high density lipoprotein cholesterol (negative), triglyceride, and systolic blood pressure |
| Epstein (2012) 14 |
• Child's address was geocoded to a unique parcel in a land parcel data • Seven neighborhood environment variables were chose to reflect density, diversity, and design of the neighborhood built environment within 0.5 miles along the street network of each child's residence |
• Housing units per residential acre, number of intersections/mile • Amount of park area and the amount of park plus other types of recreational area • Number of supermarkets, grocery stores |
NA |
• BMI was calculated from height and weight • All treated children were greater than the 85th BMI percentile |
| Fiechtner (2013) 36 |
• Each participants' residential address was geocoded. Food establishments were categorized on the basis of definitions of the North American Industry Classification System • Distances along the street network were calculated using the ArcGIS software Network Analyst Extension Closest Facility tool and StreetMap USA detailed streets |
• Distance to fast food restaurants | NA | • BMI obtained from the child's electronic medical record measured by a clinical assistant at the annual well‐child visit |
| Fiechtner (2015) 12 |
• Using the ArcGIS Network Analyst Extension Closest Facility tool and StreetMap USA detailed streets • Used geographical information systems software to map addresses of food establishments and the most recent residential address for each subject |
• Five other food establishment categories. (1) large supermarkets; (2) small supermarkets; (3) fast food restaurants; (4) full‐service restaurants; (5) bakeries, coffee shops, and candy stores | NA | • BMI z‐score obtained from the electronic health record |
| Galvez (2009) 24 |
• Food store data were collected via comprehensive walking survey of East Harlem Zip codes 10029 and 10035 • Food stores were classified as per the North American Industry Classification System (NAICS 2002) |
• Specialty stores • Grocery stores • Supermarkets • Fast food restaurants • Restaurants |
NA |
• Anthropometry was conducted with a standardized protocol • Age‐ and sex‐specific body mass index (BMI) percentiles computed on the basis of the 2000 CDC Growth Charts for the United States |
| Ghenadenik (2017) 16 |
• Participants' residential neighborhoods were assessed at baseline • Using the QUALITY Neighborhood on‐site audit tool |
• Built environment features at baseline (traffic‐calming features, pedestrian aids, disorder, physical activity facilities, convenience stores, and fast food restaurants) | • An interviewer‐administered questionnaire for children and self‐administered questionnaires for parents related to lifestyle behaviors and health outcomes were completed | • Biological and physiological measurements were taken by trained nurses |
| Gilliland (2012) 37 | • Previously validated databases of every fast food outlet and convenience store were provided by the Middlesex‐London Health Unit |
• Recreation opportunities • Fast food restaurants |
NA |
• Self‐reported height and weight • BMI z‐scores were calculated to control for differences by age and sex |
| Grafova (2008) 38 |
• These measures were created from linkage to several secondary data bases: the (a) 2000 Census, (b) 2002 Economic Census, (c) 2002 Uniform Crime Reporting (UCR) Program Data maintained by Federal Bureau of Investigation (FBI), (d) 2002 Fatality Analysis Reporting System (FARS) of National Highway Traffic Safety Administration, (e) 2000 Topologically Integrated Geographic Encoding and Referencing system (TIGER) • Convenience store density: total number of convenience stores per 10 000 population (2002 Economic Census, Geography level: county) |
• Population density • Urban design • Pedestrian fatality from motor vehicle crashes • Restaurant density and grocery store |
NA |
• Both weights and heights of children were measured and BMI was calculated • Children were classified as being overweight if their BMI was above the 95th percentile of the gender‐age specific BMI distribution from Center for Disease Control Growth Charts |
| Hager (2017) 39 | • Participants were geocoded using the ArcGIS geographic information system (GIS) | NA | • Dietary patterns were measured with the Youth/Adolescent FFQ (YAQ) | • BMI was calculated from weight and height measured using standardized procedures |
| Harrison (2011) 25 |
• Participants provide their precise location of home • An on‐foot grounds audit was undertaken at all participating schools and identified the location of all entrances to the school grounds • Food outlets were classified as healthy (supermarkets and greengrocers) or unhealthy (convenience stores and take‐aways) using the typology of Rundle et al (2009) and were delineated using the ArcGIS 9.2 package |
• Supermarkets • Fast food restaurants |
NA | • Anthropometrics conducted using standardized procedures |
| He (2012) 22 | • Survey respondents reported a valid home postal code, which was geocoded to the geographic center of the home postal code | NA |
• Children's eating behaviors were measured via an FFQ, the “Block Kids 2004 FFQ,” previously validated for use among youths aged 10 to 17 y • A comprehensive index, the modified Healthy Eating Index‐2005 (HEI‐2005), was calculated to reflect participants' overall diet quality |
NA |
| Heroux (2012) 40 | • The number and density of CS located within 1 km of the participants' schools within each country were extracted using Yellow Pages directories |
• Chain fast food restaurants • Cafe |
• Lunchtime eating behaviors were self‐reported | • Weight and height were self‐reported. The BMI was calculated, and the age‐ and sex‐specific BMI cut‐points advocated by the International Obesity Task Force |
| Ho (2010) 41 | • The perceived presence of McDonald's, KFC, Hong Kong–style fast food shops, Chinese, Western and Hong Kong–style restaurants and 24‐h convenience stores near home was assessed by asking whether available within a 5‐min walking distance from home | • Food shops (McDonald's, KFC, Hong Kong–style fast food shops, Chinese, Western, and Hong Kong–style restaurants) |
• Self‐reporting questionnaire • Dietary intakes, included intake of high‐fat foods, junk food/soft drinks, fruit, and vegetables |
• Weight status, age, and sex‐standardized BMI z‐scores were derived, on the basis of self‐reported weight and height |
| Howard (2011) 42 |
• Environmental Systems Research Institute, Inc (ESRI), was used to construct variables for the presence/absence of three classes of retailers near schools: (1) fast food restaurants, (2) convenience stores, and (3) supermarkets • The point locations of the schools were geocoded with the Street map USA (2006) dataset provided by ESRI, based on street addresses |
• Urban/nonurban location | NA | • Students' body composition measured by skin fold (preferred method), body mass index, or bioelectric impedance analyzers |
| Hulst (2012) 43 |
• The exact addresses of each participating child's residence and school were measured using a GIS • Neighborhood food environments were described by proximity‐ and density‐based indicators. Proximity measures were established using ArcGIS Network Analyst and defined as the road‐network distance between the child's residence and food outlets |
• Supermarket • Fast food restaurant • Specialty food stores (eg, bakeries, fruit and vegetables, gourmet, meat, and fish markets) |
• Three 24‐h diet recalls were used to assess dietary intake of vegetables and fruit and sugar‐sweetened beverages • Questionnaires were used to determine the frequency of eating/snacking out and consumption of delivered/take‐out foods |
NA |
| Hulst (2015) 18 | • Neighborhood environments were characterized using a geographic information system (GIS) for area overlapping 500‐m network buffers centered on the child's residential address |
• Neighborhood characteristics (disadvantage, prestige, and presence of parks, and fast food restaurants) |
• Intake of sugar‐sweetened beverages was measured using mean values of three 24‐h diet recalls |
• At the baseline clinic visit, parental anthropometrics were measured • Required participating children to have at least one obese biological parent based on parent‐reported measurements of weight, height, and waist circumference |
| Jago (2007) 13 |
• The density of small food stores within a 1.6‐km straight‐line buffer around the individual's residence (small food store was defined as any of convenience store [445120], large supermarket [445110], drug store [446110], vegetable or fruit store [445230], and warehouse club [452910]) [SIC code] • Home address was geocoded |
• Supermarket, drug store, meat, fish, vegetable or fruit, and warehouse club • Full‐service restaurant, cafeteria, and fast food restaurant |
• Fruit, juice, and vegetable consumption were assessed using the Cullen Food Frequency Questionnaire that assesses consumption of four juices, 17 fruits, and 17 vegetables • Fruit and vegetable home availability was assessed using the Girls Health Enrichment Multi‐site Studies (GEMS) scale |
• BMI based on measured height (to the nearest 0.1 cm) and weight (to the nearest 0.1 kg) • BMI percentile was computed |
| Jilcott (2011) 44 |
• Addresses for various food venues from North Carolina Department of Environmental Health records (from 2008), Reference USA business database (www.referenceusa.com) and ascertaining uncertain addresses by ground‐truthing • GIS database was constructed for participants and food venues and participant's accessibility to food venues |
• Rural/urban residence • Farmers' markets/produce markets |
NA | • BMI percentile specific for age and gender was calculated from measured BMI as recorded in the medical records |
| Keane (2016) 45 | • Used handheld GPS devices during fieldwork to record the coordinates of each participating child's household and used a complete database of residential and commercial addresses (https://www.geodirectory.ie/) to document the coordinates of all supermarkets and convenience stores located |
• Supermarkets • Network‐based travel distances |
• Dietary intake was assessed using a short, 20‐item parent‐reported food frequency questionnaire and was used to create a dietary quality score (DQS) whereby a higher score indicated a higher diet quality | NA |
| Koleilat (2012) 46 |
• The InfoUSA Business File from ESRI (Redlands, CA) was utilized to assess the retail food environment, produces vendors according to the North American Industry Classification System (NAICS) code • Businesses with NAICS code 44512001 were included as CS |
• Fast food restaurants • Supermarkets • Other grocery stores |
NA | • Height and weight conducted using standard protocol |
| Langellier (2012) 47 | • The location was purchased from the Dun & Bradstreet commercial information service |
• Fast food restaurants (chain and nonchain fast food restaurants, chain and nonchain pizza restaurants, chain sandwich restaurants, delicatessens) • Corner stores (nonsupermarket grocery stores, and liquor stores) |
NA | NA |
| Laska (2010) 26 | • Geographic information systems data were used to calculate the distance to and density of food outlets around the participants' homes and schools |
• Restaurants (including fast food) • Grocery stores and any retail facilities |
• Participants completed 24‐h dietary recalls and reported diet‐related behaviors | • Weight and height measured with a standardized protocol |
| Le (2016) 27 |
• Using ArcGIS, the locations of food outlets were geocoded, along with the children's home addresses • The Nutrition Environment Measures Survey (NEMS)‐Stores and the NEMS‐Restaurants were used to measure availability, quality, and relative price of healthy food items in stores and restaurants |
• Proximity to a food outlet (grocery stores, fast food restaurants) • Density of food outlets within the 500‐ and 800‐m network buffer zones |
NA | • The inputs for calculating the body mass index (BMI) were measured height and weight, and the instrument used was the age‐ and sex‐specific BMI calculator from the WHO |
| Lee (2012) 48 | • Based on the North American Industry Classification System (NAICS) codes capturing the food retail context of neighborhoods | • Neighborhood level and the food environment/school level | NA | • Height and weight measurements were taken twice by interviewers |
| Lent (2014) 49 |
• Corner stores were businesses that primarily sold food and beverages, had one to four aisles, and had only one cash register • Owners signed a letter specifying that if randomized to a treatment cluster, they would (1) display marketing materials provided by the study; (2) stock a minimum number of products targeted by the intervention; and (3) group healthier items for easy identification. Storeowners were paid $200 per year for their participation and were introduced to study staff, who wore identifiable clothing (shirts and/or jackets) and stood outside of corner stores to collect intercepts • A “school‐store” cluster was defined as one school and its surrounding corner stores within a 4‐block radius. From the pool of 10 enrolled schools, five schools and their proximal corner stores (n = 12) were randomized to the intervention and five schools and their proximal corner stores (n = 12) were randomized to an assessment‐only control. Students were not blind to their status as an intervention school • Intervention components: There were three main intervention components. First, the intervention included classroom‐based nutrition education lessons on identifying healthy snacks (ie, fruit, single‐serving packages, and water), energy intake, tracking consumption, goal‐setting, and label reading taught by project staff (seven 45‐min lessons). Second, a branded social marketing campaign communicated messaging regarding healthy eating and well‐being. The Snackin' Fresh logo was imprinted on small giveaways and banners and was displayed in corner stores. A branded Web site, comic book, and video were also developed. Third, corner store‐level initiatives included storeowner trainings, adding healthier items, and signage identifying healthy items |
NA |
• Intercept surveys directly assessed the nutritional characteristics of students' corner store purchases at baseline and 1 and 2 y • The energy content (calories) of corner store purchases made by students was based on directly intercepting students outside of the 24 corner stores |
• Students' weight and heights were measured at baseline and 1 and 2 y • BMI, BMI z‐score, and BMI percentile used a standardized protocol to collect weight and height data in schools on consented students |
| Leung (2011) 50 | • Neighborhood food stores were identified from a commercial database and classified according to industry codes in 2006 | • Drug stores, fast food restaurants, full‐service restaurants, specific food store venues, specialty stores, small grocery stores, supermarkets, super‐centers, and produce vendors/farmer's markets | NA | • Height and weight were measured at clinic visits |
| Li (2015) 19 |
• Food outlets and children's home addresses were geocoded and distances from stores to children's home were obtained with ArcGIS • The sizes of these stores were measured on Google Earth |
• Fast food store • Supermarket • Full‐service restaurant |
NA |
• Both self‐reported and measured anthropometric measures were used to calculate BMI according to the sex‐ and age‐specific growth • Assigned the following percentile classifications: normal weight (≤84th), overweight (85th‐94th), and obese (≥95th) |
| Matanane (2017) 51 | • Community food stores were surveyed by CHL staff using the Communities of Excellence in Nutrition, Physical Activity, and Obesity Prevention (CX3), Food Availability and Marketing Survey and Store Environment Walkability Survey | NA | • Fruit/vegetable (FV) and energy intake of child participants were collected using a 2‐d Food and Activity Log (FAL), completed by the parent/caregiver | • Height and weight were measured on standardized procedures, protocols and tools |
| Melanie (2012) 52 |
• Density of and distances to the food outlets measured using GIS • GIS neighborhood variables were created uniquely for each participant using buffers centered at the participant's home address • Densities were calculated using 1600‐m buffers centered at a participant's home and dividing the total number of destinations by the land area |
• Away‐from‐home food and recreation accessibility • Community disadvantage, green space, retail/transit density, and supermarket accessibility |
NA | • Height and weight were measured |
| Ohri‐Vachaspati (2013) 28 | • Access to elements of the environment was measured by proximity of food and physical activity (PA) outlets to each individual child's residence. Proximity was measured in multiple ways using geocoded data |
• Supermarkets, small grocery stores, specialty stores, and limited service restaurants (referred to as fast food restaurants) • Private and public PA facilities and parks (larger than one acre) |
NA | • Parent‐measured heights and weights |
| Powell (2007) 53 | • Data on food store and restaurant outlets were obtained from a business list developed by Dun and Bradstreet (D&B) | • Density of food store and restaurant outlets | NA | • BMI based on self‐reported height and weight |
| Sanchez (2012) 54 | • Using GIS, the number and locations of fast food restaurants or CS within a half mile buffer were merged with school locations to obtain the count of food outlets within the school buffer | • Fast food restaurants | NA | • Direct measure children's weight, height, and physical fitness |
| Sakai (2013) 55 | • Data related to environmental factors were obtained from the annual reports of social welfare indicators of the Statistics Bureau, Ministry of Internal Affairs and Communications, Japan |
• Food and drink stores, restaurants, large‐scale retail stores • Total real length of roads, population density, total owned passenger cars |
NA | • Height and weight are measured by school nurses in early April |
| Seliske (2009) 56 | • Location and type of food retailers surrounding schools were obtained through an internet‐based food retailer database (www.yellow.ca) |
• Full‐service restaurants • Fast food restaurants • Sub/sandwich retailers • Doughnut/coffee shops • Grocery stores |
NA | • BMI was calculated on the basis of self‐reported weight and height |
| Shier (2012) 20 |
• Food outlet data came from InfoUSA • Various types of food outlets were selected on the basis of the North American Industry Classification System (NAICS) codes |
• Counts of a particular type of food outlet (restaurants, small food stores, grocery stores, medium‐sized food stores, and supermarkets) | NA | • Height and weight were measured twice in each wave |
| Timperio (2008) 57 | • Food outlets within 800 m from each child's home were computed using a GIS | • Greengrocers; supermarkets; fast food outlets; restaurants, cafés, and take‐away outlets | • Parents were asked how often their child usually ate 14 different fruits or types of fruit and 13 different vegetables or types of vegetables in the last week, excluding potatoes. These items were adapted from the National Nutrition Survey | • NA |
Note. CS, convenience store; GISs, geographic information systems; SIC code, Standard Industrial Classification code; straight‐line buffer, a regular (eg, circular) zone with a certain radius around a given address/location or a street to represent a catchment or influential area of that address/location or street; road‐network buffer, an irregular zone around a given address/location where it covers the same distance (or takes the same time) to travel from any point on the boundary of the zone to that address/location along the shortest road‐network path.
3.4. Convenience store access and weight‐related behaviors
Among 11 studies that reported the association between convenience store access in the neighborhood and weight‐related behaviors, findings were rather consistent: Nine reported a positive association, two reported no significant association, and none reported a negative association. For girls and children living in low‐income neighborhoods, convenience store access was positively associated with unhealthy eating behaviors (eg, eating/snacking out and consumption of fast food, sugar‐sweetened beverage, and delivered/take‐out foods). A positive association was found in most studies in the United States and the United Kingdom while no significant association was found in Canada and East Asia (Table 3).
TABLE 3.
Associations of convenience stores (CSs) with children's weighted‐related behaviors and weight status in 41 included studies
| First Author (Year) | Associations of CS with Weight‐related Behaviors/Outcomes | Main Findings of Weight‐related Behaviors/Outcomes |
|---|---|---|
| An (2012) 21 | NA | • This study found no evidence to support the hypotheses that less exposure to fast food restaurants or convenience stores within walking distance improve diet quality or reduce BMI among Californian youth |
| Baek (2016) 32 | • The overall association between number of CS within ½ mile of schools and children's body weight was 0.004 BMIz units per additional store within ½ mile (95% CI, −0.002 to 0.009) using the traditional multilevel model and 0.004 BMIz units per additional store (95% CI, 0.001‐0.007) using the HDLM | • BMI‐CS associations were strongest in urban and suburban ADs, although the relevant distances for the associations were greater in more central‐city areas than suburban areas |
| Chen (2016) 33 | • For boys, the analysis indicated a positive association between quantity of CS in neighborhood and their BMI level | |
| Chiang (2010) 34 | NA | • None of CS was associated with children overweight |
| Choo (2017) 15 |
• Children exposed to a high density of CS were significantly more likely to consume fast foods (adjusted OR = 1.47; 95% CI, 1.068‐2.035) and significantly less likely to participate in physical activity (adjusted OR = 0.66; 95% CI, 0.433‐0.992) • Children with longer distances to CS were significantly less likely to consume fast foods (adjusted OR = 0.98; 95% CI, 0.973‐0.993) and sugar‐sweetened beverages (adjusted OR = 0.98; 95% CI, 0.968‐0.998) |
NA |
| Dengel (2009) 35 |
• The distance to convenience/gas stations was significantly (rho = −0.1634, 0.03) related to the MetS cluster score and HDL‐C (rho = 0.1562, 0.03) • Males showed no significant association, yet females had a negative association between the MetS cluster score and the distance to CS increased (β = −0.0003, 0.05) |
NA |
| Epstein (2012) 14 |
• Living in reduced access to CS would be predicted to have 1.3‐fold greater BMIz reduction more than 2 y than those living in an area with easy access ≥10 CS • Number of CS (0.014) was significant predictors of BMIz over time beyond the effects of treatment condition • Greater BMIz reduction was associated with living in environments with low number of CS at 6 (0.0065) and 12 (0.018) months • These analyses showed BMIz differences for −0.31 vs −0.24 BMIz units for access to no versus ≥10 CS |
• CS offers access to take‐away or snack foods and was correlated with increased obesity in prior studies and negatively impact weight control |
| Fiechtner (2013) 36 | NA | • CS was not associated with child BMI |
| Fiechtner (2015) 12 | NA | • Neighborhood median income was an effect modifier; CS and full‐service restaurants had a stronger adverse effect on BMI z‐score in lower‐income neighborhoods |
| Galvez (2009) 24 | • Children living on a block with CS ≥1 (range 1‐6) were more likely to have a BMI percentile in the top tertile (OR = 1.90; 95% CI, 1.15‐3.15), compared with children having no CS | NA |
| Ghenadenik (2017) 16 | • Children living in areas with at least one CS had lower BMIz (β = −0.303; 95% CI, −0.451 to −0.155) | • Contrary to our expectations, presence of CS was associated with lower BMI z‐scores but not with waist‐height ratio following adjustment for potential confounders. An explanation for these findings may be the use of a “crude” classification that categorizes fast food restaurants and convenience stores as unhealthy food sources as opposed to healthy food sources |
| Gilliland (2012) 37 | • The indicators for “presence of CS” in the home environment had no significant effect on the outcome variable (0.190, P > 0.05) | NA |
| Grafova (2008) 38 | • Children living in a neighborhood with higher CS density were more likely to be overweight (OR = 1.3, P < 0.05) | NA |
| Hager (2017) 39 | • Living near one to three corner/CS was marginally associated with an increase in consumption of snacks and desserts (0.087) and living near four or more corner or CS was associated with a statistically significant increase in consumption of snacks and desserts (based on normalized outcome; β = 0.16, 0.003), compared with no corner/CS near home, when adjusting for age and BMI‐for‐age z‐score | NA |
| Harrison (2011) 25 | NA | • Among girls, better access to unhealthy outlets (take‐aways and CS) around homes and schools was associated with higher FMI |
| He (2012) 22 | • Students with ≥1 km between their home, or attending schools and the nearest CS had higher Healthy Eating Index (HEI) scores than those living <1 km (P < 0.01) | NA |
| Heroux (2012) 40 | NA | • Irrespective of country (United States, Canadian, and Scottish), no statistically significant associations were observed between the CS and weight status |
| Ho (2010) 41 | • Perceived availability of CS was positively associated with moderate/high consumptions of high‐fat foods (OR = 1.15; 95% CI, 1.08‐1.23) and junk food/soft drinks (OR = 1.10; 95% CI, 1.04‐1.17) | NA |
| Howard (2011) 42 | • The presence of a CS <800‐m network buffer of a school is predicted to increase the percentage of overweight students by 3.5% (95% CI, 1.9‐5.2), and near a school is predicted to increase its overweight rate by 1.2% | NA |
| Hulst (2012) 43 |
• Associations were found for CS, the lowest density compared with the highest density indicating a 56% (OR = 0.44; 95% CI, 0.25‐0.80) lower likelihood of eating/snacking out • Among children living >1.5 km from the residential density of CS remained positively associated with eating/snacking out |
NA |
| Hulst (2015) 18 | • Recursive partitioning yielded seven subgroups with a prevalence of obesity equal to 8%, 11%, 26%, 28%, 41%, 60%, and 63%, respectively. The two highest risk subgroups comprised (i) children not meeting physical activity guidelines, with at least one BMI‐defined obese parent and two abdominally obese parents, living in disadvantaged neighborhoods without parks and (ii) children with these characteristics, except with access to ≥1 park and with access to ≥1 convenience store | • Among children living in socioeconomically disadvantaged neighborhoods, namely, access to parks and CS, further determined obesity |
| Jago (2007) 13 | NA | • CS was not associated with child weight‐related behavior |
| Jilcott (2011) 44 | • Proximity to the closest CS was negatively correlated with BMI percentile (r = −0.07, 0.0725). The differences between the inverse association between proximity to CS and BMI percentile were statistically significant (P < 0.05) except between African American and White youth (0.20) | NA |
| Keane (2016) 45 |
• Mean dietary quality score (DQS) was higher in those who lived furthest from their nearest CS (P < 0.001) • The number of CS within 1000 m of the household was associated with dietary quality in girls though the effect size was small, and CS within a 500‐m radius of the household was not associated with dietary quality |
• Individual‐ and family‐level factors influence food behaviors. Lower household socioeconomic indicators were associated with a lower dietary quality in this study |
| Koleilatl (2012) 46 |
• The number of CS increased significantly across quartiles of obesity for 3‐ to 4‐year‐old children • Rates of childhood obesity were highest in communities with more CS |
• CS is associated with early childhood overweight and may be a source of excess calories for children in low‐income households |
| Langellier (2012) 47 |
• The association between the presence of a corner store and overweight prevalence differed significantly between majority‐Latino schools and schools that were majority‐white or that had no racial/ethnic majority • Overweight prevalence was 1.6 percentage points higher at majority‐Latino schools that had at least one corner store within a half‐mile than at majority‐Latino schools that did not have a corner store within a half‐mile |
NA |
| Laska (2010) 26 | • BMIz and percentage body fat were positively associated with the presence of a CS <1600‐m residential buffer (BMIz: β = 0.26; 95% CI, 0.05‐0.48; percentage body fat: β = 2.17; 95% CI, 0.44‐3.91) | NA |
| Le (2016) 27 | NA |
• The distance and the density of food outlets around children's homes were not associated with odds of overweight/obesity • Lower prices for healthy food options in CS were associated with decreased odds of overweight or obesity |
| Lee(2012) 48 | • Increased CS exposure over time seems to have the largest positive association with upward shifts in BMI percentile, but the estimate is not significant at the 5% level | NA |
| Lent (2014) 49 |
• There were no significant differences between control and intervention corner store purchases in fat, sodium, carbohydrate, sugar, protein, or fiber at baseline and year 1 or year 2. Typical items purchased by students were beverages, chips, and candy • There were no differences between control and intervention students in BMI z‐score (year 1, 0.83; year 2, 0. 98) or obesity prevalence (year 1, 0.96; year 2, 0.58) |
NA |
| Leung (2011) 50 | • Availability of CS <0.25‐mile network buffer of a girl's residence was associated with greater risk of overweight/obesity (OR = 3.38; 95% CI, 1.07‐10.68) and an increase in BMI z‐score (β = 0.13; 95% CI, 0.00‐0.25) | NA |
| Li (2015) 19 |
• The index of CS (3.44; P < 0.01) is positively related to children's weight status, illustrating that children have higher risk of being overweight or obese if their families patronize CS more often • The indices of CS are negatively associated with children's percentile of BMI (−1.76; P < 0.01) |
• In Alabama's Black Belt region, children living in healthier food environments have lower chance of being overweight or obese than those living in poorer food environments |
| Matanane (2017) 51 | NA | • Nonsignificant associations were found that living near a CS correlated with BMI z‐score |
| Melanie (2012) 52 | NA | • Nearby access to CS was associated with higher BMI z‐score in girls |
| Ohri‐Vachaspati (2013) 28 |
• Presence of a CS within a 1/4 mile radius of home increased the odds of being overweight or obese by 90% (OR = 1.90; 95% CI, 1.04‐3.45) • The average increase in the odds of being overweight or obese was 11% for every additional CS present within a 1/4 mile radius (OR = 1.11; 95% CI, 1.00‐1.22) |
NA |
| Powell (2007) 53 | • An additional CS per 10 000 capita was associated with 0.03 units higher BMI and a 0.2 percentage point increase | NA |
| Sanchez (2012) 54 |
• For each additional CS, the prevalence ratio was 1.01 (95% CI, 1.00‐1.01), with a higher prevalence ratio among fifth grade children • Each additional CS available <0.5 mile radius of a school was associated with an estimated 1% higher overweight prevalence with the prevalence ratio ¼ 1.01 (95% CI, 1.00‐1.01) and, respectively, associated with 1% and 2% higher overweight prevalence among Hispanic and black children, with prevalence ratios ¼ 1.01 (95% CI, 1.00‐1.01) and 1.02 (95% CI, 1.00‐1.03) |
• CS density exerted a detrimental influence on children's weight, particularly among fifth and seventh graders |
| Sakai (2013) 55 | NA | • No association was found between obesity and stores, included CS |
| Seliske (2009) 56 | NA | • None of CS was associated with children overweight |
| Shier (2012) 20 | • The estimated coefficient of CS (β = 6.99, P < 0.01) was the only one that was significant at P < 0.05 with the expected sign, but the effect size (β = 1.33, 0.52) shrank substantially and became insignificant after controlling for covariates | • No consistent evidence was found that greater exposure to fast food restaurants, CS, and small food stores increases BMI |
| Timperio (2008) 57 | • The more fast food outlets (OR = 0.82; 95% CI, 0.67‐0.99) and CS (OR = 0.84; 95% CI, 0.73‐0.98) close to home, the lower the likelihood of consuming fruit z2 times/day. There was also an inverse association between density of CS and the likelihood of consuming vegetables z3 times/day (OR = 0.84; 95% CI, 0.74‐0.95) | NA |
All italic words are results about weight‐related behaviors. All normal words are results about weight‐related outcomes.
3.5. Convenience store access and weight status
Among 30 studies that reported the association between convenience store access and weight status, findings were relatively mixed. Most of the US studies showed a positive association between convenience store access and weight status. For example, nine studies reported a positive association between proximity from home to the nearest convenience store and weight status, although two large‐sample studies showed no significant associations. Also, three studies reported a positive association between proximity from school to the nearest convenience store and weight status, although four studies with smaller sample sizes showed no significant associations. In Canada, two studies showed a negative association and four studies showed no association. In Australia, Ireland, and the United Kingdom with similar demographic characteristics, four studies reported both positive and negative associations. No significant associations were found in East Asia region.
The association between the density of convenience stores within home (school) neighborhoods and children's weight status was found to be positive in four (five) studies and not significant in four (three) studies. The distance from school to the nearest convenience store was positively associated in four studies and not significantly associated in six studies; studies revealing the positive association had a larger total sample size (4 538 019) than those reporting no significant associations (55 401). Subgroup analyses found a positive association between convenience store access and weight status of Latin, Black, or Asia children in five studies, between distance from home to the nearest convenience store and weight status of girls in four studies, and between convenience store access within home neighborhoods of children living in low‐income areas in two studies (Table 4).
TABLE 4.
Associations between the access to convenience store (CS) and children's weight‐related behaviors and weight status in 41 included studies
|
Direction of Association CS‐related Factors |
Total Sample Size (Number of Studies Conducted in Each Region a ) | ||||||
|---|---|---|---|---|---|---|---|
| Weight Status b | Unhealthy Behaviors c | ||||||
| Negative (P < 0.05) | Positive (P < 0.05) | Not Significant | Negative (P < 0.05) | Positive (P < 0.05) | Not Significant | ||
| Proximity | Home | 1021 (1 in NA) | 8627 (9 in NA, 1 in WE) | 28 623 (5 in NA, 1 in EA) | – | 5139 (4 in NA, 1 in WE, 1 in AU) | 8568 (1 in WE) |
| School | – | 4 538 019 (3 in NA, 1 in WE) | 55 401 (6 in NA) | – | 1322 (2 in NA) | 767 (1 in NA) | |
| Unreported | – | – | 378 350 (1 in NA, 1 in EA) | – | 34 369 (1 in EA) | – | |
| Density/Number | Home | 512 (1 in NA) | 541 551 (4 in NA) | 30 812 (4 in NA) | – | 1910 (2 in NA, 1 in WE, 1 in AU) | – |
| School | – | 4 207 395 (5 in NA) | 41 007 (3 in NA) | – | 512 (1 in NA) | 767 (1 in NA) | |
| Unreported | – | – | 380 633 (2 in EA) | – | – | ||
| Age | <6 y | – | 538 555 (1 in NA) | – | – | 512 (1 in NA) | – |
| Gender | Boy | – | 13 420 (1 in NA) | – | – | 204 (1 in NA) | – |
| Girl | – | 931 580 (4 in NA, 1 in WE) | – | – | 9202 (1 in NA, 1 in WE) | – | |
| Latin/Black/Asia | – | 541 929 (5 in NA) | – | – | – | – | |
| Low‐income neighborhood | – | 539 168 (2 in NA) | – | – | 42 937 (1 in EA, 1 in WE) | – | |
| Access to other food outlets | Food swamp | – | 15 870 (1 in NA) | – | – | 634 (1 in NA) | – |
| Supermarkets/green grocers/farmer markets/fruits and vegetables outlets | 53 819 (4 in NA, 1 in WE) | 629 (2 in NA) | 441 772 (3 in NA, 1 in WE) | – | – | 8694 (1 in WE, 1 in EA) | |
NA: North America (the United States and Canada); EA: East Asia (China, Japan, and Korea); WE: Western Europe (the United Kingdom and Ireland); AU: Australia.
Measures of weight status include body mass index (BMI), BMI z‐score, weight gain, overweight, or obesity.
Unhealthy behaviors include low dietary duality score, less consumption of fruit and vegetable, more consumption of fat food, soft drinks, or take‐out food, and less physical exercise.
4. DISCUSSION
Research on the association between the access to convenience stores and childhood obesity has rapidly increased, but there has not been any review on this association. After reviewing 41 included studies conducted in eight countries, our study showed that there was a strong association between convenience store access and weight‐related behaviors among children and adolescents. In contrast, associations between convenience store access and children's weight status were rather mixed in the United States and the United Kingdom and were generally not significant in East Asia and Canada. Considering different demographic characteristics of samples, measures of convenience store access, and statistical methods used in those studies, results of the included studies were sufficiently robust for us to arrive at several important findings.
Inadequate intake of vegetables and fruits, excessive intake of high‐fat foods, sugary drinks, fast food, take‐away foods, snacks, and insufficient physical exercise were shown to be important factors in weight control failure, leading to weight gain and overweight or obesity. The living habits and food intake behaviors of children tended to be particularly susceptible to environmental factors. Nine studies from five countries found a positive association between convenience stores access and unhealthy weight‐related behaviors, which indicated that convenience stores distributed around schools or homes did have an impact on children. The sociodemographic characteristics in those studies further showed that girls and children living in low‐income areas were more vulnerable to the adverse effects of convenience stores in terms of unhealthy dietary behaviors. In contrast, it is difficult to drawing general conclusions about the association between convenience store access and children's weight status, which have varied across regions.
The convenience store could be a contradictory locale in contexts of obesogenic environmental research. It could provide healthy and/or unhealthy food, which may vary in different levels of contexts, from regulations at the national/regional food and business policies to the availability of other types of food outlet in the neighborhood. For example, when supermarkets and appropriate grocery stores convenience stores are available in the neighborhood, convenience store could be a risk factor for overnutrition. In case that relatively healthy food outlets are not available, convenience stores may be a risk factor due to unhealthy food they provide. However, convenience stores in that case may become an important source of fruits and vegetables, which often happens in many neighborhoods in China. Also, the variation of the food provided in convenience stores across regions could be larger than that in most type of food outlets, as many of them are self‐operated without coordination from above (eg, supermarket or restaurant chain). The studies included in this review were mainly from developed countries and regions. More research needs to be conducted in developing countries and regions where environmental factors may play a different role in shaping children's behaviors and consequently body weight. The definition of the convenience store should be more clearly described in every future study.
There were some limitations in the included studies that need to be acknowledged, which also suggest future research in several directions. First, measures of the access to convenience stores varied across studies and usually took place at only one scale, which has weaken the comparability among studies. Also, the variation in the outcome measures further prevented us from conducting meta‐analyses. We suggest future research to be conducted at multiple scales for various widely used behavioral and obesity outcomes, to increase the comparability among studies. 58 , 59 Second, the majority of the studies included were cross‐sectional with few longitudinal studies and RCTs. The increasing use of the advanced spatial and big data approaches will lead to more frequent measurement of food environments for longitudinal study designs and linkage to follow‐up health data. 60 , 61 , 62 , 63 Finally, none of the included studies examined the pathway from convenience store accessibility to childhood obesity through unhealthy dietary behaviors. Accessibility only represents availability and is not equal to affordability or acceptability, not to mention children–convenience store interaction in the real world. 64 , 65 Therefore, future research should test the validity of measures of exposure to food environments, such as children's journeys through the food environment, as well as food purchasing and consumption behaviors, which will aid in effective control of childhood overweight and obesity through, for example, school food policies and interventions. 66
5. CONCLUSIONS
This systematic review filled an important research gap by examining associations between convenience store access and children's dietary behaviors and weight status. Compared with children's unhealthy dietary behaviors that were in general positively associated with convenience store access, associations between convenience store access and weight status were rather inconclusive. This review may provide some timely insight to debate about prevention of childhood obesity and point out the demand for further research in more developing countries and regions and on better measurement of convenience store access, children's journey, and their food purchasing and consumption behaviors. Also, research on pathways from convenience store access to childhood obesity is needed to allow multiple stakeholders to design effective interventions and policies for prevention of childhood obesity.
CONFLICT OF INTEREST
We declare no conflict of interest.
Supporting information
Table S1. Basic characteristics and measures used in 41 included studies
Table S2. Associations between body‐weight status/ weight‐related behavior and convenience store in the United States
Table S3. Associations between body‐weight status/ weight‐related behavior and convenience store in Canada area
Table S4. Associations between body‐weight status/ weight‐related and convenience store in Western Europe and Australia areas
Table S5. Associations between body‐weight status/weight‐related and convenience store in East Asia area
Table S6. The effect of national level studies in the US and the UK
Table S7. Study quality assessment (see 14 questions in Appendix S3)
ACKNOWLEDGEMENTS
We thank the International Institute of Spatial Lifecourse Epidemiology (ISLE) and the China Medical Board (12‐106) for research support. [Correction added on 3 February 2021, after first online publication: Acknowledgements have been revised.]
Xin J, Zhao L, Wu T, et al. Association between access to convenience stores and childhood obesity: A systematic review. Obesity Reviews. 2021;22(S1):e12908. 10.1111/obr.12908
[Correction added on 14 January 2021, after first online publication: (1) Peng Jia's affiliations have been updated;(2) affiliation numbers of Li Zhao, Tong Wu, Hong Xue and Qian Xiao have been re‐arranged; (3) Funding Information has been revised.]
Contributor Information
Li Zhao, Email: zhaoli@scu.edu.cn.
Peng Jia, Email: jiapengff@hotmail.com.
REFERENCES
- 1. WHO . Controlling the obesity epidemic. 2017.
- 2. Vamosi M, Heitmann BL, Kyvik KO. The relation between an adverse psychological and social environment in childhood and the development of adult obesity: a systematic literature review. Obes Rev. 2010;11(3):177‐184. [DOI] [PubMed] [Google Scholar]
- 3. Schwartz MB, Puhl R. Childhood obesity: a societal problem to solve. Obes Rev. 2003;4(1):57‐71. [DOI] [PubMed] [Google Scholar]
- 4. Hayba N, Partridge SR, Nour MM, Grech A, Allman Farinelli M. Effectiveness of lifestyle interventions for preventing harmful weight gain among young adults from lower socioeconomic status and ethnically diverse backgrounds: a systematic review. Obes Rev. 2018;19(3):333‐346. [DOI] [PubMed] [Google Scholar]
- 5. De Onis M, Blössner M, Borghi E. Global prevalence and trends of overweight and obesity among preschool children. Public Health Nutr. 2010;92:1257‐1264. [DOI] [PubMed] [Google Scholar]
- 6. Jia P, Xue H, Cheng X, Wang YG, Wang Y. Association of neighborhood built environments with childhood obesity: evidence from a 9‐year longitudinal, nationally representative dataset in the US. Environ Int. 2019;128:158‐164. [DOI] [PubMed] [Google Scholar]
- 7. Maleki‐Yazdi KA, Penalvo JL, Marsden D, Rompay MV, Micha R, Mozaffarian D. The neighborhood food environment and change in body mass index: a systematic review and meta‐analysis of longitudinal studies. Circulation. 2017;135(suppl 1):P289. [Google Scholar]
- 8. Tach L, Amorim M. Constrained, convenient, and symbolic consumption: neighborhood food environments and economic coping strategies among the urban poor. Bull N Y Acad Med. 2015;92:815‐834. [DOI] [PMC free article] [PubMed] [Google Scholar]
- 9. Casey R, Oppert JM, Weber C, et al. Determinants of childhood obesity: what can we learn from built environment studies? Food Qual Prefer. 2014;31:164‐172. [Google Scholar]
- 10. Langellier BA, Garza JR, Prelip ML, Glik D, Brookmeyer R, Ortega AN. Corner store inventories, purchases, and strategies for intervention: a review of the literature. Calif J Health Promot. 2013;11(3):1‐13. [PMC free article] [PubMed] [Google Scholar]
- 11. Powell LM, Slater S, Mirtcheva D, Bao Y, Chaloupka FJ. Food store availability and neighborhood characteristics in the United States. Prev Med. 2007;44(3):189‐195. [DOI] [PubMed] [Google Scholar]
- 12. Fiechtner L, Sharifi M, Sequist T, et al. Food environments and childhood weight status: effects of neighborhood median income. Child Obes. 2015;11(3):260‐268. [DOI] [PMC free article] [PubMed] [Google Scholar]
- 13. Jago R, Baranowski T, Baranowski JC, Cullen KW, Thompson D. Distance to food stores & adolescent male fruit and vegetable consumption: mediation effects. Int J Behav Nutr Phys Act. 2007;4 (no pagination(1):35. 10.1186/1479-5868-4-35 [DOI] [PMC free article] [PubMed] [Google Scholar]
- 14. Epstein LH, Raja S, Daniel TO, et al. The built environment moderates effects of family‐based childhood obesity treatment over 2 years. Ann Behav Med. 2012;44(2):248‐258. [DOI] [PMC free article] [PubMed] [Google Scholar]
- 15. Choo J, Kim HJ, Park S. Neighborhood environments: links to health behaviors and obesity status in vulnerable children. West J Nurs Res. 2017;39(8):1169‐1191. [DOI] [PubMed] [Google Scholar]
- 16. Ghenadenik AE, Kakinami L, Van Hulst A, Henderson M, Barnett TA. Neighbourhoods and obesity: a prospective study of characteristics of the built environment and their association with adiposity outcomes in children in Montreal, Canada. Prev Med. 2018;111:35‐40. [DOI] [PubMed] [Google Scholar]
- 17. Wang Y, Jia P, Cheng X, Xue H. Improvement in food environments may help prevent childhood obesity: evidence from a 9‐year cohort study. Pediatr Obes. 2019;e12536. [DOI] [PMC free article] [PubMed] [Google Scholar]
- 18. Hulst AV, Roy‐Gagnon M, Gauvin L, Kestens Y, Henderson M, Barnett TA. Identifying risk profiles for childhood obesity using recursive partitioning based on individual, familial, and neighborhood environment factors. Int J Behav Nutr Phys Act. 2015;12(1) (no pagination)):17. 10.1186/s12966-015-0175-7 [DOI] [PMC free article] [PubMed] [Google Scholar]
- 19. Li Y, Robinson LE, Carter WM, Gupta R. Childhood obesity and community food environments in Alabama's Black Belt region. Child Care Health Dev. 2015;41:668‐676. [DOI] [PubMed] [Google Scholar]
- 20. Shier V, An R, Sturm R. Is there a robust relationship between neighbourhood food environment and childhood obesity in the USA? Public Health. 2012;126(9):723‐730. [DOI] [PMC free article] [PubMed] [Google Scholar]
- 21. An RP, Sturm R. School and residential neighborhood food environment and diet among California youth. Am J Prev Med. 2012;42(2):129‐135. [DOI] [PMC free article] [PubMed] [Google Scholar]
- 22. He MZ, Tucker P, Irwin JD, Gilliland J, Larsen K, Hess P. Obesogenic neighbourhoods: the impact of neighbourhood restaurants and convenience stores on adolescents' food consumption behaviours. Public Health Nutr. 2012;15(12):2331‐2339. [DOI] [PMC free article] [PubMed] [Google Scholar]
- 23. Jilcott SB, Hurwitz J, Moore JB, Blake C. Qualitative perspectives on the use of traditional and nontraditional food venues among middle‐ and low‐income women in eastern North Carolina. Ecol Food Nutr. 2010;49(5):373‐389. [DOI] [PubMed] [Google Scholar]
- 24. Galvez MP, Hong L, Choi E, Liao L, Godbold J, Brenner B. Childhood obesity and neighborhood food‐store availability in an inner‐city community. Acad Pediatr. 2009;9(5):339‐343. [DOI] [PMC free article] [PubMed] [Google Scholar]
- 25. Harrison F, Jones AP, van Sluijs EM, Cassidy A, Bentham G, Griffin SJ. Environmental correlates of adiposity in 9‐10 year old children: considering home and school neighbourhoods and routes to school. Soc Sci Med. 2011;72(9):1411‐1419. [DOI] [PMC free article] [PubMed] [Google Scholar]
- 26. Laska MN, Hearst MO, Forsyth A, Pasch KE, Lytle L. Neighbourhood food environments: are they associated with adolescent dietary intake, food purchases and weight status? Public Health Nutr. 2010;13(11):1757‐1763. [DOI] [PMC free article] [PubMed] [Google Scholar]
- 27. Le H, Engler‐Stringer R, Muhajarine N. Walkable home neighbourhood food environment and children's overweight and obesity: proximity, density or price? Can J Public Health. 2016;107(S1):eS42‐eS47. [DOI] [PMC free article] [PubMed] [Google Scholar]
- 28. Ohri‐Vachaspati P, Lloyd K, DeLia D, Tulloch D, Yedidia MJ. A closer examination of the relationship between children's weight status and the food and physical activity environment. Prev Med. 2013;57(3):162‐167. [DOI] [PMC free article] [PubMed] [Google Scholar]
- 29. Timperio A, Crawford D, Leech RM, Lamb KE, Ball K. Patterning of neighbourhood food outlets and longitudinal associations with children's eating behaviours. Prev Med. 2018;111:248‐253. [DOI] [PubMed] [Google Scholar]
- 30. Moher D. Preferred Reporting Items for Systematic Reviews and Meta‐Analyses: the PRISMA statement. Int J Surg. 2010;8(5):336‐341. [DOI] [PubMed] [Google Scholar]
- 31. Higgins JPT, Altman DG, Gøtzsche PC, et al. The Cochrane Collaboration's tool for assessing risk of bias in randomized trials. BMJ. 2011;343(oct18 2):d5928‐d5938. [DOI] [PMC free article] [PubMed] [Google Scholar]
- 32. Baek J, Sanchez‐Vaznaugh EV, Sanchez BN. Hierarchical distributed‐lag models: exploring varying geographic scale and magnitude in associations between the built environment and health. Am J Epidemiol. 2016;183(6):583‐592. [DOI] [PMC free article] [PubMed] [Google Scholar]
- 33. Chen HJ, Wang Y. Changes in the neighborhood food store environment and children's body mass index at peripuberty in the United States. J Adolesent Health. 2016;58(1):111‐118. [DOI] [PMC free article] [PubMed] [Google Scholar]
- 34. Chiang PH, Wahlqvist ML, Lee MS, Huang LY, Chen HH, Huang STY. Fast‐food outlets and walkability in school neighbourhoods predict fatness in boys and height in girls: a Taiwanese population study. Public Health Nutr. 2011;14(9):1601‐1609. [DOI] [PubMed] [Google Scholar]
- 35. Dengel DR, Hearst MO, Harmon JH, Forsyth A, Lytle LA. Does the built environment relate to the metabolic syndrome in adolescents? Health Place. 2009;15(4):946‐951. [DOI] [PMC free article] [PubMed] [Google Scholar]
- 36. Fiechtner L, Block J, Duncan DT, et al. Proximity to supermarkets associated with higher body mass index among overweight and obese preschool‐age children. Prev Med. 2013;56(3‐4):218‐221. [DOI] [PMC free article] [PubMed] [Google Scholar]
- 37. Gilliland JA, Rangel CY, Healy MA, et al. Linking childhood obesity to the built environment: a multi‐level analysis of home and school neighbourhood factors associated with body mass index. Can J Public Health. 2012;103:S15‐S21. [DOI] [PMC free article] [PubMed] [Google Scholar]
- 38. Grafova IB. Overweight children: assessing the contribution of the built environment. Prev Med. 2008;47(3):304‐308. [DOI] [PubMed] [Google Scholar]
- 39. Hager ER, Cockerham A, O'Reilly N, et al. Food swamps and food deserts in Baltimore City, MD, USA: associations with dietary behaviours among urban adolescent girls. Public Health Nutr. 2017;20(14):2598‐2607. [DOI] [PMC free article] [PubMed] [Google Scholar]
- 40. Heroux M, Iannotti RJ, Currie D, Pickett W, Janssen I. The food retail environment in school neighborhoods and its relation to lunchtime eating behaviors in youth from three countries. Health Place. 2012;18(6):1240‐1247. [DOI] [PMC free article] [PubMed] [Google Scholar]
- 41. Ho SY, Wong BYM, Lo WS, Mak KK, Thomas GN, Lam TH. Neighbourhood food environment and dietary intakes in adolescents: sex and perceived family affluence as moderators. Int J Pediatr Obes. 2010;5(5):420‐427. [DOI] [PubMed] [Google Scholar]
- 42. Howard PH, Fitzpatrick M, Fulfrost B. Proximity of food retailers to schools and rates of overweight ninth grade students: an ecological study in California. BMC Public Health. 2011;11(1):68. [DOI] [PMC free article] [PubMed] [Google Scholar]
- 43. Van Hulst A, Barnett TA, Gauvin L, et al. Associations between children's diets and features of their residential and school neighbourhood food environments. Can J Public Health. 2012;103:S48‐S54. [DOI] [PMC free article] [PubMed] [Google Scholar]
- 44. Jilcott SB, Wade S, McGuirt JT, Wu Q, Lazorick S, Moore JB. The association between the food environment and weight status among eastern North Carolina youth. Public Health Nutr. 2011;14(9):1610‐1617. [DOI] [PubMed] [Google Scholar]
- 45. Keane E, Cullinan J, Perry CP, et al. Dietary quality in children and the role of the local food environment. SSM Popul Health. 2016;2:770‐777. [DOI] [PMC free article] [PubMed] [Google Scholar]
- 46. Koleilat M, Whaley SE, Afifi AA, Estrada L, Harrison GG. Understanding the relationship between the retail food environment index and early childhood obesity among WIC participants in Los Angeles County using GeoDa. Online J Public Health Inform. 2012;4(1):e5. 10.5210/ojphi.v4i1.3936 [DOI] [PMC free article] [PubMed] [Google Scholar]
- 47. Langellier BA. The food environment and student weight status, Los Angeles County, 2008‐2009. Prev Chronic Dis. 2012;9:E61. URL: https://www.ncbi.nlm.nih.gov/pmc/articles/PMC3362407/ [PMC free article] [PubMed] [Google Scholar]
- 48. Lee H. The role of local food availability in explaining obesity risk among young school‐aged children. Soc Sci Med. 2012;74(8):1193‐1203. [DOI] [PubMed] [Google Scholar]
- 49. Lent MR, Vander Veur SS, McCoy TA, et al. A randomized controlled study of a healthy corner store initiative on the purchases of urban, low‐income youth. Obesity (Silver Spring). 2014;22(12):2494‐2500. [DOI] [PMC free article] [PubMed] [Google Scholar]
- 50. Leung CW, Laraia BA, Kelly M, et al. The influence of neighborhood food stores on change in young girls' body mass index. Am J Prev Med. 2011;41(1):43‐51. [DOI] [PMC free article] [PubMed] [Google Scholar]
- 51. Matanane L, Fialkowski MK, Silva J, et al. Para I Famagu'on‐Ta: fruit and vegetable intake, food store environment, and childhood overweight/obesity in the children's healthy living program on Guam. Hawaii J Med Public Health. 2017;76(8):225‐233. [PMC free article] [PubMed] [Google Scholar]
- 52. Wall MM, Larson NI, Forsyth A, et al. Patterns of obesogenic neighborhood features and adolescent weight: a comparison of statistical approaches. Am J Prev Med. 2012;42(5):e65‐e75. [DOI] [PMC free article] [PubMed] [Google Scholar]
- 53. Powell LM, Auld MC, Chaloupka FJ, O'Malley PM, Johnston LD. Associations between access to food stores and adolescent body mass index. Am J Prev Med. 2007;33(4):S301‐S307. [DOI] [PubMed] [Google Scholar]
- 54. Sanchez BN, Sanchez‐Vaznaugh EV, Uscilka A, Baek J, Zhang L. Differential associations between the food environment near schools and childhood overweight across race/ethnicity, gender, and grade. Am J Epidemiol. 2012;175(12):1284‐1293. [DOI] [PMC free article] [PubMed] [Google Scholar]
- 55. Sakai R. Relationship between prevalence of childhood obesity in 17‐year‐olds and socioeconomic and environmental factors: prefecture‐level analysis in Japan. Asia Pac J Public Health. 2013;25(2):159‐169. [DOI] [PubMed] [Google Scholar]
- 56. Seliske LM, Pickett W, Boyce WF, Janssen I. Association between the food retail environment surrounding schools and overweight in Canadian youth. Public Health Nutr. 2009;12(9):1384‐1391. [DOI] [PubMed] [Google Scholar]
- 57. Timperio A, Ball K, Roberts R, Campbell K, Andrianopoulos N, Crawford D. Children's fruit and vegetable intake: associations with the neighbourhood food environment. Prev Med. 2008;46(4):331‐335. [DOI] [PubMed] [Google Scholar]
- 58. Jia P, Xue H, Cheng X, Wang Y. Effects of school neighborhood food environments on childhood obesity at multiple scales: a longitudinal kindergarten cohort study in the US. BMC Med. 2019;17(1):99. [DOI] [PMC free article] [PubMed] [Google Scholar]
- 59. Jia P, Cheng X, Xue H, Wang Y. Applications of geographic information systems (GIS) data and methods in obesity‐related research. Obes Rev. 2017;18(4):400‐411. [DOI] [PubMed] [Google Scholar]
- 60. Jia P, Stein A, James P, et al. Earth observation: investigating noncommunicable diseases from space. Annu Rev Public Health. 2019;40(1):85‐104. [DOI] [PubMed] [Google Scholar]
- 61. Jia P. Integrating Kindergartener‐Specific Questionnaires with citizen science to improve child health. Front Public Health. 2018;6:236. [DOI] [PMC free article] [PubMed] [Google Scholar]
- 62. Jia P, Stein A. Using remote sensing technology to measure environmental determinants of non‐communicable diseases. Int J Epidemiol. 2017;46(4):1343‐1344. [DOI] [PubMed] [Google Scholar]
- 63. Jia P, Xue H, Yin L, Stein A, Wang M, Wang Y. Spatial technologies in obesity research: current applications and future promise. Trends Endocrinol Metab. 2019;30(3):211‐223. [DOI] [PubMed] [Google Scholar]
- 64. Zhang X, Gong Y, Jia P, et al. Monetary diet cost is positively associated with diet quality and obesity: an analysis of school‐aged children in Southwest China. J Public Health (Oxf). 2018. 10.1093/pubmed/fdy100 [DOI] [PubMed] [Google Scholar]
- 65. Williams J, Scarborough P, Matthews A, et al. A systematic review of the influence of the retail food environment around schools on obesity‐related outcomes. Obes Rev. 2014;15(5):359‐374. [DOI] [PubMed] [Google Scholar]
- 66. Jia P, Li M, Xue H, Lu L, Xu F, Wang Y. School environment and policies, child eating behavior and overweight/obesity in urban China: the childhood obesity study in China Mega‐cities. Int J Obes (Lond). 2017;41(5):813‐819. [DOI] [PubMed] [Google Scholar]
Associated Data
This section collects any data citations, data availability statements, or supplementary materials included in this article.
Supplementary Materials
Table S1. Basic characteristics and measures used in 41 included studies
Table S2. Associations between body‐weight status/ weight‐related behavior and convenience store in the United States
Table S3. Associations between body‐weight status/ weight‐related behavior and convenience store in Canada area
Table S4. Associations between body‐weight status/ weight‐related and convenience store in Western Europe and Australia areas
Table S5. Associations between body‐weight status/weight‐related and convenience store in East Asia area
Table S6. The effect of national level studies in the US and the UK
Table S7. Study quality assessment (see 14 questions in Appendix S3)