

Summary
Childhood obesity is one of the most pressing public health issues nowadays. The environmental factors have been identified as potential risks for obesity, as they may influence people's lifestyle behaviours. Lack of access to supermarkets that usually provide healthy food options has been found to be a risk factor for childhood obesity in several studies. However, findings remained inconclusive. We aimed to systematically review the association between access to supermarkets and childhood obesity. A literature search was conducted in the Cochrane Library, PubMed, Web of Science, and Embase for studies published before 1 January 2019. Twenty‐four studies conducted in four countries were identified, from which data on the basic characteristics of studies and participants, measures of access to supermarkets, and associations between access to supermarkets and weight‐related behaviours and outcomes were extracted. The median sample size was 1858 participants. Half of the included studies indicated a negative association, one fourth reported a positive association, and the remaining one fourth did not find a significant association. Better designed studies are necessary to achieve a robust understanding of this epidemiological relationship in the future.
Keywords: children, food environment, obesity, supermarket
1. INTRODUCTION
Childhood obesity is an increasingly serious public health challenge, affecting populations in many countries across the world. 1 In 2016, it was estimated that 41 million children under the age of 5 years and over 340 million children and adolescents aged 5 to 19 years were overweight or suffering obesity; the latter has seen a 10‐fold increase over the past 40 years. 2 , 3 , 4 The epidemic of childhood obesity increased the prevalence of type 2 diabetes, cardiovascular disease, 5 and psychosocial disorders. 6 Furthermore, childhood obesity increases the risk for obesity in adulthood and heralds the development of comorbidities, lower quality of life, and reduced life expectancy. 7 , 8 In the United States, the medical expenditure of patients with obesity is about 76% higher than the patients with a recommended body mass index (BMI). 9
It is widely accepted that food environments in the neighbourhood may interact with personal characteristics to affect individual dietary behaviours and weight status. 10 , 11 , 12 , 13 , 14 Neighbourhood food environments consist of various types of food venues, which are normally considered healthy or unhealthy places, depending on the majority of the food provided in each type of venues. Thus, they can affect weight status in both directions. Supermarket, providing a large variety of food 15 and thus considered a type of healthy food venues, has been growing its number of stores all over the world, especially in developing countries. 16 , 17 , 18 Theoretically, the availability of such healthy food venues should have a generally preventive effect on obesity. 19 For example, each 1.6‐km shorter distance to a supermarket was associated with a decrease of BMI z‐score by 0.04 units, 20 resumably due to greater access to healthier foods in supermarkets compared with in other food venues, such as convenience stores. 21 , 22 However, other studies also found that the number of supermarkets near a home was positively associated with children's BMI. 23 There has not been any review specifically on the relationship between access to supermarkets and childhood obesity.
To fill this gap, this study aimed to provide an empirical assessment of the association between access to supermarkets and childhood obesity. A full range of measures of access to supermarkets used in previous obesogenic environmental studies, as well as their associations with various weight‐related behaviours and outcomes at multiple sites (eg, home and school), were summarized. This review would draw attention to global and local roles of supermarkets in the prevention of obesity and further chronic diseases.
2. METHODS
A systematic review was conducted in accordance with the Preferred Reporting Items for Systematic Reviews. 24
2.1. Study selection criteria
Studies that met all of the following criteria were included in the review: (a) study subjects (children and adolescents aged <18 years); (b) study outcomes (weight‐related behaviours [eg, diet, physical activity, and sedentary behaviour] and/or outcomes [eg, overweight and obesity measured by BMI [kg/m2], waist circumference, and body fat); (c) study designs (longitudinal studies, cross‐sectional study, empirical research, randomized control trial (RCT), ecological study, or quasi‐experimental study); (d) article types (peer‐reviewed original research); (e) time of publication (earlier than January 1, 2019); and (f) language (English only).
Studies that met any of the following criteria were excluded from the review: (a) no measures of access to supermarkets or weight‐related behaviours/outcomes; (b) no human participants; (c) not written in English; or (d) letters, editorials, study/review protocols, or review articles.
2.2. Search strategy and literature selecting
We searched for studies on the association between access to supermarkets and childhood obesity in four electronic bibliographic databases: Cochrane Library, PubMed, Web of Science, and Embase. According to the syntax of each database, the search strategy included all possible combinations of keywords and MeSH terms from three groups: supermarket, children, and weight‐related behaviours or outcomes. The specific search strategy is provided in Appendix A.
After duplicated articles were excluded, Q.Z. and X.Y. independently conducted the title and abstract screening and identified potentially relevant articles for the full‐text review. Disagreement between two authors was resolved by L.Z. Q.Z., X.Y., and L.Z. jointly determined the list of articles for the full‐text review through discussion. Q.Z. and X.Y. followed the same criteria to independently review full texts of all articles on the list. The final inclusion of studies was jointly determined by Q.Z., X.Y., and L.Z.
2.3. Data extraction
A standardized data extraction form was used to collect relevant information. Each article was independently extracted by QZ and XY, and discrepancies were resolved by LZ. We extracted the basic information of studies (eg, characteristics of study participants and study design), statistical models used in the studies, and especially measures of access to supermarkets, measures of weight‐related behaviours/outcomes, and their associations (the final models and a cut‐off of P < .05 for statistical significance were used whenever possible).
2.4. Study quality assessment
We used the National Institutes of Health's Quality Assessment Tool for Observational Cohort and Cross‐Sectional Studies to assess the quality of each included study. The quality assessment tool rates each study on the basis of 14 criteria (Table S3). For each criterion, a score of one was assigned if “yes” was the response, whereas a score of zero was assigned otherwise (ie, an answer of “no,” “not applicable,” “not reported,” or “cannot determine”). A study‐specific global score ranging from zero to 14 was statistically calculated by summing up scores across all criteria. The study quality assessment helped measure the strength of scientific evidence but was not used to determine the inclusion of studies.
3. RESULTS
3.1. Study selection
Figure 1 showed the flowchart of study selection. The search strategy generated a total of 2253 potentially eligible articles, out of which 1406 unique studies remained after removing duplicates. Abstract and title screening excluded 1378 articles due to not meeting the inclusion criteria. The full texts of the remaining 28 articles were reviewed, and four articles were further excluded due to not being written in English. The remaining 24 studies met all the criteria and were included in this review.
FIGURE 1.
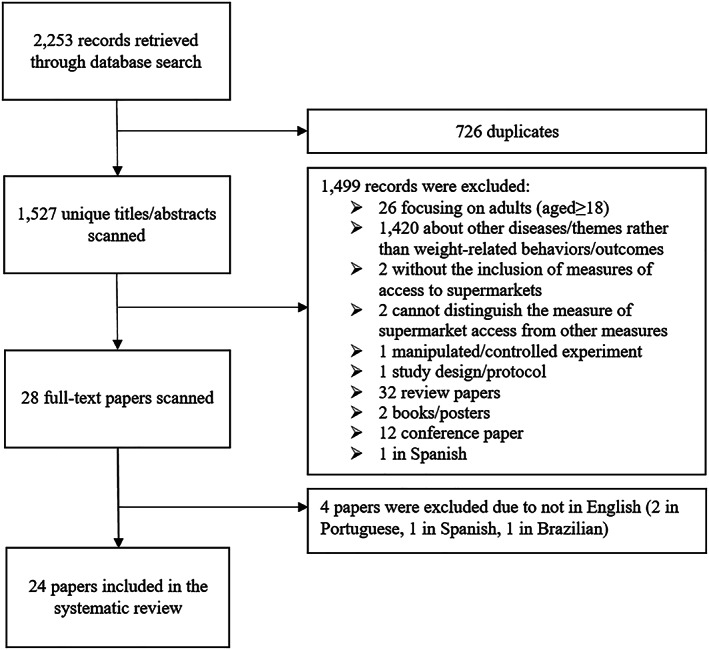
Flowchart of study inclusion and exclusion
3.2. Study characteristics
Table 1 summarized the basic characteristics of the 24 included studies. They were published from 2007 to 2017, and most of them were after 2011 (17 out of 24). Most of the studies were cross‐sectional studies (20 out of 24), with others being two cohort studies and two RCTs. They were conducted at four scales, seven at the national level, eight at the state or equivalent unit level, four at the county level, and five at the city level. These studies focused on four regions, 21 in the United States and one in each of the Unioted Kingdom, Canada, and Kenya. Most of the US studies were conducted in Massachusetts (northeast), California (west), and Alabama (southeast).
TABLE 1.
Basic characteristics of 24 studies included in this study
| Author (year)[ref] | Study Area [Scale] a | Sample Size | Sample Age (Years) b in Survey Year | Sample Characteristics (Follow‐up Status for Longitudinal Studies) | Statistical Model |
|---|---|---|---|---|---|
| Cohort studies | |||||
| Galvez (2009) 19 | New York, USA [C] | 323 | 6‐8 | Children in East Harlem (followed up for 3 y) | Multilevel linear regression |
| Fiechtner (2017) 8 | Massachusetts, USA [S] | 33 272 | 2‐18 in 2008‐2012 | Followed up from 2008 to 2012 with two repeated measures | Multinomial logistic regression |
| Cross‐sectional studies | |||||
| Larsen (2015) 25 | Toronto, Canada [C] | 1035 | 11 in 2010‐2011 | School children at grades 5 and 6 | Logistic regression |
| Powell (2009) 26 | USA [N] | 3797 | 6‐17 (12.0 ± 3.2) in 1998, 2000, and 2002 | (measured in 1998, 2000 and 2002) | Multilevel linear regression |
| Shier (2012) 27 | USA [N] | 6260 | 14.3 ± 0.4 in 200 | Students participant in ECLS‐K (followed up from 2004 to 2007 with two repeated measures and attrition rate of 35%) | Multilevel linear regression |
| Powell (2007) 28 | USA [N] | 73 079 | 14.7 ± 1.2 in 1997‐2003 | School children at grades 8 and 10 (seven annual repeated measures from 1997 to 2003) | Multilevel linear regression |
| Howard (2011) 29 | California, USA [S] | 879 public schools | Grade 9 in 2007 | Public school children |
• Correlations (Kendall's tau‐b) • Linear regression |
| Rosenshein (2009) 30 | Los Angeles County, USA [CT] | 1149 schools | Grade 5 | Grades 5 school students | Multilevel linear regression |
| Hsieh (2015) 31 | Los Angeles Area, USA [CT] | 592 | 8‐18 in 2001‐2011. | Hispanic youth | Multilevel linear regression |
| Fiechtner (2015) 32 | Massachusetts, USA [S] | 49 770 | 4‐18 in 2011‐2012 | Paediatric patients | Linear regression |
| Matanane (2017) 33 | Guam, USA [S] | 466 | 2‐8 in 2012‐2013 | Children participant in the CHL | Logistic regression models |
| Tang (2014) 34 | Camden, New Brunswick, Newark and Trenton, USA [C4] | 12 954 | 13.5 ± 3.5 in 2008‐2009 | Middle and high school children in low‐income communities | Multivariate regression |
| Auld (2009) 35 | USA [N] | 73 041 | 14.7 in 1997‐2003 | School children in grades 8 and 10 | Quantile regression |
| Fiechtner (2013) 36 | Massachusetts, USA [S] | 438 | 2‐6.9 in 2006‐2009 | (Measured in four annual repeated measures from 2006 to 2009) | Multivariable linear regression |
| Koleilat (2012) 37 | Los Angeles County, USA [CT] | NA | 3‐4 in 2008 | Children participant in WIC |
• Linear regression and • ANOVA |
| Shier (2016) 38 | USA [N] | 903 | 12‐13 in 2013 | Children in military families | Multiple linear regression |
| Powell (2010) 12 | USA [N] | NA | 6‐17 in 1997‐2008 | School children at grades 8 and 10 | Multiple linear regression |
| Wall (2012) 39 | Minneapolis/St. Paul, USA [C] | 2682 | 14.5 ± 2 in 2009‐2010 | School children at grades 6‐12 |
• Multiple linear regression |
| Chen (2016) 40 | USA [N] | 7090 | 11 in 2004 | School children at grades 5 and 6 (followed up from 2004 to 2007 with two repeated measures) | Multiple linear regression |
| Li (2015) 41 | Alabama, USA [S] | 613 | 4‐13 in 2013 | Elementary school children | Multilevel linear regression |
| Griffiths (2014) 23 | Leeds City, UK [C] | 13 291 | 11‐12 in 2005‐2007 | Secondary school children |
• Multiple linear regression models • Logistic regression models |
| Kimenju (2015) 42 | Central province, Kenya [S] | 216 | 5‐19 in 2012 | NA | Instrumental variable regressions |
| Randomized controlled trial studies | |||||
| Fiechtner (2016) 20 | Massachusetts, USA [S] | 549 | 6‐12 (9.7 ± 1.9) in 2011‐2013 | Children participate in STAR (followed up from 2011 to 2013 with two repeated measures and an attrition rate of 9%) | Generalized linear regression |
| Epstein (2012) 22 | Erie County, USA [CT] | 191 | 8‐12 | NA | Hierarchical mixed model analyses of covariance |
Note. NLSY79, the National Longitudinal Survey of Youth 97; STAR trail, study of technology to accelerate research trail; ECLS‐K, the Early Childhood Longitudinal Study Kindergarten Class; CHL, the Children's Healthy Living Program community trial; WIC, Special Supplemental Nutrition Program for Women, Infants, and Children.
Study scale: [N], national; [S], state (eg, in the USA) or equivalent unit (eg, province in China, Canada); [Sn], n states or equivalent units; [CT], county or equivalent unit; [CTn], n counties or equivalent units; [C], city; [Cn], n cities.
Age in baseline year for longitudinal studies or mean age in survey year for cross‐sectional studies.
The sample sizes ranged from 191 to 73 079, varying by study scale. For national‐, state‐, county‐, and city‐level studies, the average sample size was 27 362, 12 189, 392, and 6057, respectively. Most participants were schoolchildren, including elementary school, middle, and high school. Nearly half of the studies were based on large‐scale surveys (11 out of 24), such as “Early Childhood Longitudinal Study Kindergarten Class” (ECLS‐K), “Children's Healthy Living Program community trial” (CHL), and “Special Supplemental Nutrition Program for Women, Infants and Children” (WIC). However, different studies were designed with different target regions/populations. ECLS‐K was a nationally representative survey, CHL targeted the underserved US minority populations in the Pacific Region, and WIC were designed for low‐income pregnant/postpartum women and infants and children at nutritional risk. Other studies not using large‐scale surveys often focused on children with certain characteristics (eg, rural children, low‐income family children, Hispanic youth, Africa‐America children).
3.3. Measures of access to supermarkets
A supermarket was usually defined according to the North America Industry Classification System (NAICS), with the location available in the form of (x,y) coordinates in business databases, such as the InfoUSA and Dun and Bradstreet. The access to supermarkets was mainly measured as the presence, number, and density of supermarkets, as well as the distance to supermarkets given the known locations (Table 2). The density of supermarkets was most widely used (10 out of 24) but measured at different scales, such as the number of supermarkets per 10 000 capita, 26 within per square mile in home census tract, 25 and within 2‐km buffer zones around home 23 . The proximity to supermarkets was measured as the nearest distance from home to supermarket in seven studies. 20 The presence of supermarkets was measured two in studies. Most studies adopted only one measure (17 out of 24) and seven studies used more than one measure. These indicators were measured mostly in an accurate way in the geographic information systems (GIS). In addition, other indicators were also used to measure access to supermarkets from different perspectives. For example, the Retail Food Environment Index (RFEI) was used in two studies, 27 , 37 measured as the ratio of the counts of fast‐food outlets and convenience stores to supermarkets and produce vendors. A composite score of probabilities that a child patronizes supermarkets was calculated based on the attraction of supermarket, the distance from each child's home to supermarkets, the number of supermarkets, and a parameter that reflects the effect of distance on shopping. 41
TABLE 2.
Measures of access to supermarkets, weight‐related behaviours and body‐weight status in the included studies
| Study ID | Measures of Access to Supermarket | Other Environmental Factors Adjusted for in the Model | Measures of Weight‐Related Behaviour | Measures of Weight‐Related Outcomes |
|---|---|---|---|---|
| Cohort studies | ||||
| Galvez (2009) 19 | Number of supermarket in home census tract | NA | NA |
• BMI (based on the 2000 CDC growth charts for the United States) • Overweight (BMI percentile from 85th to 95th) and obese (BMI ≥ 95th) |
| Fiechtner (2017) 8 | Road‐network distance from home to the nearest supermarket | Density of recreational space and fast‐food in 800 m road‐network buffer | NA | BMI (based on the 2000 CDC growth charts) |
| Cross‐sectional studies | ||||
| Larsen (2015) 25 |
• Density of supermarkets per square mile in home census tract • Road‐network distance from home to the nearest supermarket |
NA |
NA | BMI |
| Powell (2009) 26 | Number of supermarkets per 10 000 capita (per 10 square miles) in home county | Number of fast‐food restaurants, full‐service restaurants, convenience stores, and grocery stores | NA | Measuring and reported BMI |
| Shier (2012) 27 |
• Number of supermarkets per 1000 population in home census tract • Retail Food Environment Index (RFEI) |
Census tract characteristics:median income, percentage non‐Hispanic White population, and street connectivity index | NA |
• BMI (based on 2000 BMI‐for‐age growth chart issued by the CDC) • Overweight (BMI ≥ 85th percentile) • Obese (BMI ≥ 95th percentile) |
| Powell (2007) 28 | Number of chain supermarkets/nonchain supermarkets per 10 000 population in school postal zone | Number of convenience stores/grocery stores/fast‐food restaurants/nonfast food restaurants per 10 000 capita in school postal zone | NA |
• Self‐reported BMI (based on the CDC growth chart) • Overweight (BMI ≥ 95th percentile) |
| Howard (2011) 29 | Number of supermarkets in 0.8‐km school road‐network buffer | School location: urban, non‐urban | NA | Skinfold measure/BMI/Bioelectric impedance analyser were both used (based on a national advisory panel) |
| Rosenshein (2009) 30 | Straight‐line distance from school to the nearest supermarket | NA | NA | • Healthy Fitness Zone (based on BMI and body fat percentage) |
| Hsieh (2015) 31 | Number of supermarkets in 2‐km home road‐network buffer | Number of restaurants, junctions in 2‐km home buffer | NA |
• BMI z‐score (based on CDC 2000 standards) • Waist circumference (based on measured) • Percent body fat(%BF) based on DXA (Dual X‐ray absorptiometry) on a Hologic QDR 4500 W |
| Fiechtner (2015) 32 | Road‐network distance from home to the nearest supermarket | Road‐network distance from home to closet food stores/fast‐food restaurants/full‐service restaurants/convenience stores/bakeries, coffee shops, and candy stores | NA | BMI z‐score (based on the CDC growth curves) |
| Matanane (2017) 33 |
• Presence of supermarkets in 1.6‐km home straight‐line buffer • Straight‐line distance from home to the nearest supermarket |
NA |
Dietary intake (fruit/vegetable and energy intake, using a 2‐day Food and Activity Log (FAL), completed by the parent/caregiver) |
• BMI z‐scores (based on the 2000 CDC growth charts) • Overweight (85th ≤ BMI < 95th percentile) • Obese (BMI ≥ 95th percentile) |
| Tang (2014) 34 | Number of supermarkets in 0.4‐km school road‐network buffer | Number of convenience stores, small grocery stores, and limited‐service restaurants in school 0.4‐km radius buffer | NA |
• BMI z‐scores (based on the CDC 2000 growth charts) • Overweight or obese (BMI ≥ 85th percentile) |
| Auld (2009) 35 | Number of supermarkets per 10 000 population in school postal zone | NA | NA | Self‐reported BMI (based on the 2000 CDC growth charts) |
| Fiechtner (2013) 36 |
Road‐network distance from home to the nearest supermarket |
Road‐network distance from home address to nearest convenience stores/bakeries/coffee shops/candy stores/full‐service restaurants | NA |
• BMI • Overweight (BMI 25 to 30 kg/m2) • Obese (BMI ≥ 30 kg/m2) |
| Koleilat (2012) 37 |
• Number of supermarkets in home postal zone • RFEI = (fast‐food restaurants + convenience store)/(supermarkets + other grocery stores + produce vendors) |
NA | NA |
• BMI • Waist circumference |
| Shier (2016) 38 |
• Number of supermarkets in 3.2‐km home straight‐line buffer • Presence of supermarkets in a 20‐min walking distance from home |
Residential region |
First created a measure of the parents' rules for snack foods. Second, parents were asked separate questions about how many days per week the family eats breakfast and dinner together |
• BMI and self‐reported BMI (based on the 2000 CDC growth charts) • Obese/overweight (BMI ≥ 85th percentile) |
| Powell (2010) 12 | Density of supermarkets in home postal zone | NA | NA | BMI |
| Wall (2012) 39 |
• Density of supermarkets in 1.6‐km home straight‐line buffer • Straight‐line distance from home to the nearest supermarket • Presence of supermarkets in 1.2‐km home straight‐line buffer |
NA | NA |
• BMI • Obesity: BMI ≥ 95th percentile. BMI z‐scores |
| Chen (2016) 40 | Number of supermarkets in home postal zone (in categories of 0, 1, 2, or ≥3) | Socioeconomic features: neighborhood poverty rate, urbanicity, total business size | NA | BMI (based on the 2000 CDC growth reference) |
| Li (2015) 41 |
Composite score of probabilities that a child patronizes supermarket equation: where S j is the attraction (store size) of store j, D ij is the street distance from home of child i to store j, β is a parameter that reflects the effect of distance on shopping, and n is the number of stores |
Demographics:% of African American population, median household income of block group | NA |
• BMI and self‐report BMI (based on the CDC growth charts) • Overweight: BMI 85th‐94th • Obese: BMI > 95th (based on the 2012 CDC growth charts) |
| Griffiths (2014) 23 |
• Distance from home/school to the nearest supermarket in 2‐km straight‐line buffer • Number of supermarkets in 2‐km home/school straight‐line buffer |
NA |
• BMI and sBMI (based on the British 1990 growth reference charts) • Overweight: BMI > 85th and sBMI>1.04 • Obesity: BMI > 95th and sBMI > 1.64 |
|
| Kimenju (2015) 42 | Supermarket purchase share (%) | NA |
• Joule consumption per day (kJ/d) • Calorie consumption per day (kcal/d) • Share of joules from processed foods(%) |
• BMI‐for‐age Z‐score (based on the WHO growth reference forschool‐aged children and adolescents) • Overweight/obesity: BAZ > 1 SD from the median of the refrernce population. • Height‐for age Z‐score (HAZ) based on the WHO growth reference for school‐aged children and adolescents. • Stunting : HAZ < −2; mild stunting: HAZ < −1; severe stunting: HAZ < −3. |
| Randomized controlled trial studies | ||||
| Fiechtner (2016) 20 | Road‐network distance from home to the nearest supermarket | Nearest distance from home to fast‐food restaurants | SSB intake, fruit intake, and vegetable intake (measures in servings per day) | BMI z‐score |
| Epstein (2012) 22 | Number of supermarkets in a 5‐min driving distance in home road‐network buffer | NA | NA | BMI and zBMI (calculated based on the mean and standard deviation from the US sample) |
Note. BMI, body mass index (BMI is by default calculated based on measured height and weight; self‐reported BMI denotes the BMI calculated based on self‐reported height and weight); GIS, geographic information systems; NAICS, North America Industry Classification System; Straight‐line buffer, a regular (eg, circular) zone with a certain radius around a given address/location or a street to represent a catchment or influential area of that address/location or street; Road‐network buffer, an irregular zone around a given address/location where it covers the same distance (or takes the same time) to travel from any point on the boundary of the zone to that address/location along the shortest road network path; SSBs, sugar‐sweetened beverages; RFEI, the ratio of the counts of fast food outlets and convenience stores to supermarkets and produce vendors; School zone, each block group was assigned to the school it was closest to, and each group of block groups was then aggregated into a “school zone”; HFZ, healthy fitness zone. Distance measure was road‐network distance by default unless indicated otherwise.
3.4. Association between supermarket access and weight‐related behaviours
Three studies reported the association between access to supermarkets and weigh‐related behaviours (eg, fruit and vegetable intake and the share of calories from processed foods), and two of them indicated a positive association. In the United States, each 1‐mile shorter distance to a supermarket was associated with an increase of 0.29 servings per day in fruit/vegetable intake (Table S1). 20 In Kenya, it was found that each 1% increase in the supermarket purchase share corresponded to a 0.45% increase in the share of calories from processed foods. 42 On the contrary, another US study found that an additional supermarket within 2 miles around home was associated with a decrease in the intake of fruit and salty snacks. 38
3.5. Association between supermarket access and childhood obesity
Childhood obesity was measured by a single index in 20 out of 24 studies and by multiple indices in four studies. BMI, measured or self‐reported, was the most widely used in 17 studies, and BMI z‐score was used in eight studies. 20 , 31 , 32 , 33 , 34 , 39 Other weight measures used included skin fold, 29 bioelectric impedance, 29 waist circumference, 31 percent body fat, 31 dual X‐ray, 31 and height‐for‐age Z‐score (HAZ). 42
Twelve studies (11 cross‐sectional studies and one RCT) presented a negative association between access to supermarkets and childhood obesity, with weight status measured in 10 studies and self‐reported in two studies (Table S2). However, evidence did not cluster for any certain measure of supermarket access and outcome variable. They were conducted at national (n = 3), state (n = 2), county (n = 3), and city (n = 3) levels. Access to supermarkets in the neighbourhood was measured as the density of supermarkets (n = 5), the distance from home/school to the nearest supermarket (n = 4), the number of supermarkets (n = 1), the presence of supermarkets (n = 1), and as a composite score of probabilities that a child patronized a supermarket (n = 1). The variation in the association across children's characteristics (eg, gender and race/ethnicity) was also examined in several studies. A Canadian study reported a negative association between supermarket access and body‐weight status only among girls. A US national study found that the negative association between supermarket availability and students' BMI was stronger in African Americans than in Whites and Hispanics (Table S2).
Six cross‐sectional studies indicated a positive relationship between supermarket access and childhood obesity, where measures of supermarket accessibility were mainly the distance from children's home or school to the nearest supermarket (Table S1). The evidence came from different study areas (four in the United States, one in the United Kingdom, and one in Kenya) and scales (four at state level, one at county level, and one at city level) (Table S2). In addition, no associations were found in six studies all conducted in the United States (one city‐level, one county‐level, two state‐level, and two national studies).
3.6. Study quality assessment
Table S3 reported criterion‐specific and global ratings from the study quality assessment. The included studies scored an average of 9.04. The lowest score was 7 and the highest score was 11. Fourteen out of 24 studies scored above 9.
4. DISCUSSION
Research on the association between access to supermarkets and childhood obesity has progressed rapidly in the past decade. However, there has not been a review on this relationship so far. After conducting a comprehensive review, we found that supermarket accessibility tended to be negatively associated with childhood obesity in half of the included studies, while the other half found either positive or null associations. As the sample size increased, the association became increasingly significant irrespective of the direction of the association. Evidence mainly came from the developed countries, such as the United States, Canada, and the United Kingdom, especially large‐scale investigations (some of them were based on special research projects). GIS has been widely used to measure access to supermarkets.
It is difficult to draw a solid conclusion on the association between access to supermarkets and childhood obesity. Inconsistencies in findings among studies underscored the complexity of this association and the need for in‐depth understanding and investigation. There may be several reasons behind this complexity. First, measures of supermarket accessibility and obesity outcomes were differently chosen in most studies. For example, different radii were used when making buffer zones for calculating the density of supermarkets; different metrics were used to measure childhood obesity, such as BMI or healthy fitness zone that indicates whether an individual's level of fitness is sufficient to reduce their risk for hypokinetic diseases. These differences in the measurements, especially in self‐reported ones, may cause bias. Second, exposure to supermarkets should be refined from measures of supermarket accessibility. For example, people are more likely to visit the nearest supermarket, so the service areas of supermarkets could be delineated to reflect the exposure of residents to supermarkets based on the usage pattern data. 43 , 44 Third, while examining the association between supermarket accessibility and childhood obesity, it is necessary to control for basic socio‐demographic characteristics and other environmental factors that may have an impact on energy balance, such as other aspects of the food environment (eg, access to restaurants and grocery stores) and opportunities for physical activity. Also, other environmental factors need to be measured and controlled in a consistent way for better comparison across studies. Fourth, most of the studies were cross‐sectional and susceptible to confounding factors and lacked the field validation that could help examine the mechanisms mediating food environments and individuals' weight outcomes in the neighbourhood.
Several potential mechanisms may underlie various associations between access to supermarkets and childhood obesity. On one hand, children who live near the supermarkets have greater access to a variety of healthful foods sold in supermarkets, which could decrease calorie consumption compared with other scenarios, and thus lead to a lower BMI. 32 On the other hand, supermarkets also sell unhealthy foods and whether or not to purchase them is determined not only by spatial accessibility but also by price and preference. Therefore, the association between supermarket access and childhood obesity and access to supermarkets may also be influenced by factors that affect individuals' purchasing behaviours, such as gender, race, and race/ethnicity. For example, it was found that supermarkets in predominately African‐American census tracts generally contained fewer healthy foods than other neighbourhoods. 45 Moreover, other aspects of the food environment, like convenience stores and restaurants, may have an interaction with supermarkets, 21 thus producing an unexpected association between supermarket accessibility and childhood obesity.
This review has several limitations that should be noted. First, nearly all included studies were conducted in developed countries, which did not provide us sufficient insights in developing countries. 19 , 37 Second, most of the included studies were cross‐sectional, which has prevented us from making any causal inference from these observed associations. More longitudinal studies matched by frequently measured environmental factors should be designed to provide more causal evidence. 46 , 47 , 48 Third, the selection of measures of supermarket accessibility and obesity varied from study to study. Recommendations are needed for selecting measures of food environments and obesity and/or for conducting analyses at multiple geographic scales. Also, a reporting guideline is also needed in this area for clearer reporting of data and methods used in the measurements of obesogenic environments, in order to improve the comparability across studies. Finally, the effect of other aspects of obesogenic environments was not fully or much taken into account in most studies, such as built environments. 49 Due to reasons above, we were unable to conduct high‐quality meta‐analyses.
With the number of studies in this area increasing in the future, the research objective could be further specified in terms of the socio‐demographic characteristics of participants and the measures of obesogenic environmental factors. Also, for better generalization, more review studies should be conducted to include more longitudinal studies which, to whatever extent possible, adhere to the way of reporting measures of obesogenic environmental factors and weight outcomes adopted in this study. 50 , 51 Moreover, more studies should be developed in both developed and especially developing countries, to provide a more comprehensive picture of the influences of environmental factors on obesity risk in various contexts. In developed countries, more studies on the basis of modern datasets should be considered, such as the US National Household Food Acquisition and Purchase Survey (FoodAPS).
5. CONCLUSIONS
This systematic review revealed a rather mixed relationship between access to supermarkets and weight‐related behaviours/outcomes among children and adolescents. Half of the included articles indicated a negative relationship between supermarket access and children's BMI. More high‐quality studies are warranted to form a robust understanding of this epidemiologic relationship.
CONFLICT OF INTEREST
We declare no conflicts of interest.
Supporting information
Table S1. Associations of access to supermarkets with weighted‐related behaviors and body‐weight status in the included studies (see [ref] in the main text)
Table S2. Associations of access to supermarkets with weighted‐related behaviors and body‐weight status across different factors (see [ref] in the main text)
Table S3. Study quality assessment (see study refs in the main text and see 14 questions in the footnote)
ACKNOWLEDGEMENTS
We thank the International Institute of Spatial Lifecourse Epidemiology (ISLE) and the United Nations Children's Fund (Unicef 2018‐Nutrition‐2.1.2.3) for Research support. [Correction added on 8 February 2021, after first publication: Acknowledgements have been revised.]
APPENDIX A. SEARCH STRATEGY
The search strategy includes all possible combinations of keywords from the following three groups:
“supermarket*,” “super market*,” “supercenter*,” “super center*,” “hypermarket*,” “hyper market*”;
“child*,” “juvenile*,” “pubescent*,” “pubert*,” “adolescen*,” “youth*,” “teen*,” “kid*,” “young*,” “youngster*,” “minor*,” “student*,” “pupil*,” “pediatric*,” “preschooler*,” “pre‐schooler*,” “schoolchild*,” “school‐child*,” “school child*,” “schoolage*,” “school‐age*,” “school age*”;
“diet*,” “diet behavio*,” “dietary behavio*,” “eating*,” “eating behavio*,” “food*,” “food intak*,” “food consum*,” “energy intak*,” “energy consum*,” “energy balance,” “calorie*,” “caloric intak*,” “physical activit*,” “physical exercis*,” “exercis*,” “body activit*,” “body mass index,” “BMI,” “weight,” “weight status,” “weight‐related behavio*,” “weight‐related health,” “overweight,” “obese,” “obesity,” “adiposity,” “abdominal overweight,” “abdominal obesity,” “central overweight,” “central obesity,” “central adiposity,” “waist circumference,” “waist to hip,” “waist‐to‐hip,” “waist to height,” “waist‐to‐height,” “waist to stature,” “waist‐to‐stature,” “fatness,” “body fat,” “excess fat,” “excess weight,” “overnutrition,” “over‐nutrition,” “over nutrition.”
Zhou Q, Zhao L, Zhang L, et al. Neighborhood supermarket access and childhood obesity: A systematic review. Obesity Reviews. 2021;22(S1):e12937. 10.1111/obr.12937
[Correction added on 8 February 2021, after first online publication: (1) affiliation numbers of Qian Xiao, Tong Wu, Juanguo Xin and Hong Xue have been re‐arranged; (2) Peng Jia's correspondence details have been updated.]
[Correction added on 8 February 2021, after first online publication: Funding Information has been revised.]
Contributor Information
Li Zhao, Email: zhaoli@scu.edu.cn.
Peng Jia, Email: jiapengff@hotmail.com.
REFERENCES
- 1. Ogden CL, Carroll MD, Kit BK, Flegal KM. Prevalence of childhood and adult obesity in the United States, 2011‐2012. JAMA. 2014;311(8):806‐814. [DOI] [PMC free article] [PubMed] [Google Scholar]
- 2. WHO . Obesity and overweight: facts about overweight and obesity. 2018.
- 3. United Nations Children's Fund WHO, and World Bank Group . Levels and trends in child malnutrition. Geneva, New York: UNICEF/WHO/World Bank Group Joint Child Malnutrition Estimates; 2017. [Google Scholar]
- 4. Abarca‐Gomez LAZ, Hamid ZA. Worldwide trends in body‐mass index, underweight, overweight, and obesity from 1975 to 2016: a pooled analysis of 2416 population‐based measurement studies in 128.9 million children, adolenscent, and adults. The Lancet. 2017;390:2627‐2642. [DOI] [PMC free article] [PubMed] [Google Scholar]
- 5. Ebbeling CB, Ludwig DS. Treating obesity in youth: should dietary glycemic load be a consideration? Adv Pediatr. 2001;48:179‐212. [PubMed] [Google Scholar]
- 6. Prevention UCfDCa . Overweight and obesity: consequences. http://www.cdc.go/obesity/childhood/consequences.html. 2010.
- 7. Rudolf M, Perera R, Swanston D, Burberry J, Roberts K, Jebb S. Observational analysis of disparities in obesity in children in the UK: has Leeds bucked the trend? Pediatr Obes. 2019;14(9):e12529. [DOI] [PMC free article] [PubMed] [Google Scholar]
- 8. Fiechtner L, Cheng ER, Lopez G, Sharifi M, Taveras EM. Multilevel correlates of healthy BMI maintenance and return to a healthy BMI among children in Massachusetts. Child Obes. 2017;13(2):146‐153. [DOI] [PMC free article] [PubMed] [Google Scholar]
- 9. Biener AIDS. Medical care use and expenditures associated with adult obesity in the United States.pdf. JAMA. 2018;319(3):218. [DOI] [PubMed] [Google Scholar]
- 10. Block JP, Christakis NA, O'malley AJ, Subramanian S. Proximity to food establishments and body mass index in the Framingham Heart Study offspring cohort over 30 years. Am J Epidemiol. 2011;174(10):1108‐1114. [DOI] [PMC free article] [PubMed] [Google Scholar]
- 11. Jia P, Cheng X, Xue H, Wang Y. Applications of geographic information systems (GIS) data and methods in obesity‐related research. Obes Rev. 2017;18(4):400‐411. [DOI] [PubMed] [Google Scholar]
- 12. Powell LM, Han E, Chaloupka FJ. Economic contextual factors, food consumption, and obesity among US adolescents. J Nutr. 2010;140(6):1175‐1180. [DOI] [PubMed] [Google Scholar]
- 13. Jia P, Xue H, Cheng X, Wang Y. Effects of school neighborhood food environments on childhood obesity at multiple scales: a longitudinal kindergarten cohort study in the USA. BMC Med. 2019;17(1):99. [DOI] [PMC free article] [PubMed] [Google Scholar]
- 14. Wang Y, Jia P, Cheng X, Xue H. Improvement in food environments may help prevent childhood obesity: evidence from a 9‐year cohort study. Pediatr Obes. 2019;e12536. [DOI] [PMC free article] [PubMed] [Google Scholar]
- 15. Hawkes C. Sales promotions and food consumption. Nutr Rev. 2009;67(6):333‐342. [DOI] [PubMed] [Google Scholar]
- 16. Reardon T, Timmer CP, Barrett CB. The rise of supermarkets in Africa, Asia, and Latin America. Am J Agric Econ. 2003;5(85):1140‐1146. [Google Scholar]
- 17. Traill WB. The rapid rise of supermarket? Dev Policy Rev. 2006;2(24):163‐174. [Google Scholar]
- 18. Qaim M. Does globalization of agrifood systems provide sustainable nutrition? Ann Nutr Metab. 2015;67:76‐77.26315933 [Google Scholar]
- 19. Galvez MP, Hong L, Choi E, Liao L, Godbold J, Brenner B. Childhood obesity and neighborhood food‐store availability in an inner‐city community. Acad Pediatr. 2009;9(5):339‐343. [DOI] [PMC free article] [PubMed] [Google Scholar]
- 20. Fiechtner L, Kleinman K, Melly SJ, et al. Effects of proximity to supermarkets on a randomized trial studying interventions for obesity. Am J Public Health. 2016;106(3):557‐562. [DOI] [PMC free article] [PubMed] [Google Scholar]
- 21. Xin J, Zhao L, Wu T, et al. Association between access to convenience stores and childhood obesity: A systematic review. Obes Rev. 2021;22(Suppl 1):e12908. [DOI] [PMC free article] [PubMed] [Google Scholar]
- 22. Epstein LH, Raja S, Danieel TO, et al. The built environment moderates effects of family‐based childhood obesity treatment over 2 years. Ann Behav Med publ Soc Behav Medicine. 2012;44(2):248‐258. [DOI] [PMC free article] [PubMed] [Google Scholar]
- 23. Griffiths C, Frearson A, Taylor A, Radley D, Cooke C. A cross sectional study investigating the association between exposure to food outlets and childhood obesity in Leeds, UK. Int J Behav Nutr Phys Act. 2014;11(1):138. [DOI] [PMC free article] [PubMed] [Google Scholar]
- 24. Moher D, Shamseer L, Clarke M, et al. Preferred reporting items for systematic review and meta‐analysis protocols (PRISMA‐P) 2015 statement. Syst Rev. 2015;4(1):1. [DOI] [PMC free article] [PubMed] [Google Scholar]
- 25. Larsen K, Cook B, Stone MR, Faulkner GE. Food access and children's BMI in Toronto, Ontario: assessing how the food environment relates to overweight and obesity. Int J Public Health. 2015;60(1):69‐77. [DOI] [PubMed] [Google Scholar]
- 26. Powell LM, Bao Y. Food prices, access to food outlets and child weight. Econ Hum Biol. 2009;7(1):64‐72. [DOI] [PubMed] [Google Scholar]
- 27. Shier V, An R, Sturm R. Is there a robust relationship between neighbourhood food environment and childhood obesity in the USA? Public Health. 2012;126(9):723‐730. [DOI] [PMC free article] [PubMed] [Google Scholar]
- 28. Powell LM, Auld MC, Chaloupka FJ, O'Malley PM, Johnston LD. Associations between access to food stores and adolescent body mass index. Am J Prev Med. 2007;33(4):301‐307. [DOI] [PubMed] [Google Scholar]
- 29. Howard PH, Fitzpatrick M, Fulfrost B. Proximity of food retailers to schools and rates of overweight ninth grade students: an ecological study in California. BMC Public Health. 2011;11(1):68. [DOI] [PMC free article] [PubMed] [Google Scholar]
- 30. Rosenshein L, Waters N. The effect of healthy food accessibility on childhood obesity; 2009.
- 31. Hsieh S, Klassen AC, Curriero FC, et al. Built environment associations with adiposity parameters among overweight and obese Hispanic youth. Prev Med Rep. 2015;2:406‐412. [DOI] [PMC free article] [PubMed] [Google Scholar]
- 32. Fiechtner L, Sharifi M, Sequist T, et al. Food environments and childhood weight status: effects of neighborhood median income. Child Obes. 2015;11(3):260‐268. [DOI] [PMC free article] [PubMed] [Google Scholar]
- 33. Matanane L, Fialkowski MK, Silva J, et al. Para I Famagu'on‐Ta: fruit and vegetable intake, food store environment, and childhood overweight/obesity in the children's healthy living program on Guam. Hawaii J Med Public Health. 2017;76(8):225‐233. [PMC free article] [PubMed] [Google Scholar]
- 34. Tang X, Ohri‐Vachaspati P, Abbott JK, et al. Associations between food environment around schools and professionally measured weight status for middle and high school students. Child Obes. 2014;10(6):511‐517. [DOI] [PMC free article] [PubMed] [Google Scholar]
- 35. Auld MC, Powell LM. Economics of food energy density and adolescent body weight. Econ. 2009;76(304):719‐740. [Google Scholar]
- 36. Fiechtner L, Block J, Duncan DT, et al. Proximity to supermarkets associated with higher body mass index among overweight and obese preschool‐age children. Prev Med. 2013;56(3‐4):218‐221. [DOI] [PMC free article] [PubMed] [Google Scholar]
- 37. Koleilat M, Whaley SE, Afifi AA, Estrada L, Harrison GG. Understanding the relationship between the retail food environment index and early childhood obesity among WIC participants in Los Angeles county using GeoDa. Online J Public Health Inf. 2012;4(1):XXX. [DOI] [PMC free article] [PubMed] [Google Scholar]
- 38. Shier V, Nicosia N, Datar A. Neighborhood and home food environment and children's diet and obesity: evidence from military personnel's installation assignment. Soc Sci Med. 2016;158:122‐131. [DOI] [PMC free article] [PubMed] [Google Scholar]
- 39. Wall MM, Larson NI, Forsyth A, et al. Patterns of obesogenic neighborhood features and adolescent weight: a comparison of statistical approaches. Am J Prev Med. 2012;42(5):65‐75. [DOI] [PMC free article] [PubMed] [Google Scholar]
- 40. Chen HJ, Wang Y. Changes in the neighborhood food store environment and children's body mass index at peripuberty in the United States. J Adolesc Health. 2016;58(1):111‐118. [DOI] [PMC free article] [PubMed] [Google Scholar]
- 41. Li Y, Robinson LE, Carter WM, Gupta R. Childhood obesity and community food environments in Alabama's Black Belt region. Child Care Health Dev. 2015;41(5):668‐676. [DOI] [PubMed] [Google Scholar]
- 42. Kimenju SC, Rischke R, Klasen S, Qaim M. Do supermarkets contribute to the obesity pandemic in developing countries? Public Health Nutr. 2015;18(17):3224‐3233. [DOI] [PMC free article] [PubMed] [Google Scholar]
- 43. Jia P, Shi X, Xierali IM. Teaming up census and patient data to delineate fine‐scale hospital service areas and identify geographic disparities in hospital accessibility. Environ Monit Assess. 2019;191(Suppl 2):303. [DOI] [PMC free article] [PubMed] [Google Scholar]
- 44. Jia P, Wang F, Xierali IM. Using a Huff‐based model to delineate hospital service areas. Prof Geogr. 2017;69(4):522‐530. [Google Scholar]
- 45. Baker EA, Schootman M, Barnidge E, Kelly C. Peer reviewed: the role of race and poverty in access to foods that enable individuals to adhere to dietary guidelines. Prev Chronic Dis. 2006;3(3):XXX. [PMC free article] [PubMed] [Google Scholar]
- 46. Jia P, Stein A, James P, et al. Earth observation: investigating noncommunicable diseases from space. Annu Rev Public Health. 2019;40(1):85‐104. [DOI] [PubMed] [Google Scholar]
- 47. Jia P, Stein A. Using remote sensing technology to measure environmental determinants of non‐communicable diseases. Int J Epidemiol. 2017;46(4):1343‐1344. [DOI] [PubMed] [Google Scholar]
- 48. Jia P, Xue H, Yin L, Stein A, Wang M, Wang Y. Spatial technologies in obesity research: current applications and future promise. Trends Endocrinol Metab. 2019;30(3):211‐223. [DOI] [PubMed] [Google Scholar]
- 49. Jia P, Xue H, Cheng X, Wang Y, Wang Y. Association of neighborhood built environments with childhood obesity: evidence from a 9‐year longitudinal, nationally representative survey in the US. Environ Int. 2019;128:158‐164. [DOI] [PubMed] [Google Scholar]
- 50. Jia P. Spatial lifecourse epidemiology. The Lancet Planetary Health. 2019;3(2):e57‐e59. [DOI] [PubMed] [Google Scholar]
- 51. Jia P, Lakerveld J, Wu J, et al. Top 10 research priorities in spatial lifecourse epidemiology. Environ Health Perspect. 2019;127(7):74501. [DOI] [PMC free article] [PubMed] [Google Scholar]
Associated Data
This section collects any data citations, data availability statements, or supplementary materials included in this article.
Supplementary Materials
Table S1. Associations of access to supermarkets with weighted‐related behaviors and body‐weight status in the included studies (see [ref] in the main text)
Table S2. Associations of access to supermarkets with weighted‐related behaviors and body‐weight status across different factors (see [ref] in the main text)
Table S3. Study quality assessment (see study refs in the main text and see 14 questions in the footnote)