

Abstract
Radiation therapy for head and neck cancer causes damage to the surrounding salivary glands, resulting in salivary gland hypofunction and xerostomia. Current treatments do not provide lasting restoration of salivary gland function following radiation; therefore, a new mechanistic understanding of the radiation-induced damage response is necessary for identifying therapeutic targets. The purpose of the present study was to investigate the metabolic phenotype of radiation-induced damage in parotid salivary glands by integrating transcriptomic and metabolomic data. Integrated data were then analyzed to identify significant gene-metabolite interactions. Mice received a single 5 Gy dose of targeted head and neck radiation. Parotid tissue samples were collected 5 days following treatment for RNA sequencing and metabolomics analysis. Altered metabolites and transcripts significantly converged on a specific region in the metabolic reaction network. Both integrative pathway enrichment using rank-based statistics and network analysis highlighted significantly coordinated changes in glutathione metabolism, energy metabolism (TCA cycle and thermogenesis), peroxisomal lipid metabolism, and bile acid production with radiation. Integrated changes observed in energy metabolism suggest that radiation induces a mitochondrial dysfunction phenotype. These findings validated previous pathways involved in the radiation-damage response, such as altered energy metabolism, and identified robust signatures in salivary glands, such as reduced glutathione metabolism, that may be driving salivary gland dysfunction.
Keywords: γ-radiation, metabolomics, transcriptomics, salivary glands, xerostomia
INTRODUCTION
The American Cancer Society estimates that over 53,000 new cases of head and neck cancer are reported each year in the United States (1). Radiation therapy is part of the standard of care for these types of cancers, but unfortunately it causes irreversible damage to the surrounding salivary glands resulting in a significant loss of physiological function (2). This damage leads to chronic hyposalivation and xerostomia, diminishing the quality of life of these patients with cancer (3, 4). Prevention and treatment options for xerostomia, such as anti-inflammatory cytokine drugs and topical analgesics, only provide symptom control and do not restore endogenous production of saliva (5, 6).
To capture the systemic damage caused by radiation, metabolomics analyses of saliva, serum, and urine have been conducted to identify biomarkers of whole body radiation exposure in mouse models (7–9). At the tissue level, radiotherapy (2 Gy γ-radiation) has been shown to alter energy and membrane metabolism in testicular tissue of mice at acute (24 h) and chronic (5 wk) time points post radiation (10). Interestingly, trichostatin A administration (an epigenetic regulator) reversed the observed radiation-induced metabolic alterations and testicular dysfunction (10). This research demonstrates that a therapeutic intervention can restore tissue-specific function following radiotherapy. To our knowledge, no study has investigated the metabolic alterations caused by radiation-induced damage to salivary glands.
Although metabolomic profiling technologies have become increasingly powerful, metabolite levels alone may not specifically determine which reactions are altered by irradiation, and other omics data can help fill this gap. Integration of transcriptomic and metabolomic data can identify significant associations between enzymes and metabolites that drive the phenotype under study. A common approach for interpreting omics data is to evaluate the differentially expressed genes or metabolites for known pathways, but this analysis will necessarily limit the scope to a small subset of features. Gene set enrichment analysis (GSEA) (11) is a popular alternative approach that uses the full range of P values across all genes to identify pathways ranked higher than expected by chance. GSEA and metabolite set enrichment analysis (MSEA) (12) can be combined to find pathways that are significant across both modalities. However, changes in metabolic state cannot always be neatly confined to predefined pathways, and these analysis strategies cannot discover new disease pathways. Overlaying gene and/or metabolite data on networks of known interactions can reveal “active modules” that provide mechanistic insight without being limited to predefined pathways (13).
The purpose of this study was to integrate genes and metabolites altered in response to irradiation of salivary glands and integrate their function using network- and pathway-based enrichment analysis. One key finding is that radiation treatment leads to coordinated changes in a statistically significant region of the metabolic network. Integrated enriched pathways include glutathione metabolism, energy metabolism (TCA cycle and thermogenesis), peroxisomal lipid metabolism, and bile acid production. Manual curation of metabolites not annotated to Kyoto Encyclopedia of Genes and Genomes (KEGG) or Human Metabolome Database (HMDB) correspond to increased synthesis of glycosyl ceramides and increased sphingosine levels, highlighting additional metabolic pathways involved in the radiation-damage response that cannot, by definition, be captured using conventional pathway enrichment. Both our manual curation and our automated network integration analyses revealed new metabolic facets of previously observed radiation-induced salivary gland phenotypes. These metabolic alterations potentially explain the exquisite sensitivity of salivary gland tissue to radiation.
METHODS
Mice and Radiation Treatment
Mice were housed and treated following protocols approved by the University of Arizona Institutional Animal Care and Use Committee (IACUC). All experiments were conducted using female FVB mice obtained from Jackson Laboratories (Bar Harbor, ME). At 4–6 wk of age, mice were treated with one 5 Gy radiation dose using a 60Cobalt Teletherapy Instrument from Atomic Energy of Canada Ltd Theratron (80-cm distance from source). Before radiation treatment, mice were anesthetized with an intramuscular injection of ketamine/xylazine (70 mg/kg–10 mg/mL) and placed in a 50-mL conical tube. To target the head and neck region for radiation treatment, the rest of the body was shielded with >6-mm thick lead during radiation exposure.
Tissue Preparation and Metabolomics Processing
Parotid salivary glands were extracted from mice 5 days post radiation treatment (n = 4) and from untreated mice (n = 4). Tissue was snap frozen and shipped to Metabolon, Inc., for metabolomic profiling. Samples were prepared by precipitating proteins with methanol-containing standards for reporting extraction efficiency. The instrument settings, data procurement, and software for data management have been previously described in detail (14, 15). Briefly, samples were desiccated under a vacuum for at least 24 h followed by nitrogen derivatization using bistrimethyl-silyl-trifluoroacetamide. Metabolomic profiles were collected on three separate platforms using ultra-high performance liquid chromatography (Waters Corporation) coupled to a linear trap quadrupole mass spectrometer (Thermo Fisher Scientific, Inc.) (UPLC-MS/MS2) in 1) positive ion mode, 2) negative ion mode, and 3) polar mode (negative ionization). Identification of metabolites was performed by automated comparison of the ion features to an in-house reference library. The reference library contains over 2,400 reliable chemical standard entries that incorporate retention time, molecular weight (m/z), preferred adducts, and in-source fragments with their associated MS-MS2 spectra. Fast identification of metabolites in the samples was achieved with high confidence using this reference library. The median relative standard deviation (RSD) for the internal standards used for each sample run was calculated to assess instrument variability and was found to be 3%. To assess total process variability, the RSD for all endogenous biochemicals in the technical replicates was calculated and found to be 7%.
Metabolomics Statistical Analysis
Metabolon data were processed using MetaboAnalyst (MetaboAnalyst 4.0) (16). Metabolites with missing values in at least 50% of samples were removed; remaining missing values were imputed with half of the minimum positive value in the original data based on the assumption that the values were below the instrument detection sensitivity limits. These data were then normalized using log-transformation and Pareto scaling as previously described for metabolomics studies (17). Sample distribution of metabolite data was assessed by principal component analysis (PCA), using the package prcomp from R (18), and Orthogonal partial least squares discriminant analysis (OPLS-DA), using the package ropls from R (19). Both PCA and OPLS-DA results were visualized with the ggplot2 package from R (20). A significant-features plot (S-plot) was generated that visualized the variable influence in the OPLS-DA model. Metabolites with p1 between −20 and −10 were considered important metabolites upregulated in response to radiation, and metabolites with p1 between 10 and 20 were considered important metabolites downregulated in response to radiation. The metabolites identified as important from the S-plot that were not annotated to Human Metabolome Database (HMDB) IDs were assigned corresponding pathway(s) and enzymes using MetaCyc (21, 22). For metabolites not identified by MetaCyc, corresponding pathways(s) and enzymes were curated manually using PubChem and KEGG when available (23). The Mouse Multiple Tissue Metabolomic Database (MMMDB) was not used for this study as it does not contain information specific to the mouse salivary glands.
Metabolite Differential Intensity Analysis
Normalized metabolite data were compared between untreated and irradiated conditions using the R package limma (24). A significance threshold of Padj < 0.25 (P values adjusted using Benjamin–Hochberg method) was used and differentially expressed metabolites visualized with the pheatmap package from R (25). Metabolite pathway enrichment was performed by metabolite set enrichment analysis (MSEA), using the R package fgsea with the preranked option. Metabolites were ranked by their [−log10(P value)] × sign[log2(fold change)] value and tested for enrichment against the metabolite Consensus Pathways Database (CPDB).
RNA Isolation, NGS Library Preparation, and Sequencing
Parotid salivary glands were extracted from a separate set of mice 5 days post radiation treatment (n = 3) and from untreated mice (n = 3) for transcriptomic profiling. Tissue was snap frozen and shipped to the University of Arizona Genomics Core for RNA-seq analysis. RNA was isolated with TRIzol reagent using the manufacturer’s protocol (Thermo Fisher Scientific, Inc.), then treated with RNase-free DNase. Presence of residual genomic DNA (gDNA) was visually assessed based on the electropherogram trace from the Illumina Fragment Analyzer, where it would show a signal after the 6,000 bp marker. The degree of RNA degradation was assessed by microfluidic electrophoresis, measured through RQN score (mean score = 7.38). One sample, untreated replicate 1 (UT1), had RQN = 4.7 which is lower than the threshold of seven. Due to the preciousness of the sample (which consists of all parotid salivary gland tissue from one mouse), the sample was sequenced and the data quality was assessed after sequencing; see RNA-Seq Data Preprocessing and Analysis for more details. cDNA libraries were prepared with the Illumina TruSeq Stranded Total RNA Library Prep Kit and Illumina RNA single indexing following the manufacturer’s protocol with an input of 2,000 ng of template. The final NGS library was quantified via qPCR with a probe complimentary to the adapter sequences involved in a built library along with a purchased standard ladder designed for the NGS library measuring process. Samples were sequenced using the HiSeq 2500 platform in the rapid run configuration (2 × 100 paired-end sequencing) and subsequent base calling with the BCL2Fastq software from Illumina.
RNA-Seq Data Preprocessing and Analysis
Raw reads quality was assessed using FastQC 0.1 (26) and reads were trimmed using Trimmomatic 0.32 (27). See Supplemental Fig. S1 (all supplemental material available at https://doi.org/10.5281/zenodo.4391402) for quality control metrics for all six samples. Reads were aligned to mouse reference genome GRCm38 using HISAT2 (28). Gene-level counts were determined using HTSeq-count 0.6.1 (29). Genes with zero read counts in all six samples were removed from further analysis. Counts data were normalized using the variance stabilizing transformation method from DESeq2 (30). Principal component analysis (PCA) was carried out in R. Differential expression analysis was performed with default parameters in DESeq2, and genes with an adjusted P value < 0.05 were visualized with the ComplexHeatmap package from R (31). We mapped the mouse Ensembl gene IDs to human orthologs using the standard pipeline in the R package biomaRt, which in turn pulls the data from Ensembl. Ensembl predicts gene orthology using a maximum likelihood phylogenetic gene tree generated by TreeBeST (32). Pathway enrichment was determined by Gene Set Enrichment Analysis (GSEA), as implemented in the R package fgsea, using the preranked genes option. Genes were ranked by their [−log10(P value)] × sign[log2(fold change)] value and were tested for enrichment in Gene Ontology (GO) biological process gene sets from MSigDB. Please see Supplemental Bioinformatics Methods for more detailed information about the commands and parameters used.
Low RQN sample.
The untreated replicate 1 (UT1) sample had low RQN value. We, therefore, assessed the UT1 data using multiple metrics to determine its usability for this study. UT1 was indistinguishable from UT2 and UT3 with regards to 1) FastQC results, 2) Phred scores, 3) total number of raw reads, 4) percentage of mapped reads, and 5) PCA (Supplemental Fig. S1). In an unbiased analysis using only the 500 most variable genes across all six samples, UT1 clearly clustered with UT2 and UT3 (Supplemental Fig. S1). We, therefore, included UT1 in all further analysis.
Pathway Enrichment
Integrated pathway analysis was conducted by first performing gene and metabolite pathway enrichment separately by preranked gene set enrichment analysis (GSEA), as implemented in the R package fgsea. Genes and metabolites were ranked by their [−log10(P value)] × sign[log2(fold change)] value and were tested for enrichment against the ConsensusPathDB (CPDB) pathways downloaded from the CPDB website on June 11, 2020, 1213, GMT 0700. Joint pathway enrichment analysis was carried out according to Cavill (33), where metabolite and gene set enrichment analysis results were combined, and only pathways with enrichment estimates for both genes and metabolites were selected. For each pathway i, the joint P value (P-joint) was calculated using the equation , where is the metabolite enrichment P value and is the gene enrichment P value for pathway i determined via fgsea. False discovery rates (FDR) for the joint P values were calculated according to the Benjamini–Hochberg method (18). Pathways considered as significant were selected based on the criteria of having < 0.05, < 0.05, and FDR < 0.05.
Network Analysis of Significant Metabolites and Genes
STITCH.
All human chemical-protein interactions were downloaded from STITCH (stitch.embl.de) on Feb 9 2020. Note that this graph is bipartite, as edges exist only between proteins and chemicals. A radiation-associated subgraph of STITCH was created by restricting to genes with Padj < 0.05 and metabolites with P < 0.05, where P is the unadjusted P value. This subgraph had 61 metabolites, 91 genes, and 298 edges between them. To test the significance of the subgraph, we selected 1,000 random sets of matched metabolites and genes from the set of all measured genes and metabolites in our platforms. We then computed the number of unique STITCH interactions and total edge weight for each matched random subgraph. An empirical P value was computed by summing the number of times the random subgraph had a larger number of unique interactions or total edge weight than the observed radiation-associated subgraph. The code used to perform this analysis is provided in the Supplemental data. To visualize the subgraph, we used the R package condor to identify bipartite network communities, MetaboAnalyst to identify enriched pathways (parameters on web-based application: “Joint pathway enrichment” with no fold changes, KEGG or HMDB metabolite IDs used depending on which had better coverage, enrichment run against “All pathways” not just metabolic, Fisher’s exact test with, “Combine queries” option), and Cytoscape v3.7.2 to create the final network image (34).
Recon3d.
The Recon3d reactions and annotations were downloaded from https://www.vmh.life on May 13, 2020. Genes and metabolites were restricted using the same P value thresholds as for STITCH. Edges were drawn between every differential gene and metabolite (mapping to a KEGG ID) that participated in a common reaction according to Recon3d. The network was visualized using Cytoscape v3.7.2.
Metanetwork.
Metanetworks were created by adding the scores of the STITCH interactions between all measured members of the two pathways, or only the GSEA leading edge genes and metabolites in the two pathways. The total STITCH score was then used as the final edge weight connecting two pathway nodes in the metanetwork.
Active Module Analysis
jActiveModules.
Active modules were identified using jActiveModules plugin in Cytoscape 3.7.2 (13). The input network was the STITCH subnetwork consisting of all genes and metabolites that were measured in our data set (by Metabolon or by RNA-sequencing). Unadjusted differential expression P values were used to score all nodes. Module search was carried out using default settings. “Max depth from start nodes” was set to the default value of 2.
Genes and Metabolites app.
Unadjusted P values and log2(fold change) values were input for all measured genes and all measured metabolites with KEGG identifiers (35). Whenever multiple transcripts mapped to the same gene, the transcript with the lowest P value was chosen to represent that gene. Genes and Metabolites app (GAM) was run using the R Shiny app (https://artyomovlab.wustl.edu/shiny/gam/) with default parameters.
Supplemental Information on Bioinformatics Methods
For more details about the precise bioinformatics methods (including software commands, parameter choices, and quality control steps), see “Supplemental Bioinformatics Methods.” For code reproducibility, we have made the scripts used for alignment, read counting, differential expression, PCA, metabolite data processing and analysis (including differential abundance and OPLS-DA), joint pathway enrichment, and network analysis (i.e., computing the significance of the subnetwork of differentially expressed genes and metabolites) available as supplemental data.
RESULTS
Metabolomic and Transcriptomic Profiling of Irradiated Salivary Glands
Out of 2,400 authentic standards in the Metabolon proprietary in-house library, a total of 749 metabolites were detectable (Supplemental Table S1). At 5 days post radiation, a clear distinction was observed between the metabolite profiles of the irradiated and untreated (control) groups in the principal component analysis (PCA; Fig. 1A) and orthogonal partial least squares discriminant analysis (OPLS-DA; Fig. 1B). From the OPLS-DA S-plot (Fig. 1C), we identified 34 metabolites of importance that were upregulated (between −20 and −10 p1) and 20 that were downregulated (between 10 and 20 p1) in the irradiated group (Supplemental Table S2). Metabolites that were higher in irradiated glands included amino acid derivatives, bile acids, and ceramides, whereas metabolites that were lower in the irradiated glands fell into glutathione and glycerol families. Out of the 54 metabolites identified from the S-plot, five were not annotated to KEGG, HMDB, or PubChem: 1-dihomo-linolenylglycerol (20:3), 1-heptadecenoylglycerol (17:1), equol sulfate, glycosyl ceramide (d18:1/20:0, d16:1/22:0), and glycosyl ceramide (d18:2/24:1, d18:1/24:2) (Supplemental Table S2). Therefore, these five metabolites could not be included in GSEA, MSEA, joint pathway enrichment, or network analysis and were manually annotated to pathways.
Figure 1.

Metabolite profile differences between irradiated (IR) (n = 4) and untreated (UT) (n = 4) parotid salivary gland tissue in female mice. A: principal component analysis (PCA) scores of normalized metabolite data separated by condition with principal component 1 (PC1) accounting for 30% of the variance and principal component 2 (PC2) accounting for 25% of the variance between conditions. B: orthogonal partial least squares discriminant analysis (OPLS-DA) scores of normalized metabolite data separated by condition (p1 is the predictive component displaying variation between conditions and o1 is the orthogonal component displaying variation within conditions). C: OPLS-DA loadings significant features (S-plot) shows the contribution (p1) and the reliability (p1_corr) of the predictive component separating the metabolites by condition. D: heatmap of top 25 differentially expressed metabolites with a significance threshold of Padj < 0.25 in irradiated vs. untreated samples. Color key denotes the Z-score by row.
Differential intensity analysis showed seven metabolites with Padj < 0.1 and 30 metabolites with unadjusted P < 0.01 between the irradiated and untreated conditions, out of the 749 total identified metabolites (Supplemental Table S3). The top 25 most significant differentially expressed metabolites are shown in the heatmap (Fig. 1D). Using metabolite set enrichment analysis (MSEA), we found that altered metabolites are enriched for amino acid metabolism, sphingolipid metabolism, and nucleotide metabolism (the full list of significant pathways is provided in Supplemental Table S4).
To profile the transcriptome, we performed RNA-sequencing of untreated and irradiated salivary glands. One of the untreated samples had low quality according to its RNA Quality Number (RQN) score but passed all other quality control metrics and was included in further analysis (see “RNA Isolation, NGS Library Preparation and Sequencing” in methods and Supplemental Fig. S1 for more details). The raw reads were mapped to 52,636 mouse Ensembl gene IDs. After filtering for low counts, there were 25,422 remaining Ensembl gene IDs. The PCA plot showed separation between irradiated and control samples (Fig. 2A). Differential expression analysis resulted in 155 genes with Padj < 0.05 annotated to mouse, out of which 135 have an associated human ortholog gene symbol (Fig. 2B, Supplemental Table S5). Furthermore, preranked gene set enrichment analysis against the Gene Ontology (GO) database for biological processes mainly showed perturbation in pathways associated with immune response, cell adhesion, and protein targeting (Supplemental Table S6). We chose to prioritize biological process (BP) terms from the GO database, as they encompass more specific signaling pathways, biological programs, and functions of the cell and are more likely to represent drug targets that could assist in repairing salivary gland dysfunction in patients. Six genes that are annotated to enzyme commission (EC) metabolic enzymes were differentially expressed; these included carbonic anhydrase 6 (CA6), UDP-glucose ceramide glucosyltransferase (UGCG), inositol polyphosphate-4-phosphatase type II B (INPP4B), ectonucleotide pyrophosphatase/phosphodiesterase 2 (ENPP2), phosphatidylinositol-4,5-bisphosphate 3-kinase catalytic subunit delta (PIK3CD), and the tyrosine kinase non-receptor 2 gene (TNK2). The lack of GO term enrichment in metabolic pathways, coupled with the relative scarcity of differentially expressed enzymes, prompted us to move to a more integrative approach that would help interpret the transcriptomic profiles in the context of the metabolic network.
Figure 2.
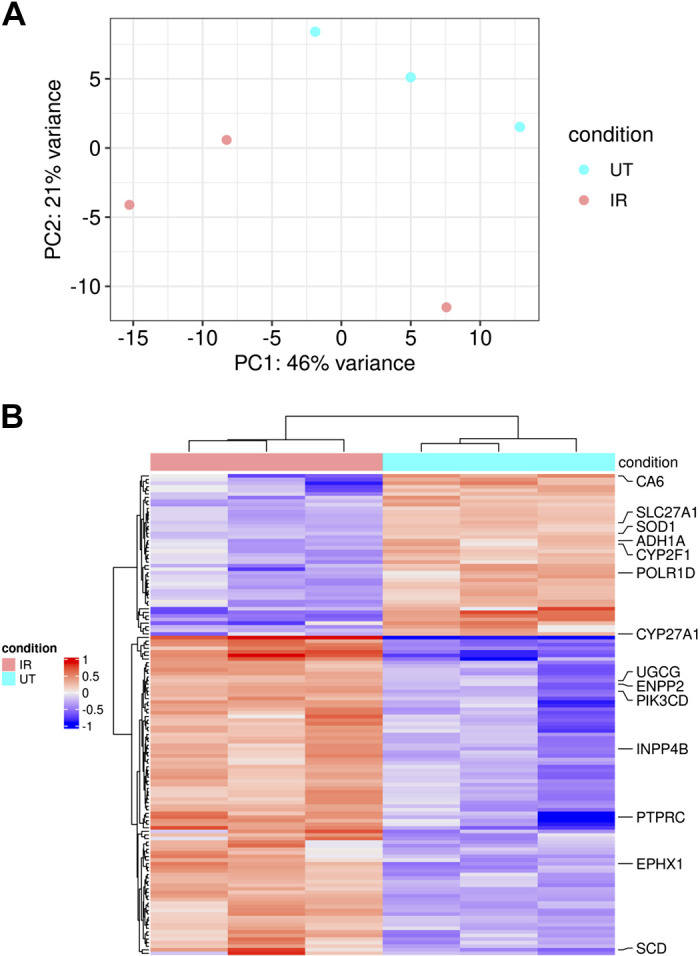
Transcriptome profile differences between irradiated (IR) (n = 3) and untreated (UT) (n = 3) parotid salivary gland tissue in female mice. A: principal component analysis (PCA) plot of RNA sequencing data. B: heatmap of 155 differentially expressed genes with Padj < 0.05 in irradiated and untreated samples. Preranked gene set enrichment analysis against the Gene Ontology database for biological processes shows significant upregulation for ceramide glucosyltransferase activity, lipid binding and phosphatidylinositol trisphosphate phosphatase activity, and protein kinase binding and phosphatase activity; significant downregulation is observed for oxidoreductase activity, long-chain fatty acid-CoA ligase activity, and carbonate dehydratase activity in response to radiation.
Integration of Metabolomic and Transcriptomic Data through Rank-Based Statistics
Separate analysis of metabolomic and transcriptomic data revealed some common pathways (such as DNA replication), but most of the enriched processes were distinct. Furthermore, only a handful of enzymes and metabolites were significantly different between irradiated and control samples after applying the standard differential expression pipeline. Therefore, we decided to use rank-based enrichment tests similar to gene set enrichment analysis (GSEA) to integrate the two data sets (see “Supplemental Bioinformatics Methods” and Supplemental Table S7). Based on this analysis, we discovered 103 pathways that have a joint false discovery rate (FDR) < 0.05 and also have nominally significant enrichment in the genes and the metabolites separately, showing that they are supported by alterations in both data types (Fig. 3A, Supplemental Table S8). The highest ranked enriched pathways include the tricarboxylic acid (TCA) cycle and respiratory electron transport (Reactome pathway: R-HSA-1428517), thermogenesis (KEGG pathway: hsa04714), and the cell cycle (KEGG pathway: hsa04110).
Figure 3.

Integration of metabolomic and transcriptomic data through pathway enrichment and network analysis. A: joint pathway enrichment P values were calculated by the product of each metabolite and gene enrichment P value against the Consesus Path Database. Adjusted P values were then estimated according to the Benjamini–Hochberg method. Bubble plot shows the top 10 enriched pathways ranked by [−log10(joint adjusted P value) × leading edge number of enzymes × leading edge number of transcription factors]/total number of leading edge genes. B: (top) network shows all STITCH interactions between nominally significant metabolites (P < 0.05; rectangles) and statistically significant genes (Padj < 0.05; ellipses), with the edge thickness proportional to the interaction score in the STITCH database. Nodes are colored according to community membership and significantly enriched pathways are indicated in the matching color. Note that yellow genes/metabolites were not statistically enriched for any KEGG pathway. (Bottom) Histograms show how the observed number of STITCH interactions (left) or total STITCH interaction score (right) among the irradiation-altered genes and metabolites (Padj < 0.05 and P < 0.05, respectively) compared with 1,000 randomly chosen matched sets of genes and metabolites measured by our transcriptomic and metabolomic platforms.
Identifying Key Gene-Metabolite Interactions through Network Analysis
Using the human ortholog genes determined earlier, we overlaid our expression and metabolite data in the context of human metabolic networks assembled in publicly available resources (STITCH and Recon3d) (36, 37). We observed that the genes with Padj < 0.05 and the metabolites with P < 0.05 interact more strongly with each other in the STITCH chemical-protein network than expected by chance (P < 0.001; permutation test). This interaction demonstrates that our two profiling experiments converge on a common metabolic subnetwork that underlies the response of salivary glands to radiation. Using network community detection, we found that the network of altered genes and metabolites fall in clusters enriched for distinct metabolic pathways including bile acid biosynthesis, fatty acid degradation, central carbon metabolism, and sphingolipid metabolism (Fig. 3B). Likewise, overlaying altered genes and metabolites on the Recon3d network of reconstructed metabolic reactions (https://www.vmh.life/#reconmaps) highlight key interactions, including the regulation of reduced glutathione by Glutathione Peroxidase 4 (GPX4); an increase in the amino acid transporter encoded by the gene solute carrier family 38 member 1 (SLC38A1) associated with higher levels of glutamine, arginine, and other amino acids; and the catalysis of the reaction creating phosphoenolpyruvate (PEP) by the gene enolase 3 (ENO3) (Supplemental Fig. S2).
Next, we sought to expand the subnetworks of altered genes and metabolites through nodes that are not themselves altered by irradiation, but which are implicated by their close proximity to differentially expressed nodes using jActiveModules (13) and the Genes and Metabolites web application (GAM) (35). The top-scoring module from jActiveModules involved amino acid metabolism, bile acids (taurochenodeoxycholate), peroxisomal lipid metabolism [Acyl-CoA Thioesterase 1 and 2 (ACOT1/ACOT2)], and glutathione (Fig. 4A). GAM also led to a network module that centered on glutamate and glutathione metabolism and connected with amino acids and putrescine (Fig. 4B). Overall, overlaying the data on the metabolic network highlighted the central role of glutathione in connecting the observed changes in amino acid metabolism, lipid metabolism, and bile acids.
Figure 4.
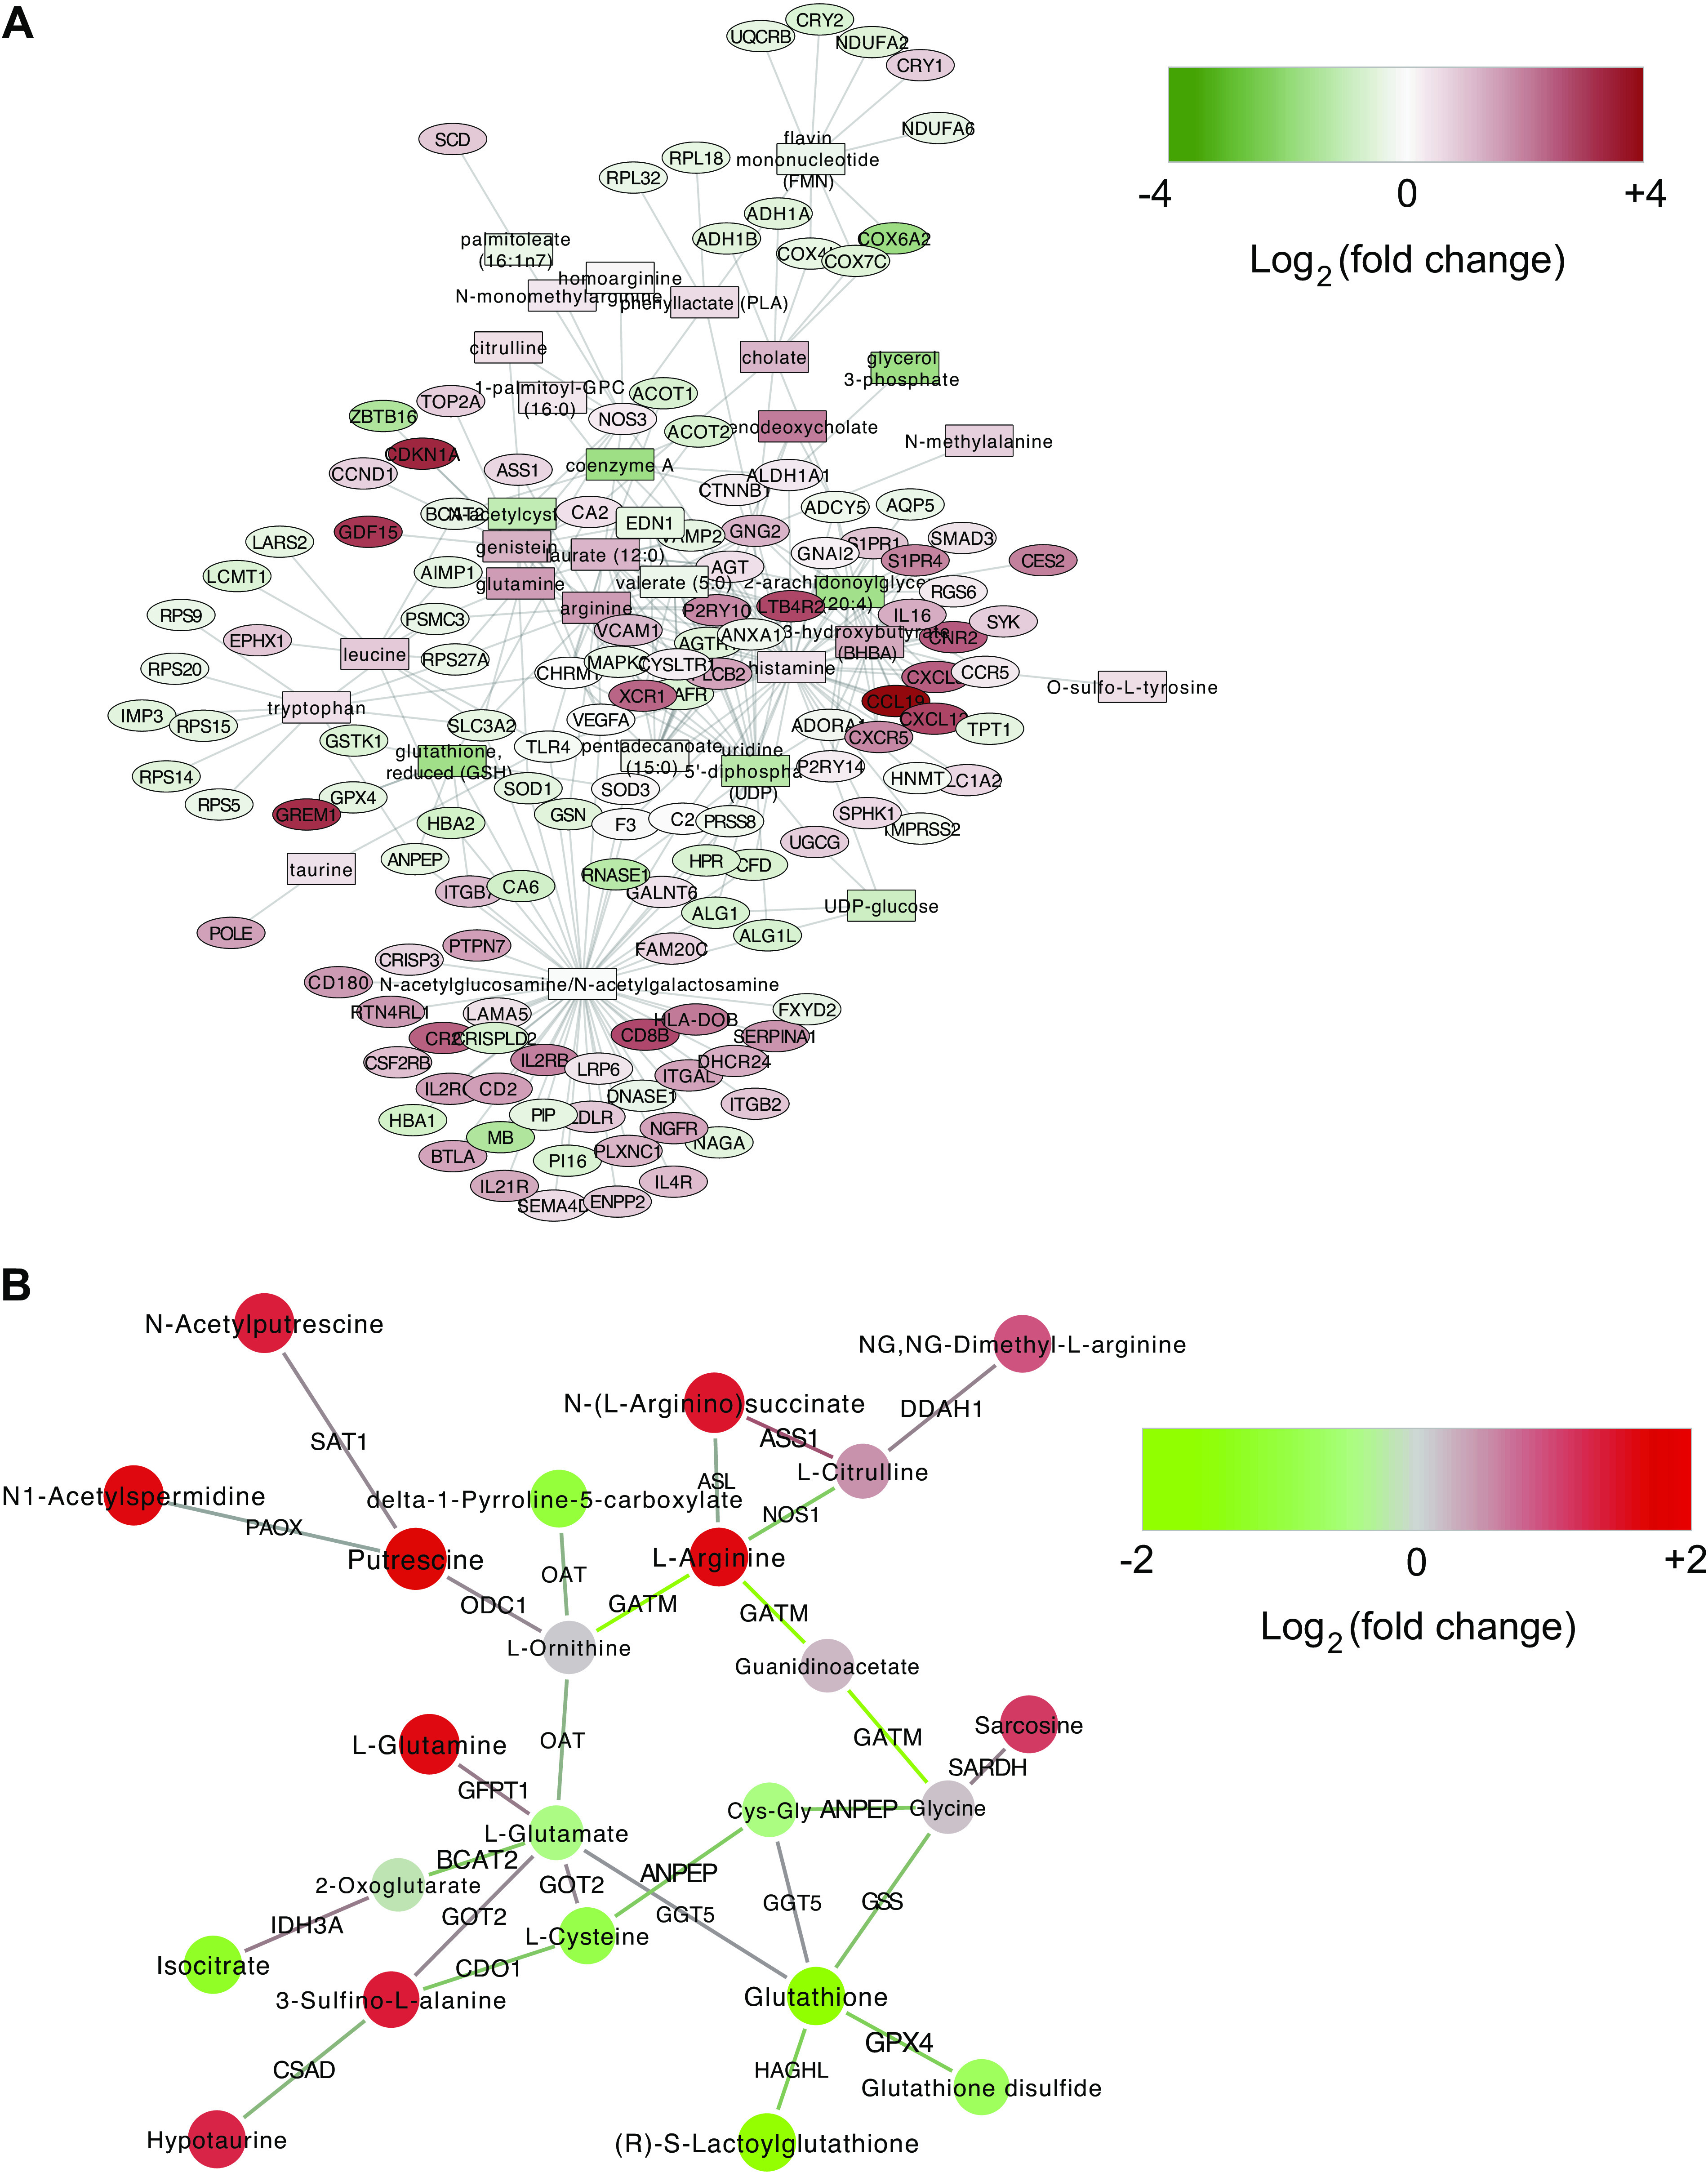
Active module analysis. A: top-scoring module from jActiveModules analysis in Cytoscape. Rectangles indicate metabolites and ovals indicate genes. B: active module found by the Shiny app Genes And Metabolites (GAM). Circles represent metabolites and edges are labeled by genes that help catalyze the metabolic reactions between those metabolites.
Integrated View of How Radiation Alters Cellular Metabolism in Salivary Glands
From the list of significantly enriched pathways from GSEA, we manually removed cell cycle and cell proliferation pathways [which are commonly observed in the radiation damage response (38, 63, 64)] and manually selected 12 representative metabolic pathways from the remaining results. To visualize how these pathways feed into each other, we constructed two metanetworks, where each pathway is represented as a single node. In the first “unperturbed” metanetwork, edges represent the total weight of STITCH interactions between all pathway members that were measured using our omics platforms; in the second “IR-perturbed” version, the edges represent the total weight of interactions between only the GSEA “leading edge” genes and metabolites that were altered in the irradiated group. The first metanetwork (Fig. 5A) shows that the baseline pathway definitions lead to strong interactions between TCA cycle, thermogenesis, and peroxisomal lipid metabolism. Comparing with the IR-perturbed metanetwork (Fig. 5B), we see in the irradiated samples a major shift toward interactions among protein digestion, glutathione metabolism, nucleotide metabolism, and cellular respiration.
Figure 5.

Metanetwork showing interactions between pathways. Nodes represent manually selected set of 12 significantly enriched metabolic pathways. Edge weights between pathways correspond to the total strength of protein-chemical interactions from the STITCH database between members of those pathways. Edge width and transparency are both proportional to edge weight. A: baseline network: all measured genes and metabolites in each pathway are included. B: perturbed network: only the leading edge genes and metabolites (i.e., those most altered by irradiation) are included from each pathway.
Next, we mapped out in greater detail the metabolic reactions in these pathways and the cellular compartments in which they take place (Fig. 6). We identified leading edge genes and metabolites from the GSEA and MSEA analyses within the mapped metabolic pathways and denoted them as upregulated or downregulated in the irradiated group. Most genes involved in phosphatidylinositol (PI) signaling increase in the irradiated samples. In contrast, most metabolites annotated to PI signaling do not show significant changes or are not detected, but we do see a significant decrease in 2-arachidonylglycerol (2-AG) levels from the differential expression analysis compared with control, which can be annotated to PI signaling or endocannabinoid metabolism. Several leading edge amino acids that map to glutathione metabolism increase in the irradiated group, including elevation in the levels of glutamine, a precursor in glutathione synthesis, and the glutamine transporter gene SLC38A1. Further down the glutathione metabolism pathway, reduced glutathione (GSH) and GPX4 (gene that encodes the enzyme glutathione peroxidase which converts GSH to the oxidized form, GSSG) both decrease in the irradiated samples. Peroxisomal lipid metabolism displays reductions at both the transcript and metabolite levels. Interestingly, there is a significant increase from the differential expression analysis in the levels of at least four secondary bile acids and at least five acyl-amino acids in the irradiated group, which can both be synthesized in the peroxisome. Mitochondrial fatty acid β-oxidation is also downregulated at both the transcript and metabolite level in irradiated glands. A difference is seen in the transcript levels of the enzyme acyl-CoA thioesterase 1 that hydrolyzes acyl-CoA into coenzyme A and free fatty acids and, additionally, in the metabolite coenzyme A between the groups. Mitochondrial oxidative phosphorylation is downregulated at the transcript level, specifically within complex I, III, IV, and the ATP synthase complex in the irradiated group. Within the sphingolipid metabolism pathway, we observe a difference in the levels of four sphingomyelin species and two glycosyl ceramide species from differential intensity analysis, with higher levels in the irradiated samples. The expression of UGCG that encodes the enzyme which converts ceramide to glycosyl ceramide is upregulated, corresponding with an increase in glycosyl ceramide biosynthesis in the irradiated group. Differences are also seen in the lipolysis regulation pathway for a few genes and metabolites with lower levels in the irradiated samples, most notably adrenoceptor beta 3 (ADRB3) that encodes for a β-adrenergic receptor family member and lipase E, hormone sensitive type (LIPE), a lipase involved in free fatty acid production. This manual curation of metabolites to metabolic pathways reveals an additional layer of detail that, when combined with the integrated networks, creates a more holistic representation of irradiation-induced changes in a metabolic context within salivary glands.
Figure 6.

Integrative visualization of enriched pathways in metabolic reaction diagram. Map of the metabolic pathways and the cellular compartments in which they take place with upregulated and downregulated transcripts and metabolites observed in response to irradiation. Rectangles correspond to metabolite set enrichment analysis (MSEA) leading edge (LE) metabolites, ovals correspond to gene set enrichment analysis (GSEA) LE transcripts. Red denotes upregulated transcripts/metabolites and blue denotes downregulated transcripts/metabolites. Non-LE metabolites that are statistically significant (Padj < 0.05) from differential intensity analysis are denoted by the rectangular shape with the rounded edges. *Transcripts/metabolites found in Recon3d reactions. #Transcript/metabolite is found in radiation-damage response literature.
DISCUSSION
Radiation-induced salivary gland dysfunction and xerostomia continue to be significant problems for patients with head and neck cancer due to a lack of mechanistic understanding of salivary gland damage (63). Here, we have conducted a pathway and network analysis of metabolomic and transcriptomic profiles of irradiated parotid salivary glands compared with control. Our results support previous work that suggests involvement of glutathione and PI metabolism (39–41) and suggest novel interactions including sphingolipid/ceramide metabolism, peroxisomal metabolism dysregulation, and mitochondrial dysfunction.
Radiation induces the production of reactive oxygen species (ROS), such as hydrogen peroxide, resulting in DNA damage and lipid damage (lipid peroxidation) (42). Glutathione is one of the most abundant antioxidants produced to neutralize ROS and prevent radiation-induced damage (43). Our data shows a significant difference in reduced glutathione (GSH) and the transcript GPX4, suggesting that decreased GSH levels following radiation treatment could be driving the sensitivity to radiation that results in the loss of tissue function. Furthermore, both the jActiveModules and the GAM network analyses highlight GSH as a central node connecting different facets of the cellular response to irradiation. Our metanetwork analysis also revealed strong interactions between genes and metabolites within glutathione metabolism and members of several other pathways (TCA cycle/electron transport chain and protein digestion/absorption) that could be involved in regulating radiation-induced loss of function. In different model systems, however, GSH administration has produced mixed results in terms of protection from radiation damage (43). The Recon metabolic reconstruction (https://www.vmh.life/#reconmaps) revealed enzyme-metabolite interactions involved in glutathione transport and metabolism; targeting transcripts revealed by this analysis, such as solute carrier family 1 member 5 (SLC1A5), may be a more effective approach to mitigate radiation-induced damage in future studies than GSH administration.
Interestingly, according to the STITCH interaction database (http://stitch.embl.de/), sphingosine-1-phosphate receptor 4 (S1PR4) interacts with glutamate in glutathione metabolism and adenosine in selenoamino acid metabolism. In this study, the transcripts sphingosine-1-phosphate receptor 1 (S1PR1) and S1PR4 that encode S1PR1 and S1PR4, respectively, were significantly upregulated in irradiated glands. Binding of sphingosine-1-phosphate (S1P) to these receptors has been associated with mediation of inflammatory signaling to enhance cell survival, migration, angiogenesis, proliferation, and differentiation depending on tissue and type of injury (44, 45). We also observed higher levels of sphingosine and the transcript sphingosine kinase 1 (SPHK1) which encodes for the enzyme involved in sphingosine-1-phosphate (S1P) synthesis (44), in irradiated salivary glands compared with control. S1P treatment in human granulosa cells has been shown to activate yes-associated protein (Yap) via S1PR1 and sphingosine-1-phosphate receptor 3 (S1PR3) during follicular development (46). Our laboratory has previously shown that radiation-induced loss of apical-basolateral polarity leads to Yap activation at 5 days post radiation (47). Interestingly, in a model that restores salivary gland function following radiation treatment (using injections of insulin-like growth factor 1), apical-basolateral polarity is restored and Yap activation is reduced (47). Overall, this suggests that radiation may increase the activation of inflammatory signaling mechanisms associated with S1PR1 and S1PR4 in salivary glands that integrates with the compensatory proliferation response.
Radiation-induced changes in sphingolipid metabolism may also play a role in the apoptosis-induced compensatory proliferation response or the inflammatory response in salivary glands. Acute increases in ceramide production and apoptosis lead to the switch from apoptotic signaling to increased cell proliferation (48). Here, we observed significantly increased expression of the transcript UGCG in irradiated salivary glands compared with control, as well as significantly increased levels of glycosyl ceramide (d18:1/20:0, d16:1/22:0) and glycosyl ceramide (d18:2/24:1, d18:1/24:2). In response to radiation treatment, increased apoptosis is observed in parotid salivary glands that peak at 24 h following radiation treatment (49–51) and is followed by a compensatory proliferation response that begins 5 days after treatment and continues for at least 90 days (52, 62, 64). Thus, understanding the role of glycosyl ceramides in the induction and chronic upregulation of compensatory proliferation may reveal new targets that could restore function to salivary glands following radiation.
Alternatively, fatty acid β-oxidation in both the mitochondria and peroxisome were downregulated in the joint pathway enrichment analysis. Specifically, we observed downregulated levels of both propionylcarnitine (peroxisomal lipid metabolism) and the transcript hydroxyacyl-CoA dehydrogenase trifunctional multienzyme complex subunit alpha (HADHA) which encodes the enzyme hydroxyacyl-CoA dehydrogenase (mitochondrial fatty acid β-oxidation). Propionylcarnitine is known to interact with HADHA (53). Previous reports have also shown that peroxisomal and mitochondrial metabolism are tightly synchronized to coordinate the effects on lipid oxidation (53, 54). Interestingly, HADHA is expressed at higher levels in salivary glands as compared with other tissues throughout the body (55). In a metabolomics analysis of mouse serum, whole body 6 Gy radiation resulted in the enrichment of branched chain fatty acids (BCFAs) and very-long chain fatty acids (VLCFAs), implying dysregulated peroxisomal fatty acid β-oxidation (39). BCFA and VLCFA substrates are specifically transported into peroxisomes and not mitochondria for oxidation (56). Conversely, in irradiated salivary glands, we observed lower expression of the ATP binding cassette subfamily D member 1 (ABCD1) transcript that encodes the ABCD1 transporter responsible for the import of VLCFAs into the peroxisome (56); this suggests decreased peroxisomal fatty acid oxidation in response to radiation.
Because peroxisomal lipid metabolism was significantly downregulated in the irradiated samples, we investigated whether other peroxisomal metabolic processes were also dysregulated. We observed dysregulation of bile acid synthesis, acyl glycine conjugation, and glyoxylate metabolism. Specifically, there were higher levels of bile acids and their conjugates (e.g., chenodeoxycholate and taurochenodeoxycholate), acyl glycine conjugates (e.g., phenylalanylglycine and cinnamoylglycine), in irradiated samples compared with control as well as increased expression of the ATP binding cassette subfamily D member 3 (ABCD3) transcript that encodes the ABCD3 transporter responsible for the import of bile acid intermediates into the peroxisome. In the acyl glycine conjugation pathway, there was significantly higher Angiotensinogen (AGT) transcript expression as well as glycine levels in irradiated salivary glands compared with control. AGT enzyme converts glyoxylate to glycine specifically in the peroxisome. In addition, transcripts involved in glyoxylate metabolism in the cytosol and mitochondria were downregulated in irradiated samples compared with control [lactate dehydrogenase A (LDHA) and glyoxylate and hydroxypyruvate reductase (GRHPR), respectively]. These results imply that radiation increases glyoxylate detoxification via the conversion to glycine specifically in the peroxisome of salivary glands. The Recon metabolic reconstruction identified a connection between the reaction facilitated by the solute carrier family 27 member 2 (SLC27A2) transcript in peroxisomal α-oxidation and the synthesis of the bile acid chenodeoxycholate, corroborating the evidence for peroxisomal-specific bile acid synthesis. Collectively, these results suggest unique peroxisomal metabolic changes in irradiated salivary glands.
Alterations in thermogenesis and β-oxidation pathways (Fig. 5, A and B), along with significant reductions in genes within mitochondria (Fig. 6), suggest that radiation may induce a mitochondrial dysfunction phenotype. Many studies have described a loss or inefficiencies in electron transport chain (ETC) function as a hallmark of mitochondrial dysfunction (57–59). Within the results depicted in this study, reductions in nicotinamide adenine dinucleotide (NAD+), ubiquinol-cytochrome C reductase (UQCR), NADH:ubiquinone oxidoreductase supernumerary subunits (NDUF), cytochrome C oxidase (COX), adenosine triphosphate synthase subunit 5 (ATP5), and Mitochondrially Encoded NADH:Ubiquinone Oxidoreductase (MT-ND) family members are most notably related to reduced ETC capacity. The products of these genes function within complexes I, III, IV, and V and are largely encoded within mitochondrial DNA (mtDNA) (60). In contrast to nuclear DNA, mtDNA is not associated with histones and has been shown to be more sensitive to genotoxic stress (60). In addition, reductions in propionylcarnitine (C3) were observed in the irradiated group (Fig. 6) that may lead to increases in free radicals and lipid peroxidation (61). The direct and indirect effects of radiation treatment along with potential inefficiencies in translation of these mtDNA products (58, 60) may explain the global reductions observed in these genes.
This hypothesis-generating study had several limitations. First, we had a very small sample size, and our network integration analysis was not adequately powered. However, the primary purpose of this exploratory study was to determine whether the available network tools could be applied in this model. Furthermore, radiation induces dramatic responses in the tissue, thus we were confident that differences could be observed with a small sample size. Our observed results are strengthened by the combined metabolomics and transcriptomics analyses, and we have only reported those pathways that were significant in both. Second, we did not use a split sample approach. To our knowledge, this was the first metabolomics investigation of the radiation-damage response in salivary glands; therefore, we used both parotid salivary glands from a single mouse for metabolomics analysis to ensure an adequate metabolite yield. This resulted in separate mice being used for the metabolomics and the transcriptomics analyses. A third limitation is that only female mice were available for this study. Historically, we have used female mice due to a more pronounced acinar cell compartment in females than males. Future metabolomics studies should include both male and female mice to account for the differences in metabolite profiles attributed to sex hormones. Finally, we were only able to investigate one time point for this study. Five days post radiation was chosen because compensatory proliferation begins in parotid salivary glands at this time point and contributes to chronic loss of function (47, 62, 64).
Despite the limitations of this pilot study, our data shows that by integrating metabolomic and transcriptomic data, genes and metabolites altered by irradiation of salivary glands converge on a statistically significant metabolic network that involves glutathione metabolism, energy metabolism (TCA cycle and thermogenesis), peroxisomal lipid metabolism, and bile acid production. Manual curation of the metabolite data not annotated to KEGG or HMDB identified sphingolipid metabolism to also be an important pathway in the damage response. This pilot study provides evidence that supports larger studies to more thoroughly investigate the specific metabolic signatures of irradiation damage to salivary glands as well as the signaling interactions that drive radiation-induced salivary gland dysfunction.
GRANTS
This work was supported in part by National Institutes of Health (NIH) Grants DE023534 and DE029166 (to K. Limesand) and stipend support provided by the USDA National Needs Training Grant 2016-11409 (to L. Meeks).
DISCLOSURES
No conflicts of interest, financial or otherwise, are declared by the authors.
AUTHOR CONTRIBUTIONS
K.H.L. and M.P. conceived and designed research; L.M., D.D.O.P., J.A.M., and M.P. analyzed data; L.M., J.A.M., K.H.L., and M.P. interpreted results of experiments; L.M., D.D.O.P., and M.P. prepared figures; L.M., K.H.L., and M.P. drafted manuscript; L.M., D.D.O.P., J.A.M., K.H.L., and M.P. edited and revised manuscript; J.A.M., K.H.L., and M.P. approved final version of manuscript.
DATA AVAILABILITY
The RNA-sequencing data can be accessed in the Gene Expression Omnibus (GEO) with accession number GSE155902; https://www.ncbi.nlm.nih.gov/geo/query/acc.cgi?acc=GSE155902.
All supplemental data, including raw metabolomics data, can be accessed using the following link to Zenodo; https://doi.org/10.5281/zenodo.4391402.
ACKNOWLEDGMENTS
We acknowledge members of the Limesand and Padi Labs and the University of Arizona Cancer Center Bioinformatics Shared Resource for useful discussions. We thank Alejandro Chibly for collecting salivary gland tissue samples for this analysis and Sammed Mandape for assistance with an early version of the joint pathway enrichment pipeline. We acknowledge the Genomics Core at the University of Arizona for performing RNA-sequencing and Metabolon, Inc. for performing the metabolomics analysis.
REFERENCES
- 1.Siegel RL, Miller KD, Jemal A. Cancer statistics, 2019. CA Cancer J Clin 69: 7–34, 2019. doi: 10.3322/caac.21551. [DOI] [PubMed] [Google Scholar]
- 2.Hammerlid E, Silander E, Hornestam L, Sullivan M. Health-related quality of life three years after diagnosis of head and neck cancer–a longitudinal study. Head Neck 23: 113–125, 2001. doi:. [DOI] [PubMed] [Google Scholar]
- 3.Epstein JB, Robertson M, Emerton S, Phillips N, Stevenson-Moore P. Quality of life and oral function in patients treated with radiation therapy for head and neck cancer. Head Neck 23: 389–398, 2001. doi: 10.1002/hed.1049. [DOI] [PubMed] [Google Scholar]
- 4.Pinna R, Campus G, Cumbo E, Mura I, Milia E. Xerostomia induced by radiotherapy: an overview of the physiopathology, clinical evidence, and management of the oral damage. Ther Clin Risk Manag 11: 171–188, 2015. doi: 10.2147/TCRM.S70652. [DOI] [PMC free article] [PubMed] [Google Scholar]
- 5.Bockel S, Vallard A, Lévy A, François S, Bourdis M, Le Gallic C, Riccobono D, Annede P, Drouet M, Tao Y, Blanchard P, Deutsch É, Magné N, Chargari C. Pharmacological modulation of radiation-induced oral mucosal complications. Cancer Radiother 22: 429–437, 2018. doi: 10.1016/j.canrad.2017.11.006. [DOI] [PubMed] [Google Scholar]
- 6.Jensen SB, Vissink A, Limesand KH, Reyland ME. Salivary gland hypofunction and xerostomia in head and neck radiation patients. J Natl Cancer Inst Monogr 2019: Igz016, 2019. doi: 10.1093/jncimonographs/lgz016. [DOI] [PubMed] [Google Scholar]
- 7.Goudarzi M, Mak TD, Chen C, Smilenov LB, Brenner DJ, Fornace AJ. The effect of low dose rate on metabolomic response to radiation in mice. Radiat Environ Biophys 53: 645–657, 2014. doi: 10.1007/s00411-014-0558-1. [DOI] [PMC free article] [PubMed] [Google Scholar]
- 8.Laiakis EC, Nishita D, Bujold K, Jayatilake MM, Bakke J, Gahagen J, Authier S, Chang P, Fornace AJ Jr.. Salivary metabolomics of total body irradiated nonhuman primates reveals long-term normal tissue responses to radiation. Int J Radiat Oncol Biol Phys 105: 843–851, 2019. doi: 10.1016/j.ijrobp.2019.07.017. [DOI] [PMC free article] [PubMed] [Google Scholar]
- 9.Laiakis EC, Strawn SJ, Brenner DJ, Fornace AJ. Assessment of saliva as a potential biofluid for biodosimetry: a pilot metabolomics study in mice. Radiat Res 186: 92–97, 2016. doi: 10.1667/RR14433.1. [DOI] [PMC free article] [PubMed] [Google Scholar]
- 10.Haritwal T, Maan K, Rana P, Parvez S, Singh AK, Khushu S, Agrawala PK. Trichostatin A, an epigenetic modifier, mitigates radiation-induced androphysiological anomalies and metabolite changes in mice as evident from NMR-based metabolomics. Int J Radiat Biol 95: 443–451, 2019. doi: 10.1080/09553002.2018.1524989. [DOI] [PubMed] [Google Scholar]
- 11.Subramanian A, Tamayo P, Mootha VK, Mukherjee S, Ebert BL, Gillette MA, Paulovich A, Pomeroy SL, Golub TR, Lander ES, Mesirov JP. Gene set enrichment analysis: a knowledge-based approach for interpreting genome-wide expression profiles. Proc Natl Acad Sci USA 102: 15545–15550, 2005. doi: 10.1073/pnas.0506580102. [DOI] [PMC free article] [PubMed] [Google Scholar]
- 12.Xia J, Wishart DS. MSEA: a web-based tool to identify biologically meaningful patterns in quantitative metabolomic data. Nucleic Acids Res 38: W71–W77, 2010. doi: 10.1093/nar/gkq329. [DOI] [PMC free article] [PubMed] [Google Scholar]
- 13.Ideker T, Ozier O, Schwikowski B, Siegel AF. Discovering regulatory and signalling circuits in molecular interaction networks. Bioinformatics 18: S233–S240, 2002. doi: 10.1093/bioinformatics/18.suppl_1.S233. [DOI] [PubMed] [Google Scholar]
- 14.Evans AM, DeHaven CD, Barrett T, Mitchell M, Milgram E. Integrated, nontargeted ultrahigh performance liquid chromatography/electrospray ionization tandem mass spectrometry platform for the identification and relative quantification of the small-molecule complement of biological systems. Anal Chem 81: 6656–6667, 2009. doi: 10.1021/ac901536h. [DOI] [PubMed] [Google Scholar]
- 15.Nieman DC, Shanely RA, Gillitt ND, Pappan KL, Lila MA. Serum metabolic signatures induced by a three-day intensified exercise period persist after 14 h of recovery in runners. J Proteome Res 12: 4577–4584, 2013. doi: 10.1021/pr400717j. [DOI] [PubMed] [Google Scholar]
- 16.Chong J, Wishart DS, Xia J. Using MetaboAnalyst 4.0 for comprehensive and integrative metabolomics data analysis. Curr Protoc Bioinformatics 68: e86, 2019. doi: 10.1002/cpbi.86. [DOI] [PubMed] [Google Scholar]
- 17.Aittokallio T. Dealing with missing values in large-scale studies: microarray data imputation and beyond. Brief Bioinform 11: 253–264, 2010. doi: 10.1093/bib/bbp059. [DOI] [PubMed] [Google Scholar]
- 18.R Core Team. R: a language and environment for statistical computing. R Foundation for Statistical Computing 2018. (Online) https://www.R-project.org [2018].
- 19.Thévenot EA, Roux A, Xu Y, Ezan E, Junot C. Analysis of the human adult urinary metabolome variations with age, body mass index, and gender by implementing a comprehensive workflow for univariate and OPLS statistical analyses. J Proteome Res 14: 3322–3335, 2015. doi: 10.1021/acs.jproteome.5b00354. [DOI] [PubMed] [Google Scholar]
- 20.Wickham H. ggplot2: Elegant Graphics for Data Analysis. New York: Springer-Verlag, 2016. [Google Scholar]
- 21.Caspi R, Billington R, Fulcher CA, Keseler IM, Kothari A, Krummenacker M, Latendresse M, Midford PE, Ong Q, Ong WK, Paley S, Subhraveti P, Karp PD. The MetaCyc database of metabolic pathways and enzymes. Nucleic Acids Res 46: D633–D639, 2018. doi: 10.1093/nar/gkx935. [DOI] [PMC free article] [PubMed] [Google Scholar]
- 22.Wishart DS, Jewison T, Guo AC, Wilson M, Knox C, Liu Y, Djoumbou Y, Mandal R, Aziat F, Dong E, Bouatra S, Sinelnikov I, Arndt D, Xia J, Liu P, Yallou F, Bjorndahl T, Perez-Pineiro R, Eisner R, Allen F, Neveu V, Greiner R, Scalbert A. HMDB 3.0—the human metabolome database in 2013. Nucleic Acids Res 41: D801–D807, 2013. doi: 10.1093/nar/gks1065. [DOI] [PMC free article] [PubMed] [Google Scholar]
- 23.Kind T, Scholz M, Fiehn O. How large is the metabolome? A critical analysis of data exchange practices in chemistry. PLoS ONE 4: e5440, 2009. doi: 10.1371/journal.pone.0005440. [DOI] [PMC free article] [PubMed] [Google Scholar]
- 24.Ritchie ME, Phipson B, Wu D, Hu Y, Law CW, Shi W, Smyth GK. limma powers differential expression analyses for RNA-sequencing and microarray studies. Nucleic Acids Res 43: e47, 2015. doi: 10.1093/nar/gkv007. [DOI] [PMC free article] [PubMed] [Google Scholar]
- 25.Kolde R. pheatmap: Pretty Heatmaps (Online). R package version 1.0.12, 2019.
- 26.Andrews SF. A quality control tool for high throughput sequence data. (Online) Babraham Bioinformatics http://www.bioinformatics.babraham.ac.uk/projects/fastqc/, 2010.
- 27.Bolger AM, Lohse M, Usadel B. Trimmomatic: a flexible trimmer for Illumina sequence data. Bioinformatics 30: 2114–2120, 2014. doi: 10.1093/bioinformatics/btu170. [DOI] [PMC free article] [PubMed] [Google Scholar]
- 28.Kim D, Paggi JM, Park C, Bennett C, Salzberg SL. Graph-based genome alignment and genotyping with HISAT2 and HISAT-genotype. Nat Biotechnol 37: 907–915, 2019. doi: 10.1038/s41587-019-0201-4. [DOI] [PMC free article] [PubMed] [Google Scholar]
- 29.Anders S, Pyl PT, Huber W. HTSeq–a Python framework to work with high-throughput sequencing data. Bioinformatics 31: 166–169, 2015. doi: 10.1093/bioinformatics/btu638. [DOI] [PMC free article] [PubMed] [Google Scholar]
- 30.Love MI, Huber W, Anders S. Moderated estimation of fold change and dispersion for RNA-seq data with DESeq2. Genome Biol 15: 550, 2014. doi: 10.1186/s13059-014-0550-8. [DOI] [PMC free article] [PubMed] [Google Scholar]
- 31.Gu Z, Eils R, Schlesner M. Complex heatmaps reveal patterns and correlations in multidimensional genomic data. Bioinformatics 32: 2847–2849, 2016. doi: 10.1093/bioinformatics/btw313. [DOI] [PubMed] [Google Scholar]
- 32.Vilella AJ, Severin J, Ureta-Vidal A, Heng L, Durbin R, Birney E. EnsemblCompara genetrees: complete, duplication-aware phylogenetic trees in vertebrates. Genome Res 19: 327–335, 2009. doi: 10.1101/gr.073585.107. [DOI] [PMC free article] [PubMed] [Google Scholar]
- 33.Cavill R, Kamburov A, Ellis JK, Athersuch TJ, Blagrove MSC, Herwig R, Ebbels TMD, Keun HC. Consensus-phenotype integration of transcriptomic and metabolomic data implies a role for metabolism in the chemosensitivity of tumour cells. PLoS Comput Biol 7: e1001113, 2011. doi: 10.1371/journal.pcbi.1001113. [DOI] [PMC free article] [PubMed] [Google Scholar]
- 34.Platig J, Castaldi PJ, DeMeo D, Quackenbush J. Bipartite community structure of eQTLs. PLoS Comput Biol 12: e1005033, 2016. doi: 10.1371/journal.pcbi.1005033. [DOI] [PMC free article] [PubMed] [Google Scholar]
- 35.Sergushichev AA, Loboda AA, Jha AK, Vincent EE, Driggers EM, Jones RG, Pearce EJ, Artyomov MN. GAM: a web-service for integrated transcriptional and metabolic network analysis. Nucleic Acids Res 44: W194–W200, 2016. doi: 10.1093/nar/gkw266. [DOI] [PMC free article] [PubMed] [Google Scholar]
- 36.Brunk E, Sahoo S, Zielinski DC, Altunkaya A, Dräger A, Mih N, Gatto F, Nilsson A, Preciat Gonzalez GA, Aurich MK, Prlić A, Sastry A, Danielsdottir AD, Heinken A, Noronha A, Rose PW, Burley SK, Fleming RMT, Nielsen J, Thiele I, Palsson BO. Recon3D enables a three-dimensional view of gene variation in human metabolism. Nat Biotechnol 36: 272–281, 2018. doi: 10.1038/nbt.4072. [DOI] [PMC free article] [PubMed] [Google Scholar]
- 37.Kuhn M, von Mering C, Campillos M, Jensen LJ, Bork P. STITCH: interaction networks of chemicals and proteins. Nucleic Acids Res 36: D684–D688, 2008. doi: 10.1093/nar/gkm795. [DOI] [PMC free article] [PubMed] [Google Scholar]
- 38.Bralic M, Muhvic-Urek M, Stemberga V, Golemac M, Jurkovic S, Borcic J, Braut A, Tomac J. Cell death and cell proliferation in mouse submandibular gland during early post-irradiation phase. Acta Med Okayama 59: 153–159, 2005. doi: 10.18926/AMO/31948. [DOI] [PubMed] [Google Scholar]
- 39.Golla S, Golla JP, Krausz KW, Manna SK, Simillion C, Beyoğlu D, Idle JR, Gonzalez FJ. Metabolomic analysis of mice exposed to gamma radiation reveals a systemic understanding of total-body exposure. Radiat Res 187: 612–629, 2017. doi: 10.1667/RR14592.1. [DOI] [PMC free article] [PubMed] [Google Scholar]
- 40.Rubin P, Casarett GW. Clinical radiation pathology as applied to curative radiotherapy. Cancer 22: 767–778, 1968. doi:. [DOI] [PubMed] [Google Scholar]
- 41.Tilton SC, Matzke MM, Sowa MB, Stenoien DL, Weber TJ, Morgan WF, Waters KM. Data integration reveals key homeostatic mechanisms following low dose radiation exposure. Toxicol Appl Pharmacol 285: 1–11, 2015. doi: 10.1016/j.taap.2015.01.019. [DOI] [PubMed] [Google Scholar]
- 42.Griffin RJ. Radiobiology for the radiologist, 6th edition. Int J Radiat Oncol Biol Phys 66: 627, 2006. doi: 10.1016/j.ijrobp.2006.06.027. [DOI] [Google Scholar]
- 43.Chatterjee A. Reduced glutathione: a radioprotector or a modulator of DNA-repair activity? Nutrients 5: 525–542, 2013. doi: 10.3390/nu5020525. [DOI] [PMC free article] [PubMed] [Google Scholar]
- 44.Obinata H, Hla T. Sphingosine 1-phosphate and inflammation. Int Immunol 31: 617–625, 2019. doi: 10.1093/intimm/dxz037. [DOI] [PMC free article] [PubMed] [Google Scholar]
- 45.Olesch C, Ringel C, Brüne B, Weigert A. Beyond immune cell migration: the emerging role of the sphingosine-1-phosphate receptor S1PR4 as a modulator of innate immune cell activation. Mediators Inflamm 2017: 6059203, 2017. doi: 10.1155/2017/6059203. [DOI] [PMC free article] [PubMed] [Google Scholar]
- 46.Cheng J-C, Chang H-M, Liu P-P, Leung PCK. Sphingosine-1-phosphate induces COX-2 expression and PGE2 production in human granulosa cells through a S1P1/3-mediated YAP signaling. Cell Signal 28: 643–651, 2016. doi: 10.1016/j.cellsig.2016.03.006. [DOI] [PubMed] [Google Scholar]
- 47.Chibly AM, Wong WY, Pier M, Cheng H, Mu Y, Chen J, Ghosh S, Limesand KH. aPKCζ-dependent repression of Yap is necessary for functional restoration of irradiated salivary glands with IGF-1. Sci Rep 8: 6347, 2018. doi: 10.1038/s41598-018-24678-4. [DOI] [PMC free article] [PubMed] [Google Scholar]
- 48.Kolesnick R, Fuks Z. Radiation and ceramide-induced apoptosis. Oncogene 22: 5897–5906, 2003. doi: 10.1038/sj.onc.1206702. [DOI] [PubMed] [Google Scholar]
- 49.Avila JL, Grundmann O, Burd R, Limesand KH. Radiation-induced salivary gland dysfunction results from p53-dependent apoptosis. Int J Radiat Oncol Biol Phys 73: 523–529, 2009. doi: 10.1016/j.ijrobp.2008.09.036. [DOI] [PMC free article] [PubMed] [Google Scholar]
- 50.Limesand KH, Said S, Anderson SM. Suppression of radiation-induced salivary gland dysfunction by IGF-1. PLoS One 4: e4663, 2009. doi: 10.1371/journal.pone.0004663. [DOI] [PMC free article] [PubMed] [Google Scholar]
- 51.Martin KL, Hill GA, Klein RR, Arnett DG, Burd R, Limesand KH. Prevention of radiation-induced salivary gland dysfunction utilizing a CDK inhibitor in a mouse model. PLoS ONE 7: e51363, 2012. doi: 10.1371/journal.pone.0051363. [DOI] [PMC free article] [PubMed] [Google Scholar]
- 52.Limesand KH, Avila JA, Victory K, Chang H-H, Shin YJ, Grundmann O, Klein RR. Insulin-like growth factor-1 preserves salivary gland function after fractionated radiation. Int J Radiat Oncol Biol Phys 78: 579–586, 2010. doi: 10.1016/j.ijrobp.2010.03.035. [DOI] [PMC free article] [PubMed] [Google Scholar]
- 53.Fransen M, Lismont C, Walton P. The peroxisome-mitochondria connection: how and why? Int J Mol Sci 18: 1126, 2017. doi: 10.3390/ijms18061126. [DOI] [PMC free article] [PubMed] [Google Scholar]
- 54.Lodhi IJ, Semenkovich CF. Peroxisomes: a nexus for lipid metabolism and cellular signaling. Cell Metab 19: 380–392, 2014. doi: 10.1016/j.cmet.2014.01.002. [DOI] [PMC free article] [PubMed] [Google Scholar]
- 55.Su AI, Wiltshire T, Batalov S, Lapp H, Ching KA, Block D, Zhang J, Soden R, Hayakawa M, Kreiman G, Cooke MP, Walker JR, Hogenesch JB. A gene atlas of the mouse and human protein-encoding transcriptomes. Proc Natl Acad Sci USA 101: 6062–6067, 2004. doi: 10.1073/pnas.0400782101. [DOI] [PMC free article] [PubMed] [Google Scholar]
- 56.Waterham HR, Ferdinandusse S, Wanders RJA. Human disorders of peroxisome metabolism and biogenesis. Biochim Biophys Acta 1863: 922–933, 2016. doi: 10.1016/j.bbamcr.2015.11.015. [DOI] [PubMed] [Google Scholar]
- 57.Andréasson C, Ott M, Büttner S. Mitochondria orchestrate proteostatic and metabolic stress responses. EMBO rep 20: e47865, 2019. doi: 10.15252/embr.201947865. [DOI] [PMC free article] [PubMed] [Google Scholar]
- 58.Cogliati S, Lorenzi I, Rigoni G, Caicci F, Soriano ME. Regulation of mitochondrial electron transport chain assembly. J Mol Biol 430: 4849–4873, 2018. doi: 10.1016/j.jmb.2018.09.016. [DOI] [PubMed] [Google Scholar]
- 59.Nicolson GL. Mitochondrial dysfunction and chronic disease: treatment with natural supplements. Integr Med (Encinitas) 13: 35–43, 2014. [PMC free article] [PubMed] [Google Scholar]
- 60.Stein A, Sia EA. Mitochondrial DNA repair and damage tolerance. Front Biosci (Landmark Ed) 22: 920–943, 2017. doi: 10.2741/4525. [DOI] [PubMed] [Google Scholar]
- 61.Vanella A, Russo A, Acquaviva R, Campisi A, di Giacomo C, Sorrenti V, Barcellona ML. L -propionyl-carnitine as superoxide scavenger, antioxidant, and DNA cleavage protector. Cell Biol Toxicol 16: 99–104, 2000. doi: 10.1023/a:1007638025856. [DOI] [PubMed] [Google Scholar]
- 62.Grundmann O, Fillinger JL, Victory KR, Burd R, Limesand KH. Restoration of radiation therapy-induced salivary gland dysfunction in mice by post therapy IGF-1 administration. BMC Cancer 10: 417, 2010. doi: 10.1186/1471-2407-10-417. [DOI] [PMC free article] [PubMed] [Google Scholar]
- 63.Grundmann O, Mitchell GC, Limesand KH. Sensitivity of salivary glands to radiation: from animal models to therapies. J Dent Res 88: 894–903, 2009. doi: 10.1177/0022034509343143. [DOI] [PMC free article] [PubMed] [Google Scholar]
- 64.Wong WY, Allie S, Limesand KH. PKCζ and JNK signaling regulate radiation-induced compensatory proliferation in parotid salivary glands. PLoS ONE 14: e0219572, 2019. doi: 10.1371/journal.pone.0219572. [DOI] [PMC free article] [PubMed] [Google Scholar]
Associated Data
This section collects any data citations, data availability statements, or supplementary materials included in this article.
Data Availability Statement
The RNA-sequencing data can be accessed in the Gene Expression Omnibus (GEO) with accession number GSE155902; https://www.ncbi.nlm.nih.gov/geo/query/acc.cgi?acc=GSE155902.
All supplemental data, including raw metabolomics data, can be accessed using the following link to Zenodo; https://doi.org/10.5281/zenodo.4391402.