

Abstract
The pathological involvement of anion channels in vascular dysfunction that occurs during type 2 diabetes (T2D) is unclear. Here, we tested the hypothesis that TMEM16A, a calcium-activated chloride (Cl−) channel, contributes to modifications in arterial contractility during T2D. Our data indicate that T2D increased TMEM16A mRNA in arterial smooth muscle cells and total and surface TMEM16A protein in resistance-size cerebral and hindlimb arteries of mice. To examine vascular cell types in which TMEM16A protein increased and the functional consequences of TMEM16A upregulation during T2D, we generated tamoxifen-inducible, smooth muscle cell-specific TMEM16A knockout (TMEM16A smKO) mice. T2D increased both TMEM16A protein and Cl− current density in arterial smooth muscle cells of control (TMEM16Afl/fl) mice. In contrast, T2D did not alter arterial TMEM16A protein or Cl− current density in smooth muscle cells of TMEM16A smKO mice. Intravascular pressure stimulated greater vasoconstriction (myogenic tone) in the arteries of T2D TMEM16Afl/fl mice than in the arteries of nondiabetic TMEM16Afl/fl mice. This elevation in myogenic tone in response to T2D was abolished in the arteries of T2D TMEM16A smKO mice. T2D also reduced Akt2 protein and activity in the arteries of T2D mice. siRNA-mediated knockdown of Akt2, but not Akt1, increased arterial TMEM16A protein in nondiabetic mice. In summary, data indicate that T2D is associated with an increase in TMEM16A expression and currents in arterial smooth muscle cells that produces vasoconstriction. Data also suggest that a reduction in Akt2 function drives these pathological alterations during T2D.
NEW & NOTEWORTHY We investigated the involvement of TMEM16A channels in vascular dysfunction during type 2 diabetes (T2D). TMEM16A message, protein, and currents were higher in smooth muscle cells of resistance-size arteries during T2D. Pressure stimulated greater vasoconstriction in the arteries of T2D mice that was abolished in the arteries of TMEM16A smKO mice. Akt2 protein and activity were both lower in T2D arteries, and Akt2 knockdown elevated TMEM16A protein. We propose that a decrease in Akt2 function stimulates TMEM16A expression in arterial smooth muscle cells, leading to vasoconstriction during T2D.
Keywords: Akt, arterial contractility, smooth muscle, TMEM16A channel, type 2 diabetes
INTRODUCTION
According to a 2017 report by the Centers for Disease Control, diabetes affects ∼23 million people and is the seventh leading cause of death in the United States (1). The most prevalent form of diabetes is type 2 (T2D), which afflicts ∼90% of patients (1, 2). Patients with T2D are at increased risk for cardiovascular disease (CVD) (3). Several factors, including insulin resistance, dyslipidemia, and hyperglycemia, increase the possibility of CVD in T2D (4, 5). Diabetes is also a major risk factor for peripheral artery disease (PAD), which manifests as occlusive arterial disease of the lower extremities (6). PAD is indicative of wider CVD risk that can involve the cerebrovascular and coronary circulations, the failure of which can cause significant morbidity and mortality. Identifying mechanisms by which diabetes causes pathological modifications in arterial function may lead to the development of novel therapies that alleviate CVD (6, 7).
Arterial contractility determines regional organ blood flow, perfusion pressure, and systemic blood pressure and is regulated by the contractile state of smooth muscle cells located in the vascular wall. Membrane potential is a primary determinant of arterial smooth muscle cell contractility (8). Several cation channels that are expressed in arterial smooth muscle cells control membrane potential, including large-conductance calcium (Ca2+)-activated potassium (K+, BK), voltage-dependent K+ (KV), and several members of the transient receptor potential (TRP) family (9, 10). Membrane depolarization activates voltage-dependent Ca2+ (CaV) channels, leading to Ca2+ influx, an increase in intracellular Ca2+ concentration, and vasoconstriction (10). In contrast, hyperpolarization results in a reduction in intracellular Ca2+ concentration and vasodilation (10). Diabetes is associated with pathological alterations in arterial contractility, with both enhanced vasoconstriction and attenuated vasodilation reported in animal models of diabetes and in human subjects of T2D (3, 11, 12). Modifications in cation channels, including voltage-dependent Ca2+, KV2.1, and BK, contribute to vasoconstriction during diabetes (13). In contrast, potential contributions of anion channels to vasoconstriction during diabetes are unclear. Arterial smooth muscle cells express TMEM16A, a Ca2+-activated chloride (Cl−) channel that is encoded by the ANO1 gene (14, 15). Here, we tested the hypothesis that TMEM16A channels are altered during T2D, leading to pathological modifications in arterial contractility.
By studying control and inducible, smooth muscle cell-specific TMEM16A knockout (TMEM16A smKO) mice, we show that that T2D leads to an increase in TMEM16A message in arterial smooth muscle cells and total and surface TMEM16A protein in resistance-size arteries of mice. Consistent with these data, TMEM16A currents were larger in T2D mouse arterial smooth muscle cells, which translated to greater pressure-induced vasoconstriction (myogenic response) than in arteries of nondiabetic controls. We also provide evidence that T2D is associated with a decrease in Akt2 expression and activity which elevates smooth muscle cell TMEM16A expression. These data suggest that dysfunctional Akt2 signaling increases arterial smooth muscle cell TMEM16A expression, leading to vasoconstriction during T2D.
MATERIALS AND METHODS
Ethical Approval
All procedures were approved by the Animal Care and Use Committee of the University of Tennessee. Male C57BL/6J mice were maintained on a high-fat diet (HFD) from 6 wk of age until the end of the treatment period at 24 wk. Streptozotocin (STZ, in 0.1 M sodium citrate buffer, pH 4.4) was administered (40 mg/kg ip) once/day for 5 consecutive days during week 14 of the treatment period. Control mice received equal volume citrate buffer injections. Animals were fasted for 6 h before oral glucose and intraperitoneal insulin tolerance tests, which were performed as described previously (16).
Mice with loxP sites flanking exon 6 of the TMEM16A gene (TMEM16Afl/fl) were custom made (Taconic). TMEM16Afl/fl mice were crossed with tamoxifen-inducible smooth muscle-specific Cre mice (Myh11-cre/ERT2, Jackson Labs) to produce TMEM16Afl/fl:Myh11-cre/ERT2 mice. Male TMEM16Afl/fl or TMEM16Afl/fl:Myh11-cre/ERT2 mice were placed on an HFD at 6 wk of age. At 12 wk of age, tamoxifen was administered (1 mg/mL, ip) once/day for 5 consecutive days to knockout TMEM16A in smooth muscle cells. STZ (40 mg/kg, ip, once/day for 5 days) was given at week 16 and animals were maintained on either HFD or control chow until the end of the treatment at week 24.
Tissue Preparation and Cell Isolation
Mice were euthanized with isofluorane (1.5%) followed by decapitation. Hindlimb (saphenous, popilital, and gastrocnemius) and cerebral (anterior, middle, and posterior cerebral and cerebellar) arteries were removed and placed into ice-cold physiological saline solution (PSS) that contained (in mM): 112 NaCl, 6 KCl, 24 NaHCO3, 1.8 CaCl2, 1.2 MgSO4, 1.2 KH2PO4, and 10 glucose, gassed with 21% O2, 5% CO2, and 74% N2 to pH 7.4.
Arteries were cleaned of adventitial tissue and smooth muscle cells dissociated in isolation solution containing (in mM): 55 NaCl, 80 sodium glutamate, 5.6 KCl, 2 MgCl2, 10 HEPES, and 10 glucose (pH 7.4, NaOH) using enzymes, as previously described (17).
Genomic PCR
Genomic DNA was isolated from hindlimb arteries using a Purelink Genomic DNA kit (Thermo Fisher Scientific). Reaction conditions used were initial denaturation at 95°C for 5 min followed by 35 cycles at 95°C for 0.5 min, 60°C for 1 min, 72°C for 2 min, and extension at 72°C for 10 min. Genotyping of tamoxifen-treated TMEM16Afl/fl or TMEM16Afl/fl:Myh11-cre/ERT2 mice was performed using a single primer strategy that spanned loxP sites flanking exon 6. Primer sequences used to identify floxed and deleted alleles were: Forward 5′-CTCAGGCAATCTCAGTGAAGC-3′ and Reverse 5′-GAACTGTCCTGGAGACACAGG-3′.
RT-PCR
Fresh, dissociated hindlimb artery smooth muscle cells were identified under a microscope and manually collected using an enlarged patch pipette and a micromanipulator. Total RNA was extracted from ∼500 smooth muscle cells using the PureLink RNA kit (Thermo Fisher Scientific). First-strand cDNA was synthesized from 1 ng to 5 ng RNA using SuperScript IV (Thermo Fisher Scientific). PCR was performed on first-strand cDNA using the following conditions: an initial denaturation at 94°C for 2 min, followed by 35 cycles of denaturation at 94°C for 30 s, annealing at 60°C for 30 s, and extension at 72°C for 1 min. Agarose-TEA gels (2%) were used to separate PCR products. Primers were used to amplify transcripts of TMEM16A, aquaporin 4, myosin heavy chain 11, platelet-endothelial cell adhesion molecule 1 (PECAM-1), or actin (Table 1). The TMEM16A primer spanned the region around exon 6. This primer amplifies TMEM16A transcript in smooth muscle cells of TMEM16Afl/fl mice, but not from TMEM16A smKO mice.
Table 1.
Primers used for RT-PCR
| Transcript | Primer Forward | Primer Reverse |
|---|---|---|
| TMEM16A | 5′-CAAAACCCGGAGCACAATA-3′ | 5′-TCACCAAAGTATTTCCTGACC-3′ |
| AQP4 | 5′-TGCCCGTAATCTGACTCCCA-3′ | 5′-GTTTTCTGAGCCACCCCAGT-3′ |
| Myh11 | 5′-GACAACTCCTCTCGCTTTGG-3′ | 5′-GCTCTCCAAAAGCAGGTCAC-3′ |
| PECAM1 | 5′-TGCAGGAGTCCTTCTCCACT-3′ | 5′-ACGGTTTGATTCCACTTTGC-3′ |
| Actin | 5′-GTGACGTTGACATCCGTAAAGA-3′ | 5′-GCCGGACTCATCGTACTCC-3′ |
Quantitative Real-Time PCR
Quantitative Taqman real-time PCR reactions were performed using gene-specific primers and probes that were designed using the PrimerQuest Tool (Integrated DNA Technologies, Inc.; Table 2). A Roche LC480 light cycler was used to produce reaction conditions that were: initial denaturation at 95°C for 5 min; 40 cycles of denaturation at 95°C for 10 s, annealing at 60°C for 30 s, and extension at 72°C for 10 s. Reactions performed in the absence of cDNA were used as negative controls. Differences between fluorescence (Ct) values (ΔCt) of TMEM16A and actin were calculated. ΔΔCt was calculated from the difference between the ΔCt values for TMEM16A. Relative transcript expression was calculated using the formula 100 × 2(−ΔΔCt) (18). Each PCR reaction was performed in triplicate.
Table 2.
qPCR primers and probes
| Transcript | Primer Forward | Primer Reverse | Probe |
|---|---|---|---|
| TMEM16A | 5′-CTGGAGTTGGAGAATGACGAG-3′ | 5′-AGCCTCTTTGTGGTCTGTG-3′ | 5′-TCCATGGTGTCGGGTTTGTGAAGAT-3′ |
| Actin | 5′-GAGGTATCCTGACCC TGAAGT A-3′ | 5′-CACACG CAGCTCATT GTAGA-3′ | 5′-TGGCATTGTTACCA ACTGGGACGA-3′ |
Western Blotting
Arterial segments were pooled from between two and three mice for experiments measuring protein abundance. Western blotting for total protein was done following standard protocols. Proteins were separated on 7.5% SDS-polyacrylamide gels and transferred onto nitrocellulose membranes. Membranes were blocked with 5% nonfat milk and incubated with the one of the following primary antibodies: TMEM16A (Cell Signaling, Inc.), Akt1 (Cell Signaling, Inc.), Akt 2 (Cell Signaling, Inc.), BKα (Neuromab), CaV1.2 (Neuromab), or actin (MilliporeSigma) overnight at 4°C. Membranes were washed and incubated with horseradish peroxidase-conjugated secondary antibodies at room temperature. In some cases, blots were physically cut to allow for probing of two different proteins without the need for stripping. Protein bands were imaged using a ChemiDoc gel imaging system, quantified using Quantity One software (Biorad) and normalized to actin.
HEK Cell Culture and Transfection
HEK293 cells were maintained in DMEM supplemented with 10% FBS and 1% penicillin-streptomycin under standard tissue culture conditions (21% O2–5% CO2; 37°C). HEK293 cells were transiently transfected with pCMV6-XL5 encoding full-length human TMEM16A (10 μg/25 cm2 flask) using lipofectamine 3000 (Thermo Fisher Scientific). HEK293 cells transfected with an empty vector were used as controls. Transfected HEK293 cells were used within 36 h.
Arterial Biotinylation
Procedures used were similar to those previously described (19). Briefly, arteries were biotinylated with EZ-Link Sulfo-NHS-LC-LC-Biotin and EZ-Link Maleimide-PEG2-Biotin (Thermo Fisher Scientific). Unbound biotin was quenched with glycine-PBS. Arteries were then washed with PBS and homogenized in lysis buffer of the following composition: 50 mM Tris·HCl, 150 mM NaCl, 5 mM EDTA, 1% Triton X-100, and 0.1% SDS. Protein concentration was normalized and avidin beads (Thermo Fisher Scientific) were used to capture biotinylated surface proteins in the lysate at 4°C. Proteins were separated using Western blotting. Surface and intracellular TMEM16A bands were imaged using a ChemiDoc gel imaging system and quantified using Quantity One software (Biorad). Surface protein was expressed as % total protein, which was calculated as the sum of surface + intracellular protein.
Arterial Electroporation and Protein Knockdown
Small interference RNA sequences targeting either Akt1 or Akt2, or scrambled siRNA (scrm) controls were obtained from a commercial source (Thermo Fisher Scientific). siRNAs were inserted into hindlimb (saphenous, popliteal, and gastrocnemius) arterial segments using a low-voltage, square wave electroporator (model CUY21Vivo-SQ, BEX), as previously described (19). Arteries were then maintained in serum-free DMEM-F12 media that were supplemented with 1% penicillin-streptomycin (Sigma-Aldrich) for 3 days under standard conditions (21% O2, 5% CO2, 74% N2 at 37°C) before use.
En-Face Arterial Immunofluorescence
Hindlimb arteries were cut longitudinally and fixed with 4% paraformaldehyde in PBS. Following permeabilization with 0.2% Triton X-100, arteries were blocked with 5% goat serum and incubated overnight with TMEM16A primary antibody (Cell Signaling Inc.) at 4°C. Arteries were then exposed to Alexa Fluor 555 anti-rabbit secondary antibody (1:100 Thermo Fisher Scientific) and 4′,6-diamidino-2-phenylindole, dihydrochloride (DAPI) (1:1,000; Thermo Fisher Scientific) for 1 h at room temperature. Arterial segments were washed with PBS and mounted in 80% glycerol solution. DAPI and Alexa 555 were excited at 350 nm and 555 nm with emission collected at ≤437 nm and ≥555 nm, respectively. Fluorescence intensity was measured over the entire image for the red channel (Alexa Fluor 555). Fluorescence units were normalized (relative fluorescence intensity) to images from control arteries that were fixed and stained at identical time points and imaged using the same parameters.
Total Akt Activity Assay
Total Akt activity was measured in hindlimb and cerebral artery lysate using the Akt Kinase Activity Assay kit (Abcam, ab139436), as per the manufacturer’s instructions. The kit uses a synthetic peptide as a Akt substrate and a phosphor(active)-Akt polyclonal antibody. Briefly, arterial lysates were homogenized and incubated with ATP and the Phosphospecific Substrate Antibody in an ELISA plate. After addition of anti-rabbit IgG: HRP conjugate and TMB solution, the reaction was stopped using the stop solution provided and absorbance was recorded at 450 nm. Values were compared against a standard curve generated by reagents provided with the kit.
Patch-Clamp Electrophysiology
Patch-clamp electrophysiology was performed using fresh-isolated hindlimb artery smooth muscle cells. The pipette solution contained (in mM): 30 CsCl, 110 aspartic acid, 10 HEPES, 10 glucose, 1 EGTA, 1 MgATP, and 0.2 NaGTP (pH 7.2). Total Mg2+ and Ca2+ were adjusted to give final free concentrations of 1 mM and 1 µM, respectively. Free Mg2+ and Ca2+ were calculated using WebmaxC Standard (https://somapp.ucdmc.ucdavis.edu/pharmacology/bers/maxchelator/webmaxc/webmaxcS.htm) and confirmed using a Ca2+-sensitive and reference electrode (Corning; Acton, MA). The bath solution contained 140 NMDG-Cl, 10 HEPES, 10 D-glucose, 1 MgCl2, and 2 CaCl2 (pH 7.4). Voltage-clamped smooth muscle cells were maintained at a holding potential of −40 mV and whole cell Cl− currents were measured by applying 1.5 s voltage steps between −80 mV and +100 mV in 20 mV increments. Pipettes were pulled from borosilicate glass and waxed to reduce capacitance. Membrane currents were recorded using an Axopatch 200B amplifier equipped with a CV203BU headstage, Digidata 1332 A, and Clampex 10.3 (Molecular Devices). Currents were filtered at 1 kHz, digitized at 5 kHz, and normalized to membrane capacitance. All experiments were performed at room temperature (22°C).
Pressurized Artery Myography
First-order gastrocnemius muscle arteries were endothelium-denuded by introducing an air bubble into the lumen for 30 s. Arterial segments (1–2-mm long) were then cannulated at each end in a perfusion chamber (Living Systems Instrumentation) containing PSS that was gassed with 21% O2, 5% CO2, and 74% N2 (pH 7.4). Experiments were performed at 37°C. Intravascular pressure was altered using an attached reservoir and monitored using a pressure transducer. Arterial diameter was measured at 1 Hz using a CCD camera attached to a Nikon TS100-F microscope and the automatic edge detection function of IonWizard software (Ionoptix, Milton, MA). Myogenic tone was calculated as: 100 × (1 − Dactive/Dpassive), where Dactive is active arterial diameter and Dpassive is the diameter determined in the presence of Ca2+-free PSS supplemented with 5 mM EGTA.
Statistical Analysis
Statistical analysis was performed using OriginLab and GraphPad InStat software. Data are expressed as means ± SE. Student’s t test, Mann–Whitney U test, and ANOVA with Bonferroni’s post hoc test for multiple group comparisons were used where appropriate. P < 0.05 was considered significant.
RESULTS
Establishing an Insulin-Resistant, T2D Phenotype in Mice
The HFD-STZ treatment increased body weight, such that at 24 wk of age, mice weighed ∼45 g compared with controls, which weighed ∼27 g (Fig. 1A). Fasting blood glucose of HFD-STZ mice gradually increased over time (Fig. 1B). For instance, at week 24 fasting blood glucose was ∼305 mg/dL, compared with ∼ 102 mg/dL in control mice, or ∼3.0-fold higher (Fig. 1B). At 24 wk of age, oral glucose and insulin tolerance tests both indicated impairment (Fig. 1, C and D). Plasma insulin was also lower in HFD-STZ mice than in controls (Fig. 1E). These data indicate that a high-fat diet combined with STZ leads to obesity, insulin deficiency, and insulin resistance in mice that resemble a T2D phenotype.
Figure 1.

C57BL6/J mice on a high-fat diet with streptozotocin-treatment develop T2D. A: body weight (g) recordings from week 6 to week 24 of mice treated with either control chow and buffer-alone injections or high-fat diet and streptozotocin injections. n = 52 for each trial. *P < 0.05 vs. nondiabetic control. B: fasting blood glucose (mg/dL) recordings from week 6 to week 24 of mice treated with either control chow and buffer-alone injections or high-fat diet and streptozotocin injections. n = 48 for each trial. *P < 0.05 vs. nondiabetic. C: oral glucose tolerance test in control and HFD-STZ mice at week 24. n = 6 for each trial. *P < 0.05 vs. nondiabetic. D: insulin tolerance test in control and HFD-STZ mice at week 24. n = 6 for each trial. *P < 0.05 vs. nondiabetic. E: plasma insulin (in ng/mL) of nondiabetic and HFD-STZ mice at week 24. n = 32 for each trial. *P < 0.05 vs. nondiabetic. HFD-STZ, high-fat diet-streptozotocin; T2D, type 2 diabetes. Statistical analysis was performed using a one-way ANOVA for data in A–C, a two-way ANOVA with Bonferroni post hoc test for data in D, and a Student’s t test for data in E.
T2D Increases TMEM16A Expression in Smooth Muscle Cells of Resistance-Size Arteries
The contribution of arterial smooth muscle cell TMEM16A channels to diabetes-induced vasoconstriction is unclear. To determine whether TMEM16A expression is altered during T2D, we performed real-time RT-PCR on fresh-isolated, hand-selected, smooth muscle cells from mouse cerebral and hindlimb arteries. cDNA amplified transcripts for Myh11, a smooth muscle cell-specific marker, but did not produce products for astrocyte (aquaporin-4)- or endothelial (PECAM) cell markers, respectively, suggesting that harvested cells were pure smooth muscle (Fig. 2A). Real-time PCR experiments indicated that TMEM16A mRNA was ∼2.5- and 2.3-fold higher in cerebral and hindlimb artery smooth muscle cells of T2D mice, respectively, than in nondiabetic controls (Fig. 2B). Western blotting demonstrated that TMEM16A total protein was also ∼2.2- and ∼2.1-fold higher in cerebral and hindlimb arteries of T2D mice, respectively, than in controls (Fig. 2, C and D). Specificity of the TMEM16A monoclonal antibody used for Western blotting was confirmed by probing recombinant TMEM16A that had been expressed in HEK293 cells (Supplemental Fig. S1, A and B; all Supplemental Material available at https://doi.org/10.6084/m9.figshare.13326713.v1). Voltage-dependent Ca2+ (CaV1.2) channel protein was also ∼1.32- and ∼1.36-fold higher in cerebral and hindlimb arteries of T2D than in nondiabetic control mice, respectively (Supplemental Fig. S2, A and B). In contrast, BKCa channel α subunit protein was similar in arteries of nondiabetic and T2D mice (Supplemental Fig. S2, A and B\). En face immunofluorescence was performed on hindlimb arteries to visualize TMEM16A protein using an Alexa Fluor-555-tagged secondary antibody. Higher intensity fluorescent labeling was observed in hindlimb artery smooth muscle cells of T2D mice, than in cells of nondiabetic mice (Fig. 2, E and F). These data indicate that T2D upregulates TMEM16A gene expression and protein in arterial smooth muscle cells.
Figure 2.

TMEM16A expression is upregulated in resistance-size arteries of T2D mice. A: representative RT-PCR illustrating the purity of smooth muscle cells isolated and collected from cerebral arteries. B: real-time PCR data indicating fold change in mRNA for TMEM16A in smooth muscle cells isolated from arteries of nondiabeticor T2D mice (n = 4). *P < 0.05 vs. nondiabetic. C: representative Western blot illustrating TMEM16A and actin total protein expression in cerebral and hindlimb arteries from nondiabetic and T2D mice. D: mean data (n = 6 for each trial), *P < 0.05 vs. nondiabetic. E: en-face immunofluorescence imaging illustrating TMEM16A protein (red, Alexa Fluor 555) and DAPI (blue) in smooth muscle cells of hindlimb arteries from nondiabetic and T2D mice. Scale bar = 40 µm. F: mean data of relative fluorescence intensity for TMEM16A. n = 6 for each trial, *P < 0.05 vs. nondiabetic. G: representative Western blots illustrating surface (S) and intracellular (I) TMEM16A protein obtained from surface biotinylation experiments in cerebral arteries and hindlimb arteries from nondiabetic and T2D mice. H: mean data, n = 6 for each trial, *P < 0.05 vs. nondiabetic. T2D, type 2 diabetes. Mann–Whitney U test was used for statistical analysis.
To examine the cellular distribution and plasma membrane abundance of TMEM16A channels, we performed biotinylation, a technique that we have previously used to label surface proteins in resistance-size arteries (19–21). Surface TMEM16A protein was ∼2.0-fold higher in cerebral and hindlimb arteries of T2D mice, when compared with that in nondiabetic controls (Fig. 2, G and H). TMEM16A surface to intracellular distribution was similar, with ∼90% of protein located at the cell surface in cerebral and hindlimb arteries of nondiabetic and T2D mice (Fig. 2G, Supplemental Fig. S2C). These data indicate that during T2D, TMEM16A transcription is activated, leading to an increase in TMEM16A protein that locates to the plasma membrane in smooth muscle cells of resistance-size arteries.
Generation of a TMEM16A smKO Mouse to Study Pathological Alterations in TMEM16A Channels during T2D
To investigate the functional consequences of alterations in arterial smooth muscle cell TMEM16A channels during T2D, we generated a conditional knockout mouse. Custom-made TMEM16Afl/fl mice were crossed with tamoxifen-inducible smooth muscle-specific Cre mice (Myh11-cre/ERT2), producing TMEM16Afl/fl:Myh11-cre/ERT2 mice. Genotyping of tamoxifen-treated mice was performed by using a single primer pair designed to span the recombination site in exon 6 of TMEM16Afl/fl mice. PCR of genomic DNA from hindlimb arteries of wild-type mice produced a 1,355 bp transcript, whereas genomic PCR of arteries from tamoxifen-treated TMEM16Afl/fl mice produced a 1,530 bp transcript containing the recombination site (Fig. 3A). Genomic DNA of tamoxifen-treated TMEM16Afl/fl:smCre+ mice amplified two transcripts of 1,530 bp and 352 bp (Fig. 3A). The smaller PCR product reflects TMEM16A recombination in smooth muscle cells, whereas the larger PCR transcript is amplified from TMEM16A present in other vascular wall cell types, where recombination would not occur.
Figure 3.

T2D increases TMEM16A protein in arterial smooth muscle cells. A: generation of TMEM16Afl/fl and TMEM16A smKO mice. Ethidium bromide gel illustrating PCR products in vasculature of C57BL/6J mice and tamoxifen-treated TMEM16Afl/fl and TMEM16Afl/fl:Myh11-cre/ERT2 mice. M, marker; WT, wild-type. B: RT-PCR illustrating the absence of TMEM16A transcripts in isolated smooth muscle cells from tamoxifen-treated TMEM16Afl/fl:Myh11-cre/ERT2 mice. C: Western blot showing the effect of tamoxifen-treatment in TMEM16Afl/fl and TMEM16Afl/fl:Myh11-cre/ERT2 mice on TMEM16A and actin proteins in hindlimb arteries of nondiabetic and T2D mice. D: mean data, n = 6 for each trial, *P < 0.05 vs. nondiabetic TMEM16Afl/fl, #P < 0.05 vs. T2D TMEM16Afl/fl. smKO, smooth muscle cell-specific TMEM16A knockout; T2D, type 2 diabetes. Mann–Whitney U test was used for statistical analysis.
RT-PCR was performed on RNA extracted from hand-selected, fresh-isolated hindlimb artery smooth muscle cells of tamoxifen-treated TMEM16Afl/fl and TMEM16Afl/fl:smCre+ mice. Arterial smooth muscle cell cDNA amplified transcripts for Myh11, but not for PECAM or aquaporin 4, indicating that cells were pure smooth muscle (Fig. 3B). RT-PCR primer sequences were designed to anneal to a region spanning exon 6 in TMEM16A. Arterial smooth muscle cell cDNA from TMEM16Afl/fl mice amplified transcripts for TMEM16A, whereas TMEM16A smKO mice did not generate products (Fig. 3B). These data confirm the successful generation of a TMEM16A smKO mouse model.
TMEM16Afl/fl and TMEM16A smKO mice were used to further examine arterial wall cell types in which TMEM16A protein is upregulated during T2D. Body weight, fasting blood glucose, and insulin levels were similarly altered in response to the induction of T2D in TMEM16Afl/fl and TMEM16A smKO mice (Supplemental Fig. S3, A–C). TMEM16A total protein in hindlimb arteries of TMEM16A smKO mice was ∼25% of that in arteries of TMEM16Afl/fl mice (Fig. 3, C and D). The remaining TMEM16A protein in arteries of TMEM16A smKO mice likely originates from other vascular wall cell types, such as endothelial cells (22). T2D increased TMEM16A protein ∼2.1 fold in arteries of TMEM16Afl/fl mice (Fig. 3, C and D). In contrast, T2D did not alter TMEM16A protein in arteries of TMEM16A smKO mice (Fig. 3, C and D). These data indicate that T2D upregulates TMEM16A expression in arterial smooth muscle cells.
T2D Elevates TMEM16A Currents in Arterial Smooth Muscle Cells
Cl− currents were recorded in hindlimb artery smooth muscle cells using a voltage step protocol similar to that previously described (23, 24). Cells generated outwardly-rectifying currents that were ∼1.54-fold larger in T2D TMEM16Afl/fl mice than in nondiabetic TMEM16Afl/fl mice (at +100 mV, Fig. 4, A–C). Cl− current density in cells of nondiabetic TMEM16A smKO mice was ∼45.9% of that in TMEM16Afl/fl mice (at +100 mV, Fig. 4, A–C). In contrast to the T2D-induced increase in Cl− currents in TMEM16Afl/fl cells, T2D did not increase Cl− currents in cells of TMEM16A smKO mice (Fig. 4, A–C). Tannic acid, a TMEM16A blocker, reduced Cl− currents ∼1.77-fold more in cells of T2D TMEM16Afl/fl mice than those of nondiabetic TMEM16Afl/fl mice (Fig. 4, A and C). Tannic acid did not reduce Cl− currents either in nondiabetic or T2D TMEM16A smKO mouse cells (Fig. 4, A and C). These data indicate that T2D increases TMEM16A currents in hindlimb artery smooth muscle cells.
Figure 4.
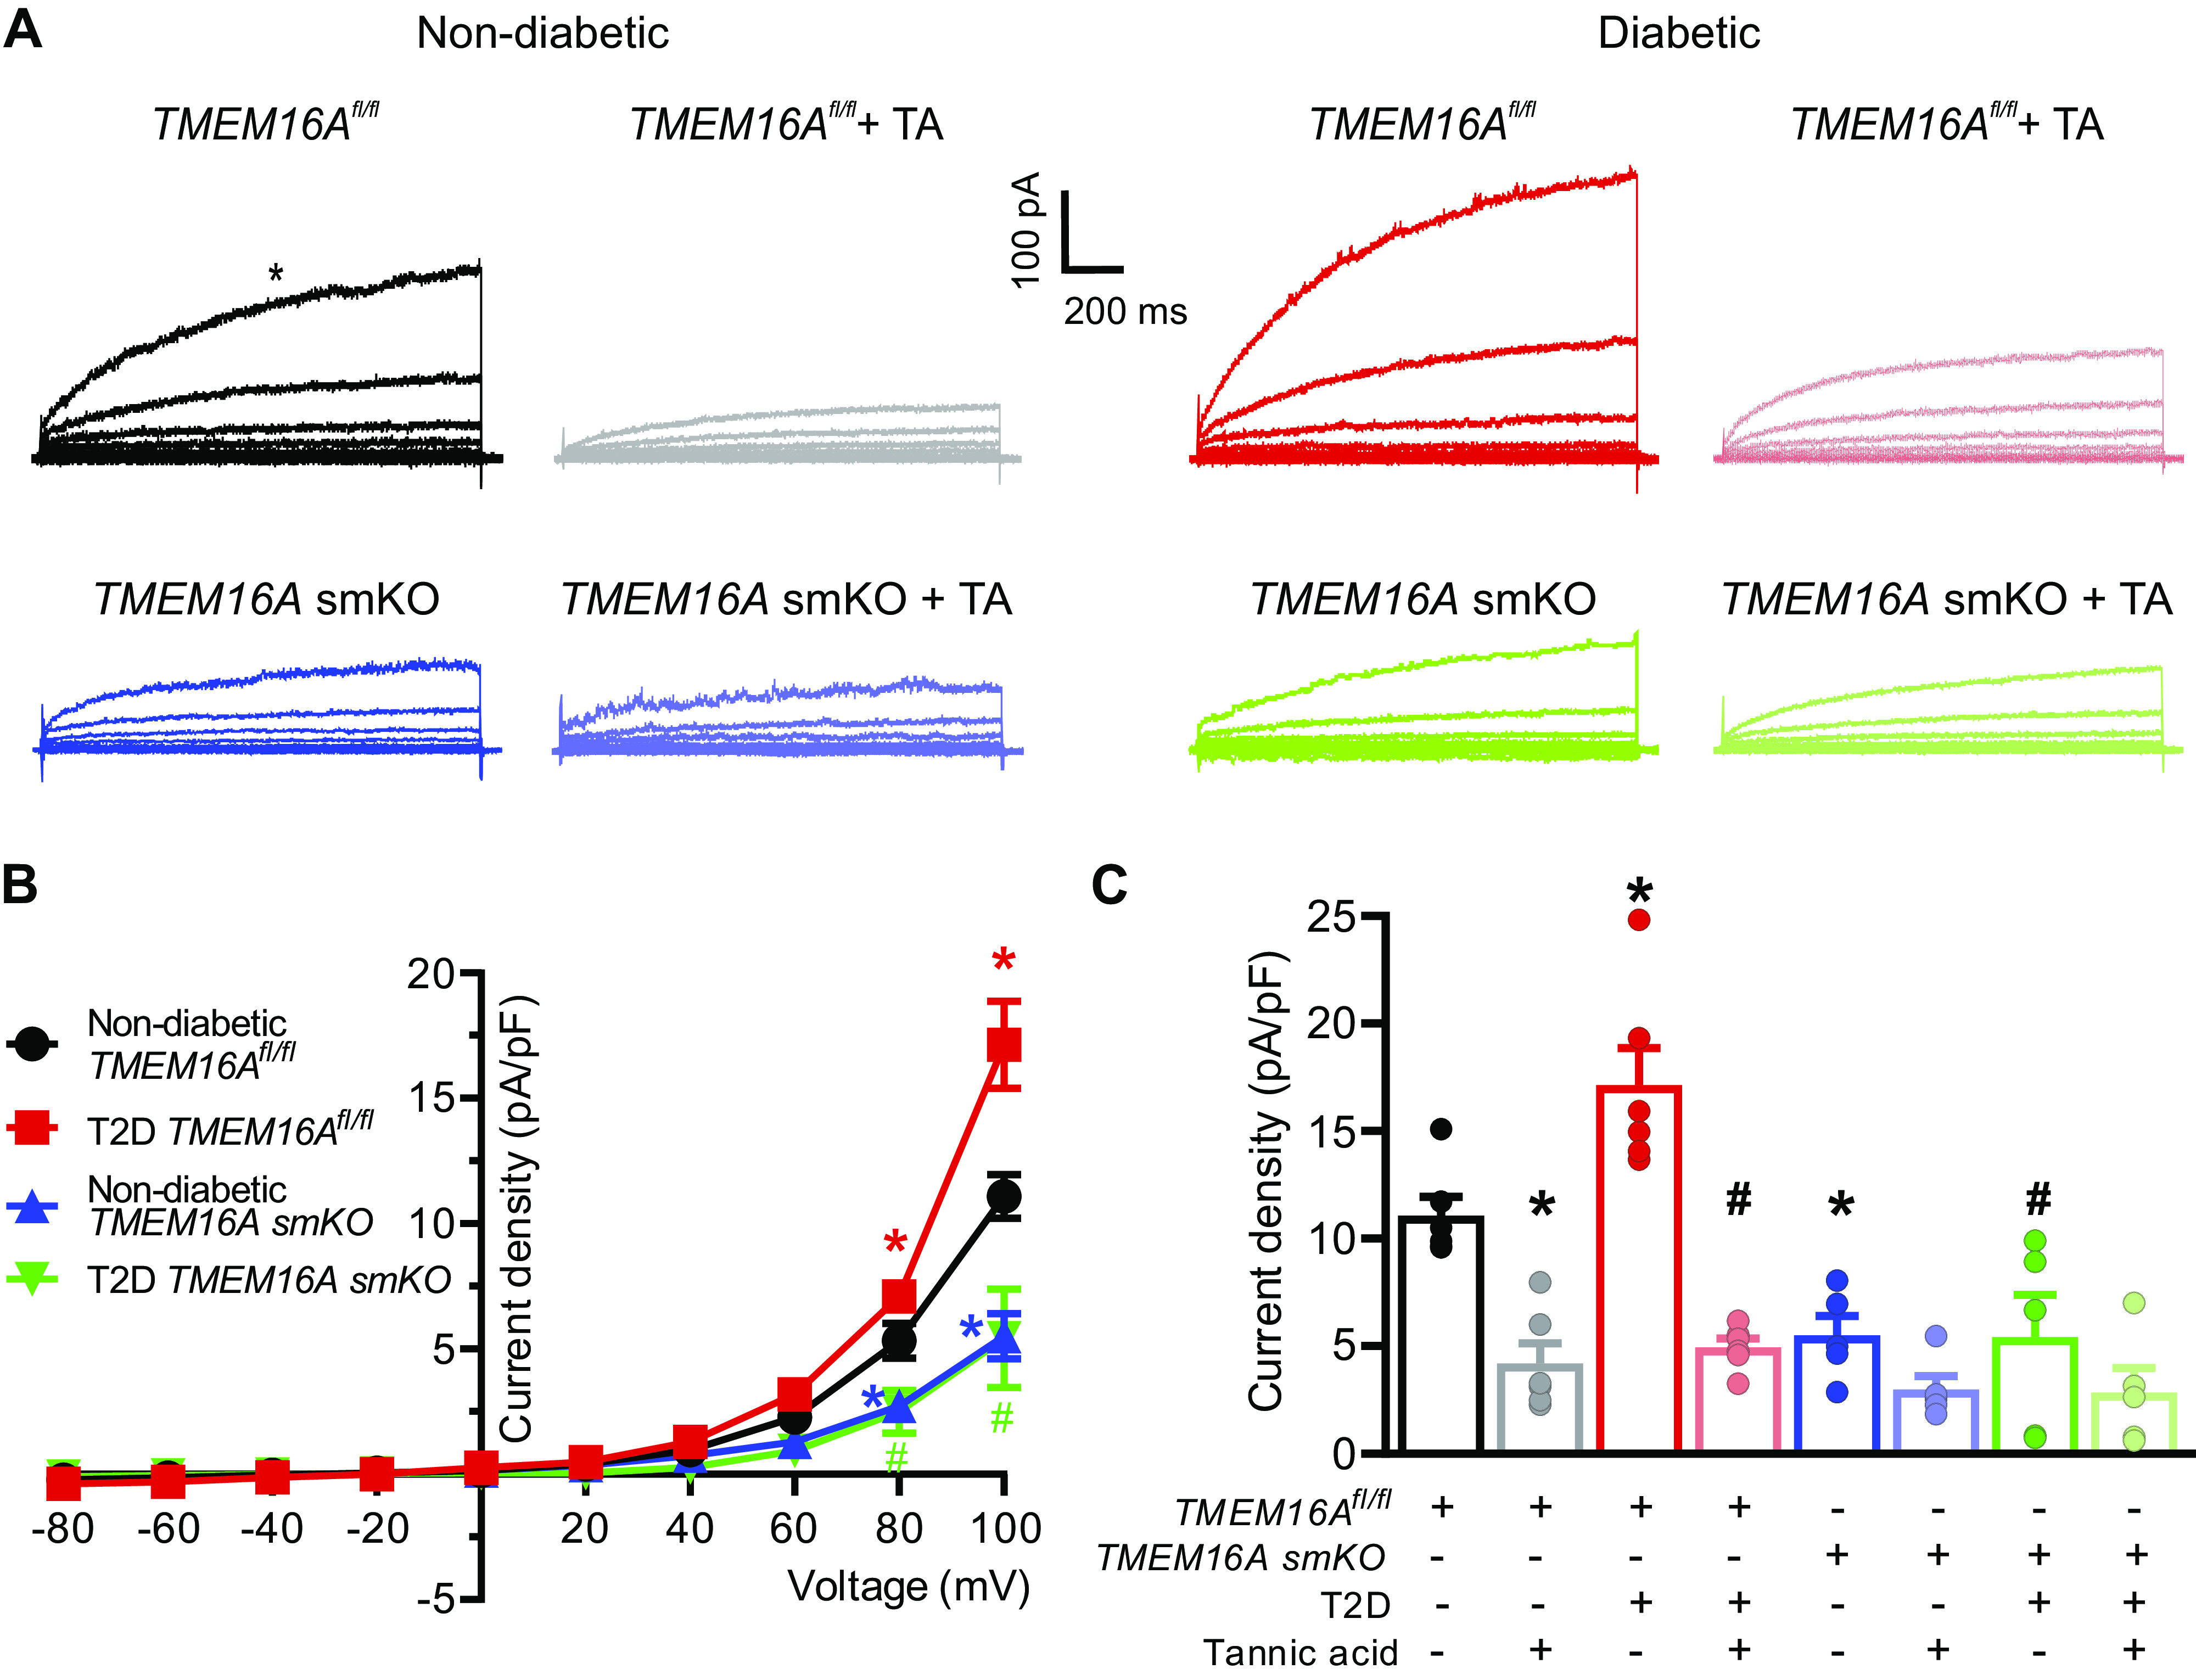
TMEM16A currents are larger in arterial smooth muscle cells of T2D mice. A: original recordings of currents elicited by voltage steps in arterial smooth muscle cells of nondiabetic and T2D TMEM16Afl/fl and TMEM16A smKO mice and effects of tannic acid (TA, 10 µM) in the same cells. B: current-voltage relationships obtained in nondiabetic and T2D TMEM16Afl/fl and TMEM16A smKO mice, nondiabetic TMEM16Afl/fl, n = 6; T2D TMEM16Afl/fl, n = 6; nondiabetic TMEM16A smKO, n = 5; T2D TMEM16A smKO, n = 5. *P < 0.05 vs. nondiabetic TMEM16Afl/fl. # P < 0.05 vs. T2D TMEM16Afl/fl. Color coded statistical symbols illustrate data being compared. C: mean data illustrating inhibition by tannic acid at +100 mV for the same cells shown in Fig. 4B. Data at +100 mV in the absence of tannic acid are reproduced from Fig. 4B for comparison. Nondiabetic TMEM16Afl/fl+TA, n = 6; T2D TMEM16Afl/fl+TA, n = 6; nondiabetic TMEM16A smKO + TA, n = 5; T2D TMEM16A smKO + TA, n = 5. *P < 0.05 vs. nondiabetic TMEM16Afl/fl, #P < 0.05 vs. T2D TMEM16Afl/fl. smKO, smooth muscle cell-specific TMEM16A knockout; T2D, type 2 diabetes. Statistical analysis used was two-way ANOVA with Bonferroni post hoc test for data in B and one-way ANOVA with Bonferroni post hoc test for data in C.
Arterial Smooth Muscle Cell TMEM16A Channels Contribute to T2D-Induced Vasoconstriction
Pressurized artery myography was performed to investigate the contribution of TMEM16A channels to pathological alterations in contractility during T2D. Gastrocnemius muscle arteries were cannulated and pressure-induced vasoconstriction was measured. Arteries of T2D TMEM16Afl/fl mice constricted more than those of nondiabetic mice TMEM16Afl/fl mice at 80 mmHg and 100 mmHg (Fig. 5, A and B). Nondiabetic TMEM16A smKO mouse arteries generated less tone at 80 mmHg and 100 mmHg than the arteries of nondiabetic TMEM16Afl/fl mice (Fig. 5, A and B). The T2D-induced increase in myogenic tone that occurred in TMEM16Afl/fl arteries was abolished in TMEM16A smKO arteries (Fig. 5B). Depolarization (60 mM K+) stimulated larger vasoconstrictions in arteries of diabetic TMEM16Afl/fl, nondiabetic TMEM16A smKO, and T2D TMEM16A smKO mice, which can be explained by the upregulation of CaV1.2 channel expression in these models (Fig. 5C, Supplemental Fig. S4, A and B). The passive diameters of nondiabetic and T2D TMEM16Afl/fl and TMEM16A smKO hindlimb arteries were similar (µm at 100 mmHg: nondiabetic TMEM16Afl/fl, 184.3 ± 2.8; T2D TMEM16Afl/fl, 191.3 ± 2.1; nondiabetic TMEM16A smKO, 203.3 ± 4.36; T2D TMEM16A smKO: 197.3 ± 4.03; n = 6–8 mice, P > 0.05 for all). These data indicate that T2D leads to the upregulation of TMEM16A channel expression in arterial smooth muscle cells that induces vasoconstriction.
Figure 5.

Smooth muscle cell TMEM16A channels contribute to augmented pressure-induced vasoconstriction in hindlimb arteries of T2D mice. A: representative traces illustrating diameter responses to intravascular pressure in hindlimb arteries of nondiabetic and T2D mice. B: mean data for myogenic tone in hindlimb arteries, n = 6–8 for each trial, *P < 0.05 vs. nondiabetic TMEM16Afl/fl and #P < 0.05 vs. T2D TMEM16Afl/fl. C: mean data for 60 mM K+-induced constriction in pressurized hindlimb arteries, n = 6–8 for each, *P < 0.05 vs. nondiabetic TMEM16Afl/f. T2D, type 2 diabetes. Statistical analysis was performed using a one-way ANOVA with Bonferroni post hoc test for data in B and C.
Dysfunctional Akt Signaling during T2D Stimulates TMEM16A Channel Expression in Arterial Smooth Muscle Cells
In T2D, dysfunctional Akt signaling has been observed in multiple tissues, including the brain, liver, adipose tissue, and skeletal muscle, and is a hallmark of insulin resistance (25, 26). We investigated the possibility that during T2D, dysfunctional Akt signaling upregulates TMEM16A expression in arterial smooth muscle cells. Western blotting revealed that Akt2 protein in cerebral and hindlimb arteries of T2D mice was ∼50% of that in nondiabetic controls (Fig. 6, A and B). Total Akt activity in cerebral and hindlimb arteries of T2D mice was also ∼50% of that in nondiabetic mouse arteries (Fig. 6C). To examine whether Akt regulates TMEM16A expression, we used RNA interference. Akt1 or Akt2 siRNA were transfected into hindlimb arteries using electroporation. Akt1 siRNA reduced Akt1 protein to ∼50% of that in scrambled siRNA controls, but did not alter Akt2 expression (Fig. 6, D and E). Similarly, Akt2 siRNA reduced Akt2 expression to ∼45% of scrambled siRNA controls, but had no effect on Akt1 protein (Fig. 6, D and E). Knockdown of Akt2 increased TMEM16A protein ∼1.5-fold in arteries, whereas knockdown of Akt1 had no effect on TMEM16A protein (Fig. 6, F and G). These results indicate that Akt2 protein is reduced in arteries during T2D and that a decrease in Akt2 elevates TMEM16A expression. Taken together, these data suggest that during T2D, dysfunctional Akt2 signaling leads to an increase in TMEM16A expression in arterial smooth muscle cells.
Figure 6.

Akt expression and activity are attenuated during T2D and Akt2 knockdown stimulates an increase in TMEM16A protein in hindlimb arteries. A: representative Western blot illustrating Akt2 and actin total protein in cerebral (CA) and hindlimb (HL) arteries from nondiabetic and T2D mice. B: mean data (n = 6 for each trial), *P < 0.05 vs. respective nondiabetic. C: mean data for total Akt activity in cerebral and hindlimb arteries of T2D mice. n = 6 for each trial, *P < 0.05 vs. respective nondiabetic. D: representative Western blots of Akt1, Akt2, and actin proteins in hindlimb arteries transfected with scrambled (Scrm), Akt1, or Akt2 siRNA. E: mean data (n = 6 for each trial). *P < 0.05 vs. scrambled controls. F: representative Western blots illustrating TMEM16A and actin proteins in hindlimb arteries transfected with scrambled, Akt1, or Akt2 siRNA. G: mean data (n = 6 for each trial). *P < 0.05 vs. scrambled control. T2D, type 2 diabetes. Mann–Whitney U test was used for statistical analysis.
DISCUSSION
Here, we demonstrate that T2D stimulates an increase in TMEM16A message that translates to an elevation in total and surface TMEM16A protein in arterial smooth muscle cells. TMEM16A currents were larger in arterial smooth muscle cells of T2D mice, which produced a greater pressure-induced vasoconstriction (myogenic response) than in arteries of nondiabetic control mice. We also show that Akt2 expression and activity are reduced during T2D and that Akt2 knockdown elevates TMEM16A expression. These data provide evidence that dysfunctional Akt2 signaling increases TMEM16A expression in arterial smooth muscle cells, leading to vasoconstriction in T2D mice.
Drawing upon earlier observations that TMEM16A is associated with vascular disease, we tested the hypothesis that TMEM16A channels are altered during T2D, leading to pathological modifications in arterial contractility. There is a clear epidemiological and pathological link between T2D and CVD in both men and women, with the risk of CVD ∼3-fold higher in diabetic patients (27, 28). The potential involvement of arterial smooth muscle cell TMEM16A channels in diabetic vascular disease does not appear to have been explored. TMEM16A channels are expressed in many different cell types, including arterial and airway smooth muscle cells and intestinal epithelial cells (24, 29–31). Earlier studies, including our own, have shown that TMEM16A is expressed in arterial smooth muscle cells and activation by stimuli, including intravascular pressure, leads to vasoconstriction (14, 23, 24, 32, 33). Pathological alterations in TMEM16A expression also occur in arterial smooth muscle cells (32, 34). TMEM16A mRNA was elevated in coronary artery smooth muscle cells of spontaneously hypertensive rats, leading to vasoconstriction (32). Similarly, TMEM16A expression and activity were higher in human pulmonary artery smooth muscle cells of patients with idiopathic pulmonary arterial hypertension (35). Common manifestations of diabetic CVD include stroke and PAD (36). Consistent with these pathologies, we show that TMEM16A is upregulated in arterial smooth muscle cells of hindlimb and cerebral arteries. Our data add diabetes to a list of diseases to which pathological modifications in TMEM16A channels occur in arterial smooth muscle cells.
Human adult-onset T2D is a polygenic disease that can involve hereditary, dietary, and environmental factors. Here, we used an inducible, HFD/STZ-treated model of T2D. Db/db and ob/ob are also excellent T2D models, with these mice developing diabetes at an early age due to genetic mutations. Using the HFD/STZ model allowed us to induce T2D in TMEM16Afl/fl and smKO mice to study pathological involvement of smooth muscle TMEM16A channels to changes in arterial contractility. Mice were fed an HFD, followed by STZ administration to ablate pancreatic β-cells. This treatment produced obesity, elevated blood glucose and reduced plasma insulin in mice, as has been observed previously (37). The metabolic phenotype of mice was assessed through both an oral glucose tolerance test, which monitors excretion of orally administered glucose, and an insulin-tolerance test, which is indicative of whole body insulin sensitivity. HFD/STZ-treated C57BL/6J, TMEM16Afl/fl and TMEM16A smKO mice exhibited similar impaired glucose tolerance and insulin sensitivity, indicating an insulin-deficient and insulin-resistant state that mirrors T2D in humans (16, 38).
T2D has been shown to affect the expression and activity of several cation channels in arterial smooth muscle cells (13). CaV1.2 channels were activated due to serine 1,928 phosphorylation in smooth muscle cells of both diabetic mice fed an HFD and in diabetic humans, leading to vasoconstriction (39). Hyperglycemia lead to the activation of a purinergic P2Y11 receptor, that through the stimulation of adenylyl cyclase 5, lead to PKA-mediated CaV1.2 channel activation (40, 41). In an HFD mouse model of T2D, KV2.1 expression and currents were downregulated in arterial smooth muscle cells, which contributed to vasoconstriction (42). Hyperglycemia also activated calcineurin anchored to AKAP150, leading to inhibition of BKCa channels and vasoconstriction (43). Here, we show that T2D stimulates the transcription of an anion channel in arterial smooth muscle cells. The increase in TMEM16A mRNA in smooth muscle cells was associated with an elevation in TMEM16A total and surface protein in cerebral and hindlimb arteries. T2D increased TMEM16A protein in arteries of TMEM16Afl/fl mice, but not in arteries of TMEM16A smKO mice, indicating that TMEM16A increased in smooth muscle cells. TMEM16A was primarily (>90%) surface-localized in arteries of mouse cerebral and hindlimb arteries, consistent with a prior observation in rat cerebral arteries, and was unaltered in T2D (24). T2D increased TMEM16A currents, which was observed as an increase in: 1) Cl− current density in arterial smooth muscle cells of TMEM16Afl/fl, but not TMEM16A smKO, mice and 2) the current density of tannic acid-sensitive Cl− currents in TMEM16Afl/fl, but not TMEM16A smKO cells. Residual current was present in TMEM16A smKO cells that may be generated by another type of Cl− channel, such as Bestrophin, and/or TRP channels, of which there are several expressed in arterial smooth muscle cells (9, 44). These data together with similar relative increases in TMEM16A mRNA, total protein, and surface protein, indicate that transcriptional upregulation of TMEM16A channels elevates Cl− currents in smooth muscle cells of T2D mouse arteries.
In T2D, insulin deficiency and insulin resistance lead to abnormal insulin receptor signaling which in turn causes dysfunctional Akt signaling (26, 45, 46) . Akt1 and Akt2 are both expressed in vascular smooth muscle cells, but each isoform is likely to regulate distinct signaling pathways (47, 48). Vascular Akt expression and activity are reduced in T2D and global AKT2 gene knockout results in severe diabetes in mice (26, 49). Knockout of both AKT2 and low-density-lipoprotein receptors in mice leads to insulin resistance and atherosclerotic plaques (50). In human coronary artery smooth muscle cells, Akt2, but not Akt1, regulated the expression of myocardin through phosphorylation of forkhead box O4 (FOXO4) (51). Conversely, knockout of Akt1, but not Akt2, impaired VEGF-mediated angiogenesis and endothelial function (52). In an HFD-STZ mouse model of T2D, Akt2 stabilized ATP7A, a copper transporter, in aortic smooth muscle cells, which protected against oxidative injury (53). Impaired Akt signaling also lead to the degradation of BK channel auxiliary β1 subunits in the aorta of streptozotocin (STZ)‐induced diabetic mice (54). Here, we found that Akt2 protein and Akt activity were lower in resistance-size arteries of T2D mice, being approximately half of those in nondiabetic controls. To determine if one or both Akt isoforms regulates TMEM16A expression in arterial smooth muscle cells, we knocked down Akt1 or Akt2 in isolated endothelium-intact arteries. Akt2 knockdown elevated arterial TMEM16A protein, whereas a similar level of Akt1 knockdown had no effect on TMEM16A expression. These data are consistent with earlier evidence that each Akt isoform regulates distinct signaling pathways (47, 48). T2D and Akt2 knockdown similarly reduced Akt2 protein (by approximately half) in endothelium-intact arteries, but T2D produced a larger increase in TMEM16A protein. Explanations for this result include that the time course of T2D in mice was longer (weeks) than that used to knockdown Akt2 (days). Other pathological alterations that occur in vivo during T2D, including hyperglycemia, may also elevate TMEM16A protein in arterial smooth muscle cells. Taken together, our data suggest that dysfunctional Akt2 signaling elevates TMEM16A expression in arterial smooth muscle cells during T2D.
The genetic strategy that we used to generate the TMEM16A smKO mouse model introduced loxP sites that flank exon 6 of ANO1. This approach differs from an earlier study where tamoxifen-inducible, smooth muscle cell-specific TMEM16A knockout mice were generated by the insertion of loxP sites that flanked exon 21 of ANO1 (55). In this previous study, the authors showed that TMEM16A knockout in smooth muscle cells attenuated vasoconstriction to U46619, a thromboxane A2 receptor agonist, in aorta, retinal arterioles, and in perfused isolated legs of mice (55). In contrast, TMEM16A knockout in smooth muscle cells did not alter vasoconstriction to angiotensin II or U46619 in first- through fourth-order mesenteric arteries (55). Here, we show that TMEM16A knockout in smooth muscle cells reduced vasoconstriction to intravascular pressures higher than 80 mmHg in hindlimb arteries, providing support to a previous finding that these channels contribute to the myogenic response in cerebral arteries (23). Importantly, our data indicate that the upregulation of TMEM16A in smooth muscle cells during T2D augments pressure-induced vasoconstriction in hindlimb arteries. TMEM16A knockout in smooth muscle cells abolished the T2D-induced increase in arterial TMEM16A protein, Cl− currents in smooth muscle cells and pressure-induced constriction. These data indicate that T2D elevates TMEM16A protein in arterial smooth muscle cells, leading to an increase in myogenic tone.
Smooth muscle cell-specific TMEM16A knockout abolished the T2D-induced increase in myogenic tone. This observation was surprising given that physiological functions of KV, BK, and CaV1.2 channels are also altered in arterial smooth muscle cell during diabetes (13, 42,43). Pressure first activates TMEM16A channels, producing membrane depolarization which stimulates CaV1.2 channels to induce vasoconstriction (23). K+ channels are then activated, which partially opposes the constriction (8). As TMEM16A activation is proximal in this sequence of events, smooth muscle cell-specific TMEM16A channel knockout could attenuate the T2D-induced increase in pressure-induced vasoconstriction even though these other ion channels are modified. We also show that both T2D and smooth muscle cell-specific TMEM16A knockout lead to an increase in arterial CaV1.2 protein. This may occur in response to the increase in blood pressure in these animal models, similarly to that which occurs during hypertension (43, 55–59).
In conclusion, we demonstrate that during T2D, dysfunctional Akt2 signaling stimulates TMEM16A expression in smooth muscle cells of resistance-size arteries, leading to an increase in TMEM16A current that produces vasoconstriction.
GRANTS
This work was supported by National Heart, Lung, and Blood Institute (NHLBI) Grants RO1 HL133256 and RO1 HL137745 (to J.H.J) and American Heart Association Grant 15SDG22680019 and NHLBI Grant RO1 HL149662 (to M.D.L).
DISCLOSURES
No conflicts of interest, financial or otherwise, are declared by the authors.
AUTHOR CONTRIBUTIONS
M.D.L. and J.H.J. conceived and designed research; M.D.L., D.P-N., W.Y., S.R., P.M., and A.M-D. performed experiments; M.D.L., D.P-N., W.Y., S.R., P.M., and A.M-D. analyzed data; M.D.L., D.P-N., S.R., P.M., A.M-D., and J.H.J. interpreted results of experiments; M.D.L., D.P-N., S.R., and A.M-D. prepared figures; M.D.L. and J.H.J. drafted manuscript; M.D.L., D.P-N., A.M-D., and J.H.J. edited and revised manuscript; M.D.L., D.P-N., S.R., P.M., A.M-D., and J.H.J. approved final version of manuscript.
ACKNOWLEDGMENTS
We thank Simon Bulley and Carlos Fernández-Peña for breeding the TMEM16Afl/fl and TMEM16A smKO mouse lines.
REFERENCES
- 1.Centers for Disease Control and Prevention. National Diabetes Statistics Report Atlanta, Atlanta, GA: Centers for Disease Control and Prevention, U.S. Dept of Health and Human Services, 2017. [Google Scholar]
- 2.Deshpande AD, Harris-Hayes M, Schootman M. Epidemiology of diabetes and diabetes-related complications. Phys Ther 88: 1254–1264, 2008. doi: 10.2522/ptj.20080020. [DOI] [PMC free article] [PubMed] [Google Scholar]
- 3.Paneni F, Beckman JA, Creager MA, Cosentino F. Diabetes and vascular disease: pathophysiology, clinical consequences, and medical therapy: part I. Eur Heart J 34: 2436–2443, 2013. doi: 10.1093/eurheartj/eht149. [DOI] [PMC free article] [PubMed] [Google Scholar]
- 4.Green JB. Understanding the type 2 diabetes mellitus and cardiovascular disease risk paradox. Postgrad Med 126: 190–204, 2014. doi: 10.3810/pgm.2014.05.2767. [DOI] [PubMed] [Google Scholar]
- 5.Kalofoutis C, Piperi C, Kalofoutis A, Harris F, Phoenix D, Singh J. Type II diabetes mellitus and cardiovascular risk factors: current therapeutic approaches. Exp Clin Cardiol 12: 17–28, 2007. [PMC free article] [PubMed] [Google Scholar]
- 6.Yang SL, Zhu LY, Han R, Sun LL, Li JX, Dou JT. Pathophysiology of peripheral arterial disease in diabetes mellitus. J Diabetes 9: 133–140, 2017. doi: 10.1111/1753-0407.12474. [DOI] [PubMed] [Google Scholar]
- 7.American Diabetes Association. Peripheral arterial disease in people with diabetes. Diabetes care 26: 3333–3341, 2003. doi: 10.2337/diacare.26.12.3333. [DOI] [PubMed] [Google Scholar]
- 8.Nelson MT, Patlak JB, Worley JF, Standen NB. Calcium channels, potassium channels, and voltage dependence of arterial smooth muscle tone. Am J Physiol 259: C3–C18, 1990. doi: 10.1152/ajpcell.1990.259.1.C3. [DOI] [PubMed] [Google Scholar]
- 9.Earley S, Brayden JE. Transient receptor potential channels in the vasculature. Physiol Rev 95: 645–690, 2015. doi: 10.1152/physrev.00026.2014. [DOI] [PMC free article] [PubMed] [Google Scholar]
- 10.Hill MA, Zou H, Potocnik SJ, Meininger GA, Davis MJ. Invited review: arteriolar smooth muscle mechanotransduction: Ca2+ signaling pathways underlying myogenic reactivity. J Appl Physiol 91: 973–983, 2001. doi: 10.1152/jappl.2001.91.2.973. [DOI] [PubMed] [Google Scholar]
- 11.Creager MA, Luscher TF, Cosentino F, Beckman JA. Diabetes and vascular disease: pathophysiology, clinical consequences, and medical therapy: Part I. Circulation 108: 1527–1532, 2003. doi: 10.1161/01.CIR.0000091257.27563.32. [DOI] [PubMed] [Google Scholar]
- 12.Kolluru GK, Bir SC, Kevil CG. Endothelial dysfunction and diabetes: effects on angiogenesis, vascular remodeling, and wound healing. Int J Vasc Med 2012: 918267–918267, 2012. doi: 10.1155/2012/918267. [DOI] [PMC free article] [PubMed] [Google Scholar]
- 13.Nieves-Cintrón M, Flores-Tamez VA, Le T, Baudel MM, Navedo MF. Cellular and molecular effects of hyperglycemia on ion channels in vascular smooth muscle. Cell Mol Life Sci, 2020. [DOI] [PMC free article] [PubMed] [Google Scholar]
- 14.Bulley S, Jaggar JH. Cl(-) channels in smooth muscle cells. Pflugers Arch 466: 861–872, 2014[Erratum inPflugers Arch466: 873, 2014]. doi: 10.1007/s00424-013-1357-2. [DOI] [PMC free article] [PubMed] [Google Scholar]
- 15.Katoh M, Katoh M. FLJ10261 gene, located within the CCND1-EMS1 locus on human chromosome 11q13, encodes the eight-transmembrane protein homologous to C12orf3, C11orf25 and FLJ34272 gene products. Int J Oncol 22: 1375–1381, 2003. [PubMed] [Google Scholar]
- 16.Nagy C, Einwallner E. Study of in vivo glucose metabolism in high-fat diet-fed mice using oral glucose tolerance test (OGTT) and insulin tolerance test (ITT). J Vis Exp : 56672, 2018. doi: 10.3791/56672. [DOI] [PMC free article] [PubMed] [Google Scholar]
- 17.Jaggar JH. Intravascular pressure regulates local and global Ca2+ signaling in cerebral artery smooth muscle cells. Am J Physiol Cell Physiol 281: C439–C448, 2001. doi: 10.1152/ajpcell.2001.281.2.C439. [DOI] [PubMed] [Google Scholar]
- 18.Livak KJ, Schmittgen TD. Analysis of relative gene expression data using real-time quantitative PCR and the 2(-DDCt) method. Methods 25: 402–408, 2001. doi: 10.1006/meth.2001.1262. [DOI] [PubMed] [Google Scholar]
- 19.Leo MD, Bannister JP, Narayanan D, Nair A, Grubbs JE, Gabrick KS, Boop FA, Jaggar JH. Dynamic regulation of beta1 subunit trafficking controls vascular contractility. Proc Natl Acad Sci USA 111: 2361–2366, 2014. doi: 10.1073/pnas.1317527111. [DOI] [PMC free article] [PubMed] [Google Scholar]
- 20.Hasan R, Leo MD, Muralidharan P, Mata-Daboin A, Yin W, Bulley S, Fernandez-Peña C, MacKay CE, Jaggar JH. SUMO1 modification of PKD2 channels regulates arterial contractility. Proc Natl Acad Sci USA 116: 27095–27104, 2019. doi: 10.1073/pnas.1917264116. [DOI] [PMC free article] [PubMed] [Google Scholar]
- 21.Kidd MW, Bulley S, Jaggar JH. Angiotensin II reduces the surface abundance of Kv1.5 channels in arterial myocytes to stimulate vasoconstriction. J Physiol 595: 1607–1618, 2017. doi: 10.1113/JP272893. [DOI] [PMC free article] [PubMed] [Google Scholar]
- 22.Wu MM, Lou J, Song BL, Gong YF, Li YC, Yu CJ, Wang QS, Ma TX, Ma K, Hartzell HC, Duan DD, Zhao D, Zhang ZR. Hypoxia augments the calcium-activated chloride current carried by anoctamin-1 in cardiac vascular endothelial cells of neonatal mice. Br J Pharmacol 171: 3680–3692, 2014. doi: 10.1111/bph.12730. [DOI] [PMC free article] [PubMed] [Google Scholar]
- 23.Bulley S, Neeb ZP, Burris SK, Bannister JP, Thomas-Gatewood CM, Jangsangthong W, Jaggar JH. TMEM16A/ANO1 channels contribute to the myogenic response in cerebral arteries. Circ Res 111: 1027–1036, 2012. doi: 10.1161/CIRCRESAHA.112.277145. [DOI] [PMC free article] [PubMed] [Google Scholar]
- 24.Thomas-Gatewood C, Neeb ZP, Bulley S, Adebiyi A, Bannister JP, Leo MD, Jaggar JH. TMEM16A channels generate Ca2+-activated Cl- currents in cerebral artery smooth muscle cells. Am J Physiol Heart Circ Physiol 301: H1819–H1827, 2011. doi: 10.1152/ajpheart.00404.2011. [DOI] [PMC free article] [PubMed] [Google Scholar]
- 25.Frojdo S, Vidal H, Pirola L. Alterations of insulin signaling in type 2 diabetes: a review of the current evidence from humans. Biochim Biophys Acta 1792: 83–92, 2009. doi: 10.1016/j.bbadis.2008.10.019. [DOI] [PubMed] [Google Scholar]
- 26.Hamamdzic D, Fenning RS, Patel D, Mohler ER 3rd,Orlova KA, Wright AC, Llano R, Keane MG, Shannon RP, Birnbaum MJ, Wilensky RL. Akt pathway is hypoactivated by synergistic actions of diabetes mellitus and hypercholesterolemia resulting in advanced coronary artery disease. Am J Physiol Heart Circ Physiol 299: H699–H706, 2010. doi: 10.1152/ajpheart.00071.2010. [DOI] [PMC free article] [PubMed] [Google Scholar]
- 27.Harreiter J, Kautzky-Willer A. Sex and gender differences in prevention of type 2 diabetes. Front Endocrinol (Lausanne) 9: 220, 2018. doi: 10.3389/fendo.2018.00220. [DOI] [PMC free article] [PubMed] [Google Scholar]
- 28.Maric-Bilkan C. Sex differences in micro- and macro-vascular complications of diabetes mellitus. Clin Sci (Lond) 131: 833–846, 2017. doi: 10.1042/CS20160998. [DOI] [PubMed] [Google Scholar]
- 29.Benedetto R, Cabrita I, Schreiber R, Kunzelmann K. TMEM16A is indispensable for basal mucus secretion in airways and intestine. FASEB J 33: 4502–4512, 2019. doi: 10.1096/fj.201801333RRR. [DOI] [PubMed] [Google Scholar]
- 30.Huang F, Rock JR, Harfe BD, Cheng T, Huang X, Jan YN, Jan LY. Studies on expression and function of the TMEM16A calcium-activated chloride channel. Proc Natl Acad Sci USA 106: 21413–21418, 2009. doi: 10.1073/pnas.0911935106. [DOI] [PMC free article] [PubMed] [Google Scholar]
- 31.Huang F, Zhang H, Wu M, Yang H, Kudo M, Peters CJ, Woodruff PG, Solberg OD, Donne ML, Huang X, Sheppard D, Fahy JV, Wolters PJ, Hogan BL, Finkbeiner WE, Li M, Jan YN, Jan LY, Rock JR. Calcium-activated chloride channel TMEM16A modulates mucin secretion and airway smooth muscle contraction. Proc Natl Acad Sci USA 109: 16354–16359, 2012. doi: 10.1073/pnas.1214596109. [DOI] [PMC free article] [PubMed] [Google Scholar]
- 32.Askew Page HR, Dalsgaard T, Baldwin SN, Jepps TA, Povstyan O, Olesen SP, Greenwood IA. TMEM16A is implicated in the regulation of coronary flow and is altered in hypertension. Br J Pharmacol 176: 1635–1648, 2019. doi: 10.1111/bph.14598. [DOI] [PMC free article] [PubMed] [Google Scholar]
- 33.Hill MA, Yang Y, Ella SR, Davis MJ, Braun AP. Large conductance, Ca2+-activated K+ channels (BKCa) and arteriolar myogenic signaling. FEBS Lett 584: 2033–2042, 2010. doi: 10.1016/j.febslet.2010.02.045. [DOI] [PMC free article] [PubMed] [Google Scholar]
- 34.Forrest AS, Joyce TC, Huebner ML, Ayon RJ, Wiwchar M, Joyce J, Freitas N, Davis AJ, Ye L, Duan DD, Singer CA, Valencik ML, Greenwood IA, Leblanc N. Increased TMEM16A-encoded calcium-activated chloride channel activity is associated with pulmonary hypertension. Am J Physiol Cell Physiol 303: C1229–C1243, 2012. doi: 10.1152/ajpcell.00044.2012. [DOI] [PMC free article] [PubMed] [Google Scholar]
- 35.Papp R, Nagaraj C, Zabini D, Nagy BM, Lengyel M, Skofic Maurer D, Sharma N, Egemnazarov B, Kovacs G, Kwapiszewska G, Marsh LM, Hrzenjak A, Höfler G, Didiasova M, Wygrecka M, Sievers LK, Szucs P, Enyedi P, Ghanim B, Klepetko W, Olschewski H, Olschewski A. Targeting TMEM16A to reverse vasoconstriction and remodelling in idiopathic pulmonary arterial hypertension. Eur Respir J 53: 1800965, 2019. doi: 10.1183/13993003.00965-2018. [DOI] [PubMed] [Google Scholar]
- 36.Murabito JM, D'Agostino RB, Silbershatz H, Wilson WF. Intermittent claudication. A risk profile from The Framingham Heart Study. Circulation 96: 44–49, 1997. doi: 10.1161/01.CIR.96.1.44. [DOI] [PubMed] [Google Scholar]
- 37.Gilbert ER, Fu Z, Liu D. Development of a nongenetic mouse model of type 2 diabetes. Exp Diabetes Res 2011: 416254, 2011. doi: 10.1155/2011/416254. [DOI] [PMC free article] [PubMed] [Google Scholar]
- 38.Zhang XY, Wang S, Yan Z, Wan Y, Wang W, Cui GB, Du P, Ma KJ, Han W, Zhang YQ, Wei JG. Molecular cloning, tissue distribution and bioinformatics analyses of the rabbit BK channel beta1 subunit gene. Mol Biol Rep 35: 649–655, 2008. doi: 10.1007/s11033-007-9135-x. [DOI] [PubMed] [Google Scholar]
- 39.Nystoriak MA, Nieves-Cintrón M, Patriarchi T, Buonarati OR, Prada MP, Morotti S, Grandi E, Fernandes JD, Forbush K, Hofmann F, Sasse KC, Scott JD, Ward SM, Hell JW, Navedo MF. Ser1928 phosphorylation by PKA stimulates the L-type Ca2+ channel CaV1.2 and vasoconstriction during acute hyperglycemia and diabetes. Sci Signal 10: eaaf9647, 2017. doi: 10.1126/scisignal.aaf9647. [DOI] [PMC free article] [PubMed] [Google Scholar]
- 40.Prada MP, Syed AU, Buonarati OR, Reddy GR, Nystoriak MA, Ghosh D, Simó S, Sato D, Sasse KC, Ward SM, Santana LF, Xiang YK, Hell JW, Nieves-Cintrón M, Navedo MAG. A G(s)-coupled purinergic receptor boosts Ca(2+) influx and vascular contractility during diabetic hyperglycemia. eLife 8: e42214, 2019. doi: 10.7554/eLife.42214. [DOI] [PMC free article] [PubMed] [Google Scholar]
- 41.Syed AU, Reddy GR, Ghosh D, Prada MP, Nystoriak MA, Morotti S, Grandi E, Sirish P, Chiamvimonvat N, Hell JW, Santana LF, Xiang YK, Nieves-Cintrón M, Navedo MF. Adenylyl cyclase 5-generated cAMP controls cerebral vascular reactivity during diabetic hyperglycemia. J Clin Invest 129: 3140–3152, 2019. doi: 10.1172/JCI124705. [DOI] [PMC free article] [PubMed] [Google Scholar]
- 42.Nieves-Cintrón M, Nystoriak MA, Prada MP, Johnson K, Fayer W, Dell'Acqua ML, Scott JD, Navedo MF. Selective down-regulation of Kv2.1 function contributes to enhanced arterial tone during diabetes. J Biol Chem 290: 7918–7929, 2015[Erratum inJ Biol Chem291: 4912, 2016]. doi: 10.1074/jbc.M114.622811. [DOI] [PMC free article] [PubMed] [Google Scholar]
- 43.Nystoriak MA, Nieves-Cintrón M, Nygren PJ, Hinke SA, Nichols CB, Chen CY, Puglisi JL, Izu LT, Bers DM, Dell'acqua ML, Scott JD, Santana LF, Navedo MF. AKAP150 contributes to enhanced vascular tone by facilitating large-conductance Ca2+-activated K+ channel remodeling in hyperglycemia and diabetes mellitus. Circ Res 114: 607–615, 2014. doi: 10.1161/CIRCRESAHA.114.302168. [DOI] [PMC free article] [PubMed] [Google Scholar]
- 44.Matchkov VV, Larsen P, Bouzinova EV, Rojek A, Boedtkjer DM, Golubinskaya V, Pedersen FS, Aalkjaer C, Nilsson H. Bestrophin-3 (vitelliform macular dystrophy 2-like 3 protein) is essential for the cGMP-dependent calcium-activated chloride conductance in vascular smooth muscle cells. Circ Res 103: 864–872, 2008. doi: 10.1161/CIRCRESAHA.108.178517. [DOI] [PubMed] [Google Scholar]
- 45.Geraldes P, King GL. Activation of protein kinase C isoforms and its impact on diabetic complications. Circ Res 106: 1319–1331, 2010. doi: 10.1161/CIRCRESAHA.110.217117. [DOI] [PMC free article] [PubMed] [Google Scholar]
- 46.Okon EB, Chung AW, Rauniyar P, Padilla E, Tejerina T, McManus BM, Luo H, van Breemen C. Compromised arterial function in human type 2 diabetic patients. Diabetes 54: 2415–2423, 2005. doi: 10.2337/diabetes.54.8.2415. [DOI] [PubMed] [Google Scholar]
- 47.Gonzalez E, McGraw TE. The Akt kinases: isoform specificity in metabolism and cancer. Cell Cycle 8: 2502–2508, 2009. doi: 10.4161/cc.8.16.9335. [DOI] [PMC free article] [PubMed] [Google Scholar]
- 48.Manning BD, Toker A. Akt/Pkb Signaling: navigating the network. Cell 169: 381–405, 2017. [DOI] [PMC free article] [PubMed] [Google Scholar]
- 49.Garofalo RS, Orena SJ, Rafidi K, Torchia AJ, Stock JL, Hildebrandt AL, Coskran T, Black SC, Brees DJ, Wicks JR, McNeish JD, Coleman KG. Severe diabetes, age-dependent loss of adipose tissue, and mild growth deficiency in mice lacking Akt2/PKB beta. J Clin Invest 112: 197–208, 2003. doi: 10.1172/JCI16885. [DOI] [PMC free article] [PubMed] [Google Scholar]
- 50.Rensing KL, de Jager SC, Stroes ES, Vos M, Twickler MT, Dallinga-Thie GM, de Vries CJ, Kuiper J, Bot I, von der Thusen JH. Akt2/LDLr double knockout mice display impaired glucose tolerance and develop more complex atherosclerotic plaques than LDLr knockout mice. Cardiovasc Res 101: 277–287, 2014. doi: 10.1093/cvr/cvt252. [DOI] [PubMed] [Google Scholar]
- 51.Jin Y, Xie Y, Ostriker AC, Zhang X, Liu R, Lee MY, Leslie KL, Tang W, Du J, Lee SH, Wang Y, Sessa WC, Hwa J, Yu J, Martin KA. Opposing actions of AKT (protein kinase B) isoforms in vascular smooth muscle injury and therapeutic response. Arterioscler Thromb Vasc Biol 37: 2311–2321, 2017. doi: 10.1161/ATVBAHA.117.310053. [DOI] [PMC free article] [PubMed] [Google Scholar]
- 52.Ackah E, Yu J, Zoellner S, Iwakiri Y, Skurk C, Shibata R, Ouchi N, Easton RM, Galasso G, Birnbaum MJ, Walsh K, Sessa WC. Akt1/protein kinase Balpha is critical for ischemic and VEGF-mediated angiogenesis. J Clin Invest 115: 2119–2127, 2005. doi: 10.1172/JCI24726. [DOI] [PMC free article] [PubMed] [Google Scholar]
- 53.Sudhahar V, Okur MN, Bagi Z, O'Bryan JP, Hay N, Makino A, Patel VS, Phillips SA, Stepp D, Ushio-Fukai M, Fukai T. Akt2 (protein kinase B beta) stabilizes ATP7A, a copper transporter for extracellular superoxide dismutase, in vascular smooth muscle: novel mechanism to limit endothelial dysfunction in type 2 diabetes mellitus. Arterioscler Thromb Vasc Biol 38: 529–541, 2018. [DOI] [PMC free article] [PubMed] [Google Scholar]
- 54.Lu T, Chai Q, Yu L, d'Uscio LV, Katusic ZS, He T, Lee HC. Reactive oxygen species signaling facilitates FOXO-3a/FBXO-dependent vascular BK channel β1 subunit degradation in diabetic mice. Diabetes 61: 1860–1868, 2012. doi: 10.2337/db11-1658. [DOI] [PMC free article] [PubMed] [Google Scholar]
- 55.Heinze C, Seniuk A, Sokolov MV, Huebner AK, Klementowicz AE, Szijarto IA, Schleifenbaum J, Vitzthum H, Gollasch M, Ehmke H, Schroeder BC, Hubner CA. Disruption of vascular Ca2+-activated chloride currents lowers blood pressure. J Clin Invest 124: 675–686, 2014. doi: 10.1172/JCI70025. [DOI] [PMC free article] [PubMed] [Google Scholar]
- 56.Bannister JP, Bulley S, Narayanan D, Thomas-Gatewood C, Luzny P, Pachuau J, Jaggar JH. Transcriptional upregulation of alpha2delta-1 elevates arterial smooth muscle cell voltage-dependent Ca2+ channel surface expression and cerebrovascular constriction in genetic hypertension. Hypertension 60: 1006–1015, 2012. doi: 10.1161/HYPERTENSIONAHA.112.199661. [DOI] [PMC free article] [PubMed] [Google Scholar]
- 57.Mills E, Kuhn CM, Feinglos MN, Surwit R. Hypertension in CB57BL/6J mouse model of non-insulin-dependent diabetes mellitus. Am J Physiol 264: R73–R78, 1993. doi: 10.1152/ajpregu.1993.264.1.R73. [DOI] [PubMed] [Google Scholar]
- 58.Pesic A, Madden JA, Pesic M, Rusch NJ. High blood pressure upregulates arterial L-type Ca2+ channels: is membrane depolarization the signal? Circ Res 94: e97–104, 2004. doi: 10.1161/01.RES.0000131495.93500.3c. [DOI] [PubMed] [Google Scholar]
- 59.Rahmouni K, Morgan DA, Morgan GM, Mark AL, Haynes WG. Role of selective leptin resistance in diet-induced obesity hypertension. Diabetes 54: 2012–2018, 2005. doi: 10.2337/diabetes.54.7.2012. [DOI] [PubMed] [Google Scholar]