

Abstract
Previously, we identified a population of neurons in the hindbrain tegmentum, bordering the locus coeruleus (LC). We named this population the pre-locus coeruleus (pre-LC) because in rats its neurons lie immediately rostral to the LC. In mice, however, pre-LC and LC neurons intermingle, making them difficult to distinguish. Here, we use molecular markers and anterograde tracing to clarify the location and distribution of pre-LC neurons in mice, relative to rats. First, we colocalized the transcription factor FoxP2 with the activity marker Fos to identify pre-LC neurons in sodium-deprived rats and show their distribution relative to surrounding catecholaminergic and cholinergic neurons. Next, we used sodium depletion and chemogenetic activation of the aldosterone-sensitive HSD2 neurons in the nucleus of the solitary tract (NTS) to identify the homologous population of pre-LC neurons in mice, along with a related population in the central lateral parabrachial nucleus. Using Cre-reporter mice for Pdyn, we confirmed that most of these sodium-depletion-activated neurons are dynorphinergic. Finally, after confirming that these neurons receive excitatory input from the NTS and paraventricular hypothalamic nucleus, plus convergent input from the inhibitory AgRP neurons in the arcuate hypothalamic nucleus, we identify a major, direct input projection from the medial prefrontal cortex. This new information on the location, distribution, and input to pre-LC neurons provides a neuroanatomical foundation for cell-type-specific investigation of their properties and functions in mice. Pre-LC neurons likely integrate homeostatic information from the brainstem and hypothalamus with limbic, contextual information from the cerebral cortex to influence ingestive behavior.
INTRODUCTION
The dorsolateral tegmentum of the pons-midbrain is one of the most complex and poorly understood regions of the brain. Its importance for a wide variety of homeostatic behaviors and autonomic functions is clear because injuries here impair functions ranging from appetite to arousal, thermoregulation, breathing, cardiovascular control, and bladder control. Nonetheless, we are in the early stages of characterizing the diverse neurons that populate this brainstem region.
Some neuronal populations here are well characterized, whereas others remain enigmatic. Well-characterized groups include: the locus coeruleus (LC), which is a compact cluster of noradrenergic neurons that project axons throughout the central nervous system (1); the pedunculopontine and laterodorsal tegmental nuclei (PPT-LDT), whose large cholinergic neurons project axons to the diencephalon and basal forebrain (2, 3); Barrington’s nucleus, which triggers micturition and possibly other pelvic functions (4, 5); and the mesencephalic nucleus of the trigeminal nerve (MeV), whose proprioceptive neurons send axons peripherally (to muscles of mastication) and centrally (to oromotor neurons inside the brainstem).
Alongside these well-known populations is an even larger constellation of neurons that relay gustatory, visceral, thermal, nociceptive, pruritic, and other information from the spinal cord and medulla to a variety of forebrain regions. Collectively, these diverse subpopulations form the parabrachial complex (PB) and modulate a wide variety of appetitive, affective, and autonomic processes (6).
Different subpopulations of PB neurons can be distinguished by their size, shape, gene expression, electrophysiologic properties, and input-output connections. These features, gene expression in particular, allow investigators to identify and study specific neuronal subtypes with a high degree of confidence. Surrounding or interspersed with identified PB subpopulations is an even larger set of neurons about which we have less information. Uncovering markers that identify and distinguish these remaining neurons is necessary for cell-type-specific experiments that will improve our understanding of this region.
Among these neurons, we identified a novel population in rats located immediately rostral to the LC and partly interspersed with the mesencephalic trigeminal nucleus. Several properties define and distinguish these neurons from surrounding populations. First, they are densely innervated by axons from a specific subregion of the nucleus of the solitary tract (NTS), which contains aldosterone-sensitive neurons selectively activated by dietary sodium deprivation (7, 8), and by axons from the paraventricular hypothalamic nucleus (PVH) (9). Second, these novel neurons prominently express the neuronal activity marker Fos in sodium-deprived rats (8). And third, they express the transcription factor FoxP2 (10, 11). In rats, these neurons lie immediately rostral to the LC, which is the most well-known landmark in this region, so we named this population the pre-locus coeruleus (pre-LC) (7–10).
The purpose of this study is to provide information necessary for identifying and distinguishing pre-LC neurons from the surrounding neuronal populations in mice as well as rats. In mice, the “pre” in pre-LC has led to some confusion. Unlike the tidy cluster rostral to the LC in rats, these neurons in mice (and the axon terminal fields they receive from the NTS and PVH) arc atop Barrington’s nucleus and through the dorsal LC, extending partly into the medial PB (5, 12–15). In mice, some have referred to this region or the neurons in it as “pLC” (5, 12, 13, 15) or “peri-LC” (16) and others labeled the medial arc of neurons in this population as belonging to Barrington’s nucleus (14).
Here, to resolve this confusion, we provide information needed to identify pre-LC neurons in both rats and mice. We begin by showing the location and distribution of FoxP2-immunoreactive, Fos-activated neurons in sodium-deprived rats. Also in rats, we compare this distribution with surrounding populations of noradrenergic (LC) and cholinergic (LDT) neurons in parasagittal and axial sections through the rat hindbrain. Next, we use Cre-conditional anterograde tracing and chemogenetic activation of aldosterone-sensitive HSD2 neurons in the NTS to highlight the location and distribution of axonal input and Fos activation that, along with FoxP2, identifies the homologous distribution of pre-LC neurons in mice. We then use triple immunofluorescence labeling for FoxP2, tyrosine hydroxylase (TH), and choline acetyltransferase (ChAT) to directly compare the distributions of three neuronal populations (pre-LC, LC, and LDT-PPT) in parasagittal and axial sections through the mouse hindbrain. We also use a Cre-reporter to confirm that most sodium-appetite-activated FoxP2+ neurons in the pre-LC are dynorphinergic. Finally, after using Cre-conditional anterograde tracing to confirm that pre-LC neurons receive convergent excitatory and inhibitory input from the paraventricular and arcuate hypothalamic nuclei, we show that they receive strong input directly from the medial prefrontal cortex. This information provides the foundation for cell-type-specific studies of the neuronal properties and circuit functions of pre-LC neurons.
MATERIALS AND METHODS
Animals
Experiments were conducted in male and female C57B6/J mice (8–19 wk, Jackson Laboratories), as well as Cre and Cre-reporter mice and male Sprague-Dawley rats (Harlan). Detailed information about mouse strains is provided in Table 1. All Cre-driver and -reporter mice were hemizygous and maintained on a C57BL6/J background. All mice were group-housed in a temperature- and humidity-controlled room on a 12/12-h light/dark cycle and with ad libitum access to water and standard rodent chow (Envigo 7013). In a subset of cases, we switched mice to a low-sodium chow (TD-130591, Teklad/Envigo) for a week to boost expression of Fos in pre-LC. Sodium deprivation and histological procedures in rats were performed as described previously (8, 10). All experiments were conducted in accordance with the guidelines of the Institutional Animal Care and Use Committees at Washington University in Saint Louis (rats) and at University of Iowa and Beth Israel Deaconess Medical Center (mice).
Table 1.
Cre-driver and -reporter mice used in this study
| Strain | Reference | Source Information | Key Gene |
|---|---|---|---|
| Hsd11b2Cre | (14) | Jax 030545http://www.informatics.jax.org/allele/key/871609 | IRES-Cre-GFP inserted after the termination codon of Hsd11b2 |
| Pdyn-IRES-Cre | (17) | Jax 027958https://www.jax.org/strain/027958 | IRES-Cre inserted downstream of the endogenous Pdyn (prodynorphin) gene |
| R26-LSL-L10GFP reporter | (17) | Available from originating investigatorshttp://www.informatics.jax.org/allele/MGI:5559562 | Floxed transcription STOP cassette followed by EGFP/Rpl10 fusion reporter gene under control of the CAG promoter targeted to the Gt(ROSA)26Sor locus |
| Sim1-Cre | (18) | Jax 006451http://www.informatics.jax.org/allele/key/51337 | BAC transgenic with Cre inserted into the ATG of the Sim1 gene. |
Stereotaxic Injections
For injections targeting the nucleus of the solitary tract, mice were first anesthetized with isoflurane 0.5%–1.5% (titrated to respiratory depth and rate ∼40–80 breaths/minute for a deep surgical plane of anesthesia). Then, after a midline incision, we retracted skin and muscle to expose the atlanto-occipital membrane atop the cisterna magna and used a 28-gauge needle to incise it, providing a clear view of the dorsal medulla. Through a pulled glass micropipette (20–30-µm inner diameter) we injected 90 nL of adeno-associated virus (AAV) bilaterally at sites 0.125 mm rostral, 0.125 mm lateral, and 0.4–0.6 mm ventral to calamus scriptorius. Each injection was made slowly, over 5 min, using picoliter air puffs through a solenoid valve (Clippard EV 24VDC) pulsed by a Grass stimulator. The pipette was left in place for an additional 5 min then withdrawn slowly before closing the muscle with absorbable suture and skin with Vetbond (3 M). Sustained-release meloxicam (1 mg/kg sc) was provided for postoperative analgesia. We injected n = 4 Hsd11b2-Cre mice this way with AAV8-Ef1a-DIO-synaptophysin(Syp)-mCherry (2.5 × 10¹³ vg/mL; Dr. Rachel Neve, MGH) and another n = 2 mice with AAV1-Ef1a-DIO-hM3Dq-mCherry (4 × 10¹² vg/mL; Duke viral vector core). AAV-injected mice were allowed to survive for 3–4 wk after surgery for optimal production and transport of Cre-conditional proteins into axons. We and others have verified the specificity of HSD2 neuron transduction using these Cre-conditional vectors in two different strains of Hsd11b2-Cre mice (14, 15, 19). To target the medial prefrontal cortex in additional n = 3 C57B6/J mice, we placed two injections (30 nL each) of AAV8-Ef1a-synaptophysin-mCherry (1.67 × 10¹³ vg/mL non-Cre-conditional; Dr. Rachel Neve, MGH) with coordinates +2.0 mm rostral, +0.5 mm lateral (right), and both 3.2 and 2.8 mm ventral to bregma. For injections targeting the paraventricular hypothalamic nucleus in Sim1-Cre mice (n = 2), we injected 25 nL of AAV8-Ef1a-DIO-synaptophysin(Syp)-mCherry bilaterally under ketamine anesthesia as described in Resch et al. (15) and targeted coordinates −0.8 mm caudal, ±0.2 mm lateral, and 4.8 mm ventral to bregma.
Perfusion and Tissue Sections
Under deep anesthesia with ketamine-xylazine (150–15 mg/kg ip), all mice were perfused transcardially with PBS followed by 10% formalin-PBS (Thermo Fisher Scientific). After perfusion, we removed the brain and fixed it overnight in 10% formalin-PBS, then submerged it in 30% sucrose-PBS. Before sectioning the rat brainstem, we removed the cerebellum by cutting the superior cerebellar peduncles with a scalpel and isolated the brainstem with an intercollicular cut using a thin razor, both using a dissecting microscope. Mouse brains were sliced whole. Using a freezing microtome, we sectioned brains in the axial or sagittal plane at 40 µm (mice) or 50 µm (rats). We collected all tissue in PBS, then began immunolabeling the same day (rats) or stored tissue in a cryoprotectant solution at −20°C until further processing (mice).
Histology
Detailed information on all primary antisera used in this study are in Table 2. Rat tissue was labeled using the immunofluorescence protocols we have described previously (10). For mouse tissue, double- and triple-immunofluorescence labeling was performed as follows. We removed tissue sections from cryoprotectant, rinsed them in PBS, and loaded them into a solution containing 2–3 primary antisera at the dilutions shown in Table 2. We immunolabeled FoxP2, mCherry, choline acetyltransferase (ChAT), tyrosine hydroxylase (TH), Fos, and/or agouti-related protein (AgRP). These antisera were added to a PBS solution with 0.25% triton X-100 (BP151-500, Thermo Fisher Scientific), 2% normal donkey serum (NDS, 017-000-121, Jackson ImmunoResearch), and 0.05% sodium azide (14314, Alfa Aesar) as a preservative (PBT-NDS-azide). All primary antisera were dilution tested (1:100–1:16,000) and were then used at the concentration that minimized background labeling for optimal signal-to-noise for specific labeling of known objects of interest. Antisera targeting nonendogenous proteins (DsRed/mCherry) did not produce cellular or axonal labeling in brain tissue from mice without injection of the respective neuroanatomical tracer, and in mice with AAV injections, these antisera did not produce labeling in any brain region that was not already known to send or receive axons to or from the injected region. Other antisera produced the same, well-established neuroanatomical patterns of labeling that we and others have reported in previous publications.
Table 2.
Antisera used in this study
| Antigen | Immunogen Description | Source, Host Species, RRID | Concentration |
|---|---|---|---|
| Agouti-related protein (AgRP) | Human AGRP 83-132 Amide | Phoenix, rabbit polyclonal, cat.# H-00353, lot: 01756, RRID AB_2313908 | 1:5,000 |
| Agouti-related protein (AgRP) | Recombinant mouse AgRP | Neuromics, goat polyclonal, cat.# GT15023, RRID: AB_2687600 | 1:3,000 |
| Choline acetyltransferase (ChAT) | Human placental choline acetyltransferase | Millipore, goat polyclonal, cat.# AB144P, lot: JC1618187, RRID: AB_2079751 | 1:1,000 |
| Fos (in rat tissue) | Synthetic peptide (SGFNADYEASSSRC) corresponding to amino acids 4–17 of human c-Fos | Calbiochem, rabbit polyclonal cat.# PC38 (originally “Ab-5” from Oncogene; no longer available), RRID: AB_2106755 | 1:10,000 |
| Fos (in mouse tissue) | KLH-conjugated linear peptide corresponding to the NH2-terminus of human c-Fos | Millipore, rabbit polyclonal, cat.# ABE457, lot: 2834793, RRID: AB_2631318 | 1:12,000 |
| mCherry | Full-length mCherry fluorescent protein | Life Sciences, rat monoclonal, cat.# M11217, lot# R1240561, RRID: AB_2536611 | 1:2,000 |
| TH (in mouse tissue) | Purified, SDS‐denatured rat pheochromocytoma tyrosine hydroxylase | Millipore, rabbit polyclonal, cat.# AB152, lot# 240602, RRID: AB_696697 | 1:4,000 |
| TH (in mouse tissue, combined with rabbit-anti-Fos) | Purified, SDS‐denatured rat pheochromocytoma tyrosine hydroxylase | Millipore, mouse monoclonal, cat.# MAB318, lot: NG1802536, RRID: 2201528 | 1:10,000 |
| Forkhead box protein 2 (FoxP2)(in rat tissue, with rabbit-anti-c-Fos) | Synthetic peptide corresponding to human FOXP2 aa 703-715 (C terminal, sequence:C-REIEEEPLSEDLE) | Abcam, goat polyclonal, cat.# ab1307, RRID: AB_1268914 | 1:5,000 |
| FoxP2 (in rat tissue, with goat-anti-ChAT, sheep-anti-TH) | Synthetic peptide from residues 700 to COOH-terminus of human FoxP2, conjugated to keyhole limpet hemocyanin. | Abcam, rabbit polyclonal, cat.# ab16046, RRID: AB_2107107 | 1:8,000 |
| FoxP2 (in mouse tissue) | Recombinant human FOXP2 isoform 1 Ala640‐Glu715 | R&D Systems, sheep polyclonal, cat.# AF5647, RRID: AB_2107133 | 1:3,000 |
| TH (in rat tissue, with rabbit-anti-FoxP2) | TH from rat pheochromocytoma | Chemicon (now Millipore), sheep polyclonal, cat.# AB1542, RRID: AB_9755 | 1:1,000 |
We incubated sections overnight in this primary antibody solution at room temperature, on a tissue shaker. The next morning, after washing sections three times in PBS, we incubated them for 2 h at room temperature in PBT-NDS-azide with 2–4 species-specific, affinity-purified, donkey secondary antisera conjugated to Cy3, Alexa Fluor 488, Cy5, or biotin (Jackson ImmunoResearch, each diluted 1:1,000 or 1:500). Sections were then washed three times in PBS and either mounted on glass slides or, in cases with a biotinylated secondary, incubated in streptavidin-Cy5 (1:1,000, #SA1011, Invitrogen) or streptavidin-Pacific Blue (1:1,000, #S11222, Life Technologies) in PBT-NDS-azide. After washing three times in PBS, sections were mounted on glass slides (#2575-plus; Brain Research Laboratories) then coverslipped using Vectashield with DAPI (Vector Labs) or, if Pacific Blue was used, Vectashield without DAPI. Most slides were imaged on the same day, then stored in slide folders at 4°C.
Nissl Counterstaining
After confocal imaging, we removed coverslips from immunofluorescence-stained sections by immersing them overnight in xylenes. After rehydration (1-min dips in a graded series of alcohols), we rinsed slides in ddH2O then dipped them in a fresh, filtered solution of 0.125% thionin (Thermo Fisher Scientific) for up to 60 s. Slides were rinsed in ddH2O then running tap water until the solution cleared, then they were dehydrated serially in 50%, then 70%, 95% EtOH with acetic acid (400 mL 95% EtOH plus 10 drops of glacial acetic acid, to clear excess thionin), 95%, 100%, and again 100% EtOH, then two incubations in xylenes, after which we coverslipped each slide with DPX (VWR, Poole, UK).
Fos Expression in Pre-LC
We performed two different protocols to quantify Fos expression in mouse FoxP2 neurons. In two groups of mice (n = 3 each) we injected furosemide intraperitoneally followed by 24 h of a low- or normal-sodium diet. In different groups of mice (Pdyn-IRES-Cre;R26-lsl-L10GFP), we injected saline (n = 6) or furosemide (n = 8) intraperitoneal(ly) followed by 48 h of a low-sodium diet. Then, animals were anesthetized and perfused. We collected the brains and prepared the tissue for immunolabeling as explained in Histology. In two Hsd11b2Cre mice, previously injected with AAV1-EF1a-DIO-hM3Dq-mCherry in the NTS, we injected CNO (1 mg/kg body wt ip) and perfused 1 h later. Brains were removed and tissue collected for immunolabeling as described in Histology.
Imaging, Counts, and Figures
Rat brain tissue was imaged using a laser-scanning confocal microscope, as described previously (10, 20). Mouse slides were imaged with a ×10 objective on an Olympus VS120 slide-scanning microscope. After reviewing whole slide images in OlyVIA or VS-ASW software (Olympus), we collected additional extended focal imaging (EFI) or multifocal image stacks with the ×20 objective in regions of interest. We used Adobe Photoshop to import raw fluorescence (grayscale) data into color channels for multicolor combinations, crop bitmap images, and adjust brightness or contrast. Cell counts were performed using the counting tool in Photoshop. We arranged images, added lettering, and made drawings in Illustrator. Scale bars were traced atop calibrated lines from OlyVIA to produce a simple white line in the final figure layout in Illustrator.
RESULTS
Pre-LC Neuron Distribution in Rats
The distribution of neurons with nuclear immunoreactivity for the transcription factor FoxP2 in the PB region (green in Fig. 1) was identical to previous descriptions in rats (10, 11, 21–23). Dietary sodium deprivation evoked nuclear Fos immunolabeling in the aldosterone-sensitive HSD2 neurons in the NTS (not shown) and in two prominent clusters of neurons in the PB region, as in our previous experiments (8, 10). In both clusters, Fos immunofluorescence labeling (red) colocalized with nuclear immunofluorescence for FoxP2.
Figure 1.

Axial sections from a sodium-deprived rat showing neurons in and around the pre-locus coeruleus (pre-LC) (A–C). FoxP2 immunolabeling (green) identifies a large subpopulation of neurons in this region of the brainstem, including those double labeled for both FoxP2 and Fos rostrally, in the lateral parabrachial nucleus (A), and caudally, in the pre-LC (red-boxed region in B). The yellow arrowhead in C indicates a contiguous subpopulation of FoxP2-immunoreactive neurons that are not activated by sodium deprivation, extending caudally and medially from the pre-LC. D–F: magnified pre-LC population from B, showing FoxP2-immunoreactive neuronal nuclei (D, green) with colocalized Fos immunoreactivity (E, red), adjacent to the mesencephalic nucleus of the trigeminal nerve (MeV). F: double-labeled neurons appear yellow-orange. Scale bars are 50 μm in C and F.
At middle-to-rostral levels of the PB complex, the more rostral of these two populations (Fig. 1A) was located in the lateral PB subdivision, running along the ventrolateral edge of the superior cerebellar peduncle (scp). This streak of double-labeled (Fos + FoxP2) neurons extends ventrally from the central lateral PB, in-between the scp and the external lateral PB subnucleus, which is devoid of FoxP2 immunoreactivity. Previously (7, 8, 24), we referred to these neurons as being in the “inner subdivision” of PBeL (external lateral PB subnucleus), using nomenclature proposed by Herbert and Saper (25). However, new evidence in mice (see below) and the uniform expression of FoxP2 by these neurons in both rats and mice indicate that they are a ventrolateral extension of the PBcL (central lateral PB subnucleus), not PBeL, because PBeL neurons do not contain FoxP2 (10, 11, 13, 23).
Caudal to these neurons and medial to the mesencephalic trigeminal nucleus (MeV) was another prominent cluster of Fos-activated FoxP2 neurons, the pre-LC (Fig. 1B; magnified with fluorescence color separations in Fig. 1, D–F). Importantly, most FoxP2-expressing neurons are not pre-LC neurons. Furthermore, even in this general location (medial to MeV), many FoxP2 neurons are not members of the pre-LC population. By definition, a pre-LC neuron: 1) expresses FoxP2, 2) exhibits Fos activation during sodium deprivation, and 3) lies within a specific region that receives dense axonal input from the NTS and paraventricular hypothalamic nucleus (7–10). Many neurons in the PB region are immunoreactive for FoxP2, but not Fos, and are therefore not members of the pre-LC population. Indeed, extending caudally and medially from the Fos-activated neurons in pre-LC is a contiguous population of neurons with FoxP2-immunoreactive nuclei (yellow arrowhead in Fig. 1C) that have as-yet undefined properties and unknown function.
Next, we examined the spatial relationship between FoxP2+ neurons in the pre-LC and catecholaminergic neurons in the LC. This comparison is most evident in the parasagittal plane (Fig. 2), which is 90° rotated from the axial sections in Fig. 1. Prominent immunoreactivity for the enzyme tyrosine hydroxylase (TH, red in Fig. 2) identified the classic distribution of LC neurons described previously (26). This population of densely packed, TH-immunoreactive neurons is immediately caudal to the round, pre-LC cluster of FoxP2-immunoreactive neurons that constitute the rat pre-LC (white arrows in Fig. 2, B and C). In contrast, other FoxP2-immunoreactive neurons in this region extend medially and caudally, outside the pre-LC (yellow arrowhead in Fig. 2D), intermingling with TH-immunoreactive neurons along the rostral aspect of the LC in more medial parasagittal sections that do not contain the pre-LC cluster. These same, rostral-to-caudal spatial relationships are evident in axial sections. The pre-LC cluster of neurons with nuclear FoxP2-immunoreactivity (Fig. 3B) appears in sections that are immediately rostral to the dense core of the LC (Fig. 3D), whereas a medially and caudally contiguous population of FoxP2-immunoreactive neurons intermingles with the medial aspect of the rostral LC (yellow arrowhead in Fig. 3C). TH and FoxP2 are mutually exclusive in this region, and we could not identify a single neuron with immunoreactivity for both.
Figure 2.
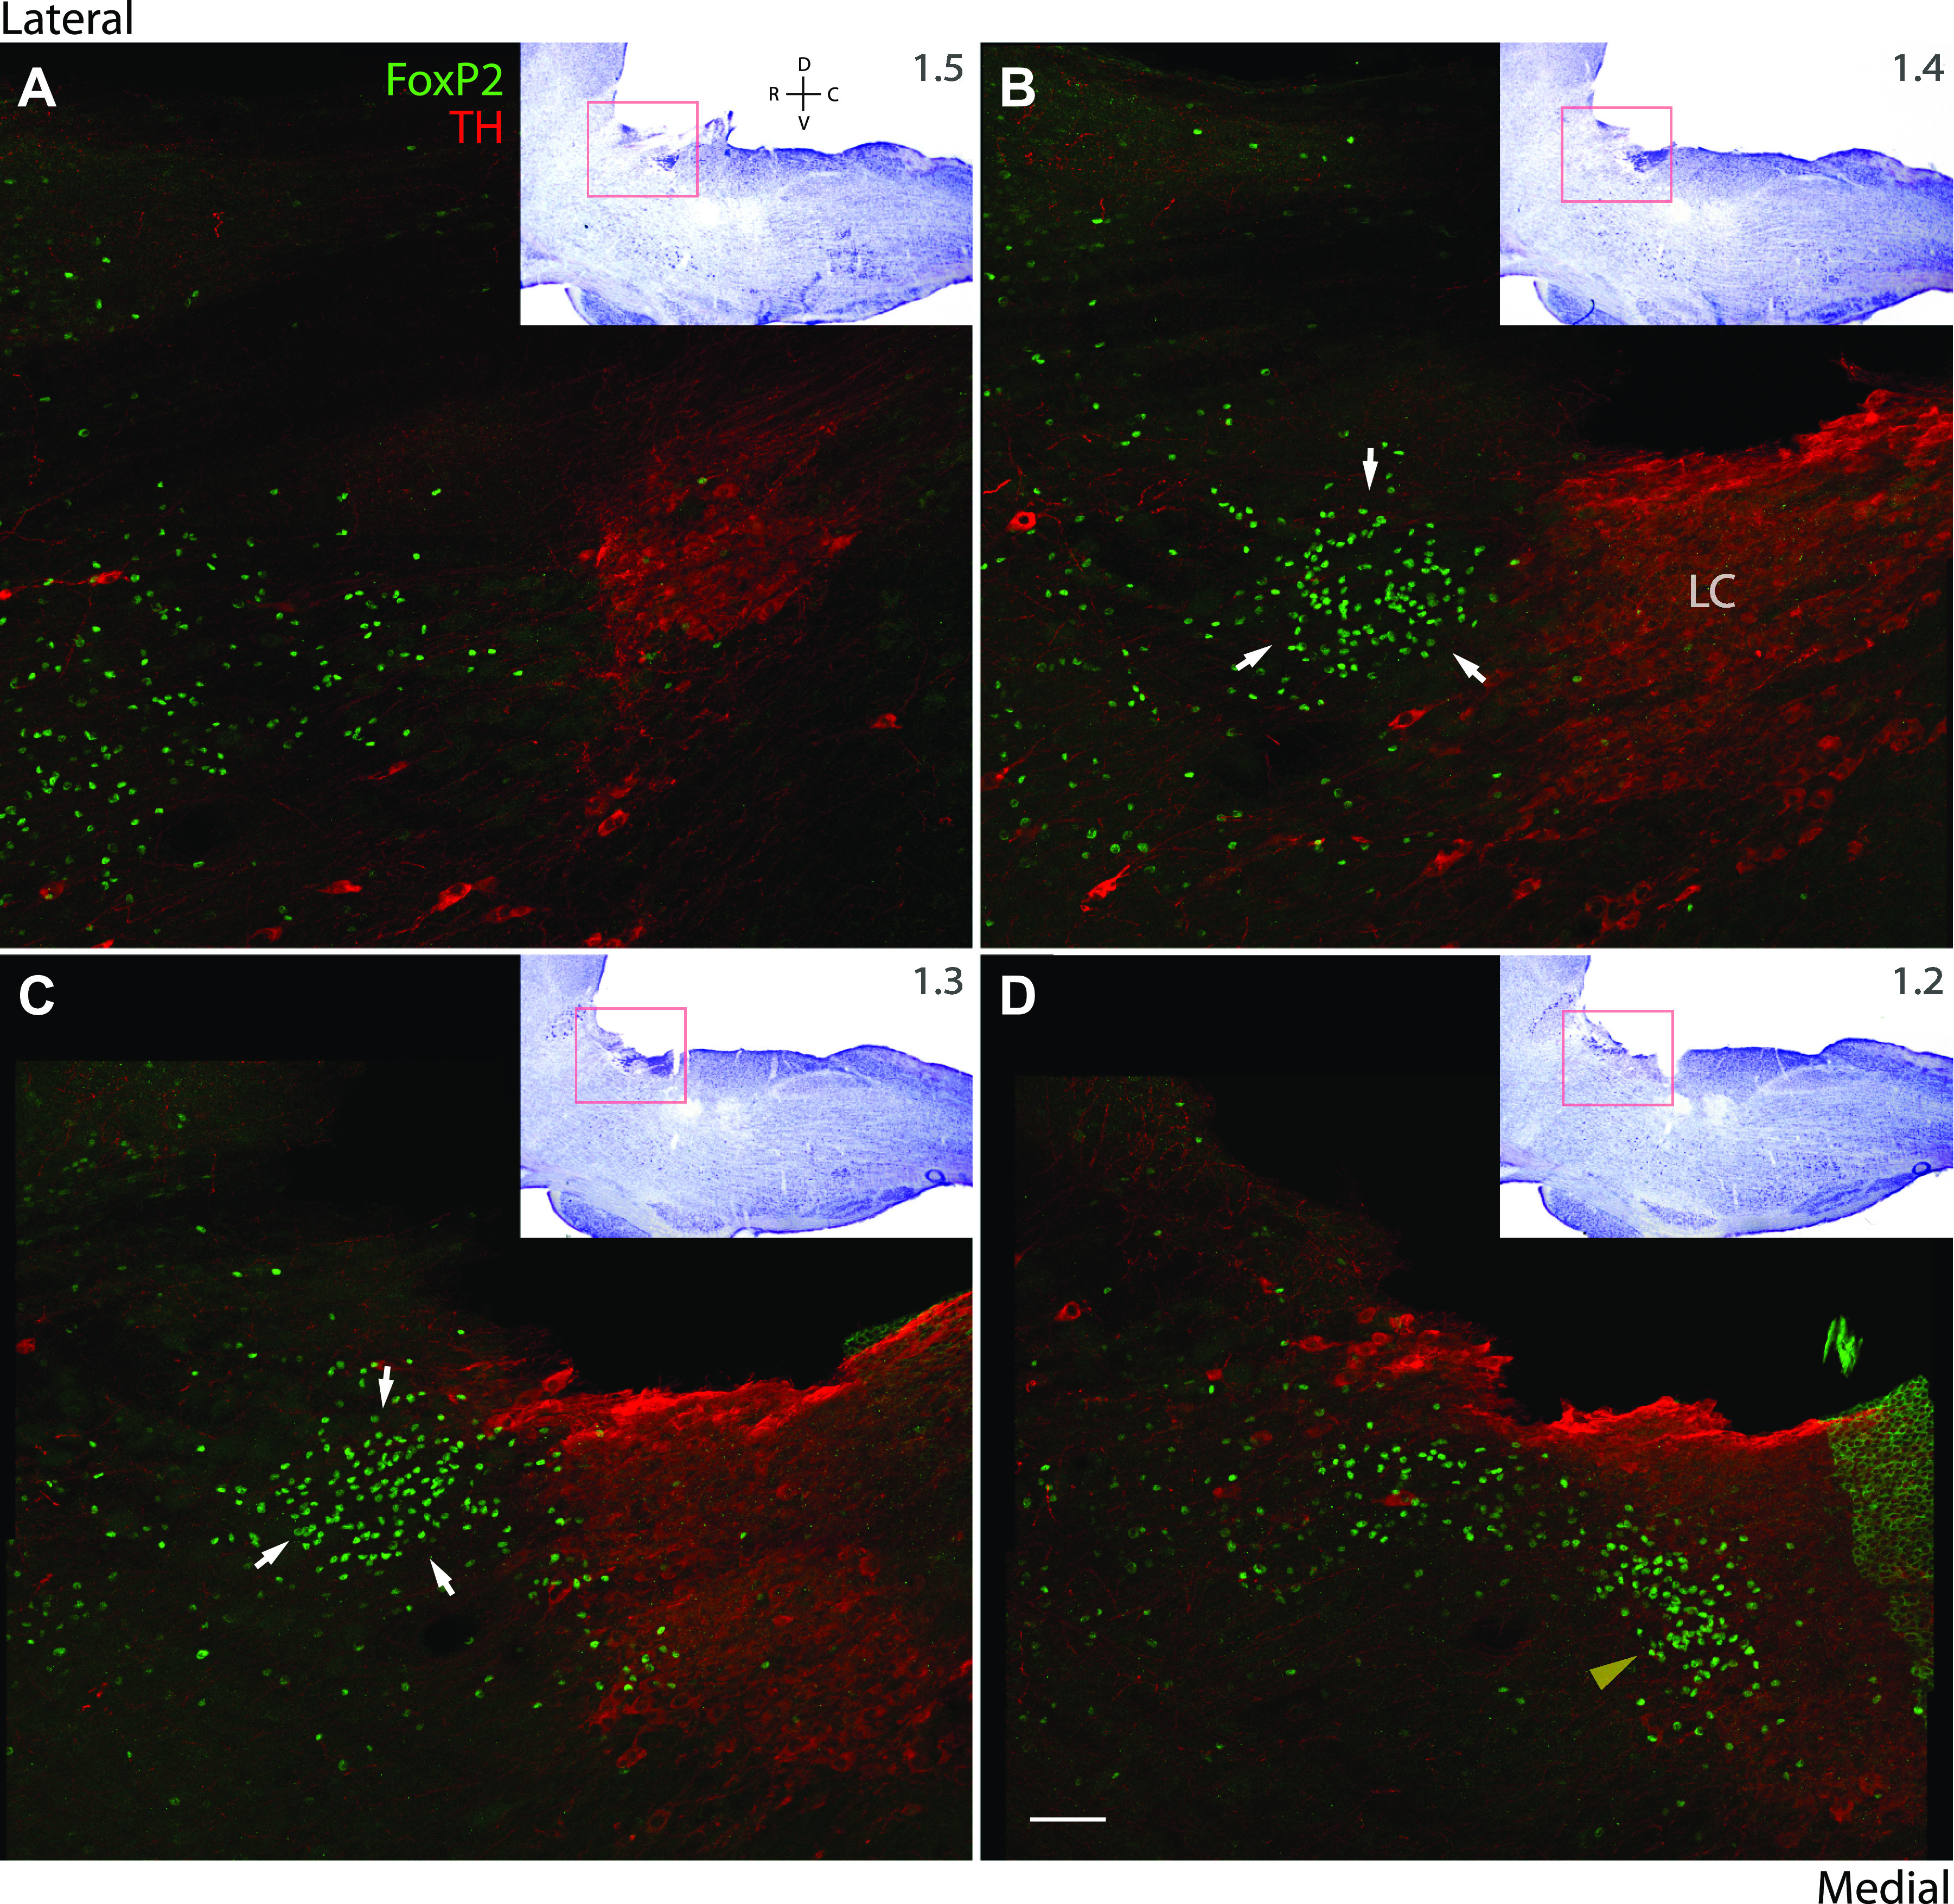
A–D: parasagittal sections from a rat brainstem showing the lateral-to-medial distribution of immunolabeling for tyrosine hydroxylase (TH, red) in the locus coeruleus (LC) and of FoxP2 (green) in and around the pre-LC. The inset in each panel shows a lower magnification image of each parasagittal section after Nissl counterstaining, and approximate distance from midline (in mm) for each panel is given at the top right of each inset. White arrows in B and C highlight the pre-LC neuronal population, which form a round cluster immediately rostral to the LC. The yellow arrowhead in D highlights a contiguous population of FoxP2 neurons, which extend caudal and medial to the pre-LC and intermingle with the rostral, medial LC. Note for species compatibility with sheep anti-TH, we switched to using a rabbit-anti-FoxP2 antibody (not the goat-anti-FoxP2 used with rabbit-anti-Fos in Fig. 1). This rabbit antibody labels the same pattern of nuclear FoxP2 immunoreactivity, with lower background and 99% colabeling when compared with other FoxP2 antisera (10), but it produces off target, cytoplasmic labeling in ependymal cells, as is evident in a segment of the fourth ventricular ependyma that is folded atop the medial locus coeruleus in D. Scale bar in D is 100 μm and applies to A–C. Approximate distance from midline is shown (in mm) at the bottom left of each panel.
Figure 3.

A–D: axial sections from a rat show the rostral-to-caudal distribution of immunoreactivity for tyrosine hydroxylase (TH, red) in the locus coeruleus (LC) and for FoxP2 (green) in and around the pre-LC. The inset in each panel shows a lower magnification image of each axial section after Nissl counterstaining. White arrows in B highlight the pre-LC population of FoxP2 neurons, rostral to most TH-expressing LC neurons. The yellow arrowhead in C highlights a contiguous population of FoxP2 neurons caudal and medial to the pre-LC. Scale bar in D is 100 μm and applies to A–C.
Another major population in this region is the laterodorsal tegmental nucleus (LDT), whose large cholinergic neurons are readily identifiable due to prominent immunoreactivity for choline acetyl transferase in their cell bodies and dendrites (ChAT, red in axial sections, Figs. 4 and in parasagittal sections, Fig. 5). LDT neurons distribute medially and rostrally to the pre-LC (Fig. 4A and Fig. 5), and we did not identify any colocalization between ChAT and FoxP2 in the pre-LC itself (Fig. 4B and Fig. 5A). However, a small number of ChAT-immunoreactive neurons outside the pre-LC did contain light nuclear immunoreactivity for FoxP2, comprising a small minority of FoxP2+ neurons located caudal and medial to the pre-LC (Fig. 4C; see inset in parasagittal Fig. 5B).
Figure 4.

A–D: axial sections from a rat showing rostral-to-caudal distribution of cholinergic neurons (ChAT, red) and FoxP2 neurons (green) in and around the pre-LC. White arrows in B highlight the cluster of pre-LC neurons, which are lateral and caudal to most ChAT-expressing neurons in the laterodorsal tegmental nucleus (LDT). The yellow arrowhead in C highlights a contiguous population of FoxP2 neurons extending caudal and medial to the pre-LC. Scale bar is 100 μm.
Figure 5.

A–D: parasagittal sections from a rat, showing the lateral-to-medial distribution of cholinergic neurons (ChAT, red) and FoxP2 neurons (green) in and around the pre-LC. White arrows in B highlight the pre-LC population of FoxP2 neurons, which are caudal and lateral to the large ChAT-expressing neurons of the laterodorsal tegmental nucleus (LDT). The high-magnification inset (B’) shows cytoplasmic ChAT-immunoreactivity colocalizing with faint FoxP2 nuclear immunoreactivity in a small subset of neurons caudal and medial to the pre-LC (white arrowheads; scale bar is 100 μm). Yellow arrowhead in C highlights a contiguous population of FoxP2 neurons, extending caudally and medially from the pre-LC. Dorsally in A–C, ChAT-immunoreactive fibers of the trochlear nerve (4n) are evident. Approximate distance from midline is shown (in mm) at the bottom left of each part. Scale bar in D is 100 μm and applies to A–C as well.
Pre-LC Neuron Distribution in Mice
To identify the distribution of pre-LC neurons in the mouse hindbrain, we immunolabeled FoxP2 in combination with Cre-conditional, chemogenetic activation of and Cre-conditional, anterograde axonal tracing from the HSD2 neurons.
First, we injected AAV-DIO-hM3Dq-mCherry into the NTS of Hsd11b2Cre mice (n = 2) and used clozapine-N-oxide (CNO) to selectively activate the HSD2 neurons. As in previous work (14), activating HSD2 neurons by injecting CNO (1 mg/kg, ip) produced very bright Fos labeling in neurons surrounding the larger, TH-immunoreactive neurons in the locus coeruleus (Fig. 6, A–C). Different from rats, where pre-LC neurons form a round cluster located rostral to the LC, Fos-activated FoxP2 neurons in mice appeared at the same rostrocaudal levels as the LC. In these two cases, 70% of all Fos-positive neurons in this region were immunoreactive for FoxP2; conversely, 54% of FoxP2-immunoreactive neurons here were immunoreactive for Fos.
Figure 6.

Axial sections from two mice (Hsd11b2-Cre, male) showing Fos immunolabeling (A–C) and axonal projections from the aldosterone-sensitive neurons in the nucleus of the solitary tract (D–F) to the pre-LC (synaptophysin presynaptic tracer; Syp-mCherry, red) and rostrally (G–L) to the central lateral parabrachial subnucleus (PBcL). A–C: Fos activation of FoxP2 neurons in the pre-LC after chemogenetic activation of Hsd11b2-expressing (HSD2) neurons. White arrows in B highlight pre-LC neurons in mice, which appear yellow in C due to double labeling for FoxP2 and Fos. The illustration in C shows the experimental approach for chemogenetic stimulation. D–F: Syp-mCherry labels the axons and presynaptic boutons of HSD2 neurons (red) flanking the LC (TH, blue) and surrounding many Foxp2 (green) neurons in the pre-LC (highlighted with white arrows). The illustration in F shows the experimental approach for Cre-conditional anterograde labeling. As shown in G–L, the PBcL contains a small subregion with similar clusters of Fos-activated FoxP2 neurons (G–I) and Syp-mCherry axonal input from the HSD2 neurons (J–L). All scale bars are 100 μm. Approximate level relative to bregma (in mm) is given in the upper right corner of each panel in the first column. scp, superior cerebellar peduncle.
Next, we labeled FoxP2 neurons in the PB region after Syp-mCherry tracing from the HSD2 neurons. To do this, we injected AAV-DIO-Syp-mCherry into the NTS of additional Hsd11b2Cre mice (n = 2). As in rats, neurons expressing Hsd11b2 in the mouse NTS extend axons to two sites in the PB region (14, 15, 19), including dense bouton labeling flanking and extending through the LC. This zone, innervated by HSD2 neurons, contained many FoxP2-labeled neurons (Fig. 6, D–F). The distribution of Syp-mCherry boutons, arising from HSD2 neurons in the NTS, matches the distribution of Fos-activated FoxP2 neurons, which defines the mouse pre-LC neuron distribution.
We also verified that a second hot spot receives input from HSD2 neurons ∼250 µm rostral to the prominent cluster of Fos + FoxP2 neurons in the mouse pre-LC. Designer Receptor Exclusively Activated by Designer Drug (DREADD) stimulation of Hsd11b2-expressing neurons also resulted in intense Fos labeling in a highly restricted distribution in the PBcL, bordering the superior cerebellar peduncle (Fig. 6G). Similar to the pre-LC, most Fos-expressing neurons in this spot also expressed FoxP2 (64%). Likewise, Syp-mCherry tracing from the HSD2 neurons produced dense bouton labeling in the same PBcL subregion (Fig. 6, J–L). The distribution of Fos-activated FoxP2 neurons here matched the distribution of Syp-mCherry-labeled boutons, defining the target zone for HSD2 neurons in the mouse PBcL.
To ensure that neuronal Fos activation in this region was not a nonphysiological phenomenon of artificially activating the HSD2 neurons, we also examined Fos expression after sodium depletion. Simply restricting dietary sodium does not activate HSD2 neurons or produce sodium appetite in mice as consistently as it does in rats (unpublished observations), so we used furosemide diuresis, which more rapidly and reliably induces sodium appetite in mice. Mice fed sodium-deficient chow for 24 h after furosemide injection had prominent Fos expression in the pre-LC, in a similar pattern to that produced by DREADD-activating HSD2 neurons. Among the overall population of FoxP2-immunoreactive neurons in the pre-LC region, the percentage of Fos activation increased substantially after furosemide treatment plus 24-h dietary sodium deprivation (57% ± 22% vs. 3% ± 2% in furosemide-treated mice fed normal-sodium chow, n = 3 per group; P = 0.008), and among Fos-immunoreactive nuclei in this region, 82% ± 9% were also immunoreactive for FoxP2. Similarly, in PBcL, sodium depletion produced Fos-activation in a subset of FoxP2+ neurons (22% ± 4% vs. 3% ± 1%; P = 0.0002), and 53% ± 13% of Fos-immunoreactive PBcL neurons were immunoreactive for FoxP2.
Clearly, the three-dimensional relationship between pre-LC neurons and surrounding populations, particularly the LC, is more complex in mice than in rats. To better understand this three-dimensional relationship with surrounding populations of catecholaminergic and cholinergic neurons, we triple-labeled FoxP2, TH, and ChAT in mouse brainstem sections cut in axial and parasagittal planes.
In axial sections, we confirmed that FoxP2- and TH-immunoreactive neurons are mutually exclusive, with a complex relationship extending medially and laterally on either side of the LC (Fig. 7, D and E). FoxP2 nuclear immunoreactivity in mice was also mutually exclusive with cytoplasmic immunoreactivity for ChAT, which identified a large population of cholinergic neurons in the PPT and LDT, rostral and medial to the pre-LC (Fig. 7, A–D). At the medial, caudal extreme of this population, a contiguous cluster of FoxP2 neurons (yellow arrowhead in Fig. 7F) appeared homologous to the far-caudal/medial (non-pre-LC) cluster of FoxP2 neurons in rats.
Figure 7.

Axial sections from a mouse (C57B6/J, male) showing the rostral-to-caudal distribution of LDT cholinergic neurons (ChAT, magenta; A–C), locus coeruleus (LC) catecholaminergic neurons (TH, green; A–F), and FoxP2 neurons (red, A-F). D–E: white arrows highlight the pre-LC population of FoxP2-immunoreactive neurons, which surround the LC caudal to the LDT and dorsolateral to Barrington’s nucleus (Bar). The yellow arrowhead in F indicates a caudal subpopulation of medial FoxP2 neurons contiguous with the pre-LC. Scale bar is 200 μm.
In parasagittal sections, we again confirmed the mutual exclusivity of FoxP2, TH, and ChAT (Fig. 8). In this plane, it is clear that the lateral extent of the pre-LC population lies immediately rostral to the LC (as in rats; Fig. 8, A and B), whereas in progressively medial sections, FoxP2-immunoreactive neurons cross through the LC and into a narrow territory that is ventral and immediately caudal to the more medial LC neurons and runs atop Barrington’s nucleus (Bar, Fig. 8D), consistent with our previous description (5).
Figure 8.

Parasagittal sections from a mouse (C57B6/J, male) showing the distribution of LDT cholinergic neurons (ChAT, magenta), locus coeruleus (LC) catecholaminergic neurons (TH, green), and FoxP2 neurons (red). A–D: proceed from lateral to medial, with rostral to the left and caudal to the right in each panel. White arrows highlight the pre-LC population of FoxP2 neurons (A, B, and D), which distribute caudal to LDT neurons and extend from a rostral-lateral (A and B) to a caudal-medial (D) position relative to the LC. Approximate distance from midline (in mm) is given at the bottom left of each panel. Scale bar is 200 μm. 7n, ChAT-immunoreactive fibers of the facial nerve.
Finally, we used L10GFP-reporter mice for Pdyn-IRES-Cre to learn what extent of the pre-LC population may be dynorphinergic. Consistent with our previous report that 90%–100% of Pdyn neurons in this region express FoxP2 (27), we found FoxP2 nuclear immunoreactivity in virtually all L10GFP-expressing neurons in the pre-LC and PBcL (Fig. 9, C and F). Also, consistent with results published during the preparation of this manuscript (28), we found intense Fos expression in neurons with L10GFP expression, indicating previous or current Pdyn expression, both in the pre-LC (Fig. 9, A and B) and rostrally in PBcL (Fig. 9, D and E) after furosemide-induced sodium depletion. Sodium-deplete mice (n = 8) had Fos labeling in 47% ± 12% of neurons in the pre-LC region that expressed the Pdyn reporter, significantly more than saline-injected controls (18% ± 15%; P = 0.0009 by two-tailed t test). Of the sodium-depletion-activated neurons here, 80% ± 10% expressed L10GFP. Likewise, sodium depletion activated 14% ± 10% of the larger population of Pdyn reporter-expressing neurons in the PBcL, but this was not significantly different from saline-injected controls (6% ± 6%; P = 0.08). Of the Fos-expressing neurons in PBcL, 45% (furosemide-injected) and 18% (control) expressed the reporter for Pdyn (P = 0.07).
Figure 9.

Coronal sections from a Pdyn Cre-reporter mouse (Pdyn-IRES-Cre;R26-lsl-L10GFP, male) after sodium depletion showing (A–C) pre-locus coeruleus (LC) and (D–F) central lateral parabrachial nucleus (PBcL). A and D: Fos immunoreactivity (red) after furosemide diuresis and low-sodium diet. B and E: nuclear Fos immunoreactivity colocalizes with cytoplasmic GFP reporter for Pdyn (green) in many pre-LC and PBcL neurons. C and F: most neurons expressing the Pdyn reporter (green) also contain nuclear immunoreactivity for FoxP2 (magenta). Approximate level relative to bregma (in mm) is provided at the bottom right of A and D. Scale bar is 100 μm.
Afferents to Mouse Pre-LC
The pre-LC was initially named and described as the site of a dense terminal field produced by axons originating in the medial NTS in rats (7). We later identified a similarly dense, focal projection from the paraventricular hypothalamic nucleus in rats (PVH; 9), and a homologous projection was found in mice using Cre-conditional labeling of axonal projections from glutamatergic PVH neurons that express the transcription factor Sim1 (29). To compare projections from the PVH to the mouse pre-LC and PBcL, we injected AAV8-EF1a-DIO-Syp-mCherry into the PVH of Sim1-Cre mice (Fig. 10A). These bilateral injections transduced neurons at all levels of the PVH and their Syp-mCherry-labeled boutons filled the pre-LC and PBcL. PVH axons densely overlapped the same regions that receive input from HSD2 neurons in the NTS and exhibit intense Fos expression after HSD2 neuronal activation or sodium depletion. These axons also produced labeling in the medial, waist, and external lateral PB subnuclei, consistent with previous descriptions in rats and mice (9, 29).
Figure 10.

Cre-conditional anterograde axonal tracing from the paraventricular hypothalamic nucleus (PVH) with synaptophysin-mCherry (Syp-mCherry). A: experimental schematic for transducing glutamatergic PVH neurons in mice (Sim1-Cre, female). B: Syp-mCherry fluorescence (red) in axial sections through the mid-anterior hypothalamus reveals extensive, bilateral transduction of PVH neurons (DAPI counterstain in blue), producing dense Syp-mCherry labeling in the pre-LC (C–E) and central lateral parabrachial nucleus (PBcL; F–H). Tyrosine hydroxylase (TH) immunofluorescence (blue in D and E and G and H) highlights local landmarks including the LC (D and E) and catecholaminergic axons in outer subdivision of the external lateral PB subnucleus (PBeL, G and H). The midline is to the left in each panel. Scale bars (E and H) are both 200 µm and apply to the remaining two parts in each row.
Separately in the hypothalamus, GABAergic neurons in the arcuate nucleus also send a concentrated axonal projection to the PB region. A subset of GABAergic neurons in the arcuate hypothalamic nucleus produce agouti-related protein (AgRP) and play an important role in promoting food intake (30–34). They are the only cells in the brain that produce AgRP (35, 36), so immunolabeling this neuropeptide can be used to reveal their axonal projections. A prior report in mice showed AgRP-immunoreactive axons arborizing in a location referred to as the PB, which instead appears to be centered in the location of pre-LC neurons [see Fig. 2, K–M of Broberger et al. (37)]. Other investigators used Cre-conditional expression of channelrhodopsin in Agrp-Cre transgenic mice to label projections from the arcuate hypothalamic nucleus, revealing similar axonal labeling near the LC and caudal PB [see inset of Fig. 2C of Atasoy et al. (38)]. To better characterize this projection, we immunolabeled AgRP along with FoxP2 and observed a strikingly dense and focal projection, corresponding to the location of pre-LC neurons. Intense AgRP immunoreactivity identified a dense field of axons flanking and slicing through the dorsal LC, closely surrounding neurons with FoxP2-immunoreactive nuclei (Fig. 11, A–C). This terminal field was the most prominent concentration of AgRP-immunoreactive fibers in the brainstem, with the exception of a rostral terminal field in the ventrolateral subdivision of the periaqueductal gray matter. We found another patch of AgRP-immunoreactive axons within the PBcL (Fig. 11, G–I), in the same spot that receives input from HSD2 neurons and contains intense Fos labeling after HSD2 neuronal activation or sodium depletion. We also immunolabeled AgRP here along with Syp-mCherry after tracing axonal Sim1-Cre projections from the PVH. Despite close intermingling in both pre-LC and PBcL, AgRP immunoreactivity did not colocalize with any Syp-mCherry-containing boutons labeled from the PVH (Fig. 11, D–F and J–K).
Figure 11.

Immunofluorescence labeling for agouti-related peptide (AgRP, ice-blue) in mouse brainstem (C57B6/J, female) identifies axonal projections from the arcuate hypothalamic nucleus. AgRP-immunoreactive axons concentrate in the pre-LC (A–C) and form a smaller patch within lateral parabrachial subnucleus (PBcL) (G–L), amid FoxP2-immunoreactive neurons in each. Also in both the pre-LC (D and E) and PBcL (G and H), AgRP-immunoreactive axons intermingle closely with Syp-mCherry-labeled boutons from the paraventricular hypothalamic (PVH; see Fig. 10 for injection site). Approximate level relative to bregma (in mm) is provided at the top right of the top panel in each column. Scale bars in (C, F, I, and L) are 200 μm and apply to the remaining parts in each column.
In addition to convergent input from the hypothalamus (and ascending input from the NTS), we identified a surprisingly heavy, direct projection from the cerebral cortex. Retrograde tracer injections centered in the PB and pre-LC label neurons in several limbic association areas, particularly the insular and orbital-medial prefrontal cortex (39, 40). Our injections of AAV8-Ef1a-Syp-mCherry (not Cre-conditional) into the insular cortex (n = 3) labeled many boutons in the PB (41) but produced no more than light labeling in the vicinity of FoxP2-immunoreactive pre-LC neurons. In contrast, injections into the medial prefrontal cortex (n = 3) produced heavier labeling that extended caudally through the medial PB and into the pontine central gray. In the center of this broader terminal zone, boutons from the medial prefrontal cortex collected into a prominent, focal concentration that closely surrounded neurons with FoxP2-immunoreactive nuclei in the pre-LC (Fig. 12).
Figure 12.

The medial prefrontal cortex (mPFC) sends a dense axonal projection to the hindbrain tegmentum (A) shown here at a level approximately 5.5 mm caudal to bregma. A prominent target of this mPFC projection is the pre-locus coeruleus population of FoxP2 neurons (B), which are densely surrounded by mCherry-labeled boutons from the mPFC (C and D). The inset in A is a sagittal schematic of the mPFC injection of AAV-Syp-mCherry, and the inset in B illustrates the extent of Syp-mCherry expression in an axial section through the center of the mPFC injection site (Case No. 01657, C57B6/J female mouse). Scale bars are 200 μm (A) and 100 μm (B).
DISCUSSION
We used the established molecular markers for pre-LC neurons in rats (Fos activation plus FoxP2) to highlight the location and distribution of pre-LC neurons in mice. We also clarified their three-dimensional relationship to well-known populations of cholinergic and catecholaminergic neurons and confirmed that, in addition to FoxP2, most pre-LC neurons express Pdyn. Finally, we used anterograde tracing and immunofluorescence labeling to show that the pre-LC integrates information from disparate sources, including the prefrontal cortex, hypothalamus, and medulla. After discussing limitations and opportunities to extend these findings, we discuss potential integrative and functional roles of these fascinating neurons.
Limitations and Opportunities for More Precise Characterization of Pre-LC Neurons
We used conventional approaches to identify markers and axonal projections, without identifying an individual gene or protein marker that on its own identifies pre-LC neurons. Many surrounding neurons express FoxP2 and even the Pdyn-expressing subset of these forms a population much larger than the pre-LC (27, 42), so the intersection of just these two markers does not selectively identify pre-LC neurons, except when histological analysis is limited to a very small region (∼300 µm in diameter) flanking the LC. The similar, lateral cluster in PBcL is even smaller (∼50 × 100 µm). Thus, attempting to target either of these populations using a breeding strategy that is based on the intersectional expression of Foxp2 and Pdyn would not be selective for pre-LC neurons or for the PBcL cluster. Even an intersectional strategy that includes injecting a recombinase-conditional vector precisely within the pre-LC is unlikely to produce fully selective targeting, due to (in our experience) the additional transduction of Foxp2/Pdyn-expressing neurons in the PB, well outside the pre-LC, even after extremely small injections on the order of 20 nL (42). Setting aside the practical, technical difficulty of making precise injections (or iontophoretic ejections) inside a stereotaxic radius on the order of ∼100 µm, this problem may also stem from AAV uptake by dendrites or axons that extend into or through the pre-LC from neurons located hundreds of microns outside it. The existence of axonal input to the pre-LC from the PVH, Arc, and NTS could be used as a route for anterograde, transynaptic targeting (43), but even coupled with an intersectional targeting strategy this may not be sufficiently selective, due to collateral projections from each of these sites to other populations of Foxp2/Pdyn-expressing neurons in the lateral PB (9, 27, 37).
Unless and until an individually specific marker is found for histologically identifying pre-LC neurons, we recommend labeling LC neurons and/or Fos expression after sodium depletion (or HSD2 neuron activation) to help identify their location. The incredibly prominent Fos expression by pre-LC neurons during sodium deficiency offers an opportunity for FosTRAP tagging followed by single-cell RNA-Seq profiling, which could expand our knowledge about the pre-LC transcriptome (44, 45). This approach could identify new intersectional markers or perhaps even an individual marker that would enhance our ability to selectively target pre-LC neurons for experimental work.
It would also help to identify additional negative-control markers for targeting surrounding populations of neurons, especially the contiguous FoxP2 neurons that extend caudally and medially from the Fos-activated, Pdyn-expressing pre-LC population. These caudally contiguous, FoxP2+ neurons intermingle with the medial aspect of the (Fos-activated, Pdyn-expressing) pre-LC FoxP2+ neurons in mice, just medial to the caudal LC. In rats, these neurons extend further caudally and medially and intermingle with the rostral tip of the LC. Neurons that express neuropeptide S (Nps) have a distribution very similar to this in rats and mice (46, 47), and it will be interesting to learn whether this neuropeptide or other genetic markers can identify these Fos-negative FoxP2+ neurons.
Input-Output Connectivity of Pre-LC Neurons
Without a practical method for precisely and selectively transducing pre-LC neurons, we lack truly comprehensive, cell-type-specific information about their input-output connectivity in mice. In rats, using conventional axonal tracers, Saper et al. (40) identified the general pattern of brain regions that send axons to this region of the brainstem tegmentum, and after smaller injections of conventional retrograde tracers in mice, centered in the pre-LC, we see a largely similar pattern of retrograde labeling [J. C. Geerling; unpublished observations from whole brain analysis of cases generated in Gasparini et al. (19) and Grady et al. (41)]. Also in rats, we mapped the brain-wide output targets of all FoxP2+ neurons in the pre-LC and PB, using conventional anterograde axonal tracing followed by retrograde labeling plus immunofluorescence labeling for FoxP2 (11). This approach revealed that their primary targets (brain regions that receive direct, axonal input from FoxP2+ pre-LC neurons) are the paraventricular thalamic nucleus, PVH, dorsal hypothalamic nucleus, lateral hypothalamic area, and ventral tegmental area.
In mice, using a Cre-conditional anterograde tracer in Pdyn-IRES-Cre and Foxp2-IRES-Cre strains, we identified a similar set of brain regions receiving axonal projections from neurons in the pre-LC and PB that express Pdyn or Foxp2 (42). For the reasons above, these single-gene-targeting approaches cannot identify the connectivity of pre-LC neurons selectively because nearby (non-pre-LC) neurons are transduced in every case. Nonetheless, this approach did label a much smaller (Pdyn or Foxp2) subset of the overall axonal projections from glutamatergic neurons in this region (42). Using this approach, we found heavy projections to the aforementioned targets identified in rats, plus heavy projections to several preoptic nuclei, which we had not targeted with retrograde tracer injections in rats. It will be important to learn whether and to what extent these axonal projections to the preoptic area originate from pre-LC neurons versus other Pdyn-expressing neurons in the lateral PB, which are probably the dominant source of output to the preoptic area from this region of the brainstem (27, 48, 49). Our Cre-conditional tracing confirmed a lack of axonal projections from Pdyn-expressing neurons in the pre-LC and PB to the cerebral cortex, basal forebrain, amygdala, or regions of the thalamus besides the paraventricular nucleus (42).
Two other groups reported similar sets of axonal projections after injecting Cre-conditional vectors into this region of the brainstem in Pdyn-IRES-Cre mice [see Supplemental/extended Fig. 8 in Kim et al. (50) and Lee et al. (28)]. In one of these studies, an AAV was said to selectively transduce pre-LC neurons after injection volumes (60–100 nL) that were larger than those in our cases (15–60 nL), which spread to transduce many neurons outside the pre-LC [S. Gasparini and J. C. Geerling; unpublished observations; see also Huang et al.(42)]. These investigators also used Cre-conditional rabies tracing to identify putative afferents to Pdyn-expressing neurons in this region (28). Rabies-infected neurons were identified in the bed nucleus of the stria terminalis (BST), central nucleus of the amygdala, and paraventricular nucleus of the hypothalamus (28). In light of our current and previous tracing results, it is surprising that these authors did not report rabies-infected neurons in the arcuate hypothalamic nucleus or cerebral cortex, and found very few rabies-infected neurons in the NTS, which supplies heavy axonal input to the pre-LC (7, 8, 19). Axonal tracing from the NTS led to the discovery and naming of the pre-LC (7), and more recent electrophysiologic studies confirmed that the HSD2 neurons in the NTS are directly, synaptically connected to pre-LC neurons, including those that express Pdyn (15, 28).
The same authors identified descending, inhibitory synaptic input from the dorsal BST and found that this connection reduces pre-LC neuronal activity when sodium is tasted (28). Glutamatergic neurons in the PVH likewise provide direct, excitatory input to undefined neurons in the pre-LC (29). We are not aware of any electrophysiologic work characterizing the afferents identified from the cerebral cortex or arcuate nucleus of the hypothalamus. This information would be valuable, along with more information about how these inputs, in combination, sculpt the output from pre-LC neurons.
Clearly, more work is needed to identify and characterize the full suite of synaptic input connections that control pre-LC neurons. Although it requires more effort, anterograde tracing from each hypothesized afferent site (identified by conventional retrograde tracing from the pre-LC) likely will identify several inputs that are not labeled using the rabies method. Following anatomical identification, channel rhodopsin-assisted circuit mapping [CRACM (51)] can allow rigorous testing and further characterization of direct, synaptic connectivity (12, 15, 28, 29, 51). Clarifying the full suite of input connectivity to pre-LC neurons this way will help focus more detailed investigations into how their integrative activity affects physiology and behavior.
Integrative Function of Pre-LC Neurons
Pre-LC neurons appear to integrate excitatory and inhibitory inputs from a variety of distant brain regions. Their first identified source of input was the NTS (7), and it remains unclear whether they receive input from other NTS neurons beyond the HSD2 population. NTS neurons are diverse and can relay a wide variety of visceral input signals, including mechanosensory and chemosensory information from the gastrointestinal tract, aorta, and lungs. It will be important to determine whether any other NTS-relayed viscerosensory information reaches the pre-LC, beyond the volume-related information delivered by HSD2 neurons.
In addition to their ascending, viscerosensory input from the NTS, the pre-LC receives substantial descending inputs from the hypothalamus in rats (9) and in mice (confirmed in this study). In addition to excitatory axonal projections from the PVH (29), pre-LC neurons appear to receive substantial input from inhibitory neurons in the arcuate nucleus that produce AgRP (19), as confirmed in this study. AgRP-containing axons form dense varicosities that closely surround pre-LC neurons and intermingle with ascending (excitatory) input from HSD2 neurons (19), but we do not yet know if these axons, or those from the PVH or other hypothalamic populations, synapse directly on the same pre-LC neurons.
Another prominent source of hypothalamic input is the lateral hypothalamic area (LHA). Specifically, a subregion of the LHA contains neurons that prominently express the neuropeptide Crh during dehydration and send heavy axonal projections to the pre-LC region in rats (52). This projection likely explains the dense cluster of CRH-immunoreactive axons that concentrate in the rat pre-LC [see Fig. 1 of Valentino et al. (53)]. A direct projection from dehydration-sensitive LHA neurons to the pre-LC is noteworthy because of a robust, yet poorly understood phenomenon known as dehydration anorexia. Dehydration anorexia refers to the inhibition of feeding caused by extracellular hyperosmolarity (also known as intracellular dehydration), despite intact hunger signals (54). Pre-LC neurons appear to integrate excitatory input from brain regions activated by dehydration and hypovolemia (NTS, PVH, and LHA) with inhibitory input from neurons that increase hunger (AgRP neurons), and depending on the balance of these excitatory and inhibitory input signals, they may inhibit food intake during dehydration. Of note, Pdyn-expressing neurons in the lateral PB were reported to reduce food intake in response to gastrointestinal stretch (50), so given the similar axonal projection patterns of Foxp2/Pdyn neurons in the pre-LC and PB (11, 28, 42), it would not be surprising to learn that pre-LC neurons inhibit food intake. Indeed, photostimulating PVH axons in the pre-LC region reduced food intake, whereas optogenetic inhibition of these axons and inhibition of neurons located here increased food intake in mice (16, 29).
It will be important to determine whether pre-LC neurons process meal-related signals the typical, postprandial fluctuations in viscerosensory input plus osmotic and other humoral signals or merely suppress appetite in response to more dire homeostatic disruptions such as severe intracellular dehydration or overt hypovolemia. We predict that pre-LC neurons mediate dehydration anorexia, as well as the reduced hunger reported after HSD2 neuronal activation (14, 15), and anhedonic responses to hypovolemia and hyperaldosteronism (55, 56). Furthermore, we hypothesize that pre-LC neurons help to curb hunger in response to the normal, transient changes in blood volume and osmolarity that occur immediately after food consumption (57).
In this context, it will be important to also learn more about the contextual information delivered to pre-LC neurons by inhibitory afferents in the central nucleus of the amygdala (58, 59) or BST (28, 60) and by pyramidal neurons in the cerebral cortex. We were surprised to find such a massive axonal projection from the medial prefrontal cortex directly to the pre-LC, and reviewing previous tracing data confirmed the existence of a similar, direct axonal projection to a region surrounding the LC in rats (61). This direct input from the brain’s “emotional motor cortex” (62) may convey information related to negative affect, or instead may deliver contextual or learned signals that are more directly relevant to appetite. Patients with mood disorders often report low appetite and even weight loss, and a direct projection from the medial prefrontal cortex to pre-LC neurons offers a potential route for hunger suppression by a negative affective state or emotionally salient contextual cues. Indeed, activating Pdyn-expressing pre-LC neurons produces aversive place-preference responses, and activating neurons in this small region inhibits food intake (16, 28, 29). Alternatively, contextual information from the cerebral cortex may exert a more nuanced influence over sodium appetite, feeding, or some other function regulated by pre-LC neurons.
It is important to note the current lack of a unified understanding of pre-LC neuronal function(s). Our initial hypothesis that these neurons help promote sodium appetite stemmed from the dense input projection they receive from the HSD2 neurons in the NTS, which drive sodium appetite (7, 8, 63). Despite circumstantial evidence supporting this prediction, some results contradict it or suggest other functions for neurons in this region. Dense axonal projections from the HSD2 neurons form excitatory synapses on pre-LC neurons (14, 15, 19, 28), and stimulating the HSD2 neurons promotes sodium appetite (14, 15), yet optogenetically stimulating their axons in the pre-LC did not (15). Nonetheless, optogenetic stimulation of the Pdyn-expressing neurons in this location (referred to as “pre-LC”) did increase salt consumption (28). Separately, optogenetic stimulation of PVH axons in this region (referred to as “pLC”) reduced food intake, whereas non-selectively inhibiting neurons here increased food intake (29). Another study, published during the preparation of this manuscript, reported aversive responses after stimulation and increased liquid intake after inhibition of glutamatergic neurons in or near this region (referred to as “peri-LC”). Thus, four studies to date have drawn three different conclusions about neuronal function in this region of the brainstem: that its activation by HSD2 neurons is not sufficient to promote sodium appetite (15), that activating Pdyn-expressing neurons here promotes sodium appetite (28), and that unidentified neurons here constrain food and liquid intake (16, 29). These conclusions may not be mutually exclusive, but we clearly need more information about the other neuronal populations in this region and how each integrates brainstem, hypothalamic, and other contextual information to influence appetite. This information is necessary to better understand the neurons and circuit connections controlling hunger, thirst, and sodium appetite. It is possible, for example, that these and other behaviors are controlled separately, by distinct yet intermingled subpopulations of neurons. Adopting a more precise molecular ontology and nomenclature (beginning with the population of neurons we named the pre-LC) will allow for a better understanding of neural circuits that involve this brainstem region.
The aforementioned information raises another question: if pre-LC neurons do promote sodium appetite, is input from HSD2 neurons necessary for this effect? Or can pre-LC neurons increase salt consumption simply in response to excitatory input from afferents in the hypothalamus (or cerebral cortex)? Sodium appetite can arise in the absence of the systemic signals delivered by HSD2 neurons (hyperaldosteronism and hypovolemia), so if pre-LC neurons do promote salt intake, their other excitatory inputs may drive HSD2-neuron-independent forms of sodium appetite. For example, the PVH may relay osmotic and other humoral signals (including angiotensin II) that are sensed by neurons in the lamina terminalis and are known to influence saline intake (64–67). Likewise, the existence of a direct axonal projection from the cerebral cortex to the pre-LC offers a possible explanation for the observation that electrically stimulating the mPFC can augment sodium appetite (68). Of course, it is possible that neurons in the ventrolateral BST, rather than the pre-LC, mediate sodium appetite (15) and the primary role of pre-LC neurons is to suppress food intake or promote an anhedonic state. Clearly, we need more information to better understand the integrative function of pre-LC neurons.
Perspectives and Significance
The present results improve our understanding of the location, distribution, genetic identity, and afferent projections to pre-LC neurons, relative to surrounding neurons. This new information provides a neuroanatomical foundation for cell-type-specific investigation of their properties and functions. We predict that pre-LC neurons integrate affective or other contextual information from the cerebral cortex with homeostatic information from the brainstem and hypothalamus to promote an aversive state with increased sodium appetite and reduced hunger.
GRANTS
This work was supported by National Institutes of Health Grant NS099425 (to J. C. Geerling).
DISCLOSURES
None of the authors have a conflict of interest, financial or otherwise, related to this study.
AUTHOR CONTRIBUTIONS
S.G. and J.C.G. conceived and designed research; S.G., J.M.R., A.M.G., L.P., and J.C.G. performed experiments; S.G., J.M.R., and J.C.G. analyzed data; S.G., J.M.R., and J.C.G. interpreted results of experiments; S.G. and J.C.G. prepared figures; S.G. and J.C.G. drafted manuscript; S.G., J.M.R., and J.C.G. edited and revised manuscript; S.G., J.M.R., A.M.G., L.P., and J.C.G. approved final version of manuscript.
ACKNOWLEDGMENTS
We thank the late Arthur Loewy for mentorship, collaboration, and support. We thank Jung-Won Shin for performing confocal imaging for rat immunofluorescence results. We also thank Jadylin Tolda for proofreading the manuscript.
REFERENCES
- 1.Jones BE, Halaris AE, McIlhany M, Moore RY. Ascending projections of the locus coeruleus in the rat. I. Axonal transport in central noradrenaline neurons. Brain Res 127: 1–21, 1977. doi: 10.1016/0006-8993(77)90377-8. [DOI] [PubMed] [Google Scholar]
- 2.Armstrong DM, Saper CB, Levey AI, Wainer BH, Terry RD. Distribution of cholinergic neurons in rat brain: demonstrated by the immunocytochemical localization of choline acetyltransferase. J Comp Neurol 216: 53–68, 1983. doi: 10.1002/cne.902160106. [DOI] [PubMed] [Google Scholar]
- 3.Rye DB, Saper CB, Lee HJ, Wainer BH. Pedunculopontine tegmental nucleus of the rat: cytoarchitecture, cytochemistry, and some extrapyramidal connections of the mesopontine tegmentum. J Comp Neurol 259: 483–528, 1987. doi: 10.1002/cne.902590403. [DOI] [PubMed] [Google Scholar]
- 4.Satoh K, Shimizu N, Tohyama M, Maeda T. Localization of the micturition reflex center at dorsolateral pontine tegmentum of the rat. Neurosci Lett 8: 27–33, 1978. doi: 10.1016/0304-3940(78)90092-7. [DOI] [PubMed] [Google Scholar]
- 5.Verstegen AM, Vanderhorst V, Gray PA, Zeidel ML, Geerling JC. Barrington's nucleus: neuroanatomic landscape of the mouse “pontine micturition center.” J Comp Neurol 525: 2287–2309, 2017. doi: 10.1002/cne.24215. [DOI] [PMC free article] [PubMed] [Google Scholar]
- 6.Palmiter RD. The parabrachial nucleus: CGRP neurons function as a general alarm. Trends Neurosci 41: 280–293, 2018. doi: 10.1016/j.tins.2018.03.007. [DOI] [PMC free article] [PubMed] [Google Scholar]
- 7.Geerling JC, Loewy AD. Aldosterone-sensitive neurons in the nucleus of the solitary tract: efferent projections. J Comp Neurol 497: 223–250, 2006. [Erratum in J Comp Neurol 498: 431, 2006]. doi: 10.1002/cne.20993. [DOI] [PubMed] [Google Scholar]
- 8.Geerling JC, Loewy AD. Sodium deprivation and salt intake activate separate neuronal subpopulations in the nucleus of the solitary tract and the parabrachial complex. J Comp Neurol 504: 379–403, 2007. doi: 10.1002/cne.21452. [DOI] [PubMed] [Google Scholar]
- 9.Geerling JC, Shin J-W, Chimenti PC, Loewy AD. Paraventricular hypothalamic nucleus: axonal projections to the brainstem. J Comp Neurol 518: 1460–1499, 2010. doi: 10.1002/cne.22283. [DOI] [PMC free article] [PubMed] [Google Scholar]
- 10.Geerling JC, Stein MK, Miller RL, Shin JW, Gray PA, Loewy AD. FoxP2 expression defines dorsolateral pontine neurons activated by sodium deprivation. Brain Res 1375: 19–27, 2011. doi: 10.1016/j.brainres.2010.11.028. [DOI] [PMC free article] [PubMed] [Google Scholar]
- 11.Shin JW, Geerling JC, Stein MK, Miller RL, Loewy AD. FoxP2 brainstem neurons project to sodium appetite regulatory sites. J Chem Neuroanat 42: 1–23, 2011. doi: 10.1016/j.jchemneu.2011.05.003. [DOI] [PMC free article] [PubMed] [Google Scholar]
- 12.Garfield AS, Li C, Madara JC, Shah BP, Webber E, Steger JS, Campbell JN, Gavrilova O, Lee CE, Olson DP, Elmquist JK, Tannous BA, Krashes MJ, Lowell BB. A neural basis for melanocortin-4 receptor-regulated appetite. Nat Neurosci 18: 863–871, 2015. doi: 10.1038/nn.4011. [DOI] [PMC free article] [PubMed] [Google Scholar]
- 13.Geerling JC, Yokota S, Rukhadze I, Roe D, Chamberlin NL. Kolliker-Fuse GABAergic and glutamatergic neurons project to distinct targets. J Comp Neurol 525: 1844–1860, 2017. doi: 10.1002/cne.24164. [DOI] [PMC free article] [PubMed] [Google Scholar]
- 14.Jarvie BC, Palmiter RD. HSD2 neurons in the hindbrain drive sodium appetite. Nat Neurosci 20: 167–169, 2017. doi: 10.1038/nn.4451. [DOI] [PubMed] [Google Scholar]
- 15.Resch JM, Fenselau H, Madara JC, Wu C, Campbell JN, Lyubetskaya A, Dawes BA, Tsai LT, Li MM, Livneh Y, Ke Q, Kang PM, Fejes-Tóth G, Náray-Fejes-Tóth A, Geerling JC, Lowell BB. Aldosterone-sensing neurons in the NTS exhibit state-dependent pacemaker activity and drive sodium appetite via synergy with angiotensin II signaling. Neuron 96: 190–206.e7, 2017. doi: 10.1016/j.neuron.2017.09.014. [DOI] [PMC free article] [PubMed] [Google Scholar]
- 16.Gong R, Xu S, Hermundstad A, Yu Y, Sternson SM. Hindbrain double-negative feedback mediates palatability-guided food and water consumption. Cell 182: 1589–1605.e22, 2020. doi: 10.1016/j.cell.2020.07.031. [DOI] [PubMed] [Google Scholar]
- 17.Krashes MJ, Shah BP, Madara JC, Olson DP, Strochlic DE, Garfield AS, Vong L, Pei H, Watabe-Uchida M, Uchida N, Liberles SD, Lowell BB. An excitatory paraventricular nucleus to AgRP neuron circuit that drives hunger. Nature 507: 238–242, 2014. doi: 10.1038/nature12956. [DOI] [PMC free article] [PubMed] [Google Scholar]
- 18.Balthasar N, Dalgaard LT, Lee CE, Yu J, Funahashi H, Williams T, Ferreira M, Tang V, McGovern RA, Kenny CD, Christiansen LM, Edelstein E, Choi B, Boss O, Aschkenasi C, Zhang CY, Mountjoy K, Kishi T, Elmquist JK, Lowell BB. Divergence of melanocortin pathways in the control of food intake and energy expenditure. Cell 123: 493–505, 2005. doi: 10.1016/j.cell.2005.08.035. [DOI] [PubMed] [Google Scholar]
- 19.Gasparini S, Resch JM, Narayan SV, Peltekian L, Iverson GN, Karthik S, Geerling JC. Aldosterone-sensitive HSD2 neurons in mice. Brain Struct Funct 224: 387–417, 2019. doi: 10.1007/s00429-018-1778-y. [DOI] [PMC free article] [PubMed] [Google Scholar]
- 20.Sequeira SM, Geerling JC, Loewy AD. Local inputs to aldosterone-sensitive neurons of the nucleus tractus solitarius. Neuroscience 141: 1995–2005, 2006. doi: 10.1016/j.neuroscience.2006.05.059. [DOI] [PubMed] [Google Scholar]
- 21.Campbell P, Reep RL, Stoll ML, Ophir AG, Phelps SM. Conservation and diversity of Foxp2 expression in muroid rodents: functional implications. J Comp Neurol 512: 84–100, 2009. doi: 10.1002/cne.21881. [DOI] [PMC free article] [PubMed] [Google Scholar]
- 22.Ferland RJ, Cherry TJ, Preware PO, Morrisey EE, Walsh CA. Characterization of Foxp2 and Foxp1 mRNA and protein in the developing and mature brain. J Comp Neurol 460: 266–279, 2003. doi: 10.1002/cne.10654. [DOI] [PubMed] [Google Scholar]
- 23.Miller RL, Knuepfer MM, Wang MH, Denny GO, Gray PA, Loewy AD. Fos-activation of FoxP2 and Lmx1b neurons in the parabrachial nucleus evoked by hypotension and hypertension in conscious rats. Neuroscience 218: 110–125, 2012. doi: 10.1016/j.neuroscience.2012.05.049. [DOI] [PMC free article] [PubMed] [Google Scholar]
- 24.Geerling JC, Loewy AD. Aldosterone-sensitive neurons in the nucleus of the solitary tract: bidirectional connections with the central nucleus of the amygdala. J Comp Neurol 497: 646–657, 2006. doi: 10.1002/cne.21019. [DOI] [PMC free article] [PubMed] [Google Scholar]
- 25.Herbert H, Saper CB. Cholecystokinin-, galanin-, and corticotropin-releasing factor-like immunoreactive projections from the nucleus of the solitary tract to the parabrachial nucleus in the rat. J Comp Neurol 293: 581–598, 1990. doi: 10.1002/cne.902930405. [DOI] [PubMed] [Google Scholar]
- 26.Grzanna R, Molliver ME. The locus coeruleus in the rat: an immunohistochemical delineation. Neuroscience 5: 21–40, 1980. doi: 10.1016/0306-4522(80)90068-8. [DOI] [PubMed] [Google Scholar]
- 27.Geerling JC, Kim M, Mahoney CE, Abbott SB, Agostinelli LJ, Garfield AS, Krashes MJ, Lowell BB, Scammell TE. Genetic identity of thermosensory relay neurons in the lateral parabrachial nucleus. Am J Physiol Regul Integr Comp Physiol 310: R41–R54, 2016. doi: 10.1152/ajpregu.00094.2015. [DOI] [PMC free article] [PubMed] [Google Scholar]
- 28.Lee S, Augustine V, Zhao Y, Ebisu H, Ho B, Kong D, Oka Y. Chemosensory modulation of neural circuits for sodium appetite. Nature 568: 93–97, 2019. doi: 10.1038/s41586-019-1053-2. [DOI] [PMC free article] [PubMed] [Google Scholar]
- 29.Li MM, Madara JC, Steger JS, Krashes MJ, Balthasar N, Campbell JN, Resch JM, Conley NJ, Garfield AS, Lowell BB. The paraventricular hypothalamus regulates satiety and prevents obesity via two genetically distinct circuits. Neuron 102: 653–667.e6, 2019. doi: 10.1016/j.neuron.2019.02.028. [DOI] [PMC free article] [PubMed] [Google Scholar]
- 30.Aponte Y, Atasoy D, Sternson SM. AGRP neurons are sufficient to orchestrate feeding behavior rapidly and without training. Nat Neurosci 14: 351–355, 2011. doi: 10.1038/nn.2739. [DOI] [PMC free article] [PubMed] [Google Scholar]
- 31.Essner RA, Smith AG, Jamnik AA, Ryba AR, Trutner ZD, Carter ME. AgRP neurons can increase food intake during conditions of appetite suppression and inhibit anorexigenic parabrachial neurons. J Neurosci 37: 8678–8687, 2017. doi: 10.1523/JNEUROSCI.0798-17.2017. [DOI] [PMC free article] [PubMed] [Google Scholar]
- 32.Krashes MJ, Koda S, Ye C, Rogan SC, Adams AC, Cusher DS, Maratos-Flier E, Roth BL, Lowell BB. Rapid, reversible activation of AgRP neurons drives feeding behavior in mice. J Clin Invest 121: 1424–1428, 2011. doi: 10.1172/JCI46229. [DOI] [PMC free article] [PubMed] [Google Scholar]
- 33.Luquet S, Perez FA, Hnasko TS, Palmiter RD. NPY/AgRP neurons are essential for feeding in adult mice but can be ablated in neonates. Science 310: 683–685, 2005. doi: 10.1126/science.1115524. [DOI] [PubMed] [Google Scholar]
- 34.Wu Q, Boyle MP, Palmiter RD. Loss of GABAergic signaling by AgRP neurons to the parabrachial nucleus leads to starvation. Cell 137: 1225–1234, 2009. doi: 10.1016/j.cell.2009.04.022. [DOI] [PMC free article] [PubMed] [Google Scholar]
- 35.Ollmann MM, Wilson BD, Yang YK, Kerns JA, Chen Y, Gantz I, Barsh GS. Antagonism of central melanocortin receptors in vitro and in vivo by agouti-related protein. Science 278: 135–138, 1997. [Erratum in Science 281: 1615, 1998]. doi: 10.1126/science.278.5335.135. [DOI] [PubMed] [Google Scholar]
- 36.Shutter JR, Graham M, Kinsey AC, Scully S, Lüthy R, Stark KL. Hypothalamic expression of ART, a novel gene related to agouti, is up-regulated in obese and diabetic mutant mice. Genes Dev 11: 593–602, 1997. doi: 10.1101/gad.11.5.593. [DOI] [PubMed] [Google Scholar]
- 37.Broberger C, Johansen J, Johansson C, Schalling M, Hokfelt T. The neuropeptide Y/agouti gene-related protein (AGRP) brain circuitry in normal, anorectic, and monosodium glutamate-treated mice. Proc Natl Acad Sci USA 95: 15043–15048, 1998. doi: 10.1073/pnas.95.25.15043. [DOI] [PMC free article] [PubMed] [Google Scholar]
- 38.Atasoy D, Betley JN, Su HH, Sternson SM. Deconstruction of a neural circuit for hunger. Nature 488: 172–177, 2012. doi: 10.1038/nature11270. [DOI] [PMC free article] [PubMed] [Google Scholar]
- 39.Grady F, Peltekian L, Iverson G, Geerling JC. Direct parabrachial-cortical connectivity. Cerebral Cortex 30: 4811–4833, 2020. doi: 10.1093/cercor/bhaa072. [DOI] [PMC free article] [PubMed] [Google Scholar]
- 40.Moga MM, Herbert H, Hurley KM, Yasui Y, Gray TS, Saper CB. Organization of cortical, basal forebrain, and hypothalamic afferents to the parabrachial nucleus in the rat. J Comp Neurol 295: 624–661, 1990. doi: 10.1002/cne.902950408. [DOI] [PubMed] [Google Scholar]
- 41.Grady F, Peltekian L, Iverson G, Geerling JC. Direct parabrachial-cortical connectivity. Cereb Cortex 30: 4811–4833, 2020. doi: 10.1093/cercor/bhaa072. [DOI] [PMC free article] [PubMed] [Google Scholar]
- 42.Huang D, Grady FS, Peltekian L, Geerling JC. Efferent projections of Vglut2, Foxp2 and Pdyn parabrachial neurons in mice. J Comp Neurol 529: 657–693, 2020. doi: 10.1002/cne.24975. [DOI] [PMC free article] [PubMed] [Google Scholar]
- 43.Zingg B, Chou XL, Zhang ZG, Mesik L, Liang F, Tao HW, Zhang LI. AAV-mediated anterograde transsynaptic tagging: mapping corticocollicular input-defined neural pathways for defense behaviors. Neuron 93: 33–47, 2017. doi: 10.1016/j.neuron.2016.11.045. [DOI] [PMC free article] [PubMed] [Google Scholar]
- 44.Allen WE, DeNardo LA, Chen MZ, Liu CD, Loh KM, Fenno LE, Ramakrishnan C, Deisseroth K, Luo L. Thirst-associated preoptic neurons encode an aversive motivational drive. Science 357: 1149–1155, 2017. doi: 10.1126/science.aan6747. [DOI] [PMC free article] [PubMed] [Google Scholar]
- 45.Guenthner CJ, Miyamichi K, Yang HH, Heller HC, Luo L. Permanent genetic access to transiently active neurons via TRAP: targeted recombination in active populations. Neuron 78: 773–784, 2013. [Erratum in Neuron 79: 1257, 2013]. doi: 10.1016/j.neuron.2013.03.025. [DOI] [PMC free article] [PubMed] [Google Scholar]
- 46.Clark SD, Duangdao DM, Schulz S, Zhang L, Liu X, Xu YL, Reinscheid RK. Anatomical characterization of the neuropeptide S system in the mouse brain by in situ hybridization and immunohistochemistry. J Comp Neurol 519: 1867–1893, 2011. doi: 10.1002/cne.22606. [DOI] [PubMed] [Google Scholar]
- 47.Xu YL, Reinscheid RK, Huitron-Resendiz S, Clark SD, Wang Z, Lin SH, Brucher FA, Zeng J, Ly NK, Henriksen SJ, de Lecea L, Civelli O. Neuropeptide S: a neuropeptide promoting arousal and anxiolytic-like effects. Neuron 43: 487–497, 2004. doi: 10.1016/j.neuron.2004.08.005. [DOI] [PubMed] [Google Scholar]
- 48.Chou TC, Bjorkum AA, Gaus SE, Lu J, Scammell TE, Saper CB. Afferents to the ventrolateral preoptic nucleus. J Neurosci 22: 977–990, 2002. doi: 10.1523/JNEUROSCI.22-03-00977.2002. [DOI] [PMC free article] [PubMed] [Google Scholar]
- 49.Nakamura K, Morrison SF. A thermosensory pathway mediating heat-defense responses. Proc Natl Acad Sci USA 107: 8848–8853, 2010. doi: 10.1073/pnas.0913358107. [DOI] [PMC free article] [PubMed] [Google Scholar]
- 50.Kim D-Y, Heo G, Kim M, Kim H, Jin JA, Kim H-K, Jung S, An M, Ahn BH, Park JH, Park H-E, Lee M, Lee JW, Schwartz GJ, Kim S-Y. A neural circuit mechanism for mechanosensory feedback control of ingestion. Nature 580: 376–380, 2020. doi: 10.1038/s41586-020-2167-2. [DOI] [PubMed] [Google Scholar]
- 51.Petreanu L, Huber D, Sobczyk A, Svoboda K. Channelrhodopsin-2-assisted circuit mapping of long-range callosal projections. Nat Neurosci 10: 663–668, 2007. doi: 10.1038/nn1891. [DOI] [PubMed] [Google Scholar]
- 52.Kelly AB, Watts AG. The region of the pontine parabrachial nucleus is a major target of dehydration-sensitive CRH neurons in the rat lateral hypothalamic area. J Comp Neurol 394: 48–63, 1998. doi:. [DOI] [PubMed] [Google Scholar]
- 53.Valentino RJ, Page M, Van Bockstaele E, Aston-Jones G. Corticotropin-releasing factor innervation of the locus coeruleus region: distribution of fibers and sources of input. Neuroscience 48: 689–705, 1992. doi: 10.1016/0306-4522(92)90412-U. [DOI] [PubMed] [Google Scholar]
- 54.Watts AG, Boyle CN. The functional architecture of dehydration-anorexia. Physiol Behav 100: 472–477, 2010. doi: 10.1016/j.physbeh.2010.04.010. [DOI] [PMC free article] [PubMed] [Google Scholar]
- 55.Grippo AJ, Moffitt JA, Beltz TG, Johnson AK. Reduced hedonic behavior and altered cardiovascular function induced by mild sodium depletion in rats. Behav Neurosci 120: 1133–1143, 2006. doi: 10.1037/0735-7044.120.5.1133. [DOI] [PubMed] [Google Scholar]
- 56.Morris MJ, Na ES, Grippo AJ, Johnson AK. The effects of deoxycorticosterone-induced sodium appetite on hedonic behaviors in the rat. Behav Neurosci 120: 571–579, 2006. doi: 10.1037/0735-7044.120.3.571. [DOI] [PubMed] [Google Scholar]
- 57.Mandelblat-Cerf Y, Kim A, Burgess CR, Subramanian S, Tannous BA, Lowell BB, Andermann ML. Bidirectional anticipation of future osmotic challenges by vasopressin neurons. Neuron 93: 57–65, 2017. doi: 10.1016/j.neuron.2016.11.021. [DOI] [PMC free article] [PubMed] [Google Scholar]
- 58.Petrovich GD, Swanson LW. Projections from the lateral part of the central amygdalar nucleus to the postulated fear conditioning circuit. Brain Res 763: 247–254, 1997. doi: 10.1016/S0006-8993(96)01361-3. [DOI] [PubMed] [Google Scholar]
- 59.Van Bockstaele EJ, Chan J, Pickel VM. Input from central nucleus of the amygdala efferents to pericoerulear dendrites, some of which contain tyrosine hydroxylase immunoreactivity. J Neurosci Res 45: 289–302, 1996. doi:. [DOI] [PubMed] [Google Scholar]
- 60.Dong HW, Petrovich GD, Watts AG, Swanson LW. Basic organization of projections from the oval and fusiform nuclei of the bed nuclei of the stria terminalis in adult rat brain. J Comp Neurol 436: 430–455, 2001. doi: 10.1002/cne.1079. [DOI] [PubMed] [Google Scholar]
- 61.Takagishi M, Chiba T. Efferent projections of the infralimbic (area 25) region of the medial prefrontal cortex in the rat: an anterograde tracer PHA-L study. Brain Res 566: 26–39, 1991. doi: 10.1016/0006-8993(91)91677-S. [DOI] [PubMed] [Google Scholar]
- 62.Drevets WC, Price JL, Simpson JR, Todd RD, Reich T, Vannier M, Raichle ME. Subgenual prefrontal cortex abnormalities in mood disorders. Nature 386: 824–827, 1997. doi: 10.1038/386824a0. [DOI] [PubMed] [Google Scholar]
- 63.Geerling JC, Loewy AD. Central regulation of sodium appetite. Exp Physiol 93: 177–209, 2008. doi: 10.1113/expphysiol.2007.039891. [DOI] [PubMed] [Google Scholar]
- 64.Abbott SB, Machado NL, Geerling JC, Saper CB. Reciprocal control of drinking behavior by median preoptic neurons in mice. J Neurosci 36: 8228–8237, 2016. doi: 10.1523/JNEUROSCI.1244-16.2016. [DOI] [PMC free article] [PubMed] [Google Scholar]
- 65.Matsuda T, Hiyama TY, Niimura F, Matsusaka T, Fukamizu A, Kobayashi K, Kobayashi K, Noda M. Distinct neural mechanisms for the control of thirst and salt appetite in the subfornical organ. Nat Neurosci 20: 230–241, 2017. doi: 10.1038/nn.4463. [DOI] [PubMed] [Google Scholar]
- 66.McKinley MJ, Allen AM, Burns P, Colvill LM, Oldfield BJ. Interaction of circulating hormones with the brain: the roles of the subfornical organ and the organum vasculosum of the lamina terminalis. Clin Exp Pharmacol Physiol Suppl 25: S61–S67, 1998. doi: 10.1111/j.1440-1681.1998.tb02303.x. [DOI] [PubMed] [Google Scholar]
- 67.Nation HL, Nicoleau M, Kinsman BJ, Browning KN, Stocker SD. DREADD-induced activation of subfornical organ neurons stimulates thirst and salt appetite. J Neurophysiol 115: 3123–3129, 2016. doi: 10.1152/jn.00149.2016. [DOI] [PMC free article] [PubMed] [Google Scholar]
- 68.Chiaraviglio E. Sodium chloride intake following electrochemical stimulation of the frontal lobe cortex in the rat. Physiol Behav 33: 547–551, 1984. doi: 10.1016/0031-9384(84)90369-X. [DOI] [PubMed] [Google Scholar]