

Keywords: amino acid, insulin, mTOR, prematurity, protein synthesis
Abstract
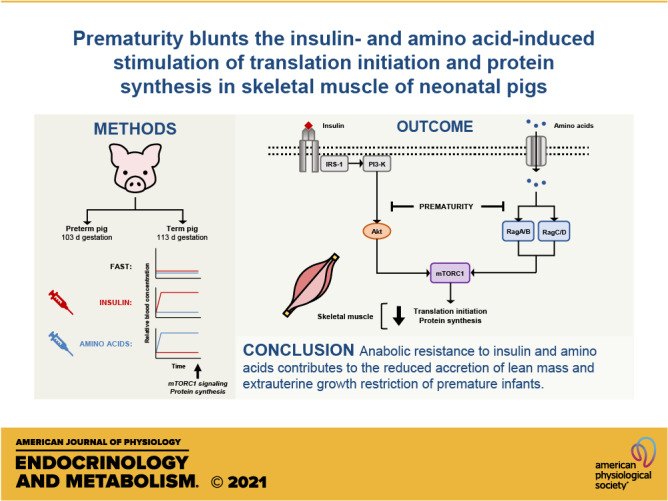
Extrauterine growth restriction in premature infants is largely attributed to reduced lean mass accretion and is associated with long-term morbidities. Previously, we demonstrated that prematurity blunts the feeding-induced stimulation of translation initiation signaling and protein synthesis in skeletal muscle of neonatal pigs. The objective of the current study was to determine whether the blunted feeding response is mediated by reduced responsiveness to insulin, amino acids, or both. Pigs delivered by cesarean section preterm (PT; 103 days, n = 25) or at term (T; 112 days, n = 26) were subject to euinsulinemic-euaminoacidemic-euglycemic (FAST), hyperinsulinemic-euaminoacidemic-euglycemic (INS), or euinsulinemic-hyperaminoacidemic-euglycemic (AA) clamps four days after delivery. Indices of mechanistic target of rapamycin complex 1 (mTORC1) signaling and fractional protein synthesis rates were measured after 2 h. Although longissimus dorsi (LD) muscle protein synthesis increased in response to both INS and AA, the increase was 28% lower in PT than in T. Upstream of mTORC1, Akt phosphorylation, an index of insulin signaling, was increased with INS but was 40% less in PT than in T. The abundances of mTOR·RagA and mTOR·RagC, indices of amino acid signaling, increased with AA but were 25% less in PT than in T. Downstream of mTORC1, eIF4E·eIF4G abundance was increased by both INS and AA but attenuated by prematurity. These results suggest that preterm birth blunts both insulin- and amino acid-induced activation of mTORC1 and protein synthesis in skeletal muscle, thereby limiting the anabolic response to feeding. This anabolic resistance likely contributes to the high prevalence of extrauterine growth restriction in prematurity.
NEW & NOTEWORTHY Extrauterine growth faltering is a major complication of premature birth, but the underlying cause is poorly understood. Our results demonstrate that preterm birth blunts both the insulin-and amino acid-induced activation of mTORC1-dependent translation initiation and protein synthesis in skeletal muscle, thereby limiting the anabolic response to feeding. This anabolic resistance likely contributes to the reduced accretion of lean mass and extrauterine growth restriction of premature infants.
INTRODUCTION
Approximately 1 in 10 infants in the United States is born premature (1). Premature birth is linked to impairments in motor and cognitive function, lower lean mass, greater adiposity, and an increased lifelong risk for developing type 2 diabetes, obesity, and cardiovascular disease (2–4). In early life, skeletal muscle is the fastest growing component of lean mass (5). Indeed, at an equivalent postconceptional age, infants born prematurely often have lower body weight, less lean mass, and greater adiposity compared with infants born at term (6). Thus, enhancing skeletal muscle growth while limiting fat accretion in these infants could be an effective approach to avoid or counteract some of the adverse consequences of prematurity on disease risk later in life. Despite efforts to optimize nutrient intake of premature infants (7), growth faltering continues to be seen in this population. Thus, if effective alternative therapies are to be developed, the mechanisms that underpin the differential growth between preterm and term infants in the perinatal period need to be established.
The considerable capacity for rapid muscle growth in the neonate implies a heightened sensitivity and responsiveness to hormonal, nutritional, and environmental factors. Indeed, our previous reports have documented the increased responsiveness of skeletal muscle protein synthesis to both insulin and amino acids at early stages compared with at later stages of postnatal life in pigs (8), a highly translatable animal model of the human infant (9–11). Insulin and amino acids have key roles in regulating the synthesis of skeletal muscle proteins. The rise in both insulin and amino acids after a meal independently activates mechanistic target of rapamycin (mTOR) and protein synthesis in neonatal pig skeletal muscle (12). mTOR is a protein kinase that, in conjunction with additional regulatory and structural proteins as mTOR complex 1 (mTORC1), integrates hormonal, nutritional, and stress inputs to regulate cell proliferation, growth, and survival (13). With respect to its role in protein metabolism, mTORC1 phosphorylates eukaryotic initiation factor (eIF)-4E binding protein 1 (4EBP1) and ribosomal protein S6 kinase 1 (S6K1). The phosphorylation of 4EBP1 releases eIF4E to enable the formation of the active eIF4E·eIF4G complex that binds mRNA and initiates translation and protein synthesis (13). S6K1 phosphorylates ribosomal protein S6 (rpS6) that, when activated, preferentially regulates the translation of genes with a 5′-terminal oligopyrimidine motif that encodes the proteins of translation machinery (14). The phosphorylation of S6K1 also promotes the transcription of genes needed for ribosome biogenesis independently of rpS6 (15, 16).
We have shown that the abundance or activation of several proteins involved in mTORC1 signaling in response to feeding, or to insulin or amino acids alone, is developmentally regulated in skeletal muscle of neonatal pigs (8, 17, 18). Generally, the abundance and/or activity of positive regulators of mTORC1 signaling and translation initiation, as well as ribosome abundance, in muscle decline with age, whereas negative regulators rise with age (8, 19, 20). As a result, the responsiveness of muscle protein synthesis to feeding decreases after term birth. This postnatal decline in responsiveness appears to be unique to skeletal muscle and further underlines the sensitivity of muscle to hormone and nutrient status (21). Recently, we reported that the feeding-induced activation of mTORC1, translation initiation, and protein synthesis in skeletal muscle is blunted in preterm pigs compared with pigs born at term (22). We showed that both insulin and amino acid signaling pathways that activate mTORC1 following an elemental meal were diminished by prematurity, suggesting that muscle is resistant to the anabolic effect of feeding. Considering that feeding elicits a concurrent postprandial rise in both insulin and amino acids, it is unclear whether muscle responds differently to insulin, amino acids, or both, in preterm compared with term pigs. Therefore, the objective of this study was to define the separate effects of physiological increases in insulin or amino acids on the regulation of skeletal muscle protein synthesis of pigs born preterm or at term using hyperinsulinemic-euaminoacidemic-euglycemic and euinsulinemic-hyperaminoacidemic-euglycemic clamps. We hypothesized that prematurity reduces muscle protein synthesis by blunting both insulin- and amino acid-induced mTORC1 activation and translation initiation signaling.
MATERIALS AND METHODS
Animals and Surgeries
The Institutional Animal Care and Use Committee, Baylor College of Medicine, approved the experimental protocol. All procedures were conducted in accordance with the National Research Council’s Guide for the Care and Use of Laboratory Animals.
Surgeries were performed under general anesthesia using sterile technique. Pregnant sows were obtained from a commercial swine farm and housed with ad libitum access to a commercial diet (Laboratory Porcine Grower Diet 5084, LabDiet, St. Louis, MO; metabolizable energy, 3,160 kcal·kg−1 diet; crude protein, 160 g·kg−1 diet) and water at the USDA/ARS Children’s Nutrition Research Center (Houston, TX). Piglets (Yorkshire × Landrace × Duroc × Hampshire) were delivered via cesarean section at gestation day 103 (PT, preterm; 3 litters) or 112 (T, term; 2 litters), as previously described (22). Following resuscitation, piglets were placed in individual plexiglass incubators maintained between 29°C and 32°C and on a 12-h light/12-h dark cycle. Piglets were surgically implanted with jugular vein and carotid artery catheters and monitored throughout the duration of the study, with full clinical assessment (mentation, urination, defecation, vomiting, temperature, gait, respiration, color, mucus membrane perfusion, and pain score) completed every 12 h. Institutional veterinarians were consulted when any of these parameters were abnormal for piglets. Iron dextran (30–100 mg IM; Henry Schein Animal Health, Melville, NY) and meloxicam (slow-release; 0.6 mg·kg−1 SC; ZooPharm, Laramie, WY) were administered before surgery. Sterile sow plasma was administered to all piglets to provide passive immunity at 4, 5, and 7 mL·kg−1 at 6, 12, and 24 h after birth, respectively.
Nutritional Support and Study Design
Formulation of total parenteral nutrition (TPN) was designed to meet or exceed the nutritional requirements of neonatal pigs (23, 24) and consisted of a complete mixture of glucose, amino acids, lipids, vitamins, electrolytes, and trace minerals (22). Following surgery, TPN was administered through the jugular vein catheter initially at 6 mL·kg−1·h−1 and increased to 8 mL·kg−1·h−1 and 10 mL·kg−1·h−1 on days 2 and 3, respectively, such that all piglets on day 3 received: fluid, 240 mL·kg−1·day−1; glucose, 22 g·kg−1·day−1; amino acids, 16 g·kg−1·day−1; and lipid, 5 g·kg−1·day−1 (Table 1). Increasing the allowance of TPN over the first three days of life was intended to mimic clinical treatment of premature infants who are not typically administered their full energy and protein requirements immediately after birth (7). Body weight was assessed at birth and on days 2, 3, and 4 and infusion rates were adjusted accordingly. On days 3 to 4, piglets were fasted for 4.5 h and placed into a sling restraint system to conduct the clamp procedure.
Table 1.
Total fluid, glucose, lipid, essential amino acid (EAA), nonessential amino acid (NEAA), and amino acid (TAA) intake in preterm and term pigs during three days of total parenteral nutrition after birth
| Day after Birth |
|||
|---|---|---|---|
| 1 | 2 | 3+ | |
| Fluid, mL·kg−1·day−1 | 144 | 192 | 240 |
| Glucose, g·kg−1·day−1 | 13.2 | 17.6 | 22.0 |
| Lipid, g·kg−1·day−1 | 3.0 | 4.0 | 5.0 |
| EAA, g·kg−1·day−1 | |||
| Arginine | 0.42 | 0.55 | 0.69 |
| Histidine | 0.24 | 0.32 | 0.40 |
| Isoleucine | 0.54 | 0.72 | 0.90 |
| Leucine | 0.95 | 1.27 | 1.59 |
| Lysine | 0.72 | 0.96 | 1.20 |
| Methionine | 0.24 | 0.32 | 0.40 |
| Phenylalanine | 0.49 | 0.65 | 0.82 |
| Threonine | 0.58 | 0.78 | 0.97 |
| Tryptophan | 0.11 | 0.15 | 0.18 |
| Valine | 0.58 | 0.78 | 0.97 |
| Total EAA | 4.87 | 6.50 | 8.12 |
| NEAA, g·kg−1·day−1 | |||
| Alanine | 0.48 | 0.64 | 0.80 |
| Aspartic acid | 0.74 | 0.99 | 1.23 |
| Cysteine | 0.16 | 0.22 | 0.27 |
| Glutamic acid | 0.74 | 0.99 | 1.23 |
| Glutamine | 0.93 | 1.23 | 1.54 |
| Glycine | 0.36 | 0.48 | 0.60 |
| Proline | 0.69 | 0.93 | 1.16 |
| Serine | 0.52 | 0.69 | 0.86 |
| Tyrosine | 0.11 | 0.15 | 0.18 |
| Total NEAA | 4.74 | 6.32 | 7.89 |
| TAA, g·kg−1·day−1 | 9.61 | 12.8 | 16.0 |
Clamp Procedure
Power analysis indicated that a total of nine pigs per treatment group is required to detect a 25% difference, with between-animal variation of 15%, a type I error of 0.05, and a power of 0.80. Pigs within sex were assigned randomly to each treatment group using the RANDBETWEEN function in Microsoft Excel 2016 (Microsoft Corporation, Redmond, WA). All pigs were included in the clamp procedure unless they could not be resuscitated following birth, did not survive the full duration of the experiment, or were euthanized on recommendation of the institutional veterinarians. Piglets within each PT and T litter were assigned to one of three treatment groups: 1) euinsulinemic-euaminoacidemic-euglycemic conditions (FAST); 2) hyperinsulinemic-euaminoacidemic-euglycemic conditions (INS); and 3) euinsulinemic-hyperaminoacidemic-euglycemic conditions (AA). This yielded six total treatment groups: PT-FAST (preterm fasting; n = 7, three males and four females); PT-INS (preterm insulin; n = 9, four males and five females); PT-AA (preterm amino acid; n = 9, three males and six females); T-FAST (term fasting; n = 8, three males and five females); T-INS (term insulin; n = 9, five males and four females); and T-AA (term amino acid; n = 9, five males and four females). Twenty min before the start of the clamp procedure, three to four sequential blood samples were obtained from the jugular vein catheter at ∼5-min intervals for the determination of fasting blood glucose levels (glucose oxidase method; Model 2300, Yellow Springs Instruments, Yellow Springs, OH) and plasma branched-chain amino acid (BCAA; rapid enzymatic assay) concentrations (25). Interassay coefficients of variation (CV) for blood glucose and plasma BCAA were 2.1% and 4.8%, respectively. Intraassay CVs for blood glucose and plasma BCAA, calculated from the sequential blood samples collected before initiating the clamp procedure, were 5.8% and 8.1%, respectively. Fasting blood glucose and plasma BCAA values were defined as the average value of the fasting blood samples. For all groups, blood glucose was clamped within 10% of each individual pig’s fasting value. In the FAST and INS groups, plasma BCAA values were clamped within 10% of each individual pig’s fasting level. To ensure accurate clamping, venous blood samples were drawn every 5 min for 120 min during the infusion and immediately analyzed for glucose and BCAA concentrations. Infusion rates of glucose (10% w/v in sterile water) and a balanced amino acid mixture (12) were adjusted to maintain euglycemia and euaminoacidemia in these groups. In PT-AA and T-AA groups, hyperaminoacidemia was achieved by infusing the amino acid mixture at a rate to increase and maintain plasma BCAA at ∼1,000 µmol·L−1 to match the level attained in preterm and term pigs 60 min after the provision of a complete enteral meal containing one-sixth of their daily nutrient requirement (22). In PT-INS and T-INS pigs, after a 10-min priming infusion, porcine insulin (Eli Lilly, Indianapolis, IN; insulin reconstituted in 0.9% w/v saline containing 4% v/v filter-sterilized pig serum) was infused at 200 ng·kg−0.66·min−1 to achieve plasma insulin levels similar to those observed in preterm and term pigs fed a complete enteral meal containing one-sixth of their daily nutrient requirement (90–105 μU·mL−1) (22, 26). PT-FAST, PT-AA, T-FAST, and T-AA groups were infused with an equivalent amount of 0.9% w/v saline containing 4% v/v filter-sterilized pig serum.
Blood and Tissue Collection
Venous blood samples were collected immediately before feeding (0 min), and at 30, 60, 90, and 120 min for later determination of circulating plasma insulin concentrations. Plasma was collected by centrifugation at 10,000 g for 2 min and frozen at −20°C until analysis. Following euthanasia at 120 min (Beuthanasia-D, 0.45 mL·kg−1 i.v.; Merck Animal Health, Kenilworth, NJ), tissue aliquots were collected from the longissimus dorsi (LD), gastrocnemius, diaphragm, heart, liver, lung, and brain. Tissues were immediately snap-frozen in liquid nitrogen and stored at −80°C until analysis.
Plasma Insulin
Plasma insulin concentrations were determined with a porcine insulin radioimmunoassay kit (MilliporeSigma, Burlington, MA). Interassay CV for plasma insulin standards was 14.2%. Insulin concentration was not analyzed in duplicate owing to the limited permissible volume of blood that could be taken from piglets during sampling; thus, intra-assay CV could not be calculated.
Tissue Protein Synthesis
Fractional rates of protein synthesis were measured with a flooding dose of l-[4-3H]-Phe (1.50 mmol Phe·kg−1, 0.5 mCi of l-[4-3H]-Phe·kg−1, American Radiolabeled Chemicals, St. Louis, MO) injected 30 min before euthanasia (27). At 5, 15, and 30 min after the flooding dose, venous blood samples were collected and stored at −20°C for measurement of free l-[4-3H]-Phe-specific radioactivity in the blood pool. The specific activities of the tissue homogenate supernatants (free Phe), tissue protein hydrolysates (protein-bound Phe), and blood supernatants were measured by HPLC using an anion exchange column (PA1 column; Thermo Fisher Scientific, Waltham, MA) (19). Radioactivity of the collected Phe fraction (containing l-[4-3H]-Phe) was measured with a liquid scintillation counter (Tri-Carb 2500TR, Packard Instrument, Meriden, CT) in Ultima Gold scintillation cocktail (Perkin Elmer, Waltham, MA). Fractional protein synthesis rate (FSR, %/d) in each tissue was calculated as:
where SAbound is the specific radioactivity of the tissue protein-bound Phe, SAfree is the average specific radioactivity of the tissue free Phe over the labeling period, 1,440 is the min-to-d conversion, and t is the duration of labeling (min) with l-[4-3H]-Phe. The average tissue free Phe-specific radioactivity over the labeling period was calculated from the measured final tissue value and corrected for the rate of decrease in plasma Phe-specific radioactivity determined from the blood collected at 5, 15, and 30 min after the injection of l-[4-3H]-Phe (21).
Protein Immunoblot Analysis
Tissue homogenates were subject to Western blot analysis as described previously (8, 28). Total protein abundance was normalized to glyceraldehyde 3-phosphate dehydrogenase (GAPDH; Cat. No. 60004-1-Ig, ProteinTech Group, Rosemont, IL) or vinculin (Cat. No. A302-534A, Bethyl Laboratories, Montgomery, TX) to adjust for variation in total loading. Phosphorylated protein abundance was normalized to the total abundance of the native protein after stripping the blots in stripping buffer (Pierce Biotechnology, Rockford, IL) and re-probing with corresponding nonphosphospecific antibodies. Western blots were performed with the following primary antibodies: phospho-4EBP1 (Cat. No. 9455, Cell Signaling Technology, Danvers, MA), total-4EBP1 Thr70 (Cat. No. A300-501A, Bethyl Laboratories), phospho-S6K1 Thr389 (Cat. No. MAB8963, R&D Systems, Minneapolis, MN), total S6K1 (Cat. No. 14485-1-AP, ProteinTech Group), phospho-rpS6 Ser235/236 (Cat. No. 2211, Cell Signaling Technology), phospho-rpS6 Ser240/244 (Cat. No. 2215, Cell Signaling Technology), total rpS6 (Cat. No. 2217, Cell Signaling Technology), phospho-v-Akt murine thymoma viral oncogene homolog (Akt) Ser473 (Cat. No. 9271, Cell Signaling Technology), total Akt (Cat. No. 9272, Cell Signaling Technology), phospho-tuberous sclerosis complex 2 (TSC2) Thr1462 (Cat. No. 3617, Cell Signaling Technology), total TSC2 (Cat. No. 3612, Cell Signaling Technology), phospho-AMP-activated protein kinase (AMPK) Thr172 (Cat. No. 2531, Cell Signaling Technology), total AMPK (Cat. No. 2531, Cell Signaling Technology), phospho-forkhead box O3 (FoxO3) Ser253 (Cat. No. 9466, Cell Signaling Technology), total FoxO3 (Cat. No. 2497, Cell Signaling Technology), microtubule-associated protein 1 A/1B light chain I/II (LC3-I/II; Cat. No. 4108, Cell Signaling Technology), Atrogin-1 (Cat. No. AP2041, EMC Biosciences, Versailles, KY), and muscle RING-finger protein-1 (MuRF1; Cat. No. AF5366, R&D Systems).
Quantification of eIF4E·eIF4G, mTOR·RagA, mTOR·RagC, mTOR·Rheb, and Sestrin2·GATOR2 Complexes
The eIF4E·eIF4G, mTOR·RagA, mTOR·RagC, mTOR·Rheb, and stress response protein 2 (Sestrin2)·GAP activity toward Rags 2 (GATOR2) complexes were immunoprecipitated as described previously (17, 20). The abundance of eIF4G (Cat. No. 07–1800, MilliporeSigma) was normalized to the abundance of eIF4E (Cat. No. 9742, Cell Signaling Technology) after immunoprecipitation with a monoclonal eIF4E antibody (gift of Dr. Leonard Jefferson, Pennsylvania State University College of Medicine, Hershey, PA). Following immunoprecipitation of mTORC1 with anti-Raptor (Cat. No. 2280, Cell Signaling Technology), the abundances of the mTOR·RagA, mTOR·RagC, and mTOR·Rheb complexes were determined by Western blot analysis of RagA (Cat. No. 4357, Cell Signaling Technology), RagC (Cat. No. 5466, Cell Signaling Technology), and Rheb (Cat. No. MAB3426, R&D Systems), respectively, and normalized to mTOR recovered in the immunoprecipitate (Cat. No. 2972, Cell Signaling Technology). Following immunoprecipitation of Sestrin2 with anti-Sestrin2 (Cat. No. 8487, Cell Signaling Technology), the abundance of the Sestrin2·GATOR2 complex was determined by Western blot analysis of meiosis regulator for oocyte development (Mios2, a GATOR2 subunit; Cat. No. 13557, Cell Signaling Technology), and normalized to Sestrin2 (Cat. No. 66297-1-Ig, ProteinTech Group) recovered in the immunoprecipitate.
Statistical analysis
The generalized linear mixed-model procedure of SAS software (version 9.4; SAS Institute, Cary, NC) was used to perform all statistical analyses. One-factor ANOVA was used to analyze differences in birth weight and body weight gain between preterm and term animals with gestational age at birth (GAB; PT or T) as the main effect. Two-factor ANOVA was used to analyze differences in tissue protein synthesis and signaling protein abundance or activation with GAB and STATE (type of clamp; i.e., FAST, INS, or AA) as the main effects. Concentrations of blood glucose, plasma insulin, and plasma BCAA were analyzed by three-factor ANOVA with GAB, STATE, and time as the main effects; time was included as a repeated measure. Individual pig was considered the experimental unit; pig and litter were included as random effects to account for the greater correlation among piglets within the same litter compared with piglets from different litters. The effect of sex as a covariate was not significant in any analysis and was excluded from the final statistical model. Means were compared using Tukey’s post hoc test. Data are presented as least-squares means ± SE. Differences among groups are considered significant at P ≤ 0.05 and trends at P ≤ 0.10.
RESULTS
Birth Weight and Body Weight Gain
The birth weight of PT pigs (n = 25; 1,029 ± 93 g) tended to be lower than the birth weight of T pigs (n = 26; 1,392 ± 107 g; P = 0.07). The fractional rate of body weight gain was 32% lower in PT pigs (37.0 ± 2.3 g·kg−1·day−1) than in T pigs (54.3 ± 2.3 g·kg−1·day−1) despite the parenteral provision of equivalent nutrients relative to body weight (P < 0.01).
Blood Glucose, Plasma Insulin, and Plasma BCAA Concentrations
Following a 4.5-h fast, PT and T pigs remained fasting or were infused with insulin or an amino acid solution to achieve plasma concentrations that mimicked postprandial concentrations observed previously in pigs fed an elemental meal (22), i.e., ∼100 μU·mL−1 insulin and 1,000 μmol·L−1 BCAA. Over the period between 30 and 120 min of the clamp procedure, fasting plasma insulin concentration was maintained at 2.2 μU·mL−1 on average in the FAST and AA groups, and fasting plasma BCAA concentration was maintained at 308 μmol·L−1 on average in the FAST and INS groups. A minimal amount of amino acids was provided to some hyperinsulinemic pigs to prevent plasma BCAA concentrations from falling below fasting levels (29). Fasting blood glucose concentrations tended to be 15% lower in PT than in T pigs (48.7 vs. 57.5 mg·dL−1 in PT and T pigs, respectively; GAB, P = 0.09; Fig. 1A). Between 30 and 120 min of the clamp procedure, blood glucose, plasma insulin, and plasma BCAA concentrations were maintained between 90% and 110% of the targeted value for each individual pig. Blood glucose was maintained with an average of 51.0 and 58.8 mg·dL−1 in PT and T pigs, respectively. These blood glucose levels, while low, reflect fasting levels during the clamp procedure only and do not reflect levels during parenteral feeding (i.e., from birth to the onset of fasting before the clamp procedure was initiated). Targeted plasma insulin concentrations were attained in the PT-INS and T-INS groups (∼112 μU·mL−1; Fig. 1B), and there was no difference in insulin levels between PT and T pigs within the FAST, INS, or AA groups. Targeted plasma BCAA concentrations were also attained in the PT-AA and T-AA groups (∼1,050 μmol·L−1; Fig. 1C), and there was no difference in BCAA levels between PT and T pigs within the FAST, INS, or AA groups.
Figure 1.

Blood glucose (A), plasma insulin (B), and plasma BCAA (C) concentrations during euinsulinemic-euaminoacidemic-euglycemic (FAST), hyperinsulinemic-euaminoacidemic-euglycemic (INS), and euinsulinemic-hyperaminoacidemic-euglycemic (AA) clamps in preterm (PT) and term (T) pigs. Data were analyzed by 3-factor ANOVA. Values are least-squares means ± SE; n = 7 (PT-FAST), 8 (T-FAST), or 9 (PT-INS, PT-AA, T-INS, and T-AA). BCAA, branched-chain amino acid; PT-FAST, preterm fasting; T-FAST, term fasting; PT-INS, preterm insulin; PT-AA, preterm amino acid; T-INS, term insulin; T-AA, term amino acid.
Insulin and Amino Acid Signaling Pathway Activation, Translation Initiation Factor Activation, and Protein Synthesis Rate in LD Muscle
The abundances of GAPDH or vinculin were not different among treatment groups (data not shown). Among measured proteins involved in the insulin and amino acid signaling pathways and translation initiation factor activation, there was no difference in total protein abundance between PT and T groups (data not shown).
Despite attaining similar plasma insulin levels, insulin-induced phosphorylation of Akt was 41% lower in PT compared with T pigs (Fig. 2A; P < 0.01). Akt phosphorylation did not differ between the FAST groups and did not increase in the AA groups. The phosphorylation of TSC2 at Thr1462 was similarly reduced by 41% in the PT-INS compared with that in the T-INS group (Fig. 2B; P < 0.01), with no difference among the FAST and AA groups. The abundance of mTOR·Rheb was increased in both the INS and AA groups compared with that in the FAST group, regardless of gestational age (Fig. 2C; P < 0.01). The abundance of mTOR·Rheb was 40% lower in PT-INS than in T-INS pigs (P < 0.05); however, mTOR·Rheb abundance was not different among the PT-INS, PT-AA, and T-AA groups. The abundance of the inhibitory Sestrin2·GATOR2 complex was reduced in both PT and T pigs upon amino acid stimulation, with no effect of gestational age (Fig. 2D; P < 0.01). Amino acid-induced dissociation of Sestrin2 from GATOR2 was similar among the FAST and INS groups. Despite the absence of an effect of prematurity on Sestrin2·GATOR2 abundance, the amino acid-induced association of mTOR with RagA was 26% lower in the PT-AA than in the T-AA group (P = 0.05; Fig. 2E), and the association of mTOR with RagC tended to be 25% lower in the PT-AA than in the T-AA group (P = 0.10; Fig. 2F). There was no difference in mTOR·RagA or mTOR·RagC abundance among the PT-FAST, PT-INS, T-FAST, and T-INS groups. Also, there was no difference in AMPK phosphorylation among treatment groups (data not shown).
Figure 2.

Relative abundance of phospho-Akt Ser473 (A), phospho-TSC2 Thr1462 (B), mTOR·Rheb complex (C), Sestrin2·GATOR2 complex (D), mTOR·RagA complex (E), and mTOR·RagC complex (F) in the longissimus dorsi (LD) muscle during euinsulinemic-euaminoacidemic-euglycemic (FAST), hyperinsulinemic-euaminoacidemic-euglycemic (INS), and euinsulinemic-hyperaminoacidemic-euglycemic (AA) clamps in preterm (PT) and term (T) pigs. Representative immunoblots are shown for each treatment group. White lines between bands indicate where images from the same blots were spliced to adjust sample order on the membrane for presentation. Data were analyzed by 2-factor ANOVA. Values are least-squares means ± SE; n = 7 (PT-FAST), 8 (T-FAST), or 9 (PT-INS, PT-AA, T-INS, and T-AA) pigs. Means without a common superscript differ, P < 0.05. GATOR2, GAP activity toward Rags 2; mTOR, mechanistic target of rapamycin; p, phospho; PT-FAST, preterm fasting; T-FAST, term fasting; PT-INS, preterm insulin; PT-AA, preterm amino acid; T, total; T-INS, term insulin; T-AA, term amino acid.
Downstream readouts of mTORC1 activation in the LD muscle, including the phosphorylation of 4EBP1, S6K1, and rpS6 and the abundance of eIF4E·eIF4G, were similar between the PT-FAST and T-FAST groups (Fig. 3, A–D). Within PT or T pigs, 4EBP1 phosphorylation, S6K1 phosphorylation, rpS6 phosphorylation, and eIF4E·eIF4G abundance were increased to the same extent by both hyperinsulinemia and hyperaminoacidemia. However, 4EBP1 phosphorylation, rpS6 phosphorylation, and eIF4E·eIF4G abundance were ∼50% lower in the PT-INS and PT-AA groups than in the T-INS and T-AA groups, respectively (P < 0.01), whereas S6K1 phosphorylation was not different between the PT-INS and T-INS groups or the PT-AA and T-AA groups. The insulin- and amino acid-induced increase in LD muscle protein synthesis was diminished in PT compared with in T pigs, by 27% and 29%, respectively (Fig. 3E; P < 0.05). There were no differences in LD muscle FSR between the PT-FAST and T-FAST groups.
Figure 3.

Relative abundance of phospho-4EBP1 Thr70 (A), eIF4E·eIF4G complex (B), phospho-S6K1 Thr389 (C), phospho-rpS6 Ser235/236 and Ser240/244 (D), and fractional protein synthesis rate (FSR) in the longissimus dorsi (LD) muscle (E) during euinsulinemic-euaminoacidemic-euglycemic (FAST), hyperinsulinemic-euaminoacidemic-euglycemic (INS), and euinsulinemic-hyperaminoacidemic-euglycemic (AA) clamps in preterm (PT) and term (T) pigs. Representative immunoblots are shown for each treatment group. White lines between bands indicate where images from the same blots were spliced to adjust sample order on the membrane for presentation. Data were analyzed by 2-factor ANOVA. Values are least-squares means ± SE; n = 7 (PT-FAST), 8 (T-FAST), or 9 (PT-INS, PT-AA, T-INS, and T-AA) pigs. Means without a common superscript differ, P < 0.05. p, phospho; PT-FAST, preterm fasting; T, total; T-FAST, term fasting; PT-INS, preterm insulin; PT-AA, preterm amino acid; T-INS, term insulin; T-AA, term amino acid.
LD Muscle Protein Degradation Signaling Pathway Activation
The phosphorylation of FoxO3 was increased in the INS compared with the FAST and AA groups (Fig. 4A; P < 0.01), but there was no difference between PT and T pigs. FoxO3 phosphorylation was not different among the FAST and AA groups. There was no difference in the abundance of MuRF1 (Fig. 4B) or Atrogin-1 (Fig. 4C) among treatment groups. Hyperinsulinemia and hyperaminoacidemia decreased the LC3-II to total LC3 ratio formation to the same extent compared with the fasting groups in both PT and T pigs (Fig. 4D; P < 0.01). There was no effect of gestational age at birth on the LC3-II to total LC3 ratio or total LC3 abundance (data not shown).
Figure 4.

Relative abundance of phospho-FoxO3 Ser253 (A), total MuRF1 (B), total Atrogin-1 (C), and LC3II: Total LC3 ratio (D) in the longissimus dorsi (LD) muscle during euinsulinemic-euaminoacidemic-euglycemic (FAST), hyperinsulinemic-euaminoacidemic-euglycemic (INS), and euinsulinemic-hyperaminoacidemic-euglycemic (AA) clamps in preterm (PT) and term (T) pigs. Representative immunoblots are shown for each treatment group. White lines between bands indicate where images from the same blots were spliced to adjust sample order on the membrane for presentation. Data were analyzed by 2-factor ANOVA. Values are least-squares means ± SE; n = 7 (PT-FAST), 8 (T-FAST), or 9 (PT-INS, PT-AA, T-INS, and T-AA) pigs. Means without a common superscript differ, P < 0.05. p, phospho; PT-FAST, preterm fasting; T, total; T-FAST, term fasting; PT-INS, preterm insulin; PT-AA, preterm amino acid; T-INS, term insulin; T-AA, term amino acid.
Translation Initiation Factor Activation and Protein Synthesis Rate in Gastrocnemius and Diaphragm Muscles
In the gastrocnemius muscle, insulin-induced Akt phosphorylation mirrored that of the LD muscle such that Akt phosphorylation was 36% lower in the PT-INS than in the T-INS group (P < 0.01), with no difference among the FAST and AA groups (Table 2). The insulin-induced increases in 4EBP1 phosphorylation, S6K1 phosphorylation, rpS6 phosphorylation, and eIF4E·eIF4G abundance were attenuated in PT compared with in T pigs (P < 0.01). The amino acid-induced increases in S6K1 phosphorylation, rpS6 phosphorylation, and eIF4E·eIF4G abundance were blunted in PT compared with in T pigs (P < 0.01), whereas 4EBP1 phosphorylation, although lower numerically in PT than in T pigs (−53%) upon amino acid stimulation, was not significantly different. Although gastrocnemius protein synthesis was 22% lower in the PT-INS than in the T-INS group (P < 0.05), the 12% reduction in amino acid-induced protein synthesis in the PT-AA group was not significantly lower than in the T-AA group. In the diaphragm, insulin-induced Akt phosphorylation was not different between PT and T pigs. Insulin- and amino acid-induced 4EBP1 phosphorylation, S6K1 phosphorylation, rpS6 phosphorylation, eIF4E·eIF4G abundance, and protein synthesis in the diaphragm were not different among the PT-INS, PT-AA, T-INS, and T-AA groups. The total abundance of Akt, 4EBP1, and S6K1 was not affected by gestational age in the gastrocnemius and diaphragm muscles (data not shown).
Table 2.
Fractional protein synthesis rate (%/d) and relative abundance of activated signaling proteins (AU) in tissues of preterm and term pigs during euinsulinemic-euaminoacidemic-euglycemic, hyperinsulinemic-euaminoacidemic-euglycemic, or euinsulinemic-hyperaminoacidemic-euglycemic clamps
| Preterm |
Term |
P Value |
|||||||
|---|---|---|---|---|---|---|---|---|---|
| Tissue | FAST | INS | AA | FAST | INS | AA | GAB | STATE | GAB × STATE |
| Gastrocnemius | |||||||||
| FSR | 16.1 ± 1.4c | 23.3 ± 1.3b | 25.7 ± 1.3ab | 16.8 ± 1.5c | 30.0 ± 1.4a | 28.9 ± 1.4ab | 0.15 | < 0.001 | 0.011 |
| p-Akt | 0.03 ± 0.05c | 0.46 ± 0.04b | 0.04 ± 0.04c | 0.04 ± 0.05c | 0.72 ± 0.04a | 0.04 ± 0.04c | 0.018 | < 0.001 | 0.009 |
| p-4EBP1 | 0.12 ± 0.16c | 0.52 ± 0.14bc | 0.54 ± 0.14bc | 0.10 ± 0.15c | 1.31 ± 0.14a | 1.01 ± 0.14ab | 0.001 | < 0.001 | 0.035 |
| eIF4E·eIF4G | 0.14 ± 0.18c | 1.35 ± 0.16b | 1.48 ± 0.16b | 0.12 ± 0.17c | 2.60 ± 0.16a | 2.45 ± 0.16a | < 0.001 | < 0.001 | 0.001 |
| p-S6K1 | 0.06 ± 0.05c | 0.41 ± 0.05b | 0.38 ± 0.05b | 0.07 ± 0.05c | 0.70 ± 0.05a | 0.66 ± 0.05a | 0.031 | < 0.001 | 0.002 |
| p-rpS6 | 0.04 ± 0.08c | 0.59 ± 0.07b | 0.56 ± 0.07b | 0.04 ± 0.07c | 0.95 ± 0.07a | 0.94 ± 0.07a | 0.031 | < 0.001 | 0.011 |
| Diaphragm | |||||||||
| FSR | 15.1 ± 1.5b | 22.2 ± 1.3a | 22.5 ± 1.3a | 13.9 ± 1.4b | 22.4 ± 1.3a | 23.4 ± 1.3a | 0.95 | < 0.001 | 0.73 |
| p-Akt | 0.14 ± 0.11b | 1.43 ± 0.10a | 0.11 ± 0.11b | 0.18 ± 0.12b | 1.34 ± 0.11a | 0.14 ± 0.11b | 0.95 | < 0.001 | 0.70 |
| p-4EBP1 | 0.15 ± 0.08b | 0.85 ± 0.07a | 0.83 ± 0.07a | 0.10 ± 0.08b | 0.86 ± 0.07a | 0.80 ± 0.07a | 0.77 | < 0.001 | 0.89 |
| eIF4E·eIF4G | 0.15 ± 0.23b | 2.07 ± 0.20a | 2.01 ± 0.20a | 0.13 ± 0.21b | 2.37 ± 0.20a | 2.26 ± 0.20a | 0.29 | < 0.001 | 0.73 |
| p-S6K1 | 0.09 ± 0.11b | 0.89 ± 0.10a | 0.79 ± 0.10a | 0.06 ± 0.11b | 0.78 ± 0.11a | 0.66 ± 0.11a | 0.54 | < 0.001 | 0.82 |
| p-rpS6 | 0.03 ± 0.11b | 0.97 ± 0.10a | 0.99 ± 0.10a | 0.02 ± 0.11b | 1.01 ± 0.10a | 0.94 ± 0.10a | 0.97 | < 0.001 | 0.86 |
| Heart | |||||||||
| FSR | 17.3 ± 1.1b | 22.5 ± 1.0a | 22.3 ± 1.0a | 16.0 ± 1.1b | 22.0 ± 1.0a | 23.5 ± 1.0a | 0.87 | < 0.001 | 0.35 |
| p-Akt | 0.07 ± 0.03b | 0.45 ± 0.03a | 0.07 ± 0.03b | 0.07 ± 0.03b | 0.51 ± 0.03a | 0.08 ± 0.03b | 0.50 | < 0.001 | 0.45 |
| p-4EBP1 | 0.12 ± 0.10c | 0.80 ± 0.09b | 1.01 ± 0.09ab | 0.13 ± 0.10c | 0.95 ± 0.09ab | 1.21 ± 0.09a | 0.13 | < 0.001 | 0.60 |
| p-S6K1 | 0.10 ± 0.07b | 0.56 ± 0.06a | 0.64 ± 0.06a | 0.10 ± 0.07b | 0.64 ± 0.07a | 0.75 ± 0.07a | 0.46 | < 0.001 | 0.54 |
| Lung | |||||||||
| FSR | 20.8 ± 1.1b | 30.1 ± 1.0a | 28.1 ± 1.1a | 22.0 ± 1.1b | 27.3 ± 1.1a | 26.4 ± 1.1a | 0.42 | < 0.001 | 0.12 |
| p-Akt | 0.09 ± 0.06b | 0.74 ± 0.05a | 0.08 ± 0.05b | 0.11 ± 0.06b | 0.72 ± 0.05a | 0.11 ± 0.05b | 0.89 | < 0.001 | 0.88 |
| p-4EBP1 | 0.08 ± 0.06b | 0.77 ± 0.06a | 0.66 ± 0.06a | 0.10 ± 0.06b | 0.66 ± 0.06a | 0.58 ± 0.06a | 0.41 | < 0.001 | 0.48 |
| p-S6K1 | 0.08 ± 0.08b | 0.95 ± 0.07a | 0.77 ± 0.07a | 0.09 ± 0.08b | 0.88 ± 0.07a | 0.73 ± 0.07a | 0.57 | < 0.001 | 0.90 |
| Liver | |||||||||
| FSR | 64.6 ± 1.4c | 67.6 ± 1.3c | 77.1 ± 1.3a | 57.7 ± 1.4d | 69.6 ± 1.4bc | 73.4 ± 1.3ab | 0.012 | < 0.001 | 0.007 |
| p-Akt | 0.13 ± 0.06b | 0.73 ± 0.05a | 0.11 ± 0.05b | 0.12 ± 0.06b | 0.76 ± 0.05a | 0.12 ± 0.05b | 0.89 | < 0.001 | 0.88 |
| p-4EBP1 | 0.09 ± 0.05b | 0.50 ± 0.05a | 0.79 ± 0.05a | 0.11 ± 0.05b | 0.52 ± 0.05a | 0.60 ± 0.05a | 0.35 | < 0.001 | 0.043 |
| p-S6K1 | 0.13 ± 0.08b | 0.63 ± 0.08a | 0.87 ± 0.08a | 0.14 ± 0.09b | 0.66 ± 0.08a | 0.75 ± 0.08a | 0.78 | < 0.001 | 0.28 |
| Brain | |||||||||
| FSR | 11.6 ± 1.0 | 13.2 ± 0.9 | 13.4 ± 0.9 | 13.3 ± 0.9 | 13.8 ± 0.9 | 15.6 ± 0.9 | 0.053 | 0.088 | 0.63 |
| p-Akt | 0.56 ± 0.10 | 0.59 ± 0.09 | 0.55 ± 0.09 | 0.60 ± 0.10 | 0.53 ± 0.10 | 0.61 ± 0.10 | 0.91 | 0.95 | 0.65 |
| p-4EBP1 | 0.48 ± 0.08 | 0.56 ± 0.07 | 0.50 ± 0.07 | 0.52 ± 0.08 | 0.49 ± 0.07 | 0.52 ± 0.07 | 0.91 | 0.93 | 0.74 |
| p-S6K1 | 0.47 ± 0.08 | 0.49 ± 0.07 | 0.48 ± 0.07 | 0.54 ± 0.08 | 0.51 ± 0.08 | 0.55 ± 0.08 | 0.49 | 0.98 | 0.93 |
Data were analyzed by 2-factor ANOVA. Values are least-square means ± SE calculated from two-factor ANOVA, n = 7 (PT-FAST), 8 (T-FAST), or 9 (PT-INS, PT-AA, T-INS, and T-AA) pigs. Labeled means in a row without a common superscript letter differ, P < 0.05. AA, euinsulinemic-hyperaminoacidemic-euglycemic clamp; FAST, euinsulinemic-euaminoacidemic-euglycemic clamp; GAB, gestational age at birth; INS, hyperinsulinemic-euaminoacidemic-euglycemic clamp; FSR, fractional synthesis rate; STATE, clamp condition (i.e., FAST, INS, or AA). One sample for each heart (T-FAST), lung (T-AA), liver (T-INS), and brain (T-INS) are excluded from analysis due to technical error.
Translation Initiation Factor Activation and Protein Synthesis Rate in Heart, Lung, Liver, and Brain
In the heart and lung, 4EBP1 phosphorylation, S6K1 phosphorylation, and protein synthesis were increased above fasting levels with hyperinsulinemia and hyperaminoacidemia to the same extent in both PT and T pigs (P < 0.01; Table 2). In the liver, phosphorylation of Akt, 4EBP1, and S6K1 was greater in the PT-INS and T-INS groups than in the PT-FAST and T-FAST groups, respectively (P < 0.01); however, there was no difference in liver protein synthesis between the PT-INS and T-INS groups. This result contrasts with amino acids that promoted liver 4EBP1 and S6K1 phosphorylation and increased liver protein synthesis above fasting levels regardless of gestational age (P < 0.01). In the brain, translation initiation factor signaling did not differ among treatment groups. Brain protein synthesis tended to be 10% lower in PT than in T pigs (P = 0.053). The total abundance of Akt, 4EBP1, or S6K1 was not affected by gestational age in the heart, lung, liver, and brain (data not shown).
Glucose and Amino Acid Disposal Rates
Whole body net glucose and amino acid disposal rates were calculated from the infusion rate of either glucose or amino acids during the last 60 min of infusion. Whole body glucose disposal was not different among the PT-FAST, T-FAST, PT-AA, and T-AA groups and was lower in these groups than in the INS group (P < 0.01). Whole body glucose disposal was 88% greater in PT-INS than in T-INS groups (Fig. 5A; P < 0.01). Whole body amino acid disposal was low and not different between PT-FAST and T-FAST groups (Fig. 5B). Although whole body amino acid disposal was greater in the INS than in the FAST groups (P < 0.01), there was no difference between PT and T pigs. Whole body amino acid disposal was 33% lower in PT-AA than in T-AA pigs (P < 0.01).
Figure 5.

Whole body net glucose (A) and amino acid (B) disposal rates during euinsulinemic-euaminoacidemic-euglycemic (FAST), hyperinsulinemic-euaminoacidemic-euglycemic (INS), and euinsulinemic-hyperaminoacidemic-euglycemic (AA) clamps in preterm (PT) and term (T) pigs. Glucose disposal rate was calculated as the average glucose infusion rate needed to maintain blood glucose at fasting levels for the last 60 min of the clamp procedure; amino acid disposal rate was calculated as the average infusion rate of total amino acids needed to maintain plasma branched-chain amino acid concentrations at targeted fasting or fed levels for the last hour of the clamp procedure. Data were analyzed by 2-factor ANOVA. Values are least-squares means ± SE; n = 7 (PT-FAST), 8 (T-FAST), or 9 (PT-INS, PT-AA, T-INS, and T-AA) pigs. Means without a common superscript differ, P < 0.05. PT-FAST, preterm fasting; T-FAST, term fasting; PT-INS, preterm insulin; PT-AA, preterm amino acid; T-INS, term insulin; T-AA, term amino acid.
DISCUSSION
Premature infants often exhibit postnatal growth faltering, especially of lean mass (30, 31), that may contribute to their greater lifelong risk for developing metabolic and cardiovascular disease (4, 32). Previously, we reported that prematurity blunts the anabolic response to feeding in skeletal muscle of neonatal pigs (22). However, the postprandial increases in glucose, insulin, and amino acids following an elemental meal were slower in preterm than in term pigs, even though relative nutrient intake was equivalent between groups. Because the insulin- and amino acid-induced activation of the intracellular signaling pathways that activate mTORC1 was measured at only one point in time, at euthanasia, the activation of these pathways could in part reflect the differences in the profile of circulating insulin and amino acids between feeding and euthanasia. To discern the extent to which differences in the responsiveness of the insulin and amino acid signaling pathways in skeletal muscle contribute to the blunting of translation initiation and protein synthesis with prematurity, we performed hyperinsulinemic-euaminoacidemic-euglycemic and euinsulinemic-hyperaminoacidemic-euglycemic clamps.
The clamp procedures were performed as reported previously (12), with the exception that plasma insulin was raised to 100 μU·mL−1 in hyperinsulinemic pigs to match the postprandial insulin levels in pigs fed an elemental meal (22). The BCAA levels achieved in this study were based on previous clamp studies in term pigs in which we found a linear increase in skeletal muscle protein synthesis that did not plateau when plasma BCAA concentration was increased from ∼250 to 1,000 μmol·L−1. In preterm pigs fed an elemental meal, BCAA increased to ∼800 μmol·L−1 (22). Thus, the targeted plasma insulin and amino acid concentrations were sufficient for both PT and T pigs to maximize skeletal muscle protein synthesis in response to either insulin or amino acid stimulation alone. Steady state concentrations were maintained for 90 min before tissue collection to ensure full activation of the relevant signaling pathways and metabolic processes.
Regulation of mTORC1 Activation and Tissue Protein Synthesis by Insulin or Amino Acids
The protein synthesis responses of the LD and gastrocnemius muscles to separate increases in plasma insulin or amino acids indicate that prematurity confers resistance to the anabolic functions of insulin and amino acids. Fasting rates of protein synthesis, however, were similar for PT and T pigs, suggesting that the determinants of basal muscle protein synthesis are not affected by gestational age. These data indicate, therefore, that the response we had observed previously following a complete enteral meal were due to characteristics of premature muscle and not slower rise in insulin and amino acids after a meal (22). To identify the signaling pathways that are impaired by prematurity, we evaluated the activation of key signaling molecules that regulate translation initiation following the substrate clamps. Insulin and specific amino acids engage separate signaling pathways that converge to promote mTORC1 activation. Downstream of mTORC1, phosphorylation of 4EBP1, S6K1, rpS6, and eIF4E·eIF4G complex abundance in general was lower in PT than in T pigs and paralleled the gestational age-related pattern in protein synthesis. There were some deviations between the responses of the LD and gastrocnemius, such as the levels of S6K1 phosphorylation in the LD and 4EBP1 phosphorylation in the gastrocnemius. However, these deviations likely reflect technical variability we encountered in these outcomes that precluded statistical significance rather than biologically different responses, as indicated both numerically and by the downstream response of their target molecules (rpS6 and eIF4E·eIF4G, respectively). Thus, the similar attenuation in the response to either hyperinsulinemia or hyperaminoacidemia in both muscles of preterm pigs suggests that mTORC1 activation was impaired by prematurity and responsible for the lower protein synthesis rates in skeletal muscle.
To determine the nature of the impediment, we evaluated the response of key molecules that communicate changes in extracellular insulin or amino acids to mTORC1. In the present study, the insulin-induced increase in Akt phosphorylation was blunted by prematurity in the LD muscle. Previously, we demonstrated that perturbed insulin signaling in preterm pigs following a meal was not due to proximal defects in insulin receptor (IR)-β abundance, IR-β phosphorylation (Tyr1185), insulin receptor substrate (IRS)-1 phosphorylation, or phosphatidylinositol 3-kinase (P13K) recruitment to IRS-1. Instead, factors downstream of PI3K and upstream of Akt were likely responsible (22). Similar observations to ours have been reported for skeletal muscle of preterm compared with term baboons, in which insulin-induced Akt phosphorylation was blunted, whereas IR-β abundance and phosphorylation and IRS-1 phosphorylation were unaffected by gestational age at birth (33). The reduced phosphorylation of Akt with hyperinsulinemia we observed in PT compared with T pigs was mirrored by TSC2 phosphorylation, mTOR·Rheb abundance, and, accordingly, mTORC1 activation (34). Hyperaminoacidemia alone did not affect the insulin signaling pathway. These data confirm that the anabolic effect of insulin is blunted by prematurity and corroborates our feeding data that suggest a reduced capacity to transmit the insulin signal at the level of Akt.
Amino acids, including leucine, also promote mTORC1 activation by directing mTOR to the lysosomal membrane through its association with RagA/B and RagC/D, heterodimeric proteins with GTPase activity that are tethered to the lysosome through the Ragulator complex (35). With the correct nucleotide configuration, activated Rag proteins interact with Raptor, a component of mTORC1, and recruit mTOR to the lysosomal membrane where it can be activated by Rheb (36). In this study, we found that hyperaminoacidemia increased mTOR-bound RagA and RagC compared with fasting levels, but this increase was blunted by prematurity. This implies that the release of the Rag proteins from inhibition by the GATOR1 complex is not as efficient in premature muscle. Upstream of GATOR1, GATOR2 antagonizes GATOR1 function and promotes mTORC1 activity. However, the interaction between GATOR1 and GATOR2 requires that GATOR2 is released from the inhibitory complex it forms with specific amino acid sensors, including Sestrins (37).To evaluate if the effect of prematurity on the Rag proteins is a consequence of deficient amino acid sensing, we measured the association between Sestrin2 and GATOR2, which is disrupted when intracellular leucine levels are not limiting (38). We observed that the Sestrin2·GATOR2 complex abundance was similar under fasting conditions regardless of gestational age and diminished with hyperaminoacidemia to the same extent in PT and T muscles. This response is consistent with our previous findings in which the degree of dissociation of the Sestrin2·GATOR2 complex in response to feeding was not different between muscle of PT and T pigs (22). Taken together, these data point to a limitation in the activation of the Rag proteins in the premature muscle in response to hyperaminoacidemia. This would include differences in other factors that regulate the GTP loading state of the Rag proteins. For example, other regulators of GATOR1, such as KICSTOR, could affect GTP loading of RagA/B (39), whereas prematurity could affect the GTPase-activating protein activity of folliculin and its binding partners, reducing GDP loading of RagC/D and, thus, mTOR recruitment to the lysosome (40).
Isolating the effects of insulin and amino acids using the clamp technique reveals that they contribute separately to the effect of feeding on the interaction between mTORC1 and Rheb. Previously, we reported that less mTOR·Rheb complex abundance was detected in the LD muscle of premature compared with term-born pigs fed an elemental meal, but at both gestational ages it was increased compared with fasting levels (22). The pattern in mTOR·Rheb complex abundance was also reflected in the response of downstream targets of mTORC1 and in protein synthesis rates. The data from the current study suggest that these differences are largely indicative of the difference in insulin signaling. However, in previous studies, we observed that amino acids alone promote mTOR·Rheb complex formation, albeit to a lesser extent than insulin (17), and that this response is independent of TSC2 phosphorylation (8). Nonetheless, the amino acid-induced activation of mTORC1 and its downstream targets were similar to the response to insulin, suggesting that the abundance of the mTOR·Rheb complex may not necessarily correlate with mTOR kinase activity in vivo (41).
The diaphragm and heart did not display the same effects of prematurity observed in the LD and gastrocnemius muscles. This likely reflects the precocious maturation of these tissues which ensures that they have the functionality necessary for survival immediately after birth. In the rat, maturation of the contractile proteins and the metabolic capacity of the diaphragm are temporally correlated and precede those that occur postnatally in the axial and limb muscles (42). Like the diaphragm, the heart undergoes profound morphological, metabolic, and functional changes in late gestation that prepare it for the increased workload that occurs after birth (43). The distinction between these muscles and the LD and gastrocnemius in their responses to insulin and amino acids in PT versus T pigs suggests that developmental regulation of the signaling pathways that control the protein anabolic response in skeletal muscle is linked to the control of the overall maturation of the tissue.
Regulation of Skeletal Muscle Protein Degradation
The autophagy-lysosome and ubiquitin-proteasome systems are key pathways that regulate protein degradation in skeletal muscle. Among these proteolytic systems, the autophagy-lysosome system degrades the bulk of cytoplasmic proteins and is more sensitive to hormone and nutrient status than the ubiquitin-proteasome system in term neonatal pigs (44). In the current study, both insulin and amino acids decreased the LC3-II to total LC3 ratio, an index of autophagy, in PT and T pigs in LD muscle, but there was no independent effect of prematurity. Unc-51 like autophagy activating kinase 1 (ULK1) is a key upstream activator of LC3 and is subject to phosphorylation and inhibition by mTORC1 (45). The results of this study suggest that ULK1 inhibition, and thus LC3 activation, is less sensitive to the degree of mTORC1 activation in comparison to the translation initiation factors. This is consistent with our previous report which indicated that skeletal muscle protein accretion in neonatal pigs is fine-tuned at the level of translation initiation and protein synthesis and not at the level of protein degradation (46). The abundance of Atrogin-1 and MuRF1, muscle-specific ubiquitin protein ligases that tag sarcomeric proteins for degradation, is subject to transcriptional regulation by the FoxO family of transcription factors (47). Although insulin promoted FoxO3 phosphorylation in LD muscle in both preterm and term pigs, we did not identify any differences in the abundance of Atrogin-1 and MuRF1 among treatment groups. It is possible that the interval between a reduction in FoxO3-mediated transcription of Atrogin-1 and MuRF1 and corresponding change in translation exceeded the duration of hyperinsulinemic conditions and precluded identification of a response. However, this is unlikely because alterations in Atrogin-1 and MuRF1 abundance in neonatal pigs occur almost exclusively in catabolic states (44, 48).
Regulation of Protein Synthesis by Insulin or Amino Acids in Other Organs
Similar to the diaphragm, the activation of mTORC1 and protein synthesis in the lung was not affected by prematurity and was equally responsive to stimulation by insulin and amino acids, reflecting that the lung, like the diaphragm, is at a more advanced stage of maturation at this age (22, 49). Among other organs, liver protein synthesis increased upon amino acid, but not insulin, stimulation in PT pigs. This agrees with previous studies in neonatal pigs, suggesting that there is no apparent resistance in the preterm liver to amino acids, and further underlines a key role for amino acids in regulating protein synthesis in the neonatal liver (12). Brain protein synthesis, but not mTORC1 activation, was marginally lower with prematurity. Although it is unclear whether this discrepancy has long-term neurodevelopmental sequelae, reductions in brain protein synthesis have been linked to learning and memory deficits in animal models (50) and parallels the cognitive and motor function delays often exhibited in pigs and human infants born preterm (51, 52).
Helman et al. (53) recently characterized the transition from amino acid- to glucose-stimulated insulin secretion in neonatal pancreatic β-cells. This transition is driven by a change in substrate supply from amino acids in utero to glucose postnatally and by a change in substrate supply pattern from continuous to intermittent. Our observations suggest that the transition from intrauterine to postnatal regulation of pancreatic function does not translate to skeletal muscle as it would predict greater mTORC1 signaling in response to amino acids than insulin in pigs born preterm, and vice versa in pigs born at term. However, the response to both substrates was equally affected in the premature muscle. We have also reported previously that skeletal muscle is equally sensitive to insulin and amino acids in pigs born at term (54). An additional consideration is whether the observed differences between PT and T pigs in the protein synthetic response of skeletal muscle to insulin or amino acids is a consequence of prematurity or immaturity. Specifically, it is unclear whether premature birth itself blunts skeletal muscle protein synthesis relative to the expected rate in utero or if the immature muscle is inherently less sensitive to the effects of amino acids and insulin on protein synthesis. In rats, protein synthesis in the heart, lung, liver, kidney, and whole body protein synthesis, which includes skeletal muscle, declines over late gestation (55, 56). We also documented a reduction in hindlimb skeletal muscle protein synthesis of 50% in fetal rats from just before birth to six days of age (57, 58). Thus, if the difference between PT and T groups was due to immaturity, we would predict that skeletal muscle protein synthesis would be greater in PT than in T pigs. However, the lower skeletal muscle protein synthesis in PT than in T pigs is contrary to the general declining trend of protein synthesis rates over gestation. Our results suggest, therefore, that premature birth independently perturbs skeletal muscle protein synthesis in neonates.
Whole Body Glucose and Amino Acid Disposal
Basal glucose disposal (i.e., in the FAST and AA groups), while not statistically different, was almost threefold greater in PT compared with T pigs. This may in part reflect a greater contribution of the relatively larger brain, an obligate glucose consumer (59), to glucose utilization in preterm neonates and is consistent with the lower fasting blood glucose concentration in prematurely born pigs observed in this and other studies (51, 60). Whole body glucose disposal increased with insulin in both PT and T pigs, but in PT pigs this exceeded the rate in T pigs by 88%. For comparison, the glucose infusion rate needed to maintain euglycemia during hyperinsulinemic conditions in premature human infants was 80% greater than for to healthy adults (term infants were not studied) despite lower plasma insulin concentrations and greater endogenous glucose production in the preterm subjects (61). The higher rate of whole body glucose disposal in PT than in T pigs may also reflect the continued preference of fetal tissue for glucose as an oxidative substrate following preterm birth that persists postnatally (62). This possibility is supported by respiratory quotient measurements in preterm compared with term human infants as well as values in newborns immediately following birth (63, 64). However, insulin-stimulated whole body glucose disposal in preterm baboons was 42% lower compared with term baboons (33). The mechanism that underpins the discrepancy in insulin-induced whole body glucose disposal between these animal models is not readily apparent.
Insulin-stimulated whole body amino acid disposal declines after birth in neonatal pigs born at term and corresponds to the age-related decline in whole body and skeletal muscle protein synthesis (26). In this study, insulin-stimulated amino acid disposal was similar between PT and T pigs. Although this appears to conflict with the apparent resistance of premature skeletal muscle to insulin-induced protein synthesis, the discrepancy could be due to greater insulin-induced amino acid oxidation in preterm than in term neonates. Such a response to insulin has been reported in late gestation fetal sheep, in which insulin promotes amino acid utilization by both oxidative and non oxidative pathways (65). Our observations suggest this fetal response may be dependent on developmental age and, therefore, persists after preterm birth. Conversely, amino acid-induced whole body amino acid disposal was lower in than in T pigs, a response that reflects the lower rates of skeletal muscle protein synthesis in PT pigs in response to amino acid stimulation.
Perspectives and Significance
In summary, we showed that mTORC1 signaling and protein synthesis in skeletal muscle are blunted in response to equivalent increases in both insulin and amino acids in PT compared with T pigs. This effect, however, is modulated by stage of maturity of the muscle and is less evident in the diaphragm and heart. This is consistent with the response we observed in skeletal muscle protein synthesis after feeding an elemental meal in preterm compared with pigs born at term (22, 66). Taken together, the results suggest that preterm birth reduces the anabolic response to feeding by blunting both the insulin- and amino acid-induced activation of mTORC1-dependent translation initiation and protein synthesis in skeletal muscle and this likely contributes to the reduced accretion of lean mass (6) and extrauterine growth restriction (30, 31) of premature infants. Our results demonstrating impaired propagation of the insulin and amino acid signaling pathways that activate mTORC1 also imply that the lower accretion of lean mass in infants born prematurely is unlikely to be overcome by simply increasing nutrient intake. Reductions in skeletal muscle mass in particular may have a profound effect on the risk for developing metabolic and cardiovascular disease (32, 67). Because prematurity is associated with lifelong increases in fat mass (4), identifying strategies to promote lean growth while restricting adiposity in these infants is vital to mitigate these poor health outcomes. Future studies are needed to identify the underlying mechanisms that explain muscle anabolic resistance in premature neonates, with a focus on the insulin and amino acid signaling pathways upstream of mTORC1, to identify interventions to overcome or circumvent the impairment, and to address if anabolic resistance in muscle persists in postnatal life.
GRANTS
This work was supported by the National Institute of Child Health and Human Development Grants HD-085573, HD-072891, HD-099080, USDA Current Research Information System Grant 3092-51000-060, and USDA National Institute of Food and Agriculture Grant 2013-67015-20438.
DISCLAIMERS
This work is a publication of the USDA/ARS Children’s Nutrition Research Center, Department of Pediatrics, Baylor College of Medicine. The contents of this publication do not necessarily reflect the views or policies of the USDA and neither does the mention of trade names, commercial products, or organizations imply endorsement by the US Government.
DISCLOSURES
No conflicts of interest, financial or otherwise, are declared by the authors.
AUTHOR CONTRIBUTIONS
D.G.B., M.L.F., and T.A.D. conceived and designed the research; M.R., J.K.N., A.S., H.V.N., B.S., C.C.S., M.A.V., O.O.O., and T.A.D. performed experiments; M.R., J.K.N., A.S., H.V.N., and T.A.D. analyzed data; M.R., J.K.N., A.S., M.L.F., and T.A.D interpreted results of experiments; M.R. prepared figures; M.R., J.K.N., and T.A.D. drafted manuscript; J.K.N., A.S., D.G.B., M.L.F., and T.A.D. edited and revised manuscript; M.R., J.K.N., A.S., H.V.N., B.S., C.C.S., M.A.V., O.O.O., D.G.B., M.L.F., and T.A.D. approved final version of manuscript.
ACKNOWLEDGMENTS
We thank R. D. Parada for technical assistance, S. Musaad for statistical assistance, and the staff of the Comparative Nutrition Research Facility for animal care.
REFERENCES
- 1.Hamilton BE, Martin JA, Osterman MJK, Rossen LM. Births: provisional data for 2018. Vital Statistics Rapid Release; no. 7. Hyattsville, MD: National Center for Health Statistics, 2019. [Google Scholar]
- 2.Hofman PL, Regan F, Harris M, Robinson E, Jackson W, Cutfield WS. The metabolic consequences of prematurity. Growth Horm IGF Res 14: S136–139, 2004. doi: 10.1016/j.ghir.2004.03.029. [DOI] [PubMed] [Google Scholar]
- 3.Hofman PL, Regan F, Jackson WE, Jefferies C, Knight DB, Robinson EM, Cutfield WS. Premature birth and later insulin resistance. N Engl J Med 351: 2179–2186, 2004. doi: 10.1056/NEJMoa042275. [DOI] [PubMed] [Google Scholar]
- 4.Markopoulou P, Papanikolaou E, Analytis A, Zoumakis E, Siahanidou T. Preterm birth as a risk factor for metabolic syndrome and cardiovascular disease in adult life: a systematic review and meta-analysis. J Pediatr 210: 69–80.e65, 2019. doi: 10.1016/j.jpeds.2019.02.041. [DOI] [PubMed] [Google Scholar]
- 5.Davis TA, Fiorotto ML. Regulation of muscle growth in neonates. Curr Opin Clin Nutr Metab Care 12: 78–85, 2009. doi: 10.1097/MCO.0b013e32831cef9f. [DOI] [PMC free article] [PubMed] [Google Scholar]
- 6.Johnson MJ, Wootton SA, Leaf AA, Jackson AA. Preterm birth and body composition at term equivalent age: a systematic review and meta-analysis. Pediatrics 130: e640–e649, 2012. doi: 10.1542/peds.2011-3379. [DOI] [PubMed] [Google Scholar]
- 7.Hay WW, Jr. Aggressive nutrition of the preterm infant. Curr Pediatr Rep 1: 229–239, 2013. doi: 10.1007/s40124-013-0026-4. [DOI] [PMC free article] [PubMed] [Google Scholar]
- 8.Suryawan A, Orellana RA, Nguyen HV, Jeyapalan AS, Fleming JR, Davis TA. Activation by insulin and amino acids of signaling components leading to translation initiation in skeletal muscle of neonatal pigs is developmentally regulated. Am J Physiol Endocrinol Metab 293: E1597–E1605, 2007. doi: 10.1152/ajpendo.00307.2007. [DOI] [PMC free article] [PubMed] [Google Scholar]
- 9.Burrin D, Sangild PT, Stoll B, Thymann T, Buddington R, Marini J, Olutoye O, Shulman RJ. Translational advances in pediatric nutrition and gastroenterology: new insights from pig models. Annu Rev Anim Biosci 8: 321–354, 2020. doi: 10.1146/annurev-animal-020518-115142. [DOI] [PubMed] [Google Scholar]
- 10.Odle J, Lin X, Jacobi SK, Kim SW, Stahl CH. The suckling piglet as an agrimedical model for the study of pediatric nutrition and metabolism. Annu Rev Anim Biosci 2: 419–444, 2014. doi: 10.1146/annurev-animal-022513-114158. [DOI] [PubMed] [Google Scholar]
- 11.Sangild PT, Thymann T, Schmidt M, Stoll B, Burrin DG, Buddington RK. Invited review: the preterm pig as a model in pediatric gastroenterology. J Anim Sci 91: 4713–4729, 2013. doi: 10.2527/jas.2013-6359. [DOI] [PMC free article] [PubMed] [Google Scholar]
- 12.Davis TA, Fiorotto ML, Burrin DG, Reeds PJ, Nguyen HV, Beckett PR, Vann RC, O’Connor PM. Stimulation of protein synthesis by both insulin and amino acids is unique to skeletal muscle in neonatal pigs. Am J Physiol Endocrinol Metab 282: E880–E890, 2002. doi: 10.1152/ajpendo.00517.2001. [DOI] [PubMed] [Google Scholar]
- 13.Saxton RA, Sabatini DM. mTOR signaling in growth, metabolism, and disease. Cell 168: 960–976, 2017. [Erratum in Cell 169: 361–371, 2017]. doi: 10.1016/j.cell.2017.02.004. [DOI] [PMC free article] [PubMed] [Google Scholar]
- 14.Kimball SR. Regulation of global and specific mRNA translation by amino acids. J Nutr 132: 883–886, 2002. doi: 10.1093/jn/132.5.883. [DOI] [PubMed] [Google Scholar]
- 15.Chauvin C, Koka V, Nouschi A, Mieulet V, Hoareau-Aveilla C, Dreazen A, Cagnard N, Carpentier W, Kiss T, Meyuhas O, Pende M. Ribosomal protein S6 kinase activity controls the ribosome biogenesis transcriptional program. Oncogene 33: 474–483, 2014. doi: 10.1038/onc.2012.606. [DOI] [PubMed] [Google Scholar]
- 16.Hannan KM, Brandenburger Y, Jenkins A, Sharkey K, Cavanaugh A, Rothblum L, Moss T, Poortinga G, McArthur GA, Pearson RB, Hannan RD. mTOR-dependent regulation of ribosomal gene transcription requires S6K1 and is mediated by phosphorylation of the carboxy-terminal activation domain of the nucleolar transcription factor UBF. Mol Cell Biol 23: 8862–8877, 2003. doi: 10.1128/MCB.23.23.8862-8877.2003. [DOI] [PMC free article] [PubMed] [Google Scholar]
- 17.Suryawan A, Davis TA. Amino acid- and insulin-induced activation of mTORC1 in neonatal piglet skeletal muscle involves Sestrin2-GATOR2, Rag A/C-mTOR, and RHEB-mTOR complex formation. J Nutr 148: 825–833, 2018. doi: 10.1093/jn/nxy044. [DOI] [PMC free article] [PubMed] [Google Scholar]
- 18.Suryawan A, Nguyen HV, Almonaci RD, Davis TA. Abundance of amino acid transporters involved in mTORC1 activation in skeletal muscle of neonatal pigs is developmentally regulated. Amino Acids 45: 523–530, 2013. doi: 10.1007/s00726-012-1326-7. [DOI] [PMC free article] [PubMed] [Google Scholar]
- 19.Davis TA, Fiorotto ML, Nguyen HV, Reeds PJ. Protein turnover in skeletal muscle of suckling rats. Am J Physiol Regul Integr Comp Physiol 257: R1141–R1146, 1989. doi: 10.1152/ajpregu.1989.257.5.R1141. [DOI] [PubMed] [Google Scholar]
- 20.Suryawan A, Davis TA. The abundance and activation of mTORC1 regulators in skeletal muscle of neonatal pigs are modulated by insulin, amino acids, and age. J Appl Physiol (1985) 109: 1448–1454, 2010. doi: 10.1152/japplphysiol.00428.2010. [DOI] [PMC free article] [PubMed] [Google Scholar]
- 21.Davis TA, Burrin DG, Fiorotto ML, Nguyen HV. Protein synthesis in skeletal muscle and jejunum is more responsive to feeding in 7-than in 26-day-old pigs. Am J Physiol Endocrinol Metab 270: E802–E809, 1996. doi: 10.1152/ajpendo.1996.270.5.E802. [DOI] [PubMed] [Google Scholar]
- 22.Naberhuis JK, Suryawan A, Nguyen HV, Hernandez-Garcia A, Cruz SM, Lau PE, Olutoye OO, Stoll B, Burrin DG, Fiorotto ML, Davis TA. Prematurity blunts the feeding-induced stimulation of translation initiation signaling and protein synthesis in muscle of neonatal piglets. Am J Physiol Endocrinol Metab 317: E839–E851, 2019. doi: 10.1152/ajpendo.00151.2019. [DOI] [PMC free article] [PubMed] [Google Scholar]
- 23.National Research Council. Nutrient Requirements of Swine (11th revised ed.). Washington, DC: National Academies, 2012. [Google Scholar]
- 24.Stoll B, Puiman PJ, Cui L, Chang X, Benight NM, Bauchart-Thevret C, Hartmann B, Holst JJ, Burrin DG. Continuous parenteral and enteral nutrition induces metabolic dysfunction in neonatal pigs. JPEN J Parenter Enteral Nutr 36: 538–550, 2012. doi: 10.1177/0148607112444756. [DOI] [PMC free article] [PubMed] [Google Scholar]
- 25.Beckett PR, Hardin DS, Davis TA, Nguyen HV, Wray-Cahen D, Copeland KC. Spectrophometric assay for measuring branched-chain amino acid concentrations: application for measuring the sensitivity of protein metabolism to insulin. Anal Biochem 240: 48–53, 1996. doi: 10.1006/abio.1996.0329. [DOI] [PubMed] [Google Scholar]
- 26.Wray-Cahen D, Beckett PR, Nguyen HV, Davis TA. Insulin-stimulated amino acid utilization during glucose and amino acid clamps decreases with development. Am J Physiol Endocrinol Metab 273: E305–E314, 1997. doi: 10.1152/ajpendo.1997.273.2.E305. [DOI] [PubMed] [Google Scholar]
- 27.Garlick PJ, McNurlan MA, Preedy VR. A rapid and convenient technique for measuring the rate of protein synthesis in tissues by injection of [3H]phenylalanine. Biochem J 192: 719–723, 1980. doi: 10.1042/bj1920719. [DOI] [PMC free article] [PubMed] [Google Scholar]
- 28.Suryawan A, Nguyen HV, Bush JA, Davis TA. Developmental changes in the feeding-induced activation of the insulin-signaling pathway in neonatal pigs. Am J Physiol Endocrinol Metab 281: E908–E915, 2001. doi: 10.1152/ajpendo.2001.281.5.E908. [DOI] [PubMed] [Google Scholar]
- 29.Wilson FA, Suryawan A, Gazzaneo MC, Orellana RA, Nguyen HV, Davis TA. Stimulation of muscle protein synthesis by prolonged parenteral infusion of leucine is dependent on amino acid availability in neonatal pigs. J Nutr 140: 264–270, 2010. doi: 10.3945/jn.109.113621. [DOI] [PMC free article] [PubMed] [Google Scholar]
- 30.Clark RH, Thomas P, Peabody J. Extrauterine growth restriction remains a serious problem in prematurely born neonates. Pediatrics 111: 986–990, 2003. doi: 10.1542/peds.111.5.986. [DOI] [PubMed] [Google Scholar]
- 31.Dusick AM, Poindexter BB, Ehrenkranz RA, Lemons JA. Growth failure in the preterm infant: can we catch up? Semin Perinatol 27: 302–310, 2003. doi: 10.1016/S0146-0005(03)00044-2. [DOI] [PubMed] [Google Scholar]
- 32.Mericq V, Martinez-Aguayo A, Uauy R, Iniguez G, Van der Steen M, Hokken-Koelega A. Long-term metabolic risk among children born premature or small for gestational age. Nat Rev Endocrinol 13: 50–62, 2017. doi: 10.1038/nrendo.2016.127. [DOI] [PubMed] [Google Scholar]
- 33.Blanco CL, McGill-Vargas LL, Gastaldelli A, Seidner SR, McCurnin DC, Leland MM, Anzueto DG, Johnson MC, Liang H, DeFronzo RA, Musi N. Peripheral insulin resistance and impaired insulin signaling contribute to abnormal glucose metabolism in preterm baboons. Endocrinology 156: 813–823, 2015. doi: 10.1210/en.2014-1757. [DOI] [PMC free article] [PubMed] [Google Scholar]
- 34.Inoki K, Li Y, Xu T, Guan KL. Rheb GTPase is a direct target of TSC2 GAP activity and regulates mTOR signaling. Genes Dev 17: 1829–1834, 2003. doi: 10.1101/gad.1110003. [DOI] [PMC free article] [PubMed] [Google Scholar]
- 35.Condon KJ, Sabatini DM. Nutrient regulation of mTORC1 at a glance. J Cell Sci 132: jcs222570, 2019. doi: 10.1242/jcs.222570. [DOI] [PMC free article] [PubMed] [Google Scholar]
- 36.Sancak Y, Peterson TR, Shaul YD, Lindquist RA, Thoreen CC, Bar-Peled L, Sabatini DM. The Rag GTPases bind raptor and mediate amino acid signaling to mTORC1. Science 320: 1496–1501, 2008. doi: 10.1126/science.1157535. [DOI] [PMC free article] [PubMed] [Google Scholar]
- 37.Chantranupong L, Wolfson RL, Orozco JM, Saxton RA, Scaria SM, Bar-Peled L, Spooner E, Isasa M, Gygi SP, Sabatini DM. The Sestrins interact with GATOR2 to negatively regulate the amino-acid-sensing pathway upstream of mTORC1. Cell Rep 9: 1–8, 2014. doi: 10.1016/j.celrep.2014.09.014. [DOI] [PMC free article] [PubMed] [Google Scholar]
- 38.Wolfson RL, Chantranupong L, Saxton RA, Shen K, Scaria SM, Cantor JR, Sabatini DM. Sestrin2 is a leucine sensor for the mTORC1 pathway. Science 351: 43–48, 2016. doi: 10.1126/science.aab2674. [DOI] [PMC free article] [PubMed] [Google Scholar]
- 39.Wolfson RL, Chantranupong L, Wyant GA, Gu X, Orozco JM, Shen K, Condon KJ, Petri S, Kedir J, Scaria SM, Abu-Remaileh M, Frankel WN, Sabatini DM. KICSTOR recruits GATOR1 to the lysosome and is necessary for nutrients to regulate mTORC1. Nature 543: 438–442, 2017. doi: 10.1038/nature21423. [DOI] [PMC free article] [PubMed] [Google Scholar]
- 40.Tsun ZY, Bar-Peled L, Chantranupong L, Zoncu R, Wang T, Kim C, Spooner E, Sabatini DM. The folliculin tumor suppressor is a GAP for the RagC/D GTPases that signal amino acid levels to mTORC1. Mol Cell 52: 495–505, 2013. doi: 10.1016/j.molcel.2013.09.016. [DOI] [PMC free article] [PubMed] [Google Scholar]
- 41.Angarola B, Ferguson SM. Coordination of Rheb lysosomal membrane interactions with mTORC1 activation. F1000Res 9: 450, 2020. doi: 10.12688/f1000research.22367.1. [DOI] [PMC free article] [PubMed] [Google Scholar]
- 42.Kelly AM, Rosser BW, Hoffman R, Panettieri RA, Schiaffino S, Rubinstein NA, Nemeth PM. Metabolic and contractile protein expression in developing rat diaphragm muscle. J Neurosci 11: 1231–1242, 1991. doi: 10.1523/JNEUROSCI.11-05-01231.1991. [DOI] [PMC free article] [PubMed] [Google Scholar]
- 43.Rog-Zielinska EA, Richardson RV, Denvir MA, Chapman KE. Glucocorticoids and foetal heart maturation; implications for prematurity and foetal programming. J Mol Endocrinol 52: R125–R135, 2014. doi: 10.1530/JME-13-0204. [DOI] [PubMed] [Google Scholar]
- 44.Suryawan A, Davis TA. Regulation of protein degradation pathways by amino acids and insulin in skeletal muscle of neonatal pigs. J Anim Sci Biotechnol 5: 8, 2014. doi: 10.1186/2049-1891-5-8. [DOI] [PMC free article] [PubMed] [Google Scholar]
- 45.Kim J, Kundu M, Viollet B, Guan KL. AMPK and mTOR regulate autophagy through direct phosphorylation of Ulk1. Nat Cell Biol 13: 132–141, 2011. doi: 10.1038/ncb2152. [DOI] [PMC free article] [PubMed] [Google Scholar]
- 46.El-Kadi SW, Suryawan A, Gazzaneo MC, Srivastava N, Orellana RA, Nguyen HV, Lobley GE, Davis TA. Anabolic signaling and protein deposition are enhanced by intermittent compared with continuous feeding in skeletal muscle of neonates. Am J Physiol Endocrinol Metab 302: E674–E686, 2012. doi: 10.1152/ajpendo.00516.2011. [DOI] [PMC free article] [PubMed] [Google Scholar]
- 47.Sandri M, Sandri C, Gilbert A, Skurk C, Calabria E, Picard A, Walsh K, Schiaffino S, Lecker SH, Goldberg AL. Foxo transcription factors induce the atrophy-related ubiquitin ligase atrogin-1 and cause skeletal muscle atrophy. Cell 117: 399–412, 2004. doi: 10.1016/S0092-8674(04)00400-3. [DOI] [PMC free article] [PubMed] [Google Scholar]
- 48.Hernandez-Garcia AD, Columbus DA, Manjarin R, Nguyen HV, Suryawan A, Orellana RA, Davis TA. Leucine supplementation stimulates protein synthesis and reduces degradation signal activation in muscle of newborn pigs during acute endotoxemia. Am J Physiol Endocrinol Metab 311: E791–E801, 2016. doi: 10.1152/ajpendo.00217.2016. [DOI] [PMC free article] [PubMed] [Google Scholar]
- 49.Brown LD, Hay WW, Jr.. Impact of placental insufficiency on fetal skeletal muscle growth. Mol Cell Endocrinol 435: 69–77, 2016. doi: 10.1016/j.mce.2016.03.017. [DOI] [PMC free article] [PubMed] [Google Scholar]
- 50.Davis HP, Squire LR. Protein synthesis and memory: a review. Psychol Bull 96: 518–559, 1984. doi: 10.1037/0033-2909.96.3.518. [DOI] [PubMed] [Google Scholar]
- 51.Andersen AD, Sangild PT, Munch SL, van der Beek EM, Renes IB, Ginneken C, Greisen GO, Thymann T. Delayed growth, motor function and learning in preterm pigs during early postnatal life. Am J Physiol Regul Integr Comp Physiol 310: R481–R492, 2016. doi: 10.1152/ajpregu.00349.2015. [DOI] [PubMed] [Google Scholar]
- 52.Luu TM, Rehman Mian MO, Nuyt AM. Long-term impact of preterm birth: neurodevelopmental and physical health outcomes. Clin Perinatol 44: 305–314, 2017. doi: 10.1016/j.clp.2017.01.003. [DOI] [PubMed] [Google Scholar]
- 53.Helman A, Cangelosi AL, Davis JC, Pham Q, Rothman A, Faust AL, Straubhaar JR, Sabatini DM, Melton DA. A nutrient-sensing transition at birth triggers glucose-responsive insulin secretion. Cell Metab 31: 1004–1016.e5, 2020. doi: 10.1016/j.cmet.2020.04.004. [DOI] [PMC free article] [PubMed] [Google Scholar]
- 54.O’Connor PM, Bush JA, Suryawan A, Nguyen HV, Davis TA. Insulin and amino acids independently stimulate skeletal muscle protein synthesis in neonatal pigs. Am J Physiol Endocrinol Metab 284: E110–E119, 2003. doi: 10.1152/ajpendo.00326.2002. [DOI] [PubMed] [Google Scholar]
- 55.Goldspink DF. Pre- and post-natal growth and protein turnover in the lung of the rat. Biochem J 242: 275–279, 1987. doi: 10.1042/bj2420275. [DOI] [PMC free article] [PubMed] [Google Scholar]
- 56.Goldspink DF, Kelly FJ. Protein turnover and growth in the whole body, liver and kidney of the rat from the foetus to senility. Biochem J 217: 507–516, 1984. doi: 10.1042/bj2170507. [DOI] [PMC free article] [PubMed] [Google Scholar]
- 57.Fiorotto ML, Davis TA, Reeds PJ. Regulation of myofibrillar protein turnover during maturation in normal and undernourished rat pups. Am J Physiol Regul Integr Comp Physiol 278: R845–R854, 2000. doi: 10.1152/ajpregu.2000.278.4.R845. [DOI] [PubMed] [Google Scholar]
- 58.Gokulakrishnan G, Estrada IJ, Sosa HA, Fiorotto ML. In utero glucocorticoid exposure reduces fetal skeletal muscle mass in rats independent of effects on maternal nutrition. Am J Physiol Regul Integr Comp Physiol 302: R1143–R1152, 2012. doi: 10.1152/ajpregu.00466.2011. [DOI] [PMC free article] [PubMed] [Google Scholar]
- 59.Thorens B, Mueckler M. Glucose transporters in the 21st Century. Am J Physiol Endocrinol Metab 298: E141–E145, 2010. doi: 10.1152/ajpendo.00712.2009. [DOI] [PMC free article] [PubMed] [Google Scholar]
- 60.Ren S, Hui Y, Obelitz-Ryom K, Brandt AB, Kot W, Nielsen DS, Thymann T, Sangild PT, Nguyen DN. Neonatal gut and immune maturation is determined more by postnatal age than by postconceptional age in moderately preterm pigs. Am J Physiol Gastrointest Liver Physiol 315: G855–G867, 2018. doi: 10.1152/ajpgi.00169.2018. [DOI] [PubMed] [Google Scholar]
- 61.Farrag HM, Nawrath LM, Healey JE, Dorcus EJ, Rapoza RE, Oh W, Cowett RM. Persistent glucose production and greater peripheral sensitivity to insulin in the neonate vs. the adult. Am J Physiol Endocrinol Metab 272: E86–E93, 1997. doi: 10.1152/ajpendo.1997.272.1.E86. [DOI] [PubMed] [Google Scholar]
- 62.Aldoretta PW, Hay WW, Jr.. Metabolic substrates for fetal energy metabolism and growth. Clin Perinatol 22: 15–36, 1995. doi: 10.1016/S0095-5108(18)30299-9. [DOI] [PubMed] [Google Scholar]
- 63.Dechert R, Wesley J, Schafer L, LaMond S, Beck T, Coran A, Bartlett RH. Comparison of oxygen consumption, carbon dioxide production, and resting energy expenditure in premature and full-term infants. J Pediatr Surg 20: 792–798, 1985. doi: 10.1016/S0022-3468(85)80045-2. [DOI] [PubMed] [Google Scholar]
- 64.Mellor DJ, Cockburn F. A comparison of energy metabolism in the new-born infant, piglet and lamb. Q J Exp Physiol 71: 361–379, 1986. doi: 10.1113/expphysiol.1986.sp002995. [DOI] [PubMed] [Google Scholar]
- 65.Brown LD, Hay WW, Jr.. Effect of hyperinsulinemia on amino acid utilization and oxidation independent of glucose metabolism in the ovine fetus. Am J Physiol Endocrinol Metab 291: E1333–E1340, 2006. doi: 10.1152/ajpendo.00028.2006. [DOI] [PubMed] [Google Scholar]
- 66.Wilson FA, Suryawan A, Orellana RA, Kimball SR, Gazzaneo MC, Nguyen HV, Fiorotto ML, Davis TA. Feeding rapidly stimulates protein synthesis in skeletal muscle of neonatal pigs by enhancing translation initiation. J Nutr 139: 1873–1880, 2009. doi: 10.3945/jn.109.106781. [DOI] [PMC free article] [PubMed] [Google Scholar]
- 67.Brown LD. Endocrine regulation of fetal skeletal muscle growth: impact on future metabolic health. J Endocrinol 221: R13–R29, 2014. doi: 10.1530/JOE-13-0567. [DOI] [PMC free article] [PubMed] [Google Scholar]