Keywords: arginine, arginine deiminase, citrulline, swine, tracer kinetics
Abstract
Pegylated arginine deiminase (ADI-PEG20) results in the depletion of arginine with the production of isomolar amounts of citrulline. This citrulline has the potential to be utilized by the citrulline recycling pathway regenerating arginine and sustaining tissue arginine availability. The goal of this research was to test the hypothesis that ADI-PEG20 depletes circulating arginine in pigs but maintains tissue arginine concentration and function, and to characterize the kinetics of citrulline and arginine. Two multitracer approaches (bolus dose and primed-continuous infusion) were used to investigate the metabolism of arginine and citrulline in Control (n = 7) and ADI-PEG20 treated (n = 8) pigs during the postprandial period. In addition, blood pressure was monitored by telemetry, and multiple tissues were collected to determine arginine concentration. Plasma arginine was depleted immediately after ADI-PEG20 administration, with an increase in plasma citrulline concentration (P < 0.01). The depletion of arginine did not affect (P > 0.10) blood pressure, whole body protein synthesis, or urea production. Despite the lack of circulating arginine in ADI-PEG20-treated pigs, most tissues were able to maintain concentrations similar (P > 0.10) to those in Control animals. The kinetics of citrulline and arginine indicated the high citrulline turnover and regeneration of arginine through the citrulline recycling pathway. ADI-PEG20 administration resulted in an absolute and almost instantaneous depletion of circulating arginine, thus reducing global availability without affecting cardiovascular parameters and protein metabolism. The citrulline produced from the deimination of arginine was in turn utilized by the citrulline recycling pathway restoring local tissue arginine availability.
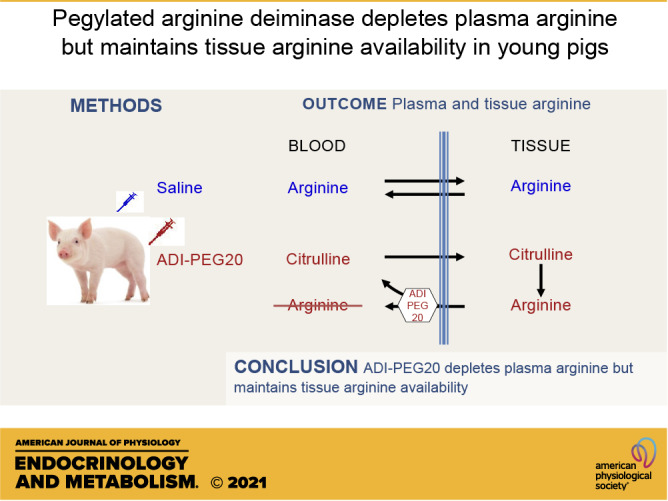
NEW & NOTEWORTHY Pegylated arginine deiminase depletes circulating arginine, but the citrulline generated is utilized by multiple tissues to regenerate arginine and sustain local arginine availability. Preempting the arginine depletion that occurs as result of sepsis and trauma with arginine deiminase offers the possibility of maintaining tissue arginine availability despite negligible plasma arginine concentrations.
INTRODUCTION
The endogenous synthesis of the conditional essential amino acid arginine relies in an interorgan process known as the intestinal-renal axis for arginine production (1). Citrulline produced in the gut, enters the portal vein, bypasses hepatic metabolism reaching the peripheral circulation and is further metabolized by renal argininosuccinate synthase and argininosuccinate lyase (ASS1 and ASL, respectively) for the synthesis of arginine. During fasting, this “de novo” arginine synthesis pathway contributes 10%–15% of the arginine flux, with the rest originating from protein turnover (2–4).
In addition, ASS1 and ASL are widely expressed in most, if not all, cell types and function to recycle citrulline generated as coproduct in the synthesis of nitric oxide (5), a signaling molecule with a central role in the regulation of blood pressure (6). This citrulline recycling pathway, however, can also utilize circulating citrulline to generate arginine that then can be used to meet the needs of different cell types (7–9). Because under normal conditions ∼20%–30% of the citrulline produced cannot be accounted for as circulating arginine (2–4), it is assumed that this pathway is responsible for the utilization of this unaccounted citrulline and the production of “local” arginine.
During certain pathophysiological conditions in which arginase activity is increased [sepsis (10) or trauma (11), or arginase is released into the circulation [sickle cell disease (12), cardiopulmonary bypass (13)] circulating arginine is depleted. This reduction in plasma arginine concentration indicates a reduction in “global” arginine availability and, as consequence, a reduction in tissue arginine compromising also “local” arginine availability.
The ability for normal cells to utilize the citrulline recycling pathway has been exploited in the treatment of cancer. Arginine deiminase (EC 3.5.3.6) is a bacterial enzyme that catalyzes the reduction of the imino group of arginine yielding citrulline and ammonia. This enzyme has been pegylated [pegylated arginine deiminase (ADI-PEG20)] to increase its half-life (∼10 days) and reduce immunogenicity. ADI-PEG20 is currently used for the treatment of patients with cancer (14–16) and has been administered weekly for months without incurring drug-related adverse effects (17, 18). Because certain cancer cells lack ASS1 and ASL, they depend on the provision of arginine from the blood to sustain protein synthesis and growth (19, 20). ADI-PEG20 administration produces a drastic depletion in circulating arginine (<2 µmol/L; 21, 22) causing the regression and death of tumor cells; healthy cells, however, have ASS1 and ASL activity and can utilize citrulline to produce intracellular arginine, thus maintaining their normal functions (7, 9).
The current work was conducted to further our understanding of the kinetics of citrulline and arginine and to test the hypothesis that the depletion of circulating arginine by ADI-PEG20 results in the simultaneous reduction of global arginine availability (plasma arginine) but in the maintenance of local arginine availability (tissue arginine). The maintenance of tissue arginine availability with ADI-PEG20 may result advantageous in the pathophysiological conditions mentioned previously.
MATERIALS AND METHODS
General
Domestic conventionally reared crossbred pigs were obtained from a local commercial swine farm. Male and female 3-wk-old pigs (initial weight ∼5 kg) were brought to the animal facility where they acclimated for 10–12 days to their new surroundings and were transitioned from a milk substitute (NutraStart Liqui-Wean, Milk Specialities Co., Eden Prairie, MN) to a solid pelleted feed (Mini Pig Starter Diet 5080, LabDiet, St. Louis, MO). All animal procedures were approved by the Baylor College of Medicine Institutional Animal Care and Use Committee.
Two different stable isotope approaches were followed. The first entailed the delivery of a bolus dose and compartmental kinetics analysis. The second was a primed-continuous infusion of tracers with tissue collection at the end of the infusion. Two different citrulline labels, tracing different part of the molecule, were used in both infusion protocols. The 5,5-[2H2] citrulline tracer follows the carbon skeleton of this molecule and thus it is maintained during the citrulline-arginine-citrulline cycle. In contrast, the ureido(15N) citrulline label has 50% chances of being removed and lost during deimidation by ADI-PEG20.
Experiment 1: Bolus Tracer Dose
To characterize the depletion of arginine resulting from the administration of ADI-PEG20 (Polaris Pharmaceutical Inc., San Diego, CA) and the kinetics of citrulline and arginine, pigs (4 male, 4 female) underwent isoflurane anesthesia for the placement of jugular and carotid catheters. In addition, a telemetry probe (M10, Data Science International, St. Paul, MN) was placed in a femoral artery to monitor blood pressure. Due to the loss of a carotid catheter, one pig was excluded from the study. After a 4-day recovery period, ADI-PEG20 was administered to 4 pigs (2 male, 2 female; 1.4 mg/kg ∼12 IU/kg im), and saline was used as the Control treatment in the rest of the animals (Fig. 1). Blood was collected from the carotid catheter before (−20, −10, and 0 min) and after (10, 20, 30, 45, 60, 120, and 180 min) the administration of the treatments to determine the acute depletion of arginine.
Figure 1.
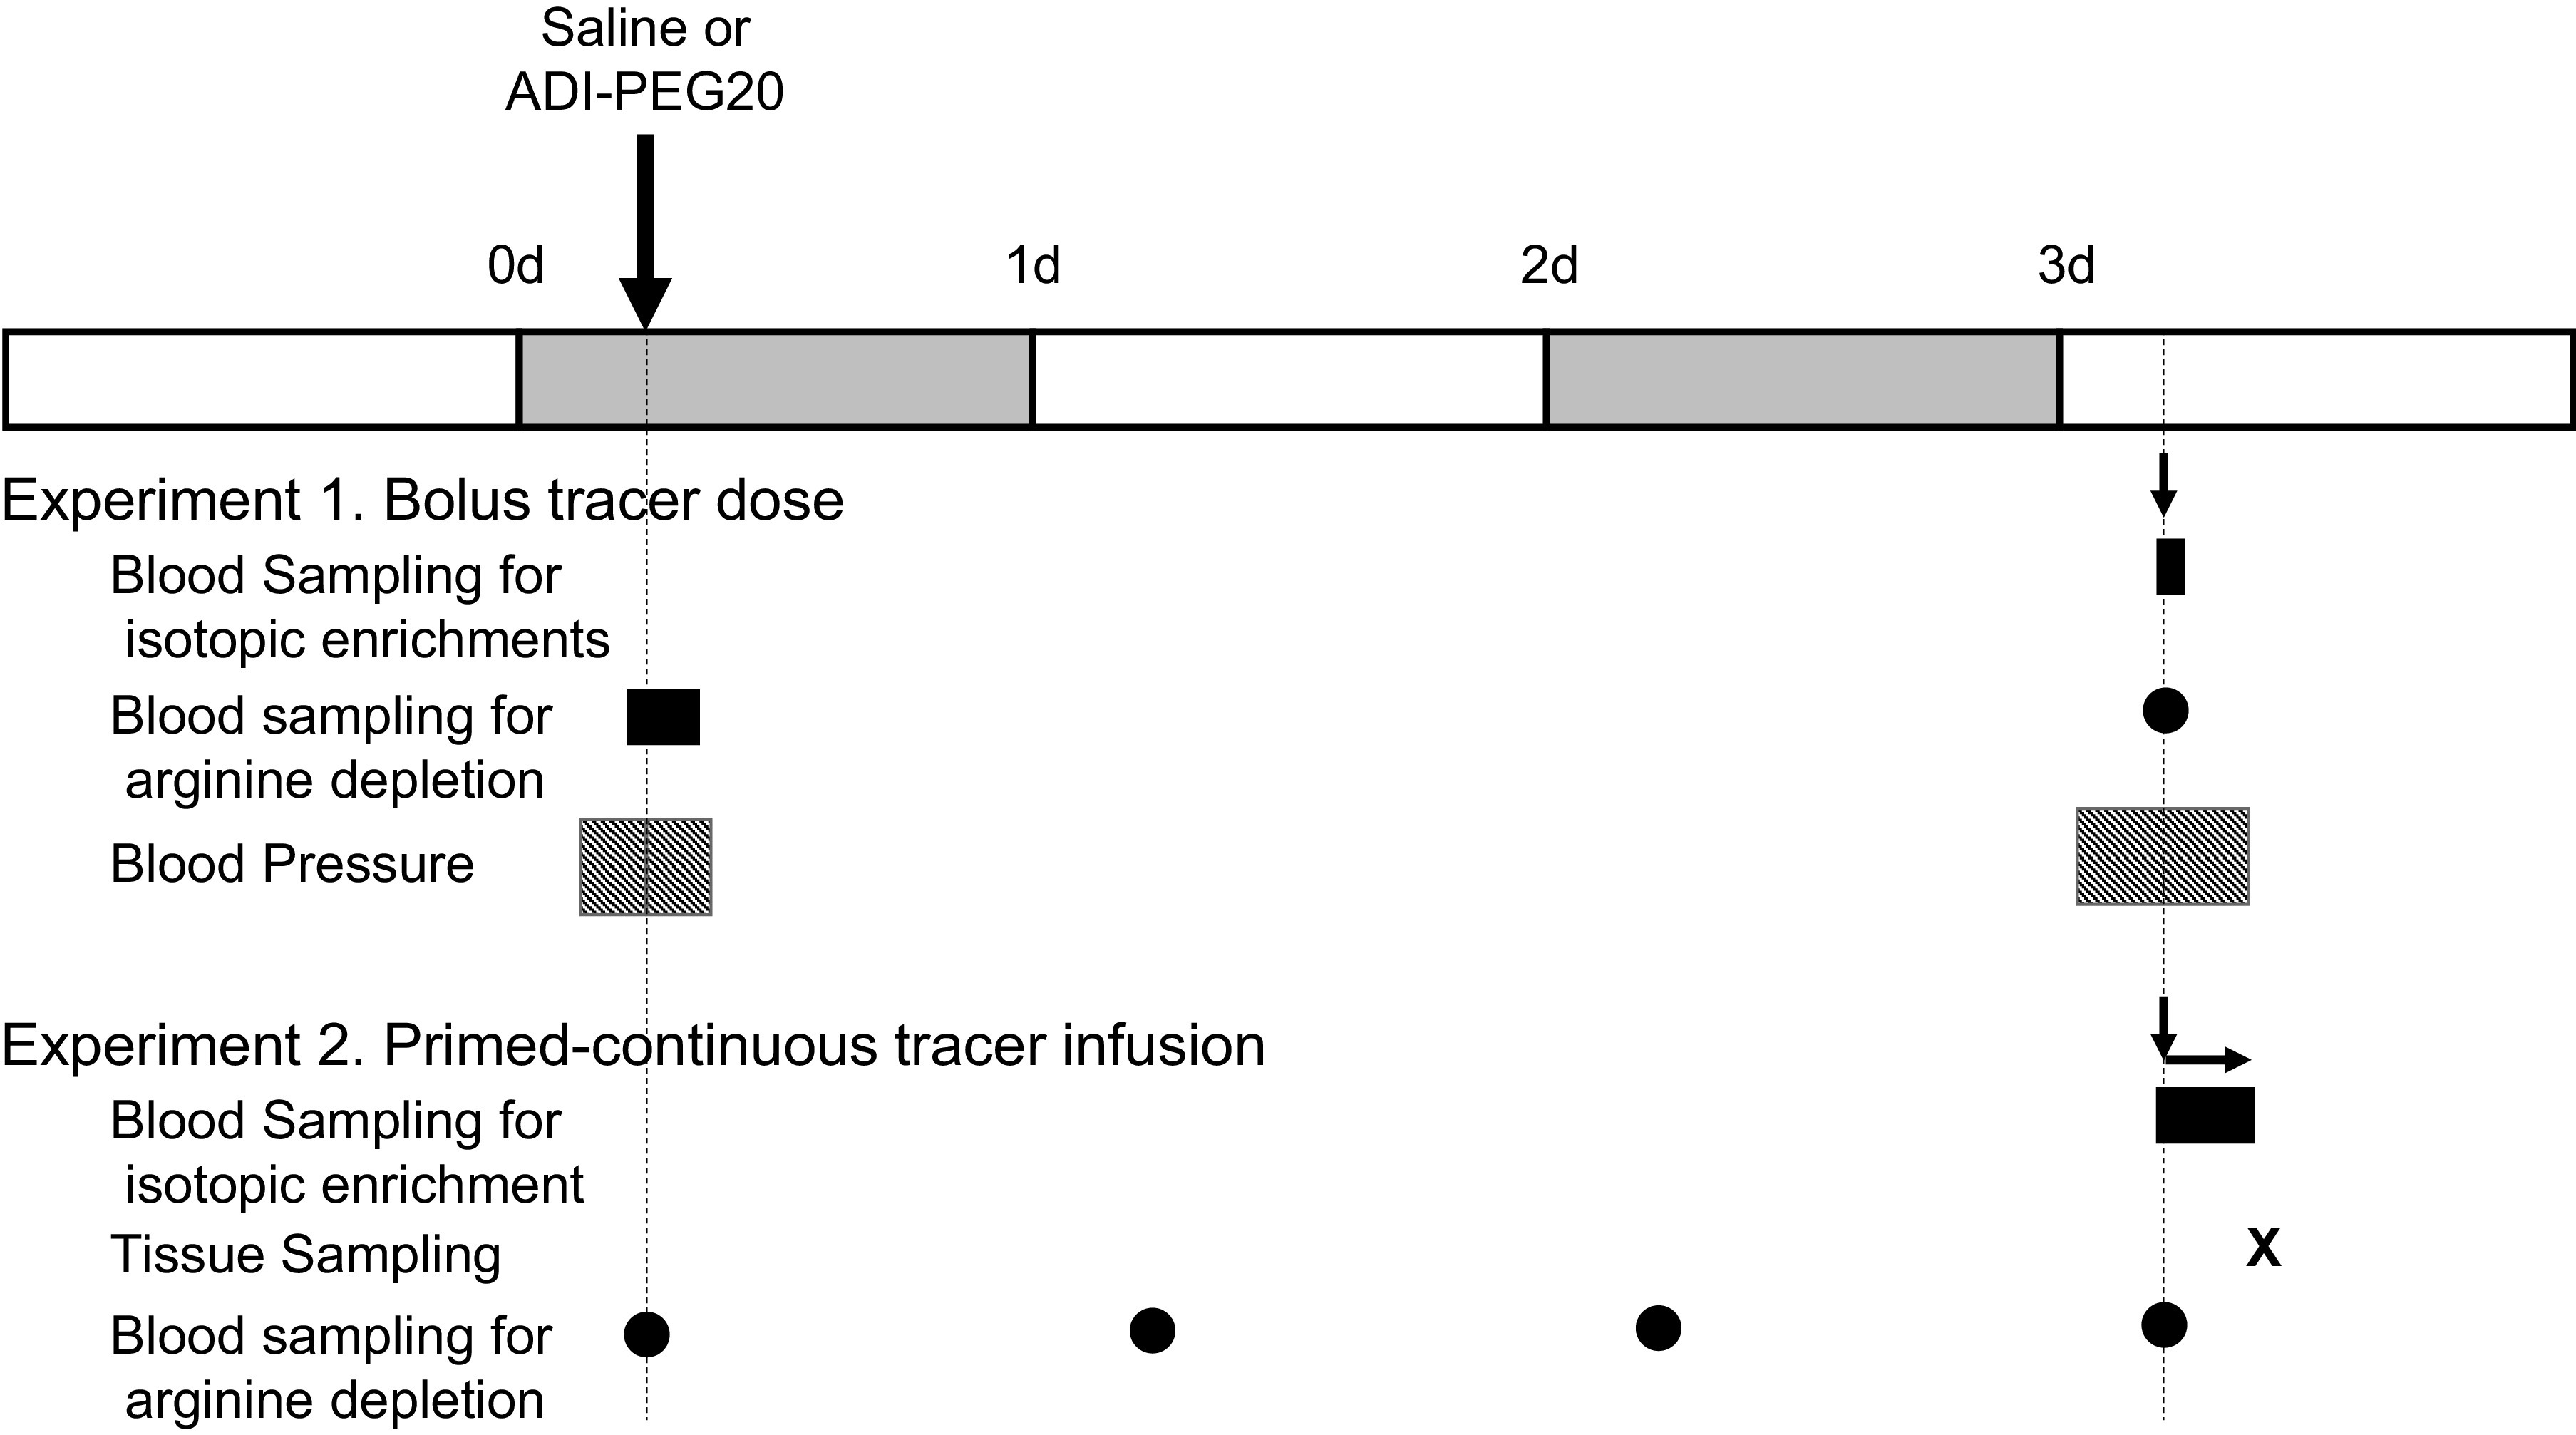
Infusion and sampling schedules for experiment 1 (bolus tracer dose) and experiment 2 (primed-continuous tracer infusion). Large arrows indicate administration of the treatments, and the small arrows indicate the tracer protocols. Solid rectangles denote blood sampling periods and circles indicate single blood collections. Hatched rectangles denote the period when blood pressure and other cardiovascular endpoints were monitored by telemetry.
Three days later, and after an 8-h period of feed deprivation, a bolus dose containing U-[13C6] arginine (18 µmol/kg), (ring)[2H5] phenylalanine (20 µmol/kg), 3,3-[2H2]tyrosine (4 µmol/kg), 1-[13C]leucine (10 µmol/kg), [13C18O]urea (80 µmol/kg), and [15N18O3]nitrate (0.56 µmol/kg) was given intravenously using the jugular catheter. In addition, (ureido)[15N]- and 5,5-[2H2]citrulline were also administered in isomolar amounts; because we expected a greater dilution of these tracers as result of the ADI-PEG20 treatment, the dose for the Control group was 10 µmol/kg and for the ADI-PEG20 group, 47 µmol/kg. Blood was obtained before (−30, −15, and 0 min) the bolus dose to obtain background isotopic enrichments and at 2.5, 5, 7.5, 10, 15, 20, 30, 40, 50, 60, 70, 120, 240, 360, and 720 min after the administration of the tracers (Fig. 1).
Blood pressure and heart rate were monitored before (baseline: −3 to 0 h), immediately after (acute phase: 0 to 3 h), and three days after (chronic phase: 72 to 80 h) the administration of the treatments (Fig. 1).
Experiment 2: Primed-Continuous Tracer Infusion
To further characterize the kinetics of citrulline and arginine, and the tissue concentrations (and enrichments) of these amino acids, jugular and carotid catheters were implanted in pigs (4 male, 4 female). After a 4-day recovery period, pigs were administered ADI-PEG20 or saline as described for experiment 1. Blood samples were collected from the carotid catheter before (at 0 h) and at 24, 48, and 72 h after treatment administration to characterize the depletion of arginine and increase in plasma citrulline concentration (Fig. 1).
Three days later, and after an 8-h feed deprivation period, pigs were primed-continuously infused with U-[13C6]arginine (8 µmol·kg−1·h−1), (ring)[2H5]phenylalanine (22 µmol·kg−1·h−1), 3,3-[2H2]tyrosine (4 µmol·kg−1·h−1), 1-[13C]leucine (9 µmol·kg−1·h−1), and [15N213C] guanidinoacetic acid (GAA; 1.1 µmol·kg−1·h−1) for 4 h; (ureido)[15N]- and 5,5-[2H2]citrulline were also administered in isomolar amounts at a rate of 2 and 14 µmol·kg−1·h−1 for the Control and ADI-PEG treatments, respectively. A priming dose equivalent to 1 h infusion was given to hasten the achievement of isotopic plateau enrichments. Background blood samples were collected before the initiation of the tracer protocol (−30, −15, and 0 min) and additional samples were obtained at 200, 220, and 240 min to characterize the isotopic plateau enrichment (Fig. 1). At the end of the experiment, pigs were euthanized with a phenytoin/pentobarbital commercial solution and tissue samples were collected.
Sample Collection and Processing
Blood samples were collected using the carotid catheter into EDTA tubes (Microtainer, Becton Dickinson), placed on ice and immediately centrifuged at 3,000 g at 4°C for 10 min. After the administration of a commercial euthanasia solution, tissue was collected in the following order: pancreas, spleen, liver, jejunum, kidney, diaphragm, heart, lung, aorta, muscle (L. dorsi), and brain. Tissues were immediately frozen in liquid nitrogen. Sample processing took <5 min for most tissues and <8 min for brain.
Sample Analysis
Plasma citrulline, arginine, phenylalanine, tyrosine, and leucine enrichments were determined by LC-MS/MS after their derivatization with dansyl chloride as described elsewhere (21). An internal standard (U-13C U-15N amino acid mix, Cambridge Isotope Laboratories, Andover, MA; and homocitrulline, Sigma Aldrich, St. Louis, MO) was used to calculate plasma concentrations in the same run. Tissue concentrations of these amino acids were determined after tissue homogenization on ice in a Triton X-100 solution (2 g/L) after the addition of the internal standard. An aliquot of the supernatant was derivatized with dansyl chloride. GAA was analyzed as its butyl ester by LC-MS/MS (23). Plasma urea enrichments were measured by GC-MS after derivatization with dimethylformamide dimethylacetal (Methyl-8; Thermo Fisher Scientific, Bellefonte, PA) as described previously (24). The enrichment of nitrate and nitrite (NOx) was determined by GC-MS as the pentafluorobromide derivative after reduction with cadmium + NH4Cl (9). Note that, after reduction, an 18O is lost from the infused tracer.
Calculations
For the bolus infusion of tracers, model fitting was performed by fitting different exponential equations to the tracer data. Based on visual inspection of the residuals and adjusted (pseudo)R2, the following biexponential model best fitted the citrulline and other amino acids enrichment data.
| (1) |
where Yt is the enrichment of citrulline (or other amino acids; tracer tracee ratio, TTR) at time t (min); M1 and M2 are intercept parameters (TTR), and g1 and g2 are exponential parameters of the model (min−1) calculated for each individual pig using the NLMIXED procedure of SAS (v 9.4; SAS Institute, Cary, NC). The calculations for rates of appearance, pool volumes and sizes, clearance, half-life, and mean retention time (MRT) have been presented in great detail in a previous publication (25).
For the continuous infusion of tracers, rates of appearance (Ra) of citrulline and other amino acids were calculated by the dilution of the corresponding infused tracer and rates of conversion (Rc) were estimated by the transfer of the label from the precursor to the product as described previously (26).
Statistical Analysis
Data were analyzed using the proc mixed statement of SAS with treatment (Control or ADI-PEG20) as fixed effect and pig as the random effect of the model. Tissue concentrations and enrichments were compared with plasma values by including each individual tissue and plasma as fixed effects to the model. In addition, a Pearson correlation using the proc corr of SAS was performed for the [15N] and [2H2] labels of citrulline. Means ± SE are shown and type I error was set at 0.05.
RESULTS
General
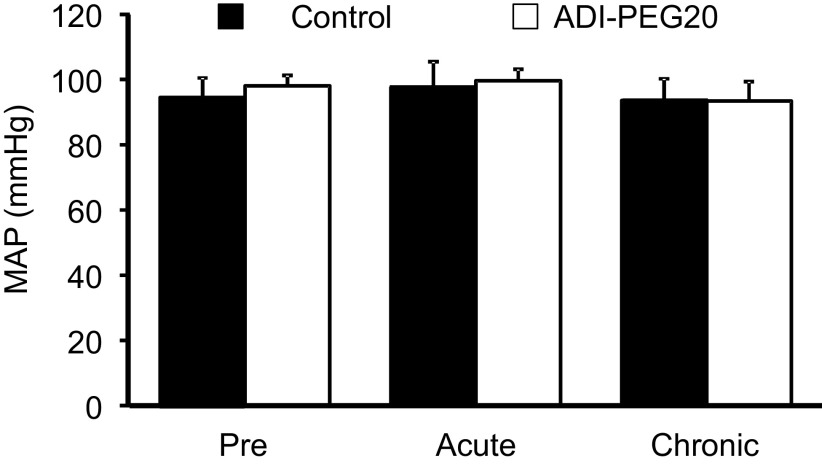
No evident changes in weight, appetite, body temperature, or heart rate (not shown) were detected in pigs after the administration of the treatments. ADI-PEG20 had no effect (P = 0.80) on mean arterial blood pressure either immediately after its administration (acute) or 72 h afterward (chronic, Fig. 2).
Figure 2.
Mean arterial blood pressure (MAP) in pigs before (pre), immediately after (acute), and 72 h after (chronic) the administration of saline (Control) or ADI-PEG20. Bars are means ± SE, n = 3 or 4 pigs. No significant differences (P = 0.80) were found between the treatments. ADI-PEG20, pegylated arginine deiminase.
Plasma Arginine Depletion and Subsequent Increase in Plasma Citrulline Concentration
The administration of ADI-PEG20 resulted in an acute depletion of plasma arginine (Fig. 3A) and an increase in plasma citrulline concentration (Fig. 3B). Within 30 min of drug administration, plasma arginine concentrations were below 1 µmol/L in most treated pigs (3/4). The depletion of arginine continued for at least 72 h after ADI-PEG20 administration (Fig. 3, A and C). Where plasma citrulline concentration increased approximately twofold within 180 min after ADI-PEG20 dosing, it reached approximately sixfold increase from baseline 72 h later (Fig. 3B). This increase seemed to take place within 24 h after ADI-PEG20 administration (Fig. 3D).
Figure 3.
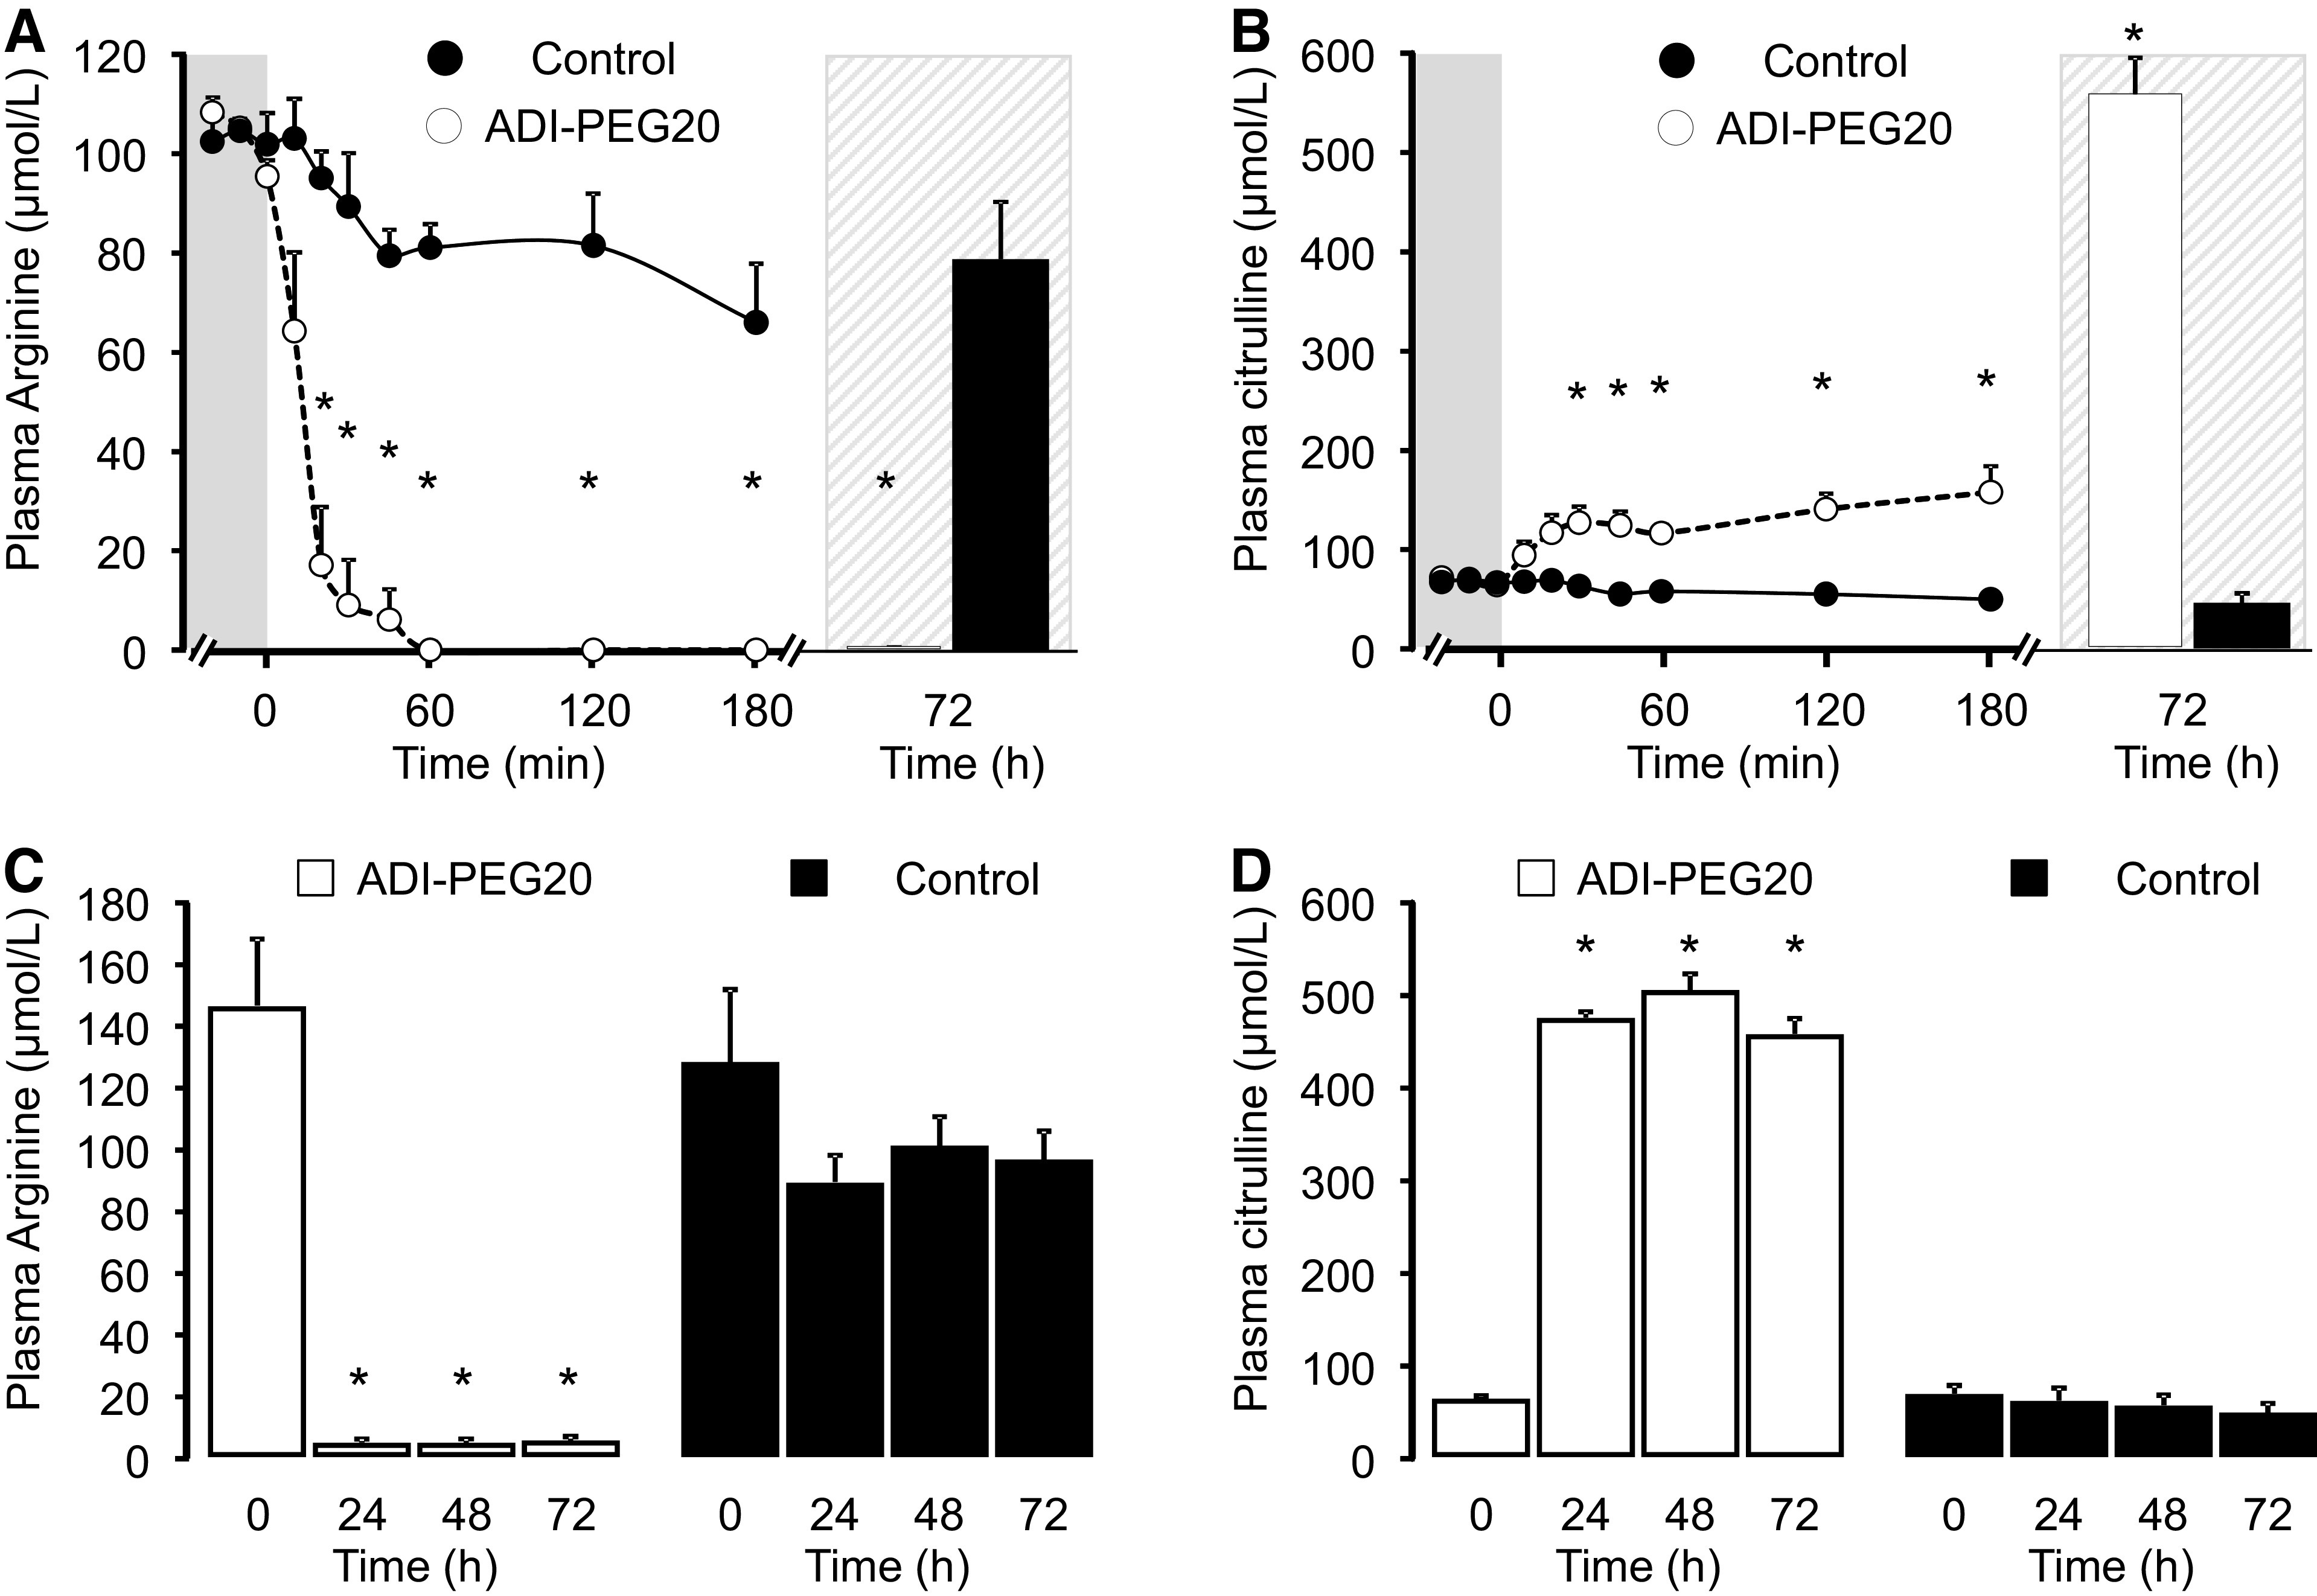
Plasma arginine (A and C) and citrulline (B and D) concentrations in pigs after the administration of saline (Control) or ADI-PEG20. A and B show the results of experiment 1, and C and D, the results of experiment 2. Symbols are means ± SE, n = 3 or 4 pigs. *Statistical differences (P < 0.05) between the Control and ADI-PEG20 treatments. ADI-PEG20, pegylated arginine deiminase.
Plasma Citrulline and Arginine Tracer Enrichment-Model Fitting
A biexponential model provided a good fit for the [15N]- and [2H2]citrulline enrichment data (pseudo-R2 > 0.991, and no evident pattern for the residuals; Fig. 4 and Table 1). Because a greater tracer bolus dose was given to the ADI-PEG20-treated pigs (due to their expected greater plasma citrulline concentration and larger citrulline pool), the treatment comparison between parameters M1 and M2 of the biexponential equation was not conducted (Table 1). However, when these parameters were normalized to account for the different doses, no treatment differences (P > 0.40; not shown) were detected. The exponents of the equation (g1 and g2) are independent of the tracer dose administered and were greater (P < 0.015) for the Control treatment (Table 1). No differences for any of the biexponential parameters were observed between the [15N]- and [2H2]citrulline tracer for the Control group; however, parameter M2 was greater (P < 0.001) when determined with the [2H2]citrulline tracer in ADI-PEG20-treated pigs (Table 1). These differences between treatments and tracers are evident in Fig. 4, where [15N]- and [2H2]citrulline enrichments from representative pigs (from each treatment group) are shown.
Figure 4.
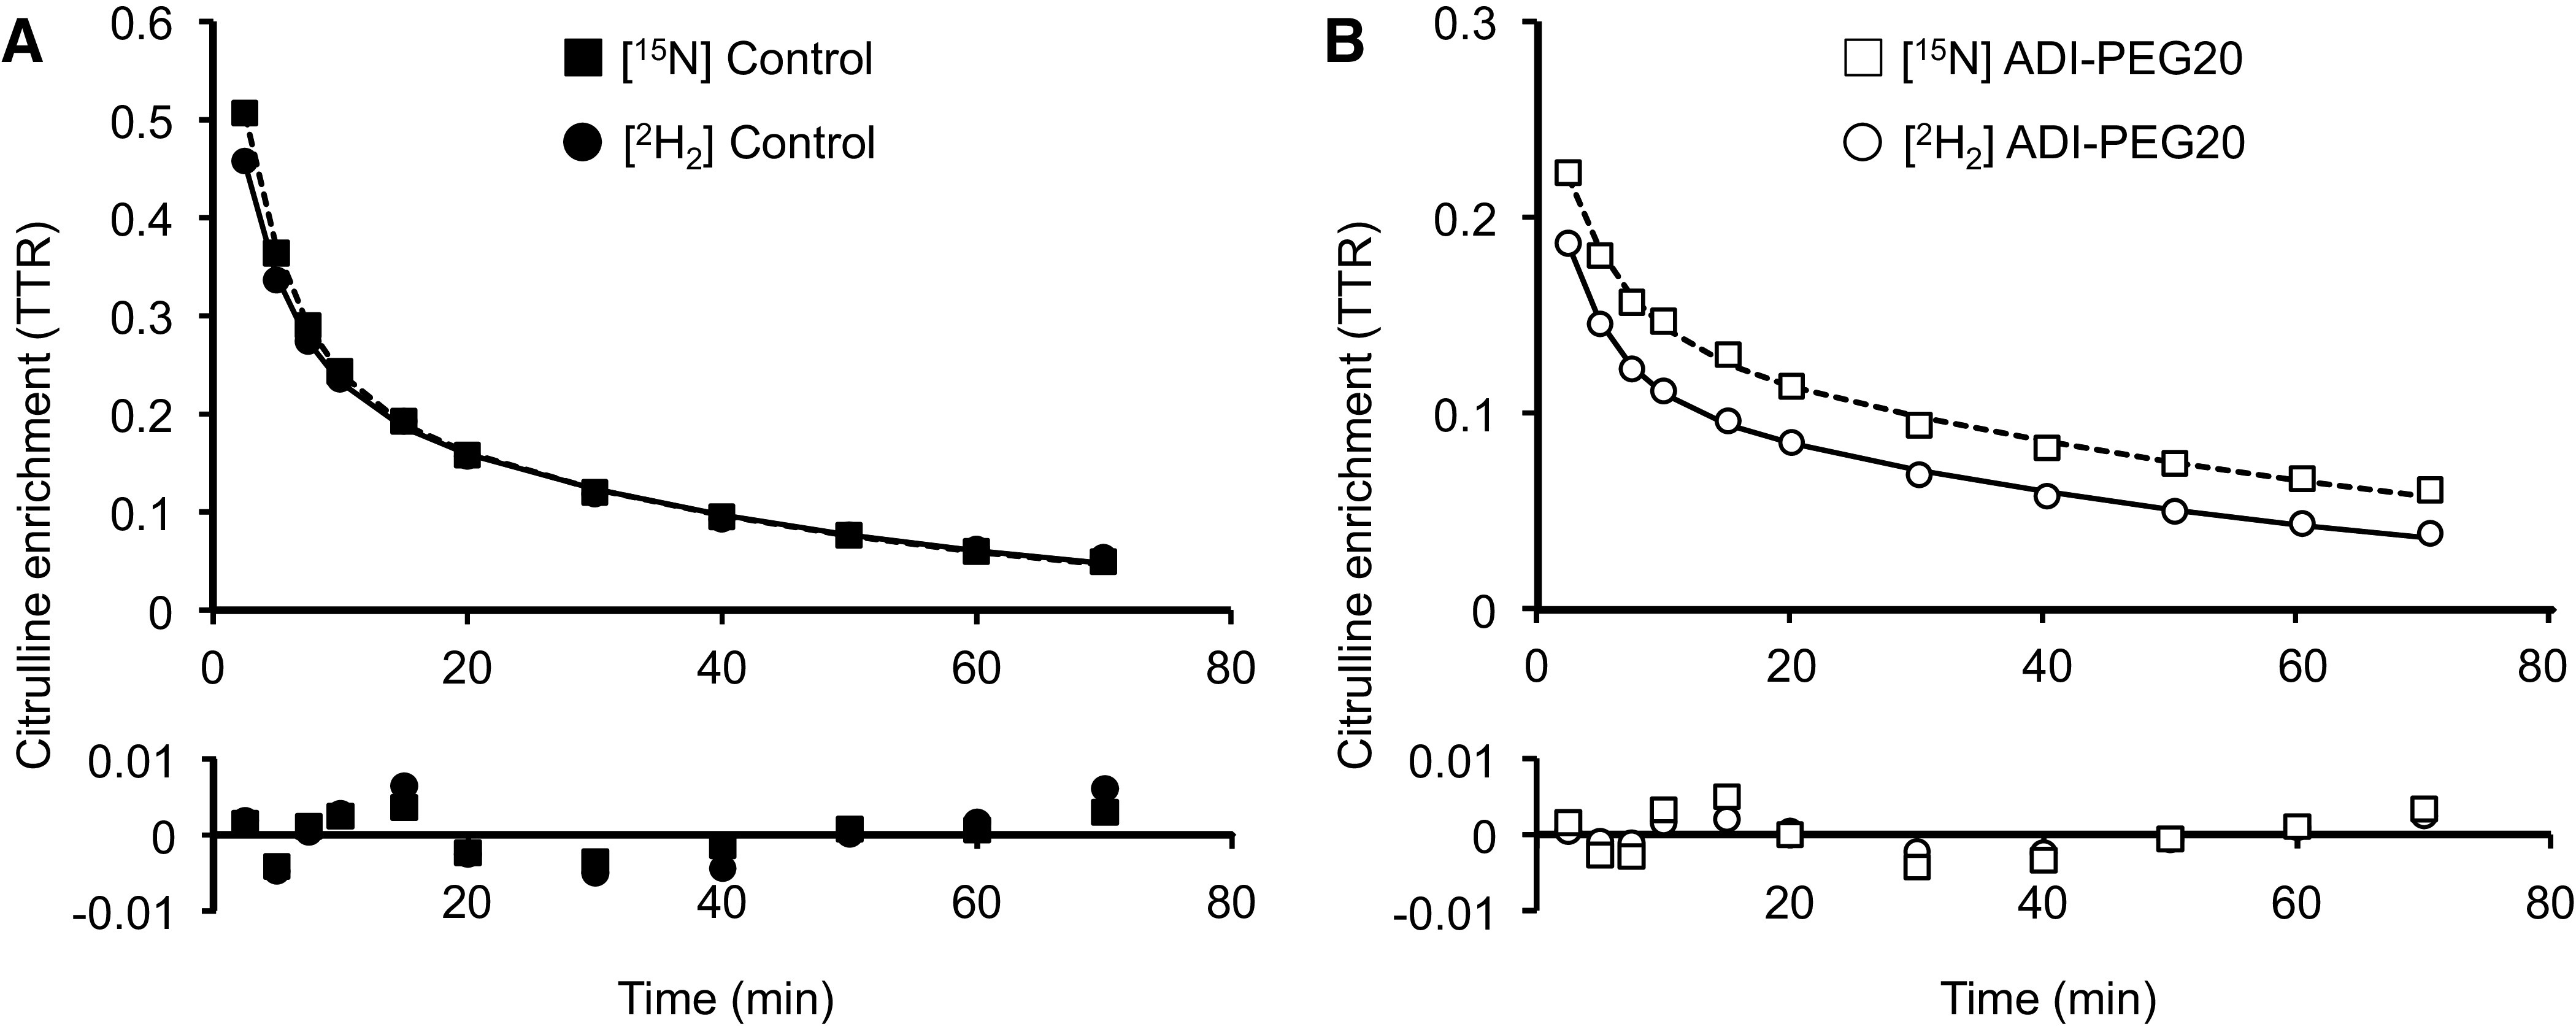
Plasma (ureido)[15N]citrulline and 5,5-[2H2]citrulline enrichments in a representative Control (A) and an ADI-PEG20-treated (B) pig. A biexponential model was fitted to the data. Each symbol represents a single observation. The residuals (observed enrichment–predicted enrichment) are shown, and pseudo-R2 were between 0.9953 and 0.9995. ADI-PEG20, pegylated arginine deiminase; TTR, trace-to-tracee ratio.
Table 1.
Biexponential model fitting and estimated parameters from plasma enrichment data obtained in control and ADI-PEG20-treated pigs after the bolus administration of (ureido)[15N]citrulline and 5,5-[2H2]citrulline tracers
| Item | Control | ADI-PEG20 | P< |
|---|---|---|---|
| M1, (TTR) | |||
| [15N] | 0.479 ± 0.098 | 0.164 ± 0.011 | * |
| [2H2] | 0.586 ± 0.048 | 0.205 ± 0.023 | * |
| g1, (min−1) | |||
| [15N] | 0.240 ± 0.006 | 0.231 ± 0.012 | 0.55 |
| [2H2] | 0.268 ± 0.010 | 0.216 ± 0.008 | 0.015 |
| M2, (TTR) | |||
| [15N] | 0.275 ± 0.032 | 0.113 ± 0.010† | * |
| [2H2] | 0.349 ± 0.047 | 0.147 ± 0.009† | * |
| g2, (min−1) | |||
| [15N] | 0.024 ± 0.000 | 0.016 ± 0.001 | 0.008 |
| [2H2] | 0.025 ± 0.002 | 0.014 ± 0.001 | 0.006 |
| Pseudo-R2 | |||
| [15N] | (0.998–0.999)‡ | (0.995–0.998) | |
| [2H2] | (0.997–0.999) | (0.991–0.999) |
Values are means ± SE, n = 3 or 4 pigs.
Different tracer doses were given to the control and ADI-PEG20 treatment groups and for this reason no treatment comparison were made.
Tracer difference (P < 0.001; paired t test).
For pseudo-R2, ranges are shown.
ADI-PEG20, pegylated arginine deiminase; TTR, tracer/tracee enrichment.
Due to the virtual absence of plasma arginine in ADI-PEG20-treated pigs, no arginine isotopic enrichments were measurable in these animals. In the control pigs, the biexponential model resulted in a good fit for the [13C6]arginine tracer data (pseudo-R2 > 0.998, and no evident pattern for the residuals; results not shown).
Citrulline and Arginine Kinetics
The increase in plasma citrulline concentration due to ADI-PEG20 treatment resulted in larger (P < 0.01) citrulline pools for these pigs (Table 2). Although the pool sizes determined with the [15N] or [2H2] tracer were not different (P > 0.25) for the control pigs, they were ∼30% greater (P < 0.05) in ADI-PEG20-treated pigs when determined with the [15N] label (Table 2). Irrespective of treatment or tracer used for its determination, the size of the inaccessible pool (pool B) was ∼30%–50% larger than the sampled pool (pool A; Table 2). Likewise, the volume of distribution of these two pools was larger when determined with the [15N] label in pigs treated with ADI-PEG20 (P < 0.03), but did not reach significance in the control group. No differences (P > 0.20) in the volume of distribution were observed between the control and ADI-PEG20-treated groups.
Table 2.
Citrulline pool sizes, fluxes, and disposal parameters in Control and ADI-PEG20-treated pigs determined with a bolus dose of (ureido)[15N]citrulline and 5,5-[2H2]citrulline
| Item | Control | ADI-PEG20 | P< |
|---|---|---|---|
| Pool sizes | |||
| Plasma Citrulline, µmol/L | 50 ± 2.5 | 552 ± 36.3 | 0.001 |
| Pool A, Qa, µmol/kg | |||
| [15N] | 14.2 ± 2.0 | 177.1 ± 7.3† | 0.001/0.05† |
| [2H2] | 11.2 ± 1.4 | 139.6 ± 9.4† | 0.001 |
| Pool A, volume, L/kg | |||
| [15N] | 0.280 ± 0.031 | 0.325 ± 0.026† | 0.325/0.05† |
| [2H2] | 0.221 ± 0.018 | 0.255 ± 0.016† | 0.217 |
| Pool B, Qb, µmol/kg | |||
| [15N] | 21.5 ± 1.8 | 251.7 ± 37.9† | 0.009 /0.05† |
| [2H2] | 17.5 ± 3.1 | 186.0 ± 20.2† | 0.003 |
| Pool B, volume, L/kg | |||
| [15N] | 0.426 ± 0.021 | 0.458 ± 0.062† | 0.654/0.05† |
| [2H2] | 0.345 ± 0.046 | 0.341 ± 0.040† | 0.952 |
| Fluxes | |||
| Fob, µmol·kg−1·h−1 | |||
| [15N] | 46.3 ± 5.2 | 375.6 ± 16.6† | 0.001/0.001† |
| [2H2] | 39.1 ± 5.8 | 257.1 ± 17.0† | 0.001 |
| Fba, µmol·kg−1·h−1 | |||
| [15N] | 134.7 ± 15.1 | 1509.8 ± 64.4† | 0.001/0.01† |
| [2H2] | 118.7 ± 12.9 | 1087.0 ± 56.3† | 0.001 |
| Fab, (µmol·kg−1·h−1 | |||
| [15N] | 88.4 ± 10.1 | 1134.3 ± 55.2† | 0.001/0.01† |
| [2H2] | 79.6 ± 7.8 | 829.9 ± 41.3† | 0.001 |
| Disposal parameters | |||
| Half-life, min | |||
| [15N] | 29.2 ± 0.3 | 44.4 ± 3.7 | 0.026 |
| [2H2] | 28.0 ± 1.7 | 49.8 ± 2.9 | 0.002 |
| MRT, min | |||
| [15N] | 36.7 ± 0.2 | 58.5 ± 4.6 | 0.017 |
| [2H2] | 35.4 ± 2.4 | 66.2 ± 4.1 | 0.002 |
| Clearance, L·kg−1·h−1 | |||
| [15N] | 0.92 ± 0.07 | 0.68 ± 0.02† | 0.079/0.001† |
| [2H2] | 0.77 ± 0.08 | 0.47 ± 0.02† | 0.047 |
Values are means ± SE, n = 3 or 4 pigs.
ADI-PEG20, pegylated arginine deiminase; MRT, mean retention time.
Tracer difference within treatment (paired t test).
As expected, ADI-PEG20-treated pigs had a greater (P < 0.001) citrulline flux exiting the system (Fob) than Control animals (Table 2). ADI-PEG20-treated pigs also had greater (P < 0.001) exchange of citrulline between the two pools (Fba and Fab). Although both [15N] and [2H2] tracers yielded similar fluxes (P > 0.23) in the control group, the [15N] label gave fluxes ∼40% greater (P < 0.003) than the [2H2] tracer (Table 2).
ADI-PEG20-treated pigs showed a greater (P < 0.03) citrulline half-life and MRT than their Control counterparts irrespective of the tracer used to determine these parameters (Table 2). The clearance of citrulline instead was greater (P < 0.05) in the control pigs when determined with the [2H2] tracer, but did not reach significance (P = 0.079) when determined with the [15N] label. Regardless, the clearance of citrulline was greater (P < 0.001) in ADI-PEG20-treated pigs when measured with the [15N] tracer.
The size of the inaccessible arginine pool in the Control pigs was almost three times larger than the accessible pool (60 ± 10.0 and 21 ± 3.6 µmol/kg, respectively), and the corresponding volumes of distribution were 0.73 ± 0.01 and 0.26 ± 0.01 L/kg. The flux of arginine exiting the system was 210 ± 14 µmol·kg−1·h−1 and the disposal parameters were 14.8 ± 3.6 min for arginine half-life, 15.4 ± 3.3 min for MRT, and 3.1 ± 0.6 L·kg−1·h−1 for clearance rate.
The continuous infusion of tracers showed a greater (P < 0.006) RaCitrulline in the ADI-PEG20-treated pigs than their Control counterparts (Table 3). Although both [15N]- and [2H2]citrulline tracers yielded similar RaCitrulline (P > 0.12) for the Control group, the [15N] label resulted in ∼40% greater (P < 0.007) RaCitrulline than the [2H2] label in the ADI-PEG20-treated group. The RaArginine in the control pigs was 153 µmol·kg−1·h−1, the RcCittoArg (de novo arginine synthesis) was not different (P = 0.45) when determined with the [15N]- or [2H2]citrulline tracer, and the RcArgtoCit (a proxy for nitric oxide production) was 0.7 µmol·kg−1·h−1 (Table 3).
Table 3.
Rate of appearance and interconversion of selected metabolites in Control and ADI-PEG20-treated pigs infused continuously using a multitracer protocol
| Item | Control | ADI-PEG20 | P< |
|---|---|---|---|
| Rate of appearance, µmol·kg−1·h−1 | |||
| Citrulline | |||
| [15N] | 27 ± 5 | 278 ± 33† | 0.004/0.007† |
| [2H2] | 24 ± 5 | 199 ± 27† | 0.006 |
| Arginine | 153 ± 12 | ND | |
| Phenylalanine | 153 ± 16 | 143 ± 11 | 0.63 |
| Tyrosine | 104 ± 5 | 103 ± 4 | 0.83 |
| Leucine | 329 ± 27 | 328 ± 18 | 0.98 |
| GAA | 11 ± 1 | 22 ± 2 | 0.008 |
| Rate of conversion, µmol·kg−1·h−1 | |||
| Cit to Arg* | |||
| [15N] | 15.4 ± 0.6 | ND | |
| [2H2] | 14.4 ± 0.6 | ND | |
| Arg to Cit | 0.7 ± 0.0 | ND | |
| Phe to Tyr* | 4.2 ± 0.7 | 4.3 ± 0.4 | 0.98 |
Values are means ± SE, n = 4 pigs.
†Tracer difference within treatment (paired t test).
ADI-PEG20, pegylated arginine deiminase; GAA, guanidinoacetate acid; ND not detected.
*Cit to arg, citrulline to arginine (de novo arginine synthesis); arg to cit, arginine to citrulline (nitric oxide production); phe to tyr, phenylalanine to tyrosine (hydroxylation).
Tissue Arginine and Citrulline Concentrations and Enrichments
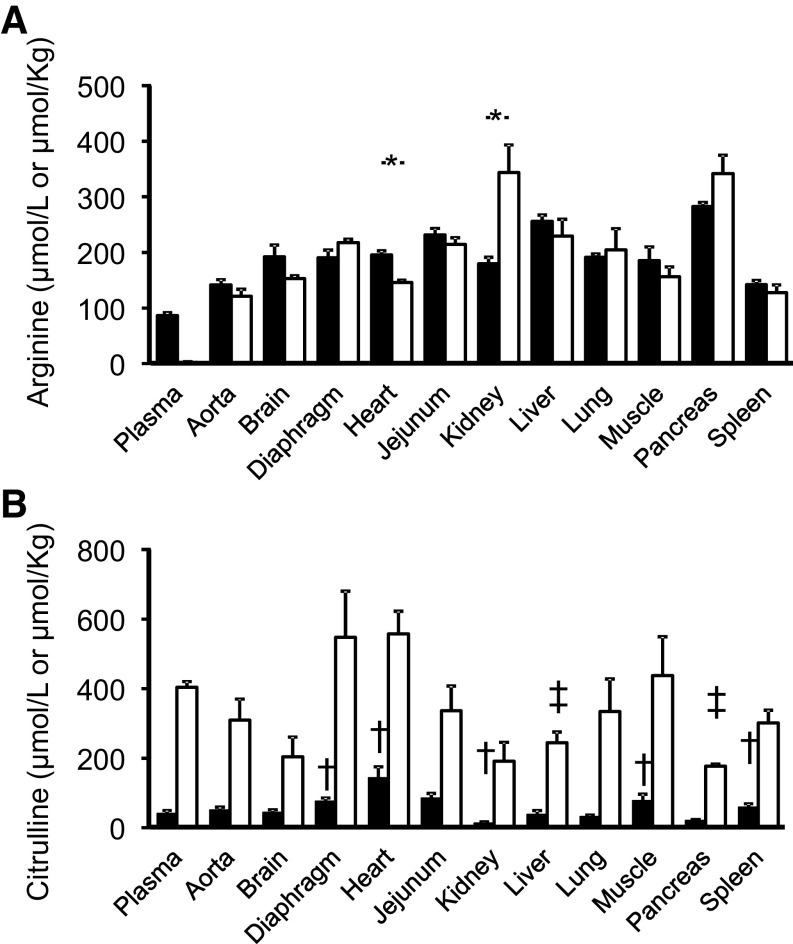
In Control pigs, the concentration of arginine was greater (P < 0.001) in tissues (µmol/kg) than in plasma (µmol/L; Fig. 5A). Despite the virtual absence of plasma arginine in ADI-PEG20-treated pigs, there was no treatment difference (P > 0.12) in arginine tissue concentration for most tissues analyzed (Fig. 5A). The exceptions were heart tissue that had a lower (P < 0.004) arginine concentration in ADI-PEG20-treated pigs than in the Control group, and kidney tissue, which showed the opposite effect (P < 0.02; Fig. 5A).
Figure 5.
Plasma and tissue arginine (A) and citrulline (B) concentrations in Control and ADI-PEG20-treated pigs. Bars are means ± SE, n = 4 pigs. All tissues had a greater arginine concentration (µmol/kg) than plasma (µmol/L; not shown in the figure for clarity of presentation). *Treatment differences (P < 0.05). Plasma and tissue citrulline concentrations were greater (P < 0.001) in ADI-PEG20-treated pigs than in Control animals (not shown for clarity). †,‡Tissue differences (P < 0.05) with the corresponding plasma concentration (†, Control; ‡, ADI-PEG20). ADI-PEG20, pegylated arginine deiminase.
Tissue citrulline concentration, in contrast, was 4- to 15-fold greater (P < 0.001) for all the tissues analyzed in ADI-PEG20-treated pigs than in their Control counterparts (Fig. 5B). There were no differences (P > 0.10) in the concentration of citrulline between plasma and most tissues analyzed for the Control group. The exceptions were diaphragm (P < 0.009), heart (P < 0.043), muscle (P < 0.039), and spleen (P < 0.014), which showed a greater tissue concentration than plasma, and kidney (P < 0.011) which was lower (Fig. 5B). For ADI-PEG20-treated pigs, most tissues had similar concentration to plasma except liver (P < 0.011) and pancreas (P < 0.004), which showed lower citrulline concentrations (Fig. 5B).
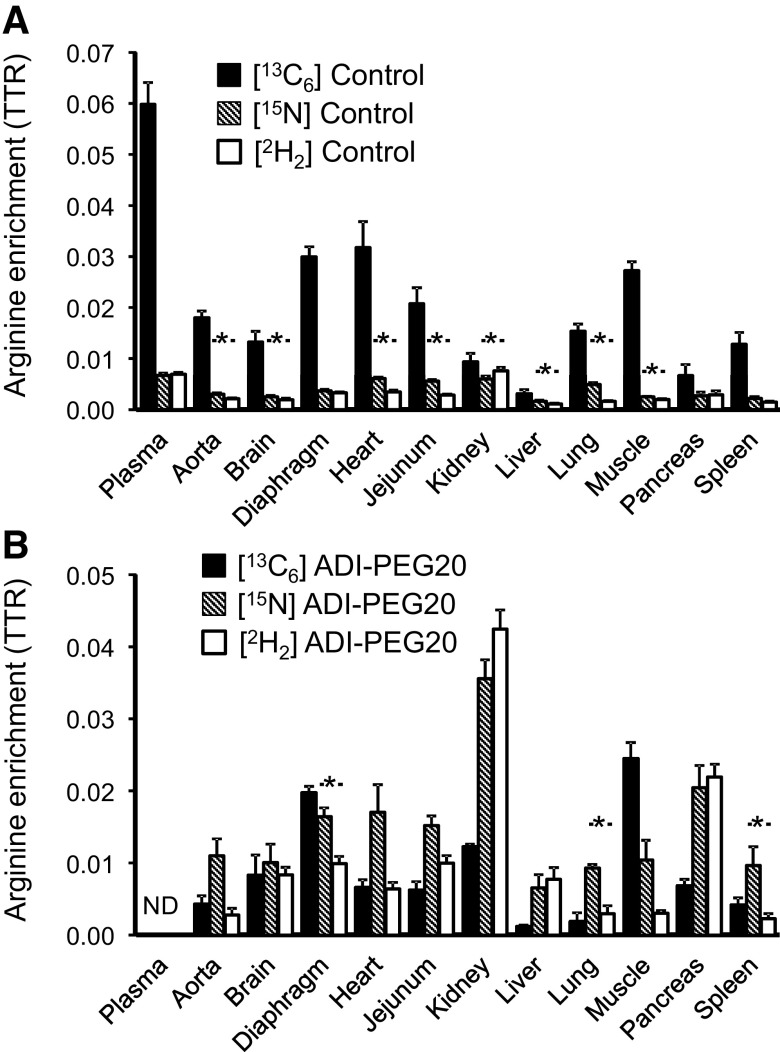
In control pigs, plasma [13C6]arginine enrichment was greater (P < 0.001) than in the tissues studied (Fig. 6A). Because of the arginine depletion, we were not able to determine plasma arginine enrichments in the ADI-PEG20-treated pigs (Fig. 6B). However, tissue enrichments were measurable and notably no differences were observed with the Control treatment for brain (P = 0.21), kidney (P = 0.19), muscle (P = 0.39), and pancreas (P = 0.95).
Figure 6.
Plasma and tissue [13C6]-, [15N]-, and [2H2]arginine enrichments in Control (A) and ADI-PEG20-treated (B) pigs. Bars are means ± SE. In control pigs, plasma enrichments for the three tracers were higher (P < 0.01) than for all the tissues studied (not shown in the figure for clarity of presentation). In ADI-PEG20-treated pigs, arginine enrichments could not be detected (ND) due to the arginine depletion caused by the drug. *[15N] and [2H2] enrichment differences (P < 0.05) within treatment. ADI-PEG20, pegylated arginine deiminase; TTR, tracer-to-tracee ratio.
For most tissues in control pigs, [15N]arginine enrichment was greater (P < 0.05) than [2H2]arginine enrichment, although plasma, diaphragm, pancreas, and spleen showed no differences (P > 0.10). In contrast, in ADI-PEG20-treated pigs, only diaphragm, lung, and spleen showed a greater (P < 0.05) [15N]arginine enrichment. The correlation between [15N]- and [2H2]arginine enrichments was 0.70 for the Control treatment and 0.78 for ADI-PEG20.
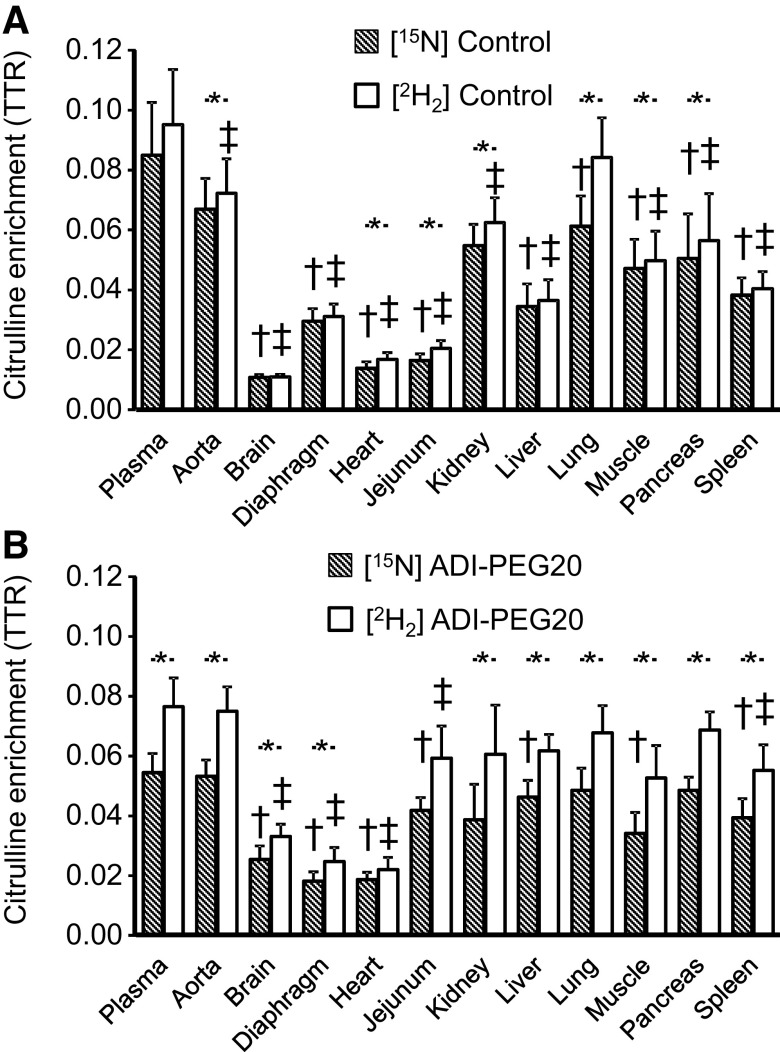
In control pigs, most tissues had a lower (P < 0.05) or tended (P < 0.10) to have a lower [15N]- and [2H2]citrulline enrichment than the corresponding plasma enrichments (Fig. 7A). The exception were aorta [15N] enrichment and lung [2H2] citrulline enrichment (P > 0.10). The [2H2]citrulline tracer resulted in greater (P < 0.05) enrichment (than the [15N] tracer) in aorta, heart, jejunum, kidney, lung, muscle, and pancreas (Fig. 7A).
Figure 7.
Plasma and tissue [15N]- and [2H2]citrulline enrichments in Control (A) and ADI-PEG20-treated (B) pigs. Bars are means ± SE, n = 4 pigs. *Tracer differences (P < 0.05). †,‡Tissue differences (P < 0.05) with the corresponding plasma enrichment (†, [15N]citrulline; ‡, [2H2]citrulline). ADI-PEG20, pegylated arginine deiminase; TTR, tracer-to-tracee ratio.
For the ADI-PEG20-treated pigs, some tissue [15N]- and [2H2]citrulline enrichments were not different from plasma values (aorta, kidney, lung, and pancreas), whereas other tissues showed lower (P < 0.05) enrichments (Fig. 7B). The citrulline enrichment of [15N] was lower than the citrulline enrichment of [2H2] for all tissues, with the exception of heart and jejunum that did not reach significance (P < 0.056 and 0.081, respectively; Fig. 7B).
High correlations between the [15N]- and [2H2]citrulline enrichments were observed for both treatments, but the regression coefficient was greater for the Control treatment (Control [2H2] = 0.875 × [15N], r = 0.983; ADI-PEG20 [2H2] = 0.705 × [15N], r = 0.966).
Phenylalanine, Tyrosine, Leucine, Urea, and NOx Kinetics, Tissue Concentrations, and Tissue Enrichments
In the bolus tracer infusion group, no treatment differences (P > 0.10) were observed for plasma tyrosine and leucine concentrations, but plasma phenylalanine concentration was greater in the pigs treated with ADI-PEG20 (P < 0.038), which translated into larger pool sizes (Table 4). However, for the continuous tracer infusion group, no treatment differences were detected in the plasma concentration of these three amino acids (P > 0.56, Fig. 8A).
Table 4.
Phenylalanine, tyrosine, leucine, urea, and NOx fluxes and disposal parameters in Control and ADI-PEG20-treated pigs determined with a bolus dose of (ring)[2H5] phenylalanine, 3,3-[2H2]tyrosine, 1-[13C]leucine, [13C18O]urea, and [15N18O3]nitrate
| Item | Control | ADI-PEG20 | P< |
|---|---|---|---|
| Phenylalanine | |||
| Concentration, µmol/L | 67 ± 1 | 87 ± 6 | 0.038 |
| Pool A, Qa, µmol/kg | 22 ± 4 | 32 ± 3 | 0.095 |
| Pool B, Qb, µmol/kg | 49 ± 2 | 61 ± 3 | 0.042 |
| Fob, µmol·kg−1·h−1 | 137 ± 18 | 183 ± 3 | 0.13 |
| Half-life, min | 20.5 ± 3.4 | 18.9 ± 1.1 | 0.68 |
| Clearance, L·kg−1·h−1 | 2.0 ± 0.2 | 2.1 ± 0.1 | 0.80 |
| Tyrosine | |||
| Concentration, µmol/L | 48 ± 9 | 82 ± 14 | 0.12 |
| Pool A, Qa, µmol/kg | 14 ± 1 | 21 ± 3 | 0.14 |
| Pool B, Qb, µmol/kg | 41 ± 4 | 48 ± 9 | 0.53 |
| Fob, µmol·kg−1·h−1 | 120 ± 5 | 142 ± 12 | 0.17 |
| Half-life, min | 17.5 ± 1.4 | 17.7 ± 1.7 | 0.94 |
| Clearance, L·kg−1·h−1 | 2.6 ± 0.4 | 1.9 ± 0.3 | 0.16 |
| Leucine | |||
| Concentration, µmol/L | 146 ± 10 | 141 ± 12 | 0.81 |
| Pool A, Qa, µmol/kg | 63 ± 14 | 60 ± 9 | 0.89 |
| Pool B, Qb, µmol/kg | 114 ± 10 | 111 ± 15 | 0.88 |
| Fob, µmol·kg−1·h−1 | 477 ± 14 | 544 ± 13 | 0.047 |
| Half-life, min | 13.4 ± 1.4 | 11.3 ± 1.0 | 0.33 |
| Clearance, L·kg−1·h−1 | 3.3 ± 0.3 | 3.9 ± 0.3 | 0.25 |
| Urea | |||
| Pool A, Qa, µmol/kg | 1,483 ± 263 | 1,194 ± 60 | 0.39 |
| Pool B, Qb, µmol/kg | 1,502 ± 226 | 1,236 ± 175 | 0.40 |
| Fob, µmol·kg−1·h−1 | 608 ± 73 | 476 ± 64 | 0.24 |
| Half-life, min | 200 ± 15 | 219 ± 28 | 0.58 |
| NOx | |||
| Pool A, Qa, µmol/kg | 53 ± 10 | 59 ± 16 | 0.79 |
| Pool B, Qb, µmol/kg | 48 ± 14 | 45 ± 9 | 0.84 |
| Fob, µmol·kg−1·h−1 | 20 ± 5 | 17 ± 4 | 0.66 |
| Half-life, min | 208 ± 16 | 250 ± 43 | 0.42 |
Values are means ± SE, n = 3 or 4 pigs.
ADI-PEG20, pegylated arginine deiminase; NOx, nitrate + nitrate.
Figure 8.
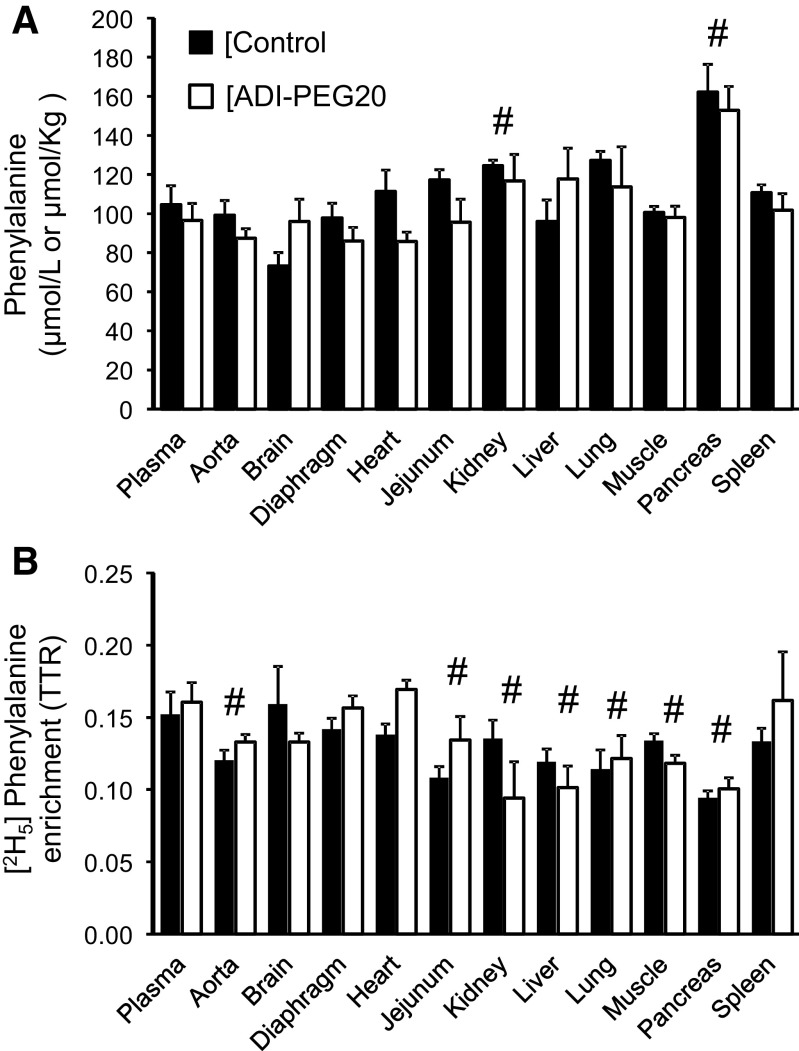
Plasma and tissue phenylalanine concentrations (A) and [2H5] phenylalanine enrichments (B) of Control and ADI-PEG20-treated pigs. Bars are means ± SE, n = 4 pigs. No treatment effect (P > 0.05) was observed for concentrations or enrichments. #Differences between tissues and the corresponding plasma values (P < 0.05). ADI-PEG20, pegylated arginine deiminase; TTR, tracer-to-tracee ratio.
Model fitting for [2H5]phenylalanine, [2H4]tyrosine, 1-[13C] leucine, [13C18O]urea, and [15N18O2]NOx plasma enrichments was done similarly to the one conducted for the citrulline and arginine tracer data; the biexponential fitted curves had pseudo-R2 greater than 0.996, 0.997, 0.997, 0.994, and 0.965, respectively. No differences were observed for the fluxes, half-lives, and clearances of these metabolites between the two treatments with the exception that the flux of leucine was greater in the ADI-PEG20 group (P < 0.047; Table 4). Nonetheless, no treatment differences in the rate of appearance of phenylalanine, tyrosine, and leucine (P > 0.63), or in the rate of conversion of phenylalanine into tyrosine (P = 0.98), were present in the continuous tracer infusion group (Table 3). However, the rate of appearance of GAA was greater (P < 0.008) in the ADI-PEG20-treated pigs than in the control animals.
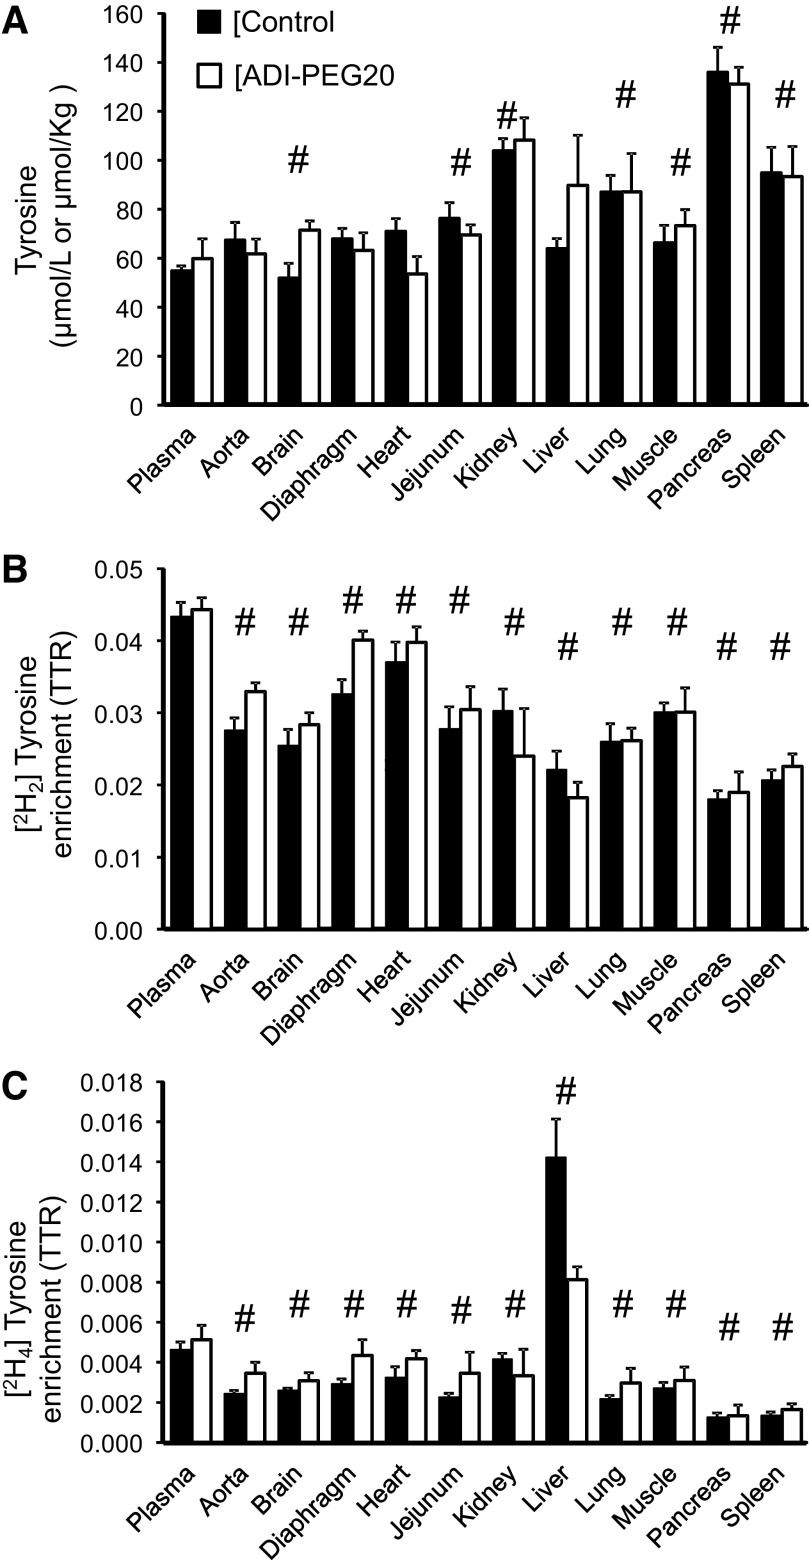
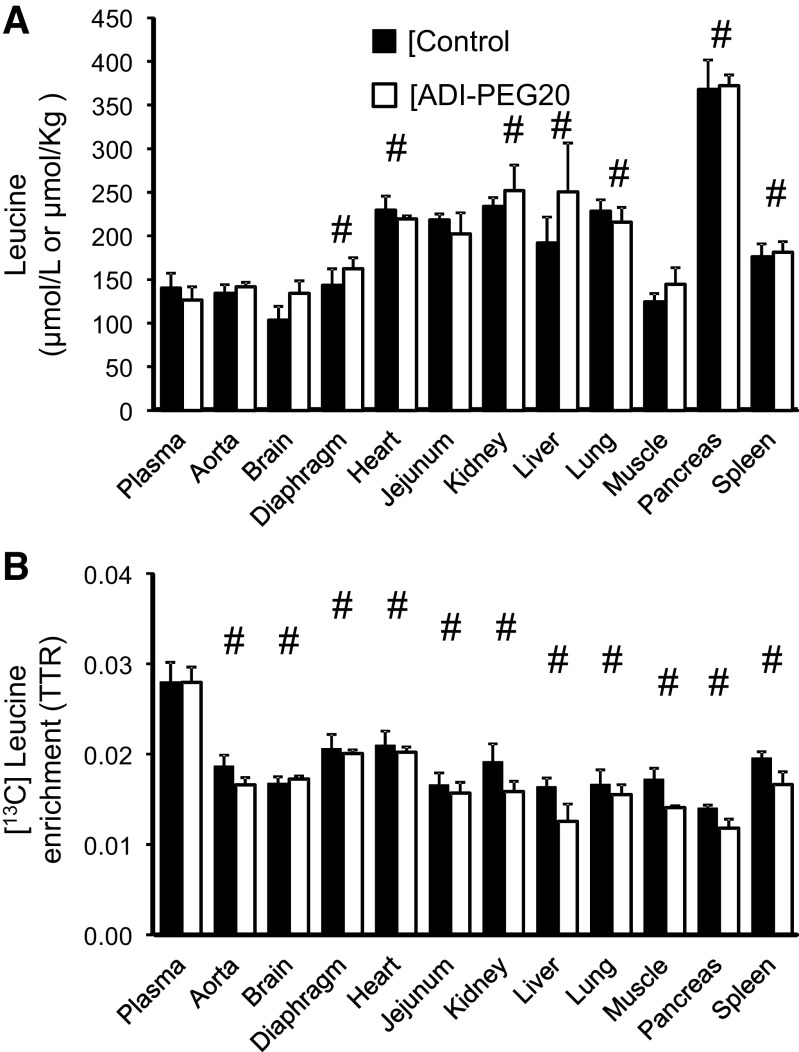
No treatment differences were found for tissue phenylalanine, tyrosine, and leucine concentrations (Figs. 8A, 9A, and 10A) with the exception of a greater tyrosine concentration in the brain of pigs in the control group (P < 0.034). For the most part, tissue concentrations of these three amino acids were similar or greater (P < 0.05) than their corresponding plasma concentration (Figs. 8A, 9A, and 10A). The exception was heart phenylalanine concentration that was lower in the ADI-PEG20-treated group (P < 0.034; Fig. 8A).
Figure 9.
Plasma and tissue tyrosine concentrations (A) and [2H2]- and [2H4]-tyrosine enrichments (B and C, respectively) of Control and ADI-PEG20-treated pigs. Bars are means ± SE, n = 4 pigs. No treatment effect (P > 0.05) was observed for concentrations or enrichments. #Differences between tissues and the corresponding plasma values (P < 0.05). ADI-PEG20, pegylated arginine deiminase; TTR, tracer-to-tracee ratio.
Figure 10.
Plasma and tissue leucine concentrations (A) and [13C] leucine enrichments (B) of Control and ADI-PEG20-treated pigs. Bars are means ± SE, n = 4 pigs. No treatment effect (P > 0.05) was observed for concentrations or enrichments. #Differences between tissues and the corresponding plasma values (P < 0.05). ADI-PEG20, pegylated arginine deiminase; TTR, tracer-to-tracee ratio.
Tissue [2H5]phenylalanine, [2H2]tyrosine, and 1-[13C]leucine enrichments were lower than in plasma for all the tissues collected (P < 0.05; Figs. 8B, 9B, and 10B) with the exception of brain, diaphragm, heart, and spleen, where [2H5]phenylalanine enrichments were not statistically different from the plasma enrichments of this amino acid (P > 0.10; Fig. 8B). Tissue [2H4]tyrosine enrichment (the product of [2H5]phenylalanine hydroxylation), in contrast, was lower than plasma for all the tissues analyzed with the exception of the liver, which showed greater enrichments (P < 0.001, Fig. 9C).
DISCUSSION
Arginine is considered a semi-indispensable amino acid, because its endogenous synthesis does not always meets the demand for its multiple functions (27). The endogenous synthesis of arginine relies on the production of citrulline by the small intestine and its conversion (mainly) by the kidney, in what has been called the “intestinal-renal axis” for arginine production (1, 28). Note that the concept of amino acid essentiality refers to the whole organism and not to individual cells or tissues, since two different cell types are needed for arginine synthesis. Thus, arginine is always essential in cell culture, unless citrulline is supplied in the media (29).
As described before for other species, including humans, ADI-PEG20 depleted circulating arginine (7, 9, 15). Here, we have shown that the administration of ADI-PEG20 to pigs resulted in a total and almost instantaneous depletion of circulating arginine. However, plasma citrulline did not reach its maximal concentration until hours after the dosing of the drug. Arginine depletion by ADI-PEG20 had no effect on nitric oxide production, measured here as the flux of NOx, and despite this drastic reduction in global arginine availability, there were no effects on blood pressure, heart rate, or whole protein metabolism. Protein degradation (inferred from phenylalanine and leucine fluxes and rates of appearance) and synthesis (from nonhydroxylative disposal of phenylalanine) were virtually identical between the Control and the ADI-PEG20 groups despite the total depletion in circulating arginine in the ADI-PEG20-treated pigs. These observations agree with our previous work in mice, which showed no ADI-PEG20 effect in whole protein synthesis and fractional protein synthesis rate in multiple tissues (7). Furthermore, urea kinetics indicated that ADI-PEG20 did not affect whole body nitrogen metabolism. The rate of appearance of GAA, in contrast, was increased in the pigs that received the ADI-PEG20 treatment.
During the postprandial period, plasma arginine originates from protein turnover and from de novo synthesis and, after entering this circulating pool, is utilized by different tissues and organs (1). The action of ADI-PEG20 on circulating arginine implies that the interorgan metabolism of arginine is disrupted and that the different tissues rely on their ability to produce their own arginine to meet their needs. However, this ability also depends on the availability of citrulline, since arginine depletion by arginase and without citrulline supplementation results in death (30). Thus, the large increase in plasma citrulline observed in the present study should be able to provide intracellular ASS1 and ASL with enough substrate to maintain local tissue arginine concentration thus meeting the requirement for this amino acid. This presumption was confirmed by the measured tissue arginine in ADI-PEG20-treated pigs, since (with the exception of heart) all tissues had concentrations that did not differ from the ones observed in control animals.
Interestingly, kidney arginine concentration in ADI-PEG20-treated pigs was approximately twofold greater than in controls, consistent with the high expression of ASS1 and ASL in this organ (25) and with the large citrulline availability present. Citrulline seems to be channeled in the kidney for the production of GAA (31, 32) and this is the likely explanation for the increase in GAA production in the ADI-PEG20-treated animals. Furthermore, kidney citrulline concentration in Control pigs was lower than in plasma, which further supports the concept that citrulline availability is the limiting factor for the endogenous arginine synthesis under normal conditions (33).
The depletion of arginine by enhanced arginase activity during pathological conditions such as sepsis, trauma (including surgical trauma), and sickle cell disease (10–13) results in the production of urea and ornithine. Although most of this ornithine produced will be either oxidized or used for some other processes, a fraction may reach the gut where it can be utilized by the enterocytes for the synthesis of citrulline (4, 26). However, citrulline production is reduced under sepsis and other pathological conditions (34, 35). The depletion of arginine by ADI-PEG20, in contrast, produces equimolar amounts of citrulline that then can be used to resynthesize arginine. This was demonstrated by the presence of [13C6]arginine in tissue (but not in plasma) of ADI-PEG20-treated pigs. Because no arginine circulates, arginase has limited access to arginine and despite increased whole body arginase activity, less arginine would be metabolized through this pathway. In this way, the depletion caused by ADI-PEG20 preempts arginine depletion by arginase, generating citrulline, which is then used by the citrulline recycling pathway thus maintaining intracellular arginine availability.
This continuous recycling of arginine-citrulline-arginine due to ADI-PEG20 is evident from the different kinetics of the two citrulline tracers. Although the 5,5-[2H2] label stays in the molecule after each deimination-arginine synthesis cycle, the (ureido)[15N] label has 50% chance to be lost as 15NH4. This translated into a greater clearance of [15N]citrulline, but we lacked statistical power to detect similar differences between the two tracers for half-lives and MRT. Not only greater tissue [2H2]- than [15N]citrulline enrichments were found for most tissues of ADI-PEG20-treated pigs but also this was true for some tissues of Control pigs. This suggests that these tracers may also be able to detect the effect of the nitric oxide synthase and intracellular recycling of citrulline pathways.
However, it is difficult to reconcile the low tissue citrulline enrichments observed (compared with plasma) with the known magnitude of the nitric oxide synthase pathway and the present estimation of this pathway. Although the low citrulline enrichment in the jejunum of Control pigs, for example, can be explained by the dilution of the labels by (unlabeled) citrulline produced endogenously in enterocytes, it is unclear how these citrulline tracers were diluted in other tissues. These observations, however, are unlikely to be an artifact because both citrulline tracers behaved similarly and the tissue dilution of phenylalanine and leucine (by protein turnover; ∼80 and 60%, respectively) were within previous reported values (36, 37). Regardless, these observations certainly warrant further research and validation.
In conclusion, ADI-PEG20 administration resulted in an absolute and almost instantaneous depletion of circulating arginine, thus reducing global availability without affecting cardiovascular parameters and protein metabolism. The citrulline produced from the deimination of arginine was in turn utilized by the citrulline recycling pathway restoring local tissue arginine availability. The utilization of ADI-PEG20 to preempt arginine depletion by arginase may be a valuable tool to maintain arginine supply to tissues in certain pathophysiological conditions.
GRANTS
This work was supported by federal funds from the US Department of Agriculture, Agricultural Research Service under Cooperative Agreement Number 58-6250-6-001, and the National Institutes of Health (R01 GM108940).
DISCLOSURES
No conflicts of interest, financial or otherwise, are declared by the authors.
AUTHOR CONTRIBUTIONS
J.C.M. conceived and designed research; M.A.M., I.C.D., B.S., T.C.N., and J.C.M. performed experiments; J.C.M. analyzed data; J.C.M. interpreted results of experiments; J.C.M. prepared figures; J.C.M. drafted manuscript; M.A.M. and J.C.M. edited and revised manuscript; M.A.M., I.C.D., B.S., T.C.N., and J.C.M. approved final version of manuscript.
ACKNOWLEDGMENTS
We thank Polaris Pharmaceutical, Inc. (San Diego, CA) for the generous gift of ADI-PEG20.
REFERENCES
- 1.Marini JC, Agarwal U, Robinson JL, Yuan Y, Didelija IC, Stoll B, Burrin DG. The intestinal-renal axis for arginine synthesis is present and functional in the neonatal pig. Am J Physiol Endocrinol Metab 313: E233–E242, 2017. doi: 10.1152/ajpendo.00055.2017. [DOI] [PMC free article] [PubMed] [Google Scholar]
- 2.Castillo L, Chapman TE, Sanchez M, Yu YM, Burke JF, Ajami AM, Vogt J, Young VR. Plasma arginine and citrulline kinetics in adults given adequate and arginine-free diets. Proc Natl Acad Sci USA 90: 7749–7753, 1993. doi: 10.1073/pnas.90.16.7749. [DOI] [PMC free article] [PubMed] [Google Scholar]
- 3.Marini JC, Agarwal U, Didelija IC. Dietary arginine requirements for growth are dependent on the rate of citrulline production in mice. J Nutr 145: 1227–1231, 2015. doi: 10.3945/jn.114.209668. [DOI] [PMC free article] [PubMed] [Google Scholar]
- 4.Marini JC, Stoll B, Didelija IC, Burrin DG. De novo synthesis is the main source of ornithine for citrulline production in neonatal pigs. Am J Physiol Endocrinol Metab 303: E1348–E1353, 2012. doi: 10.1152/ajpendo.00399.2012. [DOI] [PMC free article] [PubMed] [Google Scholar]
- 5.Erez A, Nagamani SCS, Shchelochkov OA, Premkumar MH, Campeau PM, Chen Y, Garg HK, Li L, Mian A, Bertin TK, Black JO, Zeng H, Tang Y, Reddy AK, Summar M, O'Brien WE, Harrison DG, Mitch WE, Marini JC, Aschner JL, Bryan NS, Lee B. Requirement of argininosuccinate lyase for systemic nitric oxide production. Nat Med 17: 1619–1626, 2011. doi: 10.1038/nm.2544. [DOI] [PMC free article] [PubMed] [Google Scholar]
- 6.Hermann M, Flammer A, Luscher TF. Nitric oxide in hypertension. J Clin Hypertens (Greenwich) 8: 17–29, 2006. doi: 10.1111/j.1524-6175.2006.06032.x. [DOI] [PMC free article] [PubMed] [Google Scholar]
- 7.Marini JC, Didelija IC. Arginine depletion by arginine deiminase does not affect whole protein metabolism or muscle fractional protein synthesis rate in mice. PLoS ONE 10: e0119801, 2015. doi: 10.1371/journal.pone.0119801. [DOI] [PMC free article] [PubMed] [Google Scholar]
- 8.Marini JC, Didelija IC, Fiorotto ML. Extrarenal citrulline disposal in mice with impaired renal function. Am J Physiol Renal Physiol 307: F660–F665, 2014. doi: 10.1152/ajprenal.00289.2014. [DOI] [PMC free article] [PubMed] [Google Scholar]
- 9.Yuan Y, Mohammad MA, Betancourt A, Didelija IC, Yallampalli C, Marini JC. The citrulline recycling pathway sustains cardiovascular function in arginine-depleted healthy mice, but cannot sustain nitric oxide production during endotoxin challenge. J Nutr 148: 844–850, 2018. doi: 10.1093/jn/nxy065. [DOI] [PMC free article] [PubMed] [Google Scholar]
- 10.Davis JS, Anstey NM. Is plasma arginine concentration decreased in patients with sepsis? A systematic review and meta-analysis. Crit Care Med 39: 380–385, 2011. doi: 10.1097/CCM.0b013e3181ffd9f7. [DOI] [PubMed] [Google Scholar]
- 11.Costa BP, Martins P, Veríssimo C, Simões M, Tomé M, Grazina M, Pimentel J, Castro-Sousa F. Argininemia and plasma arginine bioavailability - predictive factors of mortality in the severe trauma patients? Nutr Metab (Lond) 13: 60, 2016. doi: 10.1186/s12986-016-0118-6. [DOI] [PMC free article] [PubMed] [Google Scholar]
- 12.Morris CR, Kato GJ, Poljakovic M, Wang X, Blackwelder WC, Sachdev V, Hazen SL, Vichinsky EP, Morris SM, Jr, Gladwin MT. Dysregulated arginine metabolism, hemolysis-associated pulmonary hypertension, and mortality in sickle cell disease. JAMA 294: 81–90, 2005. doi: 10.1001/jama.294.1.81. [DOI] [PMC free article] [PubMed] [Google Scholar]
- 13.Navaei AH, Shekerdemian L, Mohammad MA, Coss-Bu JA, Bastero P, Ettinger NA, Orellana R, Fernandes CJ, Marini JC. Derangement of arginine and related amino acids in children undergoing surgery for congenital heart disease with cardiopulmonary bypass. Crit Care Explor 2: e0150, 2020.doi: 10.1097/CCE.0000000000000150. [DOI] [PMC free article] [PubMed] [Google Scholar]
- 14.Phillips MM, Sheaff MT, Szlosarek PW. Targeting arginine-dependent cancers with arginine-degrading enzymes: opportunities and challenges. Cancer Res Treat 45: 251–262, 2013. doi: 10.4143/crt.2013.45.4.251. [DOI] [PMC free article] [PubMed] [Google Scholar]
- 15.Tomlinson BK, Thomson JA, Bomalaski JS, Diaz M, Akande T, Mahaffey N, Li T, Dutia MP, Kelly K, Gong I-Y, Semrad T, Gandara DR, Pan C-X, Lara PN. Jr.. Phase I trial of arginine deprivation therapy with ADI-PEG 20 plus docetaxel in patients with advanced malignant solid tumors. Clin Cancer Res 21: 2480–2486, 2015. doi: 10.1158/1078-0432.CCR-14-2610. [DOI] [PMC free article] [PubMed] [Google Scholar]
- 16.Walts AE, Bomalaski JS, Ines D, Orsulic S. Argininosuccinate synthetase (ASS) deficiency in high-grade pulmonary neuroendocrine carcinoma: an opportunity for personalized targeted therapy. J Cancer Res Clin Oncol 141: 1363–1369, 2015. doi: 10.1007/s00432-014-1904-z. [DOI] [PMC free article] [PubMed] [Google Scholar]
- 17.Abou-Alfa GK, Qin S, Ryoo B-Y, Lu S-N, Yen C-J, Feng Y-H, Lim HY, Izzo F, Colombo M, Sarker D, Bolondi L, Vaccaro G, Harris WP, Chen Z, Hubner RA, Meyer T, Sun W, Harding JJ, Hollywood EM, Ma J, Wan PJ, Ly M, Bomalaski J, Johnston A, Lin C-C, Chao Y, Chen L-T. Phase III randomized study of second line ADI-PEG 20 plus best supportive care versus placebo plus best supportive care in patients with advanced hepatocellular carcinoma. Ann Oncol 29: 1402–1408, 2018. doi: 10.1093/annonc/mdy101. [DOI] [PubMed] [Google Scholar]
- 18.Izzo F, Marra P, Beneduce G, Castello G, Vallone P, De Rosa V, Cremona F, Ensor CM, Holtsberg FW, Bomalaski JS, Clark MA, Ng C, Curley SA. Pegylated arginine deiminase treatment of patients with unresectable hepatocellular carcinoma: results from phase I/II studies. J Clin Oncol 22: 1815–1822, 2004. doi: 10.1200/JCO.2004.11.120. [DOI] [PubMed] [Google Scholar]
- 19.Pasut G, Veronese FM. PEG conjugates in clinical development or use as anticancer agents: an overview. Adv Drug Deliv Rev 61: 1177–1188, 2009. doi: 10.1016/j.addr.2009.02.010. [DOI] [PubMed] [Google Scholar]
- 20.Shen LJ, Shen W-C. Drug evaluation: ADI-PEG-20 - a PEGylated arginine deiminase for arginine-auxotrophic cancers. Curr Opin Mol Ther 8: 240–248, 2006. [PubMed] [Google Scholar]
- 21.Feun L, You M, Wu CJ, Kuo MT, Wangpaichitr M, Spector S, Savaraj N. Arginine deprivation as a targeted therapy for cancer. Curr Pharm Des 14: 1049–1057, 2008. doi: 10.2174/138161208784246199. [DOI] [PMC free article] [PubMed] [Google Scholar]
- 22.Ott PA, Carvajal RD, Pandit-Taskar N, Jungbluth AA, Hoffman EW, Wu B-W, Bomalaski JS, Venhaus R, Pan L, Old LJ, Pavlick AC, Wolchok JD. Phase I/II study of pegylated arginine deiminase (ADI-PEG 20) in patients with advanced melanoma. Invest New Drugs, 31: 425–434, 2013. doi: 10.1007/s10637-012-9862-2. [DOI] [PMC free article] [PubMed] [Google Scholar]
- 23.Carducci C, Carducci C, Santagata S, Adriano E, Artiola C, Thellung S, Gatta E, Robello M, Florio T, Antonozzi I, Leuzzi V, Balestrino M. In vitro study of uptake and synthesis of creatine and its precursors by cerebellar granule cells and astrocytes suggests some hypotheses on the physiopathology of the inherited disorders of creatine metabolism. BMC Neurosci 13: 41, 2012. doi: 10.1186/1471-2202-13-41. [DOI] [PMC free article] [PubMed] [Google Scholar]
- 24.Nagamani SCS, Agarwal U, Tam A, Azamian M, McMeans A, Didelija IC, Mohammad MA, Marini JC. A randomized trial to study the comparative efficacy of phenylbutyrate and benzoate on nitrogen excretion and ureagenesis in healthy volunteers. Genet Med 20: 708–716, 2018. doi: 10.1038/gim.2017.167. [DOI] [PMC free article] [PubMed] [Google Scholar]
- 25.Mohammad MA, Didelija IC, Wang X, Stoll B, Burrin DG, Marini JC. Developmental changes in the utilization of citrulline by neonatal pigs. Am J Physiol Renal Physiol 318: F175–F182, 2020. doi: 10.1152/ajprenal.00469.2019. [DOI] [PMC free article] [PubMed] [Google Scholar]
- 26.Marini JC. Arginine and ornithine are the main precursors for citrulline synthesis in mice. J Nutr 142: 572–580, 2012. doi: 10.3945/jn.111.153825. [DOI] [PMC free article] [PubMed] [Google Scholar]
- 27.Morris SM. Jr. Arginine metabolism revisited. J Nutr 146: 2579S–2586S, 2016. doi: 10.3945/jn.115.226621. [DOI] [PubMed] [Google Scholar]
- 28.Brosnan ME, Brosnan JT. Renal arginine metabolism. J Nutr 134: 2791S–2795S, 2004. doi: 10.1093/jn/134.10.2791S. [DOI] [PubMed] [Google Scholar]
- 29.Bansal V, Rodriguez P, Wu GY, Eichler DC, Zabaleta J, Taheri F, Ochoa JB. Citrulline can preserve proliferation and prevent the loss of CD3 zeta chain under conditions of low arginine. JPEN J Parenter Enteral Nutr 28: 423–430, 2004. doi: 10.1177/0148607104028006423. [DOI] [PubMed] [Google Scholar]
- 30.Mauldin JP, Zeinali I, Kleypas K, Woo JH, Blackwood RS, Jo C-H, Stone EM, Georgiou G, Frankel AE. Recombinant human arginase toxicity in mice is reduced by citrulline supplementation. Transl Oncol 5: 26–31, 2012. doi: 10.1593/tlo.11262. [DOI] [PMC free article] [PubMed] [Google Scholar]
- 31.Dinesh OC, Brunton JA, Bertolo RF. The kidneys are quantitatively more important than pancreas and gut as a source of guanidinoacetic acid for hepatic creatine synthesis in sow-reared Yucatan miniature piglets. J Nutr 150: 443–449, 2020. doi: 10.1093/jn/nxz266. [DOI] [PubMed] [Google Scholar]
- 32.Marini JC. Channeling of citrulline for the renal synthesis of guanidino acetate. J Nutr 150: 423–424, 2020. doi: 10.1093/jn/nxz310. [DOI] [PubMed] [Google Scholar]
- 33.Agarwal U, Didelija IC, Yuan Y, Wang X, Marini JC. Supplemental citrulline is more efficient than arginine in increasing systemic arginine availability in mice. J Nutr 147: 596–602, 2017. doi: 10.3945/jn.116.240382. [DOI] [PMC free article] [PubMed] [Google Scholar]
- 34.Kao CC, Bandi V, Guntupalli KK, Wu M, Castillo L, Jahoor F. Arginine, citrulline and nitric oxide metabolism in sepsis. Clin Sci (Lond) 117: 23–30, 2009. doi: 10.1042/CS20080444. [DOI] [PubMed] [Google Scholar]
- 35.Luiking YC, Ten Have GAM, Wolfe RR, Deutz NEP. Arginine de novo and nitric oxide production in disease states. Am J Physiol Endocrinol Metab 303: E1177–E1189, 2012. doi: 10.1152/ajpendo.00284.2012. [DOI] [PMC free article] [PubMed] [Google Scholar]
- 36.Caso G, Ford GC, Nair KS, Vosswinkel JA, Garlick PJ, McNurlan MA. Increased concentration of tracee affects estimates of muscle protein synthesis. Am J Physiol Endocrinol Metab 280: E937–E946, 2001. doi: 10.1152/ajpendo.2001.280.6.E937. [DOI] [PubMed] [Google Scholar]
- 37.Smith GI, Villareal DT, Mittendorfer B. Measurement of human mixed muscle protein fractional synthesis rate depends on the choice of amino acid tracer. Am J Physiol Endocrinol Metab 293: E666–E671, 2007. doi: 10.1152/ajpendo.00185.2007. [DOI] [PubMed] [Google Scholar]


