


Keywords: aerobic exercise, clamp study, glucose tracer, insulin-mediated glucose uptake, type 1 diabetes
Abstract
Aerobic exercise in type 1 diabetes (T1D) causes rapid increase in glucose utilization due to muscle work during exercise, followed by increased insulin sensitivity after exercise. Better understanding of these changes is necessary for models of exercise in T1D. Twenty-six individuals with T1D underwent three sessions at three insulin rates (100%, 150%, 300% of basal). After 3-h run-in, participants performed 45 min aerobic exercise (moderate or intense). We determined area under the curve for endogenous glucose production (AUCEGP) and rate of glucose disappearance (AUCRd) over 45 min from exercise start. A novel application of linear regression of Rd across the three insulin sessions allowed separation of insulin-mediated from non-insulin-mediated glucose uptake before, during, and after exercise. AUCRd increased 12.45 mmol/L (CI = 10.33–14.58, P < 0.001) and 13.13 mmol/L (CI = 11.01–15.26, P < 0.001) whereas AUCEGP increased 1.66 mmol/L (CI = 1.01–2.31, P < 0.001) and 3.46 mmol/L (CI = 2.81–4.11, P < 0.001) above baseline during moderate and intense exercise, respectively. AUCEGP increased during intense exercise by 2.14 mmol/L (CI = 0.91–3.37, P < 0.001) compared with moderate exercise. There was significant effect of insulin infusion rate on AUCRd equal to 0.06 mmol/L per % above basal rate (CI = 0.05–0.07, P < 0.001). Insulin-mediated glucose uptake rose during exercise and persisted hours afterward, whereas non-insulin-mediated effect was limited to the exercise period. To our knowledge, this method of isolating dynamic insulin- and non-insulin-mediated uptake has not been previously employed during exercise. These results will be useful in informing glucoregulatory models of T1D. The study has been registered at www.clinicaltrials.gov as NCT03090451.
NEW & NOTEWORTHY Separating insulin and non-insulin glucose uptake dynamically during exercise in type 1 diabetes has not been done before. We use a multistep process, including a previously described linear regression method, over three insulin infusion sessions, to perform this separation and can graph these components before, during, and after exercise for the first time.
INTRODUCTION
The pathognomonic feature of type 1 diabetes (T1D) is insulin insufficiency due to autoimmune destruction of beta cells (1). People with T1D may exhibit features of type 2 diabetes (T2D), such as insulin resistance and metabolic syndrome (2). Therefore, current T1D guidelines include the importance of regular physical exercise (3). Physical exercise confers other health benefits besides improving glycemic control, including reducing cardiovascular risk factors, weight loss, and improving overall physical and mental well-being (4). Despite these positive effects, several barriers exist for people with T1D trying to achieve recommended exercise goals (5), the most significant being exercise-induced hypoglycemia. The use of continuous glucose monitoring (CGM) and closed-loop technology helps detect and reduce the likelihood of hypoglycemia in T1D (6, 7), but rapid changes during aerobic exercise and the slow time action profile of subcutaneous insulin makes it challenging to completely eliminate the risk of hypoglycemia. Improving our understanding of glucose metabolism during exercise will help to improve models of T1D and allow better adjustment of insulin therapy before, during, and after exercise.
During exercise, glucose uptake into active muscle increases dramatically, initially through non-insulin-mediated effects, namely, increased substrate penetration due to contraction and improved perfusion to muscles, and then through a more protracted increase in insulin sensitivity that persists even after exercise is complete (8, 9). The exact time course of these two independent components of glucose uptake is not well understood. Wasserman et al. (10) demonstrated a dramatic change in insulin sensitivity in healthy individuals after exercise, but the time course was not elucidated, and this experiment was not repeated in people with T1D. In addition, Wasserman et al. (10) and Shumak et al. (11) observed linearity between insulin-dependent glucose utilization across a wide range of physiological and pharmacological plasma insulin levels. Shumak et al. (11) used linear regression analysis to demonstrate that non-insulin-mediated glucose uptake occurs at rest in individuals with T1D, at modest rates depending on glucose levels, but participants did not perform exercise in this study. Basu et al. (12) estimated endogenous glucose production (EGP) and rate of disappearance of glucose (Rd) in individuals with T1D during exercise using a triple tracer method, providing an expected dynamic profile of EGP during aerobic exercise. Although Schiavon et al. (13, 14) calculated insulin sensitivity at rest and during exercise in healthy individuals, they did not disambiguate non-insulin-mediated glucose uptake from insulin-mediated glucose uptake during exercise.
In this study, using a previously described tracer methodology in a novel way, we aimed to identify the dynamic insulin-dependent and insulin-independent effects of aerobic exercise on glucose uptake in individuals living with T1D.
METHODS
Ethical Outline and Study Oversight
This study was designed and implemented by the Oregon Artificial Pancreas group at Oregon Health and Science University (OHSU) and was funded by the National Institute of Diabetes and Digestive and Kidney diseases (NIDDK). All study procedures were reviewed and approved by the OHSU Institutional Review Board and followed ethical principles outlined by the World Medical Association in the Declaration of Helsinki. All study procedures, protocol modifications, accrued data, and adverse events were reviewed by an assigned data monitor to ensure patient safety. Written informed consent was obtained from all participants or a legally accepted representative. The study has been registered at www.clinicaltrials.gov (NCT03090451).
Cohort
Participants living with T1D were recruited from OHSU clinics, via flyers posted in approved places at OHSU or posted on the OHSU Harold Schnitzer Diabetes Health Center webpage, Facebook page, and electronic newsletter, and from the OHSU Subject Recruitment website. A prescreening waiver was obtained to review patient records from the Harold Schnitzer Diabetes Health Center to find potential participants.
Eligible participants were recruited based on the following inclusion criteria: 1) 18–45 yr of age at the time of randomization, 2) T1D diagnosis for at least 12 mo, 3) hemoglobin A1c < 10%, 4) ability to perform 45 min of aerobic treadmill exercise. Major exclusion criteria included: 1) pregnancy, 2) cardiovascular disease significant enough to limit physical activity or to put the participant at risk for a cardiovascular event during exercise including, but not limited to, history of stroke, heart failure, myocardial infarction, unstable angina, and second- or third-degree heart block, 3) significant renal or hepatic failure, 4) history of severe hypoglycemia or hypoglycemic unawareness based on an eight-point questionnaire, and 5) insulin resistance requiring more than 200 units per day of insulin.
Study Design
We designed a single center, randomized, two-treatment, three-dose (2 × 3) study of aerobic exercise in adult participants living with T1D. Participants were initially randomized into each arm of the study (see Fig. 1) to either moderate or intense exercise using a simple randomization scheme. In each arm, participants were then randomized to receive a low (L), medium (M), or high (H) insulin infusion rate (IIR) using block-of-six pseudorandomization for combinations of the three sessions, that is, L-M-H, L-H-M, M-L-H, M-H-L, H-L-M, H-M-L.
Figure 1.

Transparent reporting of enrollment, with final study counts. Twenty-six participants underwent three sessions each after successful screening, and one participant completed only the first session before dropping out, for a total of 79 sessions included in the final analysis. Four sessions had to be repeated due to technical difficulties (included in the study counts within parentheses in the lower right table). IIR, insulin infusion rate.
Study Procedures and Materials
Participants underwent a 2-h screening procedure, with review of medical history and medications, physical examination, consenting, and evaluation of maximum V̇O2 (V̇O2max) on a Medgraphics Ultima CardiO2 gas exchange analyzer (MGC Diagnostics, MN). Participants completed the Clarke Hypoglycemia Unawareness questionnaire (15) and Physical Activity Readiness questionnaire (16) (PAR-Q) and, once successfully screened, were randomized. Review of total daily basal and bolus insulin by study clinicians allowed estimation of basal intravenous IIR in units/h needed to maintain a target glucose of 120 mg/dL, called the low IIR rate. The medium IIR rate was 1.5 times the basal rate, and the high IIR rate was 3 times the basal rate. Loess regression analysis of data from VO2max testing established heart rate ranges for 40%–45% of VO2max (moderate exercise target) and 60%–65% of VO2max (intense exercise target). A minimum period of 2 wk was respected between visits. Participants of child-bearing potential not on hormonal methods of birth control were scheduled during the follicular phase of their cycle to limit changes in insulin sensitivity.
Participants were advised to avoid physical activity beyond light walking for 2 days before visits and were provided structured, low-fat meals for dinner and breakfast through the OHSU Bionutrition Department for home consumption. Participants on multiple daily injections of insulin were advised to take morning basal insulin doses on the day before the session and to take 50% of their evening basal doses no later than 7 PM. Participants ate breakfast 2 h before the start of the session with their rapid-acting insulin bolus and did not take any basal insulin injections. Insulin pumps were suspended after the breakfast dose. Participants were admitted to the OHSU in-patient research center and those of childbearing potential had a repeat pregnancy test. Two intravenous catheters were placed, one on each arm, for drawing blood and infusing study drugs. Heating pads facilitated venous blood draws through a double stop-cock system on the drawing arm, whereas a sequential Y-catheter system allowed infusions of regular human insulin at 0.5 units/mL, 6,6 di-deuterated glucose tracer (Sigma Aldrich, St. Louis, MO) at 10 mg/mL and 10% dextrose solution supplemented with 2% tracer. 10 mEq/L of potassium was added to the dextrose solution for medium and high IIR sessions.
Participants’ glucose levels were clamped during the initial 3-h run-in period to a target of 120 mg/dL using a proportional-integral algorithm based on a paper by Bequette (17).
During the run-in period, insulin and concentrated tracer infusion rates were constant, whereas the 10% dextrose solution infusion rate was adjusted based on recommendations by the clamp algorithm. The tracer infusion rate was based on data obtained from Shetty et al. (18) and a triple-tracer study by Mallad et al. (19): at 0 min, priming bolus of 3.3 mg/kg, followed by infusion rates in (mg/kg)/h as follows: minutes 0–180, 2.4; minutes 180–190, 3.5; minutes 190–210, 4.2; minutes 210–225, 4.8; minutes 225–245, 3.5; and after minute 245, 2.4. Tracer infusion rates were based on an expected rise in EGP during exercise of 2–2.5 times the preexercise rate.
Participants exercised using a portable treadmill. At minute 150, dextrose infusion was fixed between 1.5 and 2 times the baseline rate determined during the run-in period to prevent significant hypoglycemia during exercise while allowing constant glucose infusion during and after exercise. Before exercise began, a Zephyr bio-patch heart rate monitor and accelerometer (Medtronic Zephyr, Boulder, CO) was attached to participants and secured using a chest strap. Exercise began at minute 180 for 45 min and was maintained by achieving the target heart range determined during VO2max testing.
Samples of blood were drawn at various intervals before, during, and after exercise for measurement of serum total and tracer glucose, insulin, glucagon, catecholamines (epinephrine and norepinephrine), and free fatty acids (FFA). Commercially available ELISA assay kits were used to measure insulin (Mercodia, Inc., Winston, Salem, NC) and catecholamines (Diagnostica GMBH, Hamburg 61348, Germany). Glucagon was measured using a radioimmunometric assay (EMD Millipore Corp, Burlington, MA) and FFA by a colorimetric method (Zenbio, Research Triangle Park, NC).
Participants were monitored for 3 h after exercise ended and provided a meal at the end of the study period. Subcutaneous insulin was given and overlapped with intravenous insulin for a minimum of 30 min. Basal insulin doses were provided, or insulin pumps restarted, before discharge from the research center. A follow-up phone call was conducted within 48 h of discharge.
Data Analysis
The data from our tracer sessions were analyzed in two steps. First, we used a simple two-compartment model of glucose fluxes and solved for EGP and Rd using Bayesian parameter estimation. Then, we disambiguated insulin-mediated and non-insulin-mediated effects using a novel method involving linear regression of Rd across insulin-loading conditions.
To solve for the parameters of interest EGP and Rd, we used a two-compartment model to estimate internal glucose fluxes (Fig. 2A) originally described by Radziuk (20) and Mari (21). The first compartment is termed the accessible compartment and its content is estimated by blood glucose measurements—all intravenous infusions enter into this compartment. The second compartment is the inaccessible compartment, through which glucose circulates but from which it is not eliminated. Given glucose infusions and blood glucose levels, we can solve for the glucose mass moving out of the first compartment (Rd), and alternately, the EGP entering into the first compartment. The system of ordinary differential equations (ODEs) is given by the following equations (18, 20):
| (1) |
| (2) |
| (3) |
Figure 2.
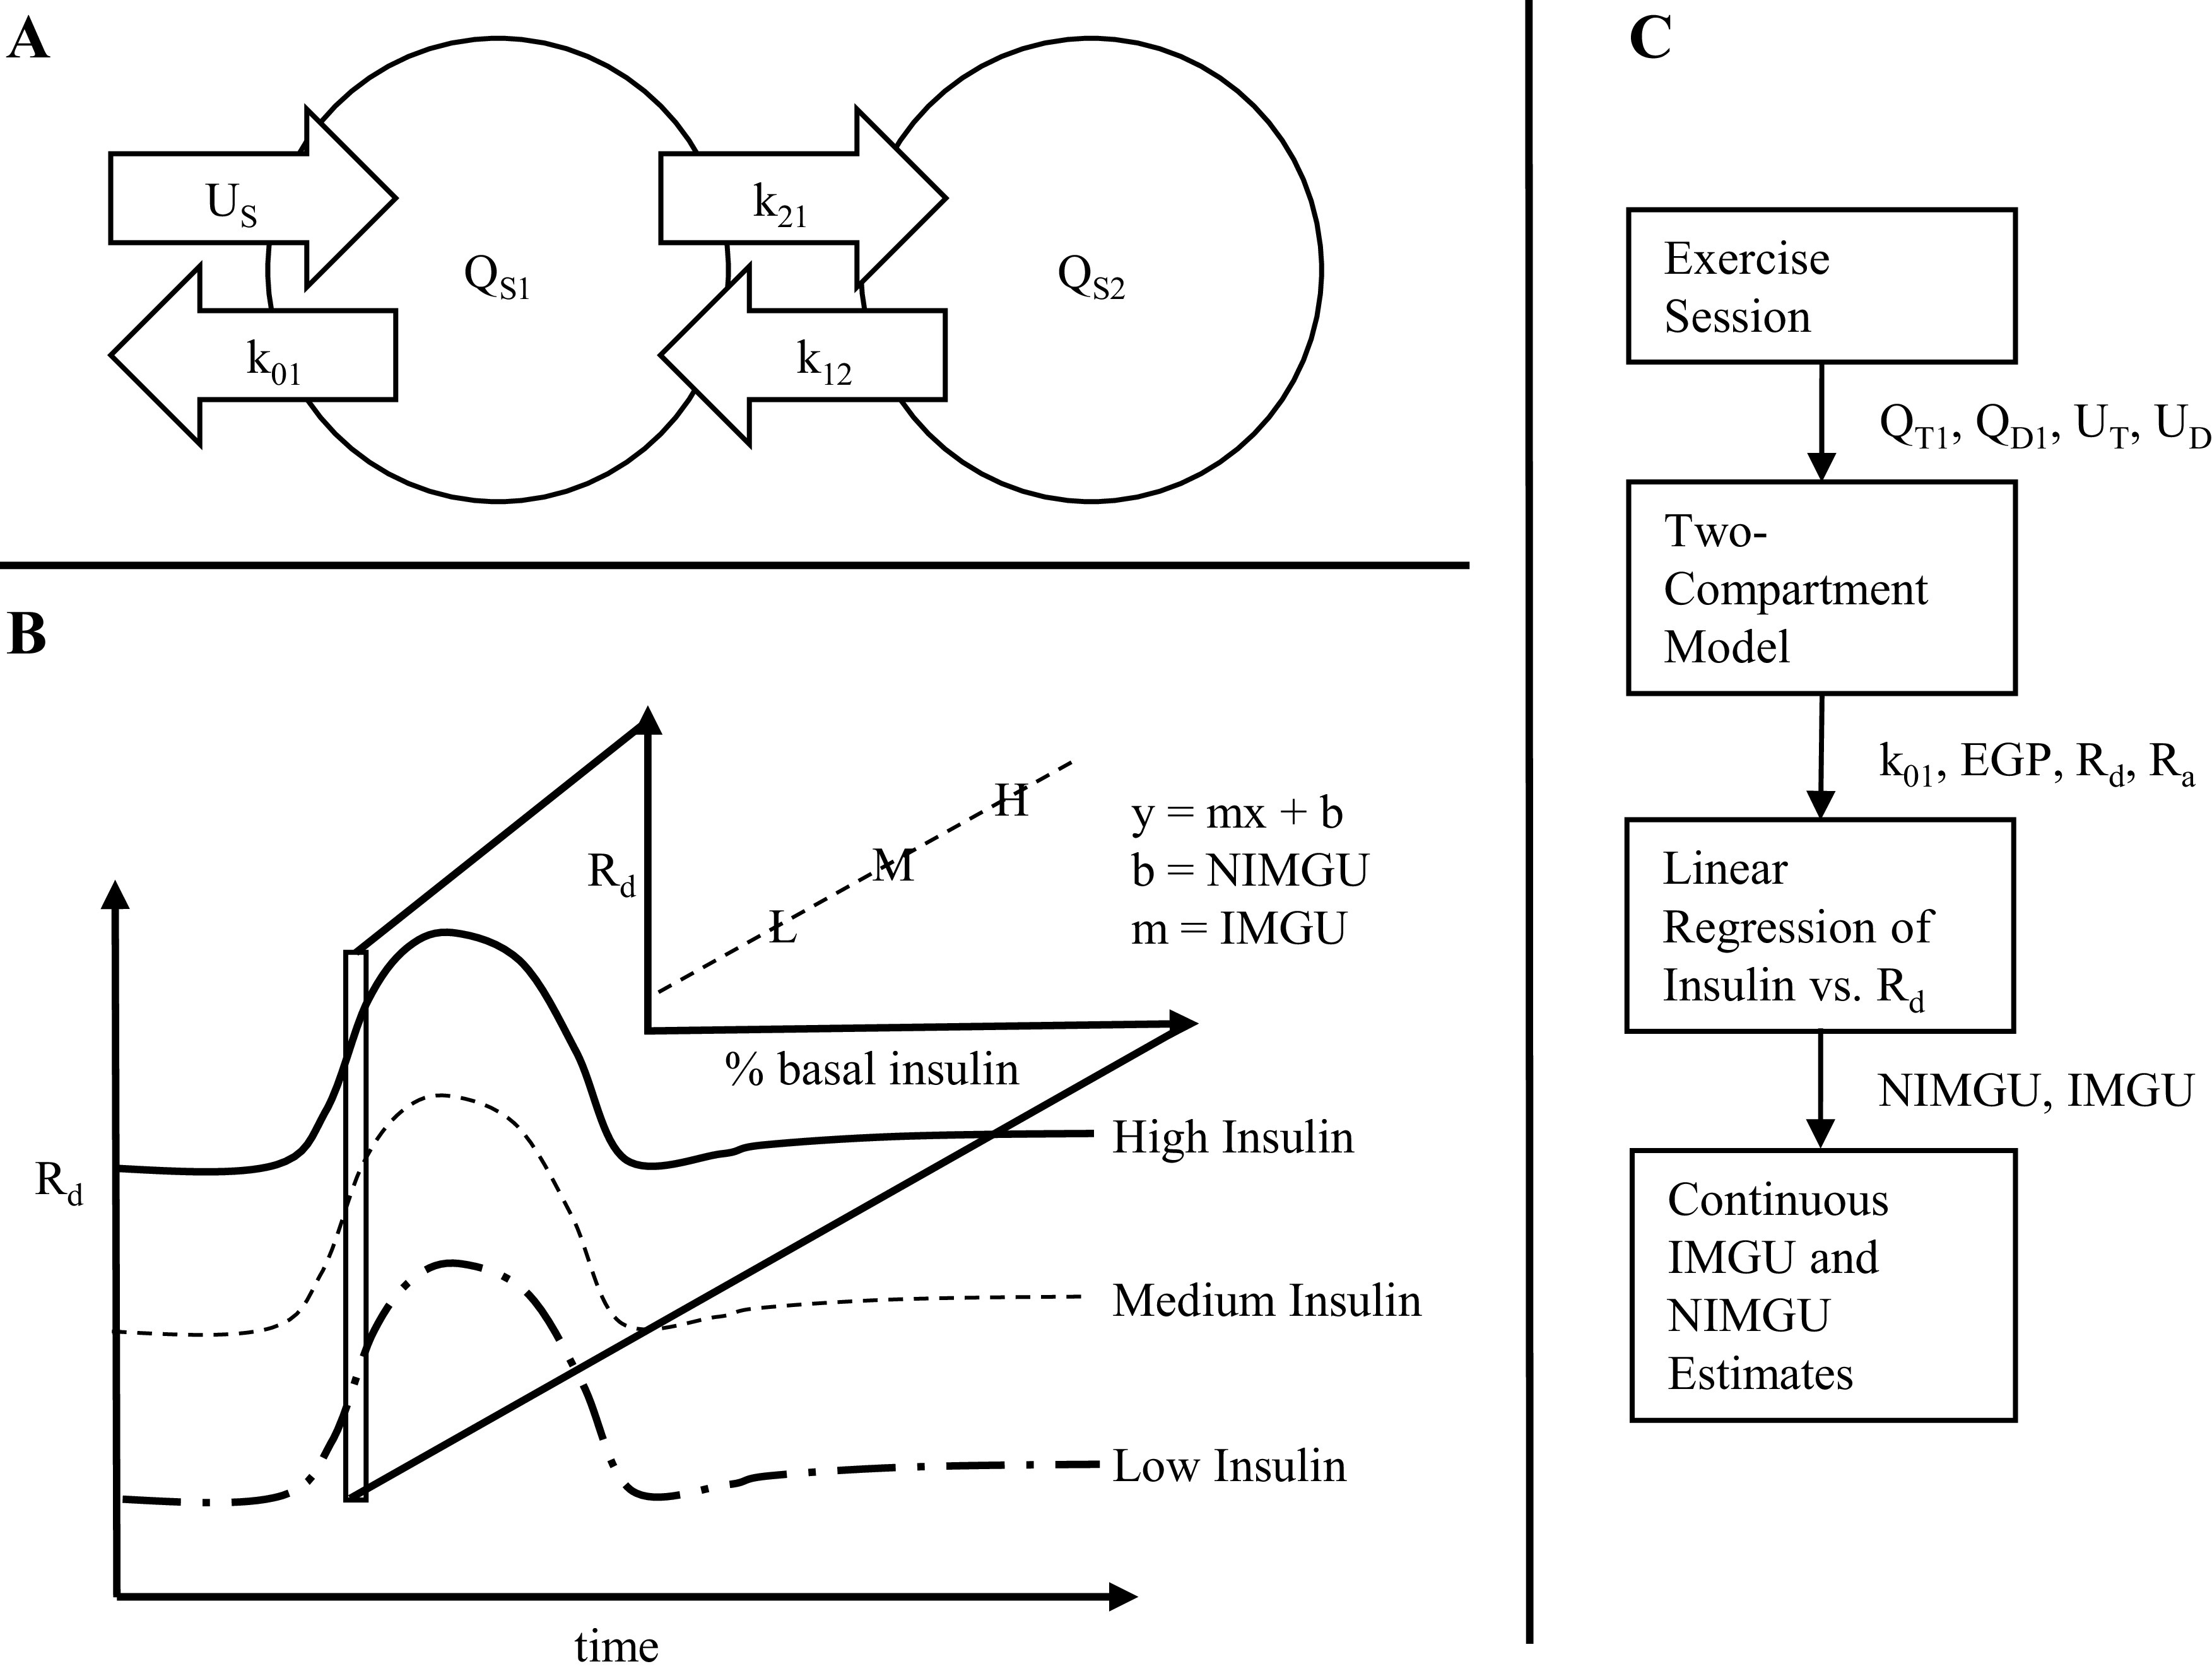
A: schematic of the Radziuk–Mari two-compartment model. B: method for calculating insulin- vs. non-insulin-mediated glucose uptake. Linear regression was performed at each time point across three different insulin infusion curves. The slope of the line at each point is the insulin-mediated glucose uptake and extrapolating the line to theoretical zero insulin gives the non-insulin-mediated glucose uptake. (C) workflow showing inputs and outputs for each step of data analysis. EGP, endogenous glucose production; k, rate constant; (N)IMGU, (non) insulin-mediated glucose uptake; Q, mass compartment; Rd, glucose rate of disappearance; Ra, glucose rate of appearance; S, glucose species; U, glucose input.
The subscript S denotes the glucose species and can be replaced with either T (for total glucose) or D (for tracer deuterated glucose). QS1 and QS2 denote the glucose mass (mmol/kg) within either the accessible compartment (QS1) representing plasma or the inaccessible compartment (QS2). GS is the glucose concentration (mmol/L) and can be calculated from the volume of distribution of glucose (VG). US is the glucose rate of appearance (mmol/kg/min) where UT = uD10 + uD2 + EGP and UD = uD2. uD10 is the D10% infusion rate and uD2 is the tracer infusion rate.
The fluxes between compartments are defined by k12 and k21; the values of these rate constants were derived from previous experiments by Hovorka et al. (22) and kept fixed during the experiment, whereas k01 and EGP are parameters that were solved at each time point. Initial conditions of the two-compartment model were solved by assuming steady-state conditions. In additional, a 10-min delay was implemented on the glucose infusions into the first compartment.
For the unknown parameters, we defined a Bayesian probability function, with study data used to calculate the likelihood. Bayes parameter estimation was chosen to constrain parameter values to physiologically probable values and was performed using the R-STAN software package (23) in which the ODE parameters were fitted using a Hamiltonian Monte Carlo algorithm to explore the posterior. Our Bayes posterior distribution is defined as follows:
| (4) |
is the likelihood and represents a comparison between model-generated values, given a particular k01 and EGP, and the data, which is accepted as ground truth. In other words, the likelihood function is a normal distribution centered on the data value of and from the tracer sessions with input to the Gaussian function equal to their generated values from the ODE model.
We implemented uniform priors for both k01 and EGP. Taken together, the likelihood penalizes simulated glucose values that result in glucose too far away from experimental values and the uniform prior, as opposed to a prior that forces a correlation between time points, reduces smoothing and the influence of model error on adjacent k01 and EGP estimations. Our k01 and EGP values were then used to calculate glucose rate of appearance (Ra) and glucose rate of disappearance (Rd) as follows:
| (5) |
| (6) |
The second step aimed to identify glucose disposal at each time point that was due to insulin versus disposal that was independent of insulin. For a given patient and at a given time point, we plotted Rd against insulin infusion rate. We applied a linear regression to approximate the Rd per amount insulin infusion, and extrapolated the linear model to the point on the y-axis, where insulin equals zero; this was taken to be the insulin-independent effect (Fig. 2B). The insulin-dependent effect, then, was taken to be the slope of the linear regression line of best fit. A flow chart of the steps in data analysis is provided in Fig. 2C.
Statistical Analysis
Power analysis and sample size determination were performed using G*power software (24). A sample size of 13 subjects per arm (26 participants total) was found to be adequate to show at least a 30% difference in the peak effect for insulin- and non-insulin-mediated changes. This assumed at least 25% standard deviation between groups and a predicted effect size of 1.37, with an α error of 5% and power of 90%. Sample size minimum was 10 per group and 13 was chosen in case of higher than expected standard deviation.
AUCRd and AUCEGP were calculated over the 45-min exercise period, as well as during the preexercise baseline period. AUC is presented in units of mmol/L representing the total glucose mass moved during the exercise or baseline period. A linear mixed effects model was used to determine the significance of the effect of insulin infusion rate and exercise intensity on AUCRd and on AUCEGP, with study participant as the random effect and insulin infusion rate and exercise level as the fixed effects. Single-factor ANOVA and paired t test analyses were used to compare differences in hormone and FFA levels across insulin-infusion conditions.
RESULTS
Participant baseline characteristics are shown in Table 1.
Table 1.
Baseline characteristics of participants in each study arm
| Moderate Exercise | Intense Exercise | P Value* | |
|---|---|---|---|
| n | 14 | 13 | – |
| Male, n (%) | 4 (28.6) | 6 (46.2) | 0.345 |
| Age, yr, means ± SD | 32.6 ± 6.6 | 28.2 ± 6.1 | 0.079 |
| Duration of diabetes, yr, means ± SD | 19 ± 9.4 | 15.3 ± 7.4 | 0.146 |
| Weight, kg, means ± SD | 79.1 ± 16.4 | 76.2 ± 8 | 0.572 |
| BMI, kg/m2, means ± SD | 26.3 ± 4.5 | 24.8 ± 2.95 | 0.332 |
| Hemoglobin A1c, %, mmol/mol means ± SD | 7.4 ± 1.1 (57.6 ± 11.7) | 7.4 ± 1 (57.9 ± 10.4) | 0.950 |
| TDI, units/day, means ± SD | 54.3 ± 13.1 | 54 ± 16 | 0.959 |
| Percent of TDI as basal, means ± SD | 54.8% ± 6.3% | 55.9% ± 6.1% | 0.638 |
| MDI users, n (%) | 5 (35.7) | 2 (15.4) | 0.228 |
| CSII (pump) users, n (%) | 9 (64.3) | 11 (84.6) |
*Student’s two-tailed, unpaired t test used for nominal data, χ2 test for categorical data. CSII, continuous subcutaneous insulin infusion; MDI, multiple daily injections; TDI, total daily insulin.
There was an increase in EGP during the intense exercise period that continued after exercise stopped (Fig. 3). Our mixed effects model analysis demonstrated no significant effect of insulin infusion rate (P = 0.700) on AUCEGP, but showed an increase of 1.66 mmol/L (95% CI = 1.01–2.31, P < 0.001) during moderate exercise compared with baseline, versus 3.46 mmol/L (95% CI = 2.81–4.11, P < 0.001) during intense exercise. When comparing moderate-to-intense exercise, we found a significant increase of 2.14 mmol/L on AUCEGP (95% CI = 0.91–3.37, P < 0.001) in the intense exercise group.
Figure 3.

Interquartile plots of endogenous glucose production (EGP) across insulin conditions and exercise arms. Area under the curve (AUC)EGP was higher in the patients undergoing intense exercise (3.46 mmol/L over baseline, 95% CI = 2.81–4.11, P < 0.001) compared with moderate exercise (1.66 mmol/L over baseline, 95% CI = 1.01–2.31, P < 0.001) with a difference between exercise groups of 2.14 mmol/L (95% CI = 0.91–3.37, P < 0.001). There was no difference in AUCEGP across insulin infusion groups, P = 0.7. Exercise occurred during the shaded interval.
There was a separation between insulin infusion groups on the interquartile plots of Rd (Fig. 4), showing that for higher insulin infusion rates, the rate of disposal of glucose increased. AUCRd was found to be affected by insulin infusion (Fig. 5). Linear mixed effects analysis showed that the AUCRd increased 12.45 mmol/L (95% CI = 10.33–14.58, P < 0.001) during moderate exercise and 13.13 mmol/L (95% CI = 11.01–15.26, P < 0.001) during intense exercise compared with baseline, with a significant effect of insulin infusion rate equal to 0.06 (mmol/L)/% above basal rate (95% CI = 0.05–0.07, P < 0.001) such that as insulin infusion increased from 100% to 300%, AUCRd increased by 12 mmol/L. Comparing moderate-to-intense exercise, there was no significant effect of exercise intensity on AUCRd (P = 0.34).
Figure 4.

Interquartile plots of glucose rate of disappearance (Rd) across insulin conditions and exercise arms. Rd was systematically higher for higher basal insulin dosing. AUCRd increased 12.45 mmol/L (95% CI = 10.33–14.58, P < 0.001) during moderate exercise and 13.13 mmol/L (95% CI = 11.01–15.26, P < 0.001) during intense exercise compared with baseline, with a significant effect of insulin infusion rate equal to 0.06 (mmol/L)/% above basal rate (95% CI = 0.05–0.07, P < 0.001). There was no difference in AUCRd between moderate and intense exercise groups, P = 0.34. Exercise occurred during the shaded interval.
Figure 5.
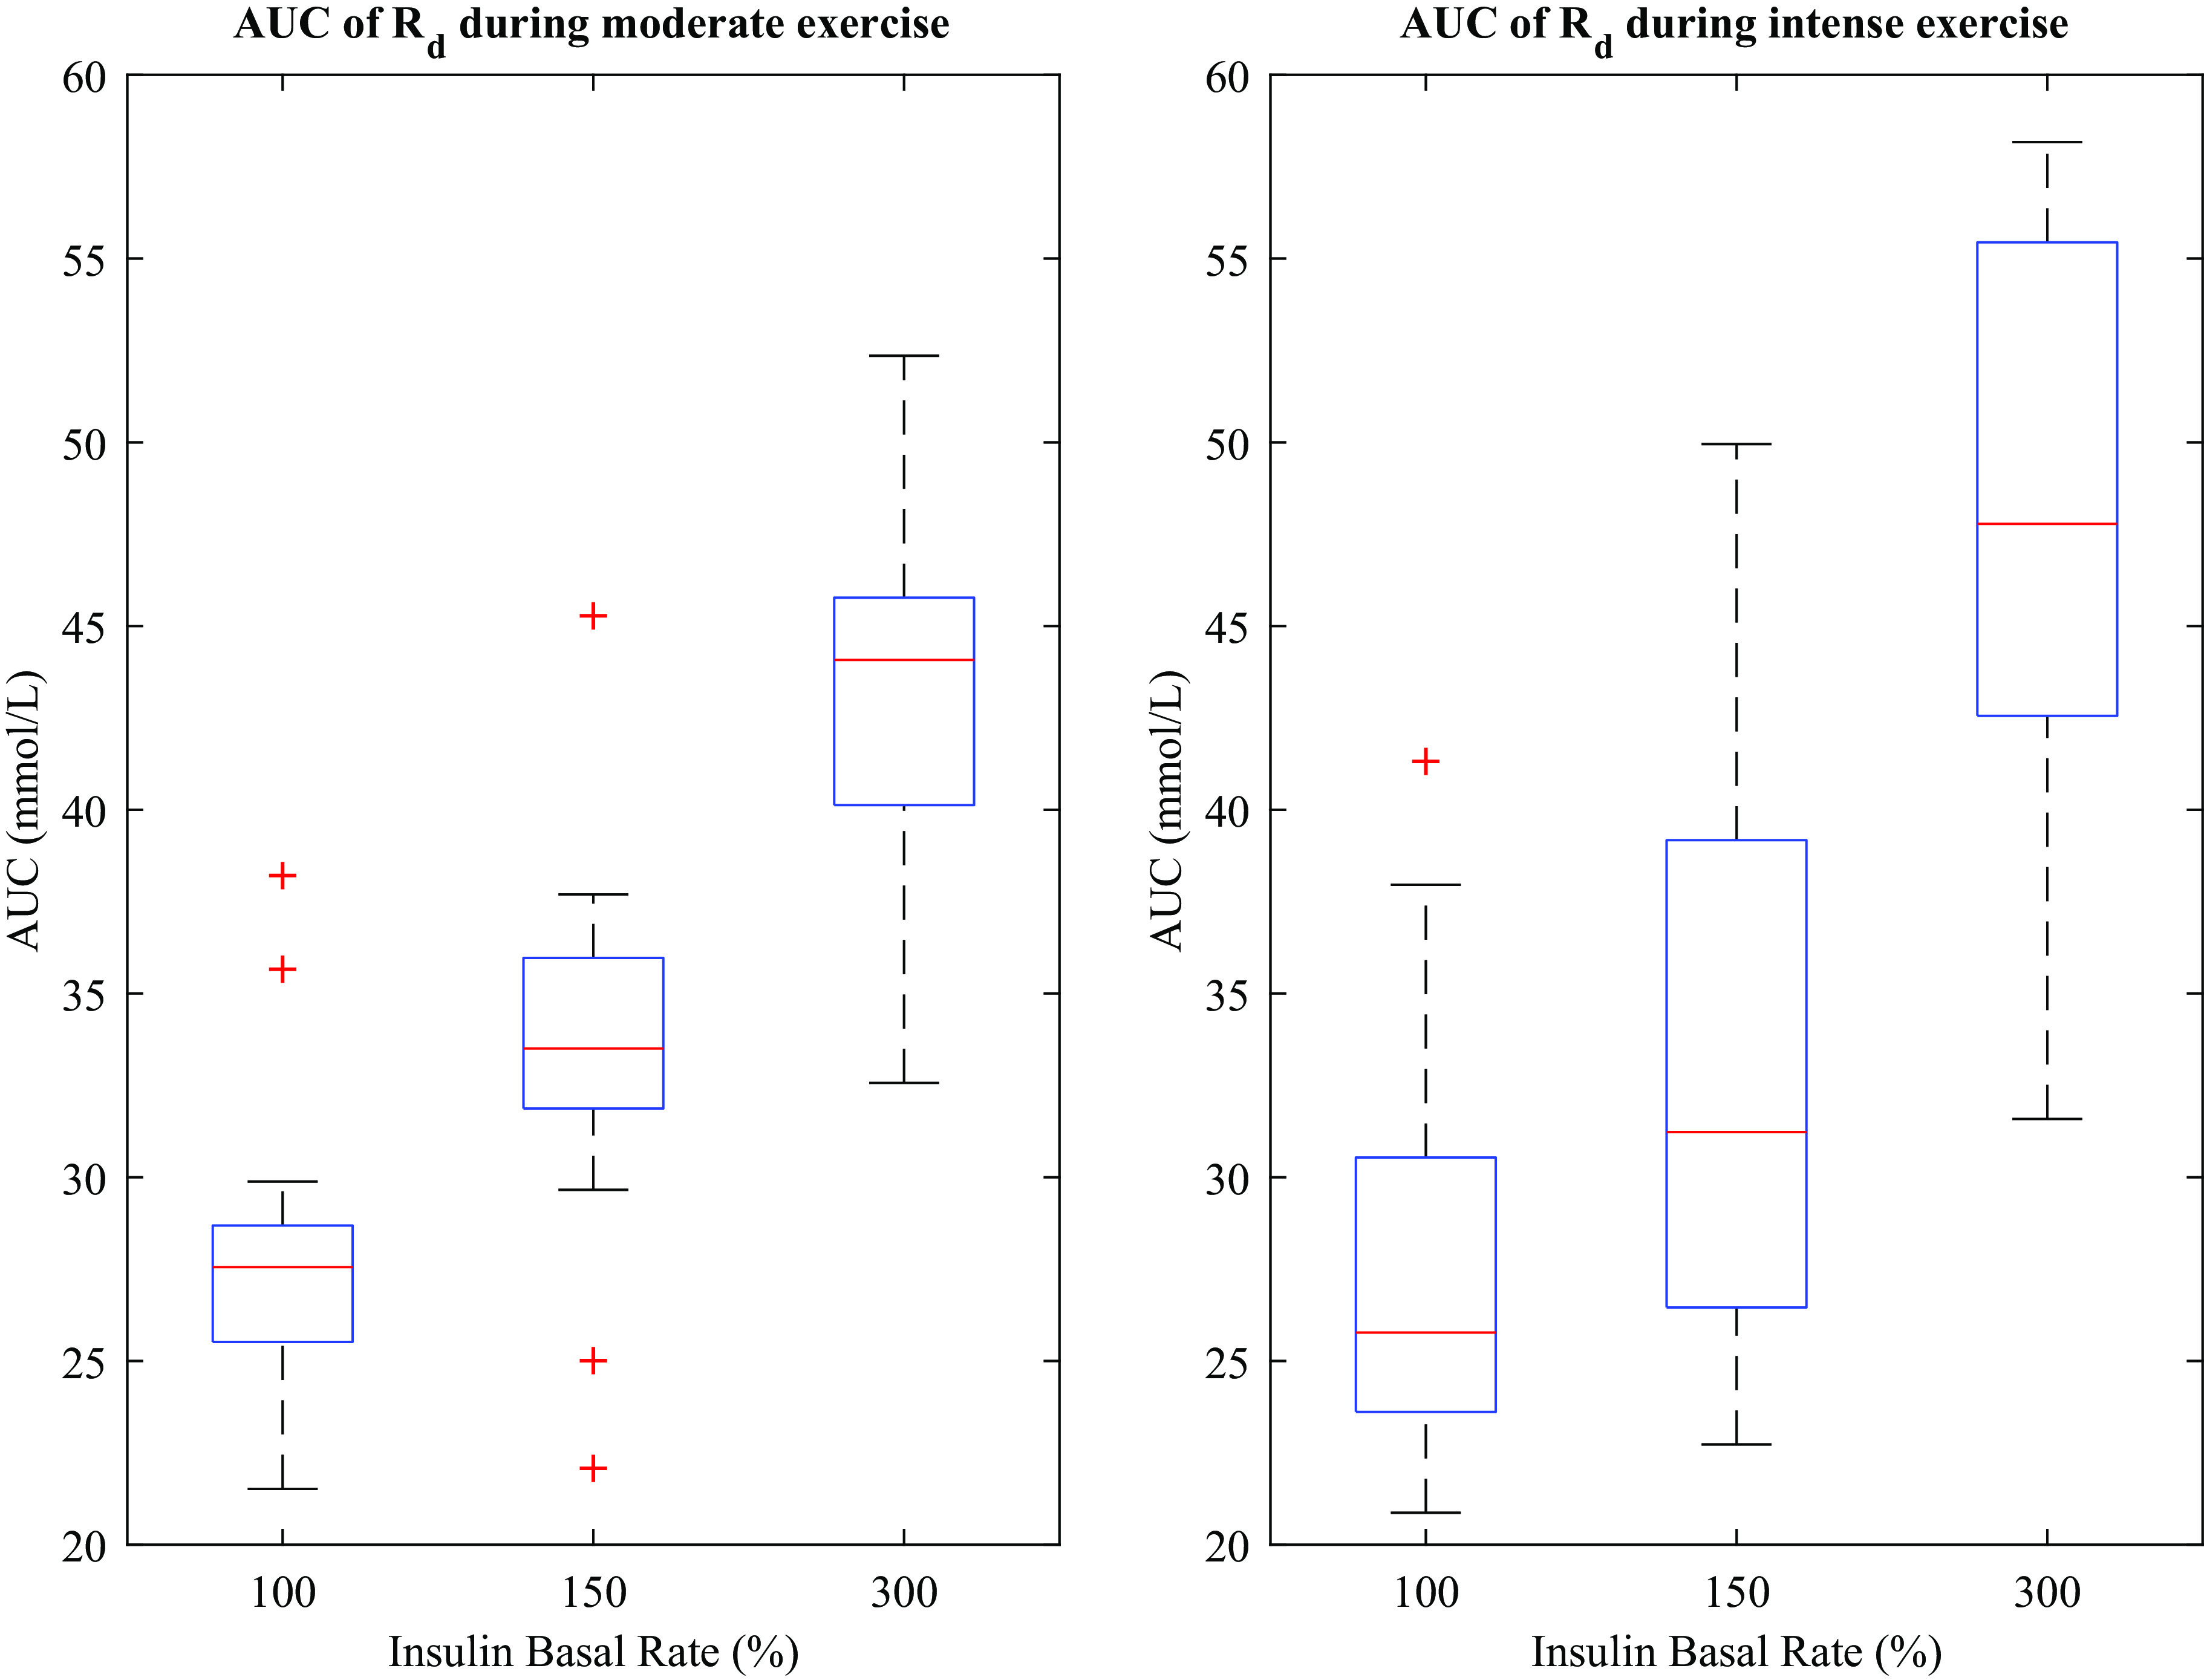
Glucose disposal during 45 min of exercise. Red lines indicate medians, blue boxes indicate 25th–75th percentile, and horizontal black lines indicate lower and upper adjacent. Medians for low, medium, and high insulin infusion rates during moderate exercise are 28.077 (Q1 = 26.474, Q3 = 29.383), 34.160 (Q1 = 32.427, Q3 = 36.583), and 44.505 (Q1 = 40.842, Q3 = 46.300) mmol/L, respectively. For intense exercise, medians were 26.913 (Q1 = 24.485, Q3 = 31.247), 31.844 (Q1 = 27.006, Q3 = 39.720), and 48.558 (Q1 = 43.027, Q3 = 55.838) mmol/L, respectively. Q, mass compartment.
We found a sharp increase in non-insulin-mediated glucose uptake with the start of exercise, whereas insulin-mediated glucose uptake saw a more gradual increase (Fig. 6). In addition, non-insulin-mediated glucose uptake increased at the onset of exercise and decreased when exercise ended, whereas insulin-mediated glucose uptake remained elevated for longer after exercise (Fig. 6). Interestingly, the insulin-mediated glucose uptake started to rise around minute 150 before the onset of exercise, which may have been caused by the increased dextrose infusion applied before exercise to help avoid hypoglycemia during exercise (Fig. 7). We therefore used the period from minute 120 to minute 150 as a baseline for comparison of changes in both insulin- and non-insulin-mediated glucose uptake during and after exercise, as shown in Fig. 6.
Figure 6.

Insulin-mediated and non-insulin-mediated glucose uptake plotted across the duration of the experiment. Asterisks indicate time points where Rd is significantly different from baseline at minutes 150. Exercise occurred during the shaded time period. 95% confidence intervals are shown in dotted lines.
Figure 7.
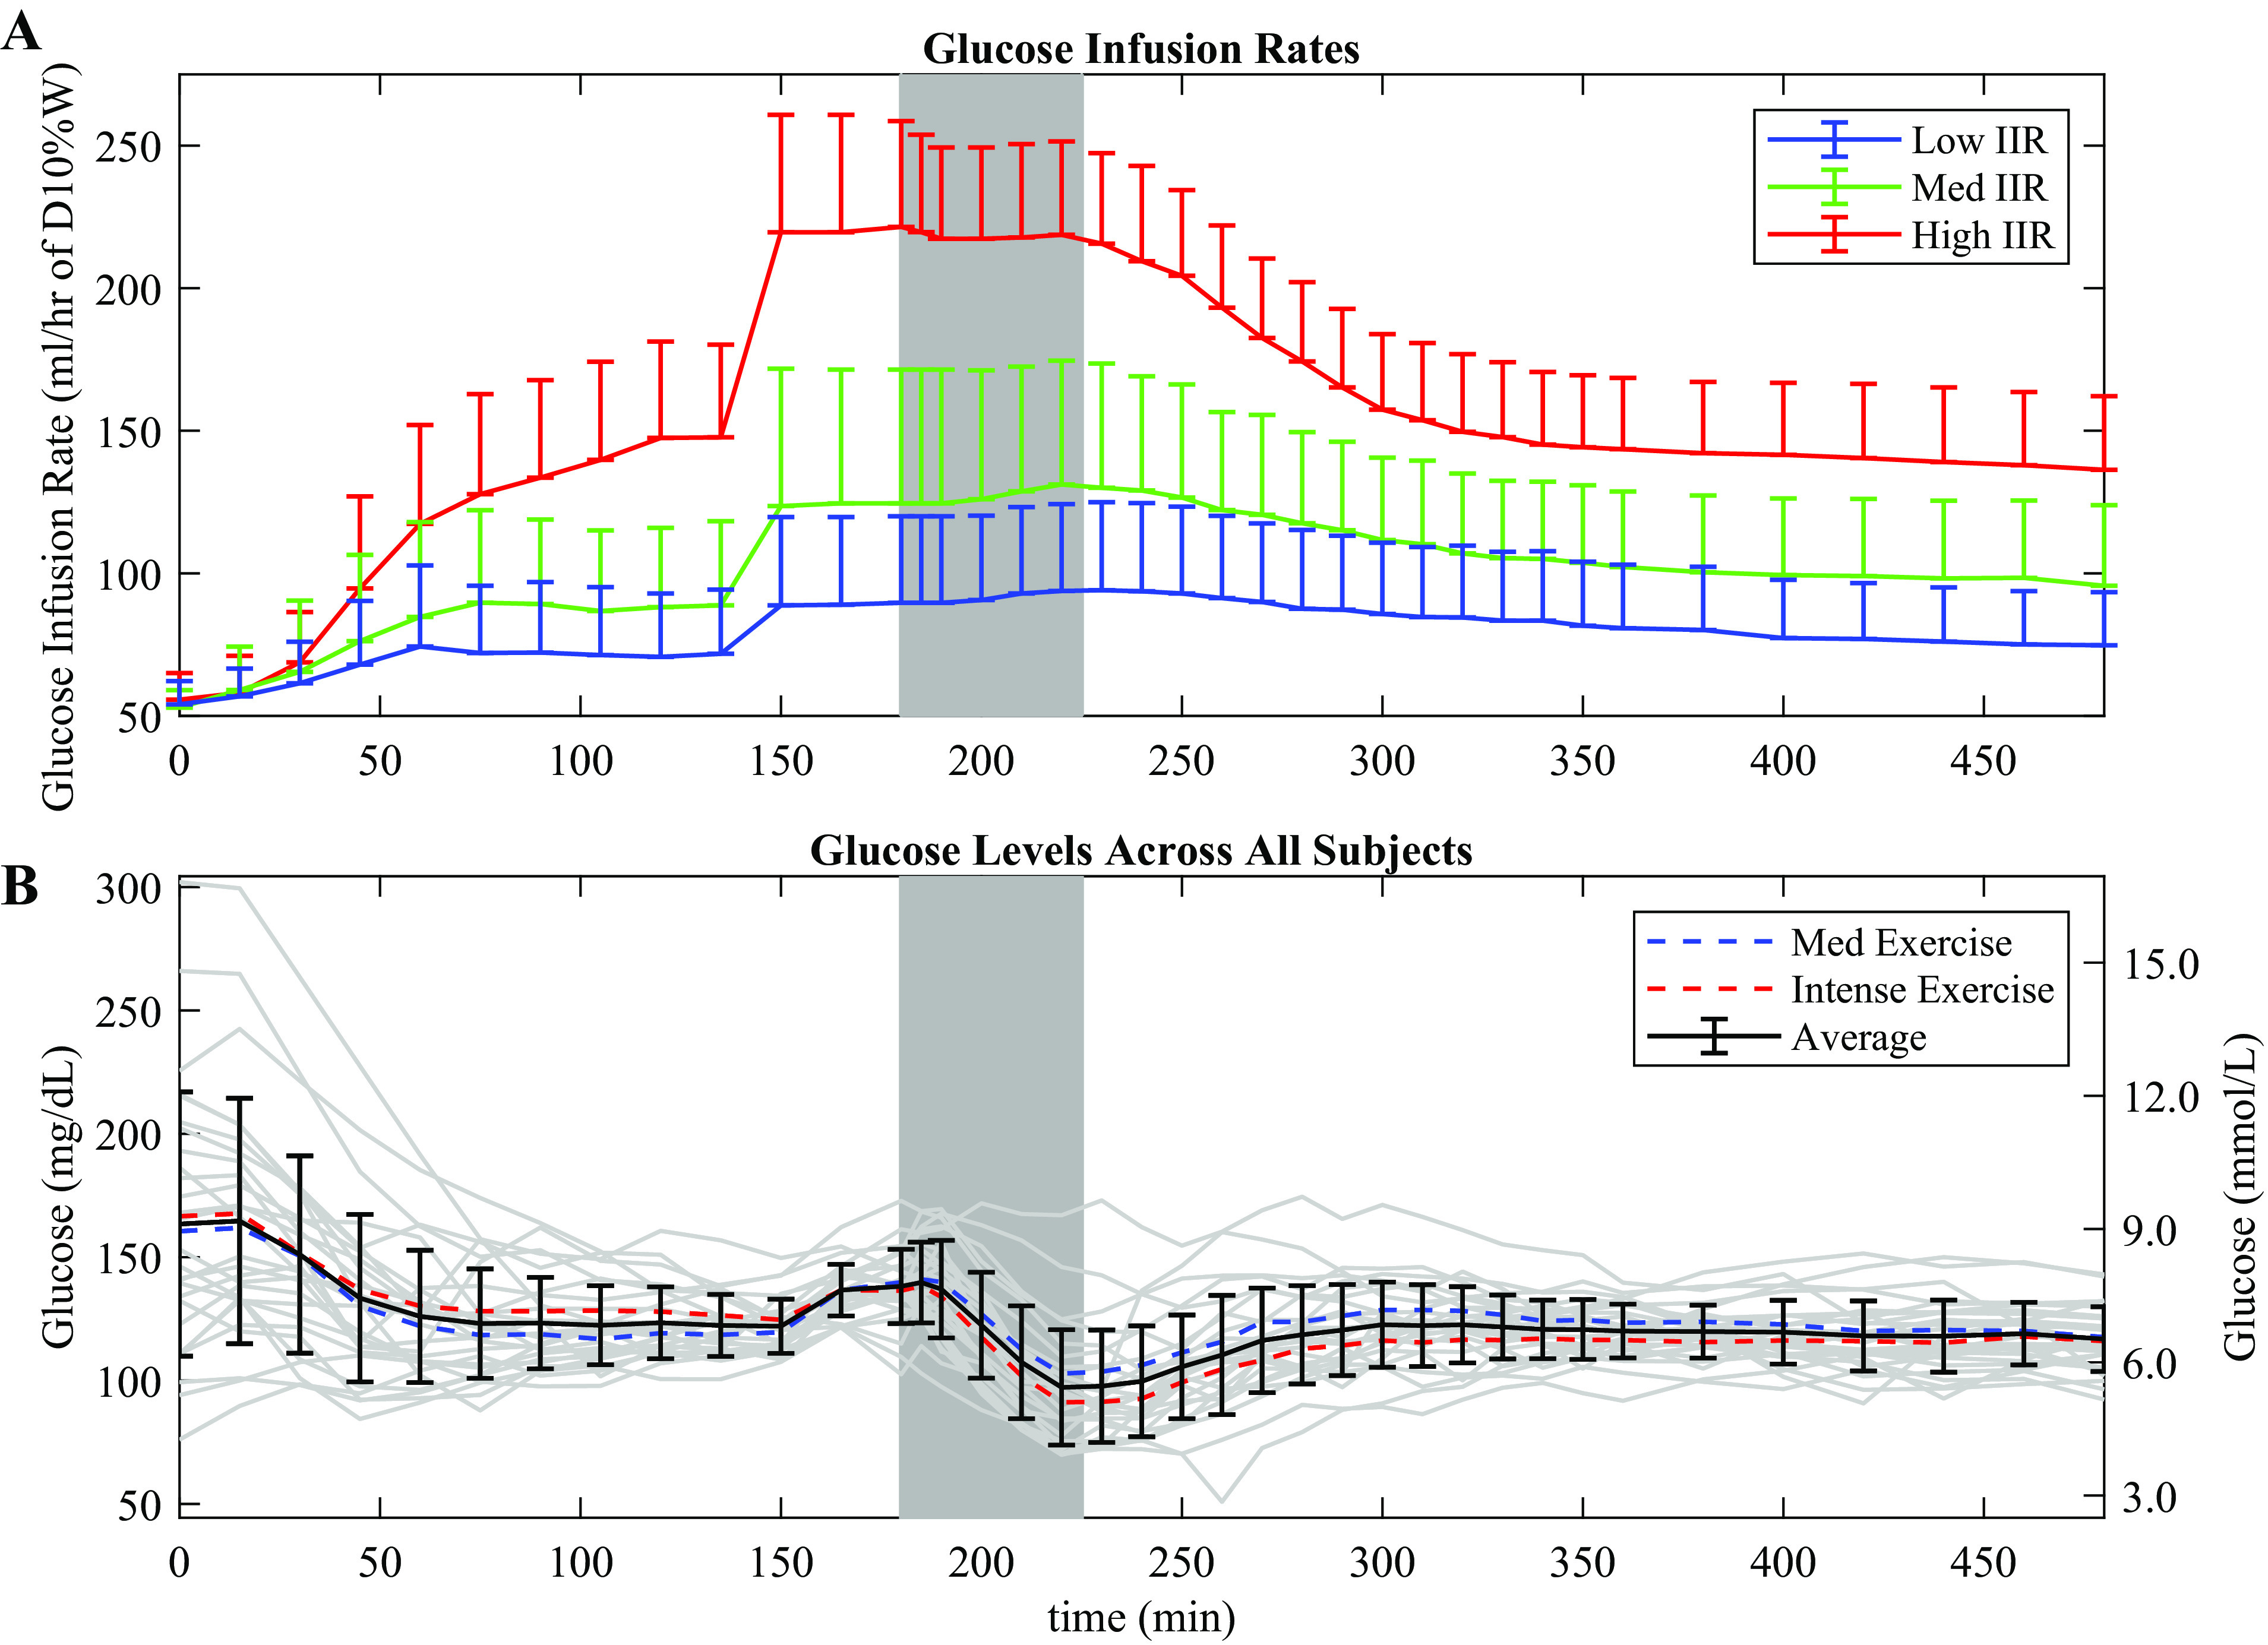
Glucose infusion rates for each insulin infusion group and glucose levels across all study participants. A: the upper graph shows the dextrose infusion rate for the low, medium, and high insulin infusion groups, with standard deviations. Dextrose infusion was increased at minutes 150 to limit hypoglycemia and to allow a constant dextrose infusion rate during exercise. B: the lower graph shows average glucose levels for each exercise condition, with gray lines denoting individual study participants. The average for both conditions in shown in bold with bars indicating standard deviations.
Insulin plasma levels corresponded appropriately with the insulin infusion rate during sessions, showing a rise during the exercise period as previously demonstrated by Mallard (19) (Fig. 8). Insulin levels showed a significant increase across different infusion sessions by ANOVA (P < 0.001) and were significantly higher on average between low and medium (P < 0.001), medium and high (P < 0.001), and low and high (P < 0.001) sessions via paired t test. Data for free fatty acid, glucagon, and catecholamine levels are presented in Fig. 9. For free fatty acid levels, Student’s t test showed significance (P < 0.01) between low and high IIR sessions for both moderate and intense exercise groups at all except the 200-min time point. For glucagon levels, there was significance (P < 0.05) between low and high IIR sessions from minute 200 and onwards, but this did not persist after accounting for exercise intensity, whereas for catecholamine levels, significance between moderate and intense exercise groups from minute 120 to minute 200 (P < 0.05) did not persist after accounting for insulin conditions.
Figure 8.

Plasma insulin levels during exercise across insulin infusion groups, showing a rise in insulin plasma levels during exercise, despite a constant intravenous infusion rate of insulin. Shaded area, exercise period; IIR, insulin infusion rate. *P < 0.01 for High vs. Med and High vs. Low. †P < 0.0001 for minutes 200 and minutes 220 insulin plasma levels compared with minute 180 for Low, Med, and High IIR.
Figure 9.

Free fatty acid, glucagon, and catecholamine levels separated by insulin infusion rate and exercise intensity. Shaded area shows the period of exercise.
DISCUSSION
In this paper, we present results showing how aerobic exercise impacts insulin- and non-insulin-mediated glucose uptake. To the best of our knowledge, the methods that we use to calculate insulin- and non-insulin-mediated glucose uptake as a function of exercise have not been previously published. We used methods described by Shumak et al (11), where non-insulin-mediated glucose uptake was determined in participants living with T1D (resting only), by measuring glucose disposal at three different insulin infusion rates and then linearly extrapolating to an infusion rate of zero. We extended this by measuring both insulin- and non-insulin-mediated uptake before, during, and after different exercise intensities to quantify how exercise impacts glucose disposal. This method assumes linearity of the insulin dose-response curve when extrapolating to zero insulin. The main strength of our estimation method is that glucose uptake was obtained directly from physiological data using a minimal model blind to both insulin and exercise conditions.
Our results show an increase in insulin-mediated glucose disposal during exercise, which persists for several hours after a single bout of aerobic exercise is completed before returning to baseline. Also, the non-insulin-mediated effect appears to be limited to the exercise period, rising quickly during exercise and then dropping quickly at the end of exercise (Fig. 6). Other groups including Berger et al. (25) have demonstrated that there can be a sharp increase in insulin sensitivity during aerobic exercise. They showed a several-fold increase in plasma levels of tracer [3H]-insulin between 15 and 90 min after the start of exercise compared with during a rest control period. The insulin-mediated effect, which can persist for hours, may be responsible for the longer term impact on glucose uptake as reported by McMahon et al. (26).
Our results also show an increase in Rd and EGP during exercise (Figs. 4 and 5), which correspond with the rise in insulin-mediated and non-insulin-mediated glucose uptake (Fig. 6). There was also a clearly defined dose effect across insulin infusion subgroups on Rd, with Figs. 5 and 6 showing that Rd increases significantly for higher insulin infusion conditions. Surprisingly, there was not a significant impact of exercise intensity on either insulin-mediated or non-insulin-mediated glucose uptake using our methods, as compared with the effect seen with estimates of EGP, though this may be due to the fact that the levels of exercise intensity chosen for moderate and intense exercise were not sufficiently separated. The participants in the study had varying levels of fitness (27), which may have impacted the lack of separation on Rd between the two study arms as well. As noted in Fig. 6, the calculation for insulin-mediated glucose uptake was based on percentage of basal insulin infusion rate rather than on insulin concentration, to equalize the assessment across varying insulin sensitivity profiles.
The findings reported here may be helpful as exercise metrics are incorporated into automated insulin and glucagon delivery systems to help prevent exercise-induced hypoglycemia (6, 7, 28, 29). It may also be helpful in decision support systems and meal bolus calculators that rely on accurate estimations of insulin sensitivity that is affected by exercise. For example, Fabris et al. report on use of a smart meal bolus calculator that is informed about changes in insulin sensitivity caused by aerobic exercise. They found that use of the exercise information to inform changes in insulin sensitivity helped to reduce hypoglycemia and rescue carbohydrates (30).
Models of glucose homeostasis in individuals with type 1 diabetes continue to be refined, with the inclusion of additional aspects of human behavior that can impact glucose levels, such as exercise, meals, sleep, and even stressful events by using appropriate sensors (31). The results that we present here may help enable improved glycemic control by allowing the control algorithms to adjust insulin dosing based on changing insulin sensitivity; such adaptive changes in insulin sensitivity within models have been shown to be beneficial in adaptive controls (32). Current guidelines provide expert advice based on observations of glucose changes during exercise (33), but these recommendations from a consensus statement remain broad and do not provide quantitative resolution for use in control algorithm models. This study represents a first step toward quantifying and separating the dynamic effect of exercise on insulin-mediated and non-insulin-mediated glucose flux before, during, and after exercise for the purpose of inclusion in such models.
It is apparent in Fig. 6 that the insulin-mediated glucose uptake appears to increase before exercise. This phenomenon is also apparent in Fig. 4 that shows Rd increasing before the onset of exercise. We looked carefully at this in each session and determined that this was due to an artifact of the experimental method. At minute 150, the dextrose infusion was increased to help prevent hypoglycemia during exercise scheduled at minute 180. Consequently, in Fig. 6, the insulin-mediated glucose uptake can be seen rising before exercise begins, at roughly minute 150. Implementing a delay variable for intravenous dextrose infusion into our glucose model to account for the time for infused dextrose to take effect only shifted the sudden rise in insulin-mediated glucose uptake but did not correct the effect. This implies a nonphysiological effect caused by inadequate accounting for the sudden change in dextrose infusion rate. The absence of tracer glucose data between minutes 120 and minutes 165 likely contributed to this nonphysiological effect. The non-insulin-mediated glucose uptake in Fig. 6 did not show a similar rise before the start of exercise, suggesting that this effect is not present at the extrapolated zero-insulin threshold. In some participants, the artifact was not present as shown in Fig. 10A, whereas for others, the artifact was observed to start around minute 150, but then dissipated by minute 180 as shown in Fig. 10B. Likely, the variability in timing of this artifact’s onset and offset caused the average effect to appear as is in Fig. 6.
Figure 10.

Representative Rd traces during two experiments. A: Rd for one participant that shows increase at the start of exercise as is expected. B: Rd for another participant that shows a nonphysiological increase at minute 150 at the time that dextrose was increased to help prevent hypoglycemia during exercise.
There are several limitations to this study. First, as noted above there was an issue with the increase in dextrose infusion before the start of exercise. Although we could have avoided this artifact by not increasing dextrose so close to the start of exercise, this would have increased the risk of hypoglycemia occurring in the participants during the study. We wanted to keep study participants safe while also maintaining consistent dextrose infusions during the exercise period without supplying an increase in dextrose to respond to a hypoglycemic event. Also, there appears to be similarity between the change in dextrose infusion rates (Fig. 7) and the change in insulin-mediated glucose uptake (Fig. 6), which may represent an inherent, model-based correlation. Second, our parameters for k12 and k21 were fixed at previously published values, which may have limited how the sampling method accounted for physiological differences between patients. Finally, it is unclear if the methods that we used to estimate non-insulin-mediated glucose uptake using the linear extrapolation to zero insulin as described by Shumak et al. (11) are optimal. We could have potentially used a nonlinear extrapolation such as a Michaelis–Menton relationship between substrate concentration and reaction velocity. However, this may have resulted in significant global underestimation of the non-insulin-mediated effect, and so, we chose to use the linear extrapolation method that has been used by others.
In conclusion, we have described a novel method to quantify insulin-mediated and insulin-independent uptake before, during, and after aerobic exercise in individuals living with T1D, which has been thus far difficult to identify. We found that non-insulin-mediated glucose uptake rose and fell within the exercise period, whereas insulin-mediated glucose uptake had a broader, prolonged response, remaining high after completion of exercise. Basal insulin and exercise intensity each had a significant impact on Rd. Our unique method of using three different infusion rates and two different exercise arms give us some preliminary data points that may be expanded to enhance models used in glycemic control algorithms.
GRANTS
This work was supported by National Institute of Diabetes and Digestive and Kidney Diseases (NIDDK) Grant 1R01 DK110175.
DISCLOSURES
Peter G. Jacobs has a financial interest in Pacific Diabetes Technologies, Inc., a company that may have a commercial interest in the results of this type of research and technology. This potential conflict of interest has been reviewed and managed by OHSU. In addition, he reports research support from Xeris, Dexcom, and Tandem Diabetes Care. Jessica R. Castle has a financial interest in Pacific Diabetes Technologies, Inc., a company that may have a commercial interest in the results of this type of research. This potential conflict of interest has been reviewed and managed by OHSU. In addition, she reports advisory board participation for Zealand Pharma, Novo Nordisk, Insulet, and AstraZeneca, consulting for Dexcom, and a U.S. patent on the use of ferulic acid to stabilize glucagon. Michael C. Riddell reports grant funding from Insulet, nonfinancial support from Dexcom, and personal fees from Medtronic, Novo Nordisk, Lilly, and Zucara. Ahmad Haidar received research support/consulting fees from Eli Lilly, Medtronic, AgaMatrix, Tandem, and Dexcom, and has pending patents in the artificial pancreas area. None of the other authors has any conflicts of interest, financial or otherwise, to disclose.
AUTHOR CONTRIBUTIONS
P.G.J., J.R.C., K.K., D.B., V.G., M.C.R., A.H., and J.E.Y. conceived and designed research; J.R.C., L.M.W., K.K., D.B., V.G., F.G., and J.E.Y. performed experiments; T-T.P.N., P.G.J., D.B., V.G., F.G., and J.E.Y analyzed data; T-T.P.N., P.G.J., J.R.C., L.M.W., M.C.R., A.H., and J.E.Y. interpreted results of experiments; T-T.P.N., P.G.J., D.B., V.G., and J.E.Y. prepared figures; T-T.P.N., P.G.J., J.R.C. and J.E.Y drafted manuscript; T-T.P.N., P.G.J., J.R.C., L.M.W., K.K., M.C.R., and J.E.Y. edited and revised manuscript; T-T.P.N., P.G.J., J.R.C., and J.E.Y approved final version of manuscript.
ACKNOWLEDGMENTS
We acknowledge Dr. Dennis Koop and Jenny Luo from the OHSU Pharmacokinetics Core Lab, Dr. Clive Woffendin and Aaron Clemons from the OHSU Oregon Clinical and Translational Research Institute (OCTRI) research lab, and, in particular, Brian Senf who worked as a research technician in the Division of Endocrinology at OHSU during this study and dedicated significant time and effort to the completion of this project.
REFERENCES
- 1.American Diabetes Association. 2. Classification and diagnosis of diabetes: standards of medical care in diabetes-2020. Diabetes Care 43: S14–S31, 2020. doi: 10.2337/dc20-S002. [DOI] [PubMed] [Google Scholar]
- 2.Cleland SJ, Fisher BM, Colhoun HM, Sattar N, Petrie JR. Insulin resistance in type 1 diabetes: what is 'double diabetes' and what are the risks? Diabetologia 56: 1462–1470, 2013. doi: 10.1007/s00125-013-2904-2. [DOI] [PMC free article] [PubMed] [Google Scholar]
- 3.American Diabetes Association. 5. Facilitating behavior change and well-being to improve health outcomes: standards of medical care in diabetes-2020. Diabetes Care 43: S48–S65, 2020. doi: 10.2337/dc20-S005. [DOI] [PubMed] [Google Scholar]
- 4.Piercy KL, Troiano RP. Physical activity guidelines for Americans from the US Department of Health and Human Services. Circ Cardiovasc Qual Outcomes 11: e005263, 2018. doi: 10.1161/CIRCOUTCOMES.118.005263. [DOI] [PubMed] [Google Scholar]
- 5.Brazeau AS, Mircescu H, Desjardins K, Dube MC, Weisnagel SJ, Lavoie C, Rabasa-Lhoret R. The barriers to physical activity in type 1 diabetes (BAPAD-1) scale: predictive validity and reliability. Diabetes Metab 38: 164–170, 2012. doi: 10.1016/j.diabet.2011.10.005. [DOI] [PubMed] [Google Scholar]
- 6.Castle JR, El Youssef J, Wilson LM, Reddy R, Resalat N, Branigan D, Ramsey K, Leitschuh J, Rajhbeharrysingh U, Senf B, Sugerman SM, Gabo V, Jacobs PG. Randomized outpatient trial of single- and dual-hormone closed-loop systems that adapt to exercise using wearable sensors. Diabetes Care 41: 1471–1477, 2018. doi: 10.2337/dc18-0228. [DOI] [PMC free article] [PubMed] [Google Scholar]
- 7.Jacobs PG, El Youssef J, Reddy R, Resalat N, Branigan D, Condon J, Preiser N, Ramsey K, Jones M, Edwards C, Kuehl K, Leitschuh J, Rajhbeharrysingh U, Castle JR. Randomized trial of a dual-hormone artificial pancreas with dosing adjustment during exercise compared with no adjustment and sensor-augmented pump therapy. Diabetes Obes Metab 18: 1110–1119, 2016. doi: 10.1111/dom.12707. [DOI] [PMC free article] [PubMed] [Google Scholar]
- 8.Henriksen EJ. Invited review: effects of acute exercise and exercise training on insulin resistance. J Appl Physiol (1985) 93: 788–796, 2002. doi: 10.1152/japplphysiol.01219.2001. [DOI] [PubMed] [Google Scholar]
- 9.Wahren J. Glucose turnover during exercise in man. Ann NY Acad Sci 301: 45–55, 1977. doi: 10.1111/j.1749-6632.1977.tb38184.x. [DOI] [PubMed] [Google Scholar]
- 10.Wasserman DH, Geer RJ, Rice DE, Bracy D, Flakoll PJ, Brown LL, Hill JO, Abumrad NN. Interaction of exercise and insulin action in humans. Am J Physiol Endocrinol Metab 260: E37–E45, 1991. doi: 10.1152/ajpendo.1991.260.1.E37. [DOI] [PubMed] [Google Scholar]
- 11.Shumak SL, Gulan M, Zinman B, Gottesman IS. Determination and kinetic analysis of non-insulin mediated glucose uptake in type 1 (insulin-dependent) diabetes mellitus. Diabetologia 32: 28–33, 1989. doi: 10.1007/BF00265400. [DOI] [PubMed] [Google Scholar]
- 12.Basu R, Di Camillo B, Toffolo G, Basu A, Shah P, Vella A, Rizza R, Cobelli C. Use of a novel triple-tracer approach to assess postprandial glucose metabolism. Am J Physiol Endocrinol Metab 284: E55–E69, 2003. doi: 10.1152/ajpendo.00190.2001. [DOI] [PubMed] [Google Scholar]
- 13.Schiavon M. Modeling the Effect of Physical Activity on Postprandial Glucose Turnover (PhD thesis) Pavoda, Italy: University of Padova, Department of Information Engineering, 2014. [Google Scholar]
- 14.Schiavon M, Hinshaw L, Mallad A, Dalla Man C, Sparacino G, Johnson M, Carter R, Basu R, Kudva Y, Cobelli C, Basu A. Postprandial glucose fluxes and insulin sensitivity during exercise: a study in healthy individuals. Am J Physiol Endocrinol Metab 305: E557–E566, 2013. doi: 10.1152/ajpendo.00182.2013. [DOI] [PMC free article] [PubMed] [Google Scholar]
- 15.Clarke WL, Cox DJ, Gonder-Frederick LA, Julian D, Schlundt D, Polonsky W. Reduced awareness of hypoglycemia in adults with IDDM. A prospective study of hypoglycemic frequency and associated symptoms. Diabetes Care 18: 517–522, 1995. doi: 10.2337/diacare.18.4.517. [DOI] [PubMed] [Google Scholar]
- 16.Balady GJ, Chaitman B, Driscoll D, Foster C, Froelicher E, Gordon N, Pate R, Rippe J, Bazzarre T. Recommendations for cardiovascular screening, staffing, and emergency policies at health/fitness facilities. Circulation 97: 2283–2293, 1998. doi: 10.1161/01.CIR.97.22.2283. [DOI] [PubMed] [Google Scholar]
- 17.Bequette BW. Glucose clamp algorithms and insulin time-action profiles. J Diabetes Sci Technol 3: 1005–1013, 2009. doi: 10.1177/193229680900300503. [DOI] [PMC free article] [PubMed] [Google Scholar]
- 18.Shetty VB, Fournier PA, Davey RJ, Retterath AJ, Paramalingam N, Roby HC, Cooper MN, Davis EA, Jones TW. Effect of exercise intensity on lucose requirements to maintain euglycemia during exercise in type 1 diabetes. J Clin Endocrinol Metab 101: 972–980, 2016. doi: 10.1210/jc.2015-4026. [DOI] [PubMed] [Google Scholar]
- 19.Mallad A, Hinshaw L, Schiavon M, Dalla Man C, Dadlani V, Basu R, Lingineni R, Cobelli C, Johnson ML, Carter R, Kudva YC, Basu A. Exercise effects on postprandial glucose metabolism in type 1 diabetes: a triple-tracer approach. Am J Physiol Endocrinol Metab 308: E1106–E1115, 2015. doi: 10.1152/ajpendo.00014.2015. [DOI] [PMC free article] [PubMed] [Google Scholar]
- 20.Radziuk J, McDonald TJ, Rubenstein D, Dupre J. Initial splanchnic extraction of ingested glucose in normal man. Metabolism 27: 657–669, 1978. doi: 10.1016/0026-0495(78)90003-3. [DOI] [PubMed] [Google Scholar]
- 21.Mari A. Estimation of the rate of appearance in the non-steady state with a two-compartment model. Am J Physiol Endocrinol Metab 263: E400– E415, 1992. doi: 10.1152/ajpendo.1992.263.2.E400. [DOI] [PubMed] [Google Scholar]
- 22.Hovorka R, Jayatillake H, Rogatsky E, Tomuta V, Hovorka T, Stein DT. Calculating glucose fluxes during meal tolerance test: a new computational approach. Am J Physiol Endocrinol Metab 293: E610– E619, 2007. doi: 10.1152/ajpendo.00546.2006. [DOI] [PubMed] [Google Scholar]
- 23.Stan Development Team. RStan: the R interface to Stan (Online). https://cran.r-project.org/web/packages/rstan/vignettes/rstan.html [2021 Jan 21].
- 24.Faul F, Erdfelder E, Lang AG, Buchner AG. *Power 3: a flexible statistical power analysis program for the social, behavioral, and biomedical sciences. Behav Res Methods 39: 175–191, 2007. doi: 10.3758/BF03193146. [DOI] [PubMed] [Google Scholar]
- 25.Berger M, Halban PA, Assal JP, Offord RE, Vranic M, Renold AE. Pharmacokinetics of subcutaneously injected tritiated insulin: effects of exercise. Diabetes 28: 53–57, 1979. doi: 10.2337/diab.28.1.s53. [DOI] [PubMed] [Google Scholar]
- 26.McMahon SK, Ferreira LD, Ratnam N, Davey RJ, Youngs LM, Davis EA, Fournier PA, Jones TW. Glucose requirements to maintain euglycemia after moderate-intensity afternoon exercise in adolescents with type 1 diabetes are increased in a biphasic manner. J Clin Endocrinol Metab 92: 963–968, 2007. doi: 10.1210/jc.2006-2263. [DOI] [PubMed] [Google Scholar]
- 27.Tagougui S, Goulet-Gelinas L, Taleb N, Messier V, Suppere C, Rabasa-Lhoret R. Association between body composition and blood glucose during exercise and recovery in adolescent and adult patients with type 1 diabetes. Can J Diabetes 44: 192–195, 2020. doi: 10.1016/j.jcjd.2019.05.013. [DOI] [PubMed] [Google Scholar]
- 28.Resalat N, El Youssef J, Reddy R, Jacobs PG. Design of a dual-hormone model predictive control for artificial pancreas with exercise model. Annu Int Conf Proc IEEE Eng Med Biol Soc 2016: 2270–2273, 2016. doi: 10.1109/EMBC.2016.7591182. [DOI] [PMC free article] [PubMed] [Google Scholar]
- 29.Resalat N, El Youssef J, Reddy R, Jacobs PG. Evaluation of model complexity in model predictive control within an exercise-enabled artificial pancreas. IFAC-PapersOnLine 50: 7756–7761, 2017. doi: 10.1016/j.ifacol.2017.08.2270. [DOI] [Google Scholar]
- 30.Fabris C, Nass RM, Pinnata J, Carr KA, Koravi CLK, Barnett CL, Oliveri MC, Anderson SM, Chernavvsky DR, Breton MD. The use of a smart bolus calculator informed by real-time insulin sensitivity assessments reduces postprandial hypoglycemia following an aerobic exercise session in individuals with type 1 diabetes. Diabetes Care 43: 799–805, 2020. doi: 10.2337/dc19-1675. [DOI] [PMC free article] [PubMed] [Google Scholar]
- 31.Cinar A. Multivariable adaptive artificial pancreas system in type 1 diabetes. Curr Diab Rep 17: 88, 2017. doi: 10.1007/s11892-017-0920-1. [DOI] [PubMed] [Google Scholar]
- 32.Resalat N, Hilts W, Youssef JE, Tyler N, Castle JR, Jacobs PG. Adaptive control of an artificial pancreas using model identification, adaptive postprandial insulin delivery, and heart rate and accelerometry as control inputs. J Diabetes Sci Technol 13: 1044–1053, 2019. doi: 10.1177/1932296819881467. [DOI] [PMC free article] [PubMed] [Google Scholar]
- 33.Riddell MC, Gallen IW, Smart CE, Taplin CE, Adolfsson P, Lumb AN, Kowalski A, Rabasa-Lhoret R, McCrimmon RJ, Hume C, Annan F, Fournier PA, Graham C, Bode B, Galassetti P, Jones TW, Millan IS, Heise T, Peters AL, Petz A, Laffel LM. Exercise management in type 1 diabetes: a consensus statement. Lancet Diabetes Endocrinol 5: 377–390, 2017. [Erratum in Lancet Diabetes Endocrinol 5: e3, 2017]. doi: 10.1016/S2213-8587(17)30014-1. [DOI] [PubMed] [Google Scholar]