Abstract
Cellular mechanics drives epithelial morphogenesis, the process wherein cells collectively rearrange to produce tissue-scale deformations that determine organismal shape. However, quantitative understanding of tissue mechanics is impaired by the difficulty of direct measurement of stress in-vivo. This difficulty has spurred the development of image-based inference algorithms that estimate stress from snapshots of epithelial geometry. Such methods are challenged by sensitivity to measurement error and thus require accurate geometric segmentation for practical use. We overcome this difficulty by introducing a novel approach - the Variational Method of Stress Inference (VMSI) - which exploits the fundamental duality between stress and geometry at equilibrium of discrete mechanical networks that model confluent cellular layers. We approximate the apical geometry of an epithelial tissue by a 2D tiling with Circular Arc Polygons (CAP) in which arcs represent intercellular interfaces defined by the balance of local line tension and pressure differentials between adjacent cells. The mechanical equilibrium of such networks imposes extensive local constraints on CAP geometry. These constraints provide the foundation of VMSI which, starting with images of epithelial monolayers, simultaneously approximates both tissue geometry and internal forces, subject to the constraint of equilibrium. We find VMSI to be more robust than previous methods. Specifically, the VMSI performance is validated by the comparison of the predicted cellular and mesoscopic scale stress with the measured myosin II patterns during early Drosophila embryogenesis. VMSI prediction of mesoscopic stress tensor correlates at the 80% level with the measured myosin distribution and reveals that most of the myosin activity in that case is involved in a static internal force balance within the epithelial layer. In addition to insight into cell mechanics, this study provides a practical method for non-destructive estimation of stress in live epithelial tissue.
Cell and tissue mechanics is an important factor that both affects and regulates animal and plant development and thus is a subject of active study in developmental biology and biophysics, reviewed extensively in [1–7]. Here we focus on the mechanics of animal epithelial cells that compose tissues in the form of two-dimensional monolayers with tight junctions between adjacent cells and adhesion (of the basal cellular surface) to the substrate extracellular matrix (ECM) [8].
In the absence of a rigid substrate, the mechanical properties of such monolayers are dominated by the tissue-wide network formed by cytoskeletal cortices coupled by intercellular adherens junctions [9–12]. Cytoskeletal cortices are localized to the lateral sides of cells, just below the apical surface, and are made of actin fibers cross-linked by myosin II motors that actively generate tension within the cortex. The shape of cells within the tissue is determined by the balance of local actomyosin cytoskeletal contractility and the intracellular osmotic pressure [13], which acts to oppose the decrease in total cellular volume [14, 15]. For the purpose of tissue-scale mechanics, the full three-dimensional force balance that shapes individual cells can be approximated by an effective two-dimensional model of the apical cytoskeletal network. In this simplified 2D view, the contractility of the junctional actomyosin “belts” balances against an effective two-dimensional pressure that prevents the collapse of the apical area under cortical tension: this type of an approximation underlies the widely used “vertex model” approach to epithelial cell mechanics [1, 16–18]. Vertex models, along with alternative models of epithelial mechanics, are reviewed in detail [19].
Measuring mechanical properties of cells and tissues in-vivo presents a considerable experimental challenge. AFM [20] and optical tweezer contact microscopy [21] have been used to probe the local rheology of individual cellular interfaces at great resolution but do not provide a direct readout of internal stress. The most common method for detecting stress in vivo is UV laser ablation, in which focused light ‘cuts’ the cytoskeletal bundle abutting a cell-cell interface and the resultant retraction velocity is used as a proxy for the local cortical tension [22]. This method is convenient, as it does not require any special preparation of the sample, however it is destructive and hence does not allow measurement of the global stress distribution across the tissue. Large-scale laser ablation macroscopically wounds the tissue and utilizes the resultant strain as a proxy for coarse stress, at the cost of a strongly destructive measurement. [23]. Other methods use genetically encoded FRET tension sensors engineered into load carrying proteins [24] or employ measurements of deformation with implanted oil droplets[25, 26]. These methods require specially prepared samples and are technically challenging, both in implementation and in quantitative interpretation. A comprehensive review of experimental force measurement techniques is discussed in [27].
The difficulty of direct experimental measurement of mechanical stress in developing tissues has stimulated alternative approaches that seek to leverage the availability of live imaging data [28–31]. For example [29, 30] introduced a method for inferring cellular stress from observed 2D cell geometry based on the assumption that the tissue is instantaneously in a mechanical equilibrium, described by a model parameterized directly by intercellular pressure and tension. In the simplest versions of the method [29, 30] 2D geometry was parametrized by a polygonal tiling generally used in Vertex Models [1, 16]. The validity of this approach, of course, rests upon the accuracy of the assumptions and approximations, which varies between tissues and conditions and has to be evaluated in each case; recent studies on force inference techniques show agreement [32]. The major challenge to the approach stems from the sensitivity to both noise in the measurement of cellular geometry as well as on the chosen prior distribution on the boundary conditions at the edge of the observed tissue domain. These difficulties have necessitated additional assumptions, introduced to regularize the inference problem [29–31]. A particularly direct generalization aims to extract additional information from the image data, most obviously provided by the observable curvature of cell interfaces [29, 33]: an example of such an approach is the CellFIT toolkit [33]. Sensitivity to noise and the quality of the underlying image analysis however remains a major issue to using the method widely. Below, we develop a new approach, improving the image-based “mechanical inference” to the extent that makes it broadly applicable in the practice of experimental data analysis.
Specifically, in this paper we explore the general constraints imposed by mechanical equilibrium on the geometry of 2D cellular arrays that balance arbitrary interfacial tension against differential cellular pressure. Our analysis will uncover the mathematical duality between the geometry of the cell array and a triangulation formed by the equilibrium values of interfacial tensions [18], which in the general case of non-uniform pressures turns out to be non-planar. This duality furnishes a set of highly nontrivial, local constraints on cellular geometry that can be used to simultaneously carry out image segmentation and infer internal forces. The stability of our mechanical inference method is achieved through a variational formulation of the inference problem. The power of this approach is twofold: (i) our representation of tissue geometry is constrained to be in mechanical equilibrium throughout the analysis and (ii) the inference is overdetermined and thus more robust with respect to image noise or information missing at the boundaries. As such, the constrained variational approach provides a stringent, quantitative assay for the compatibility of the network geometry with force balance.
Using synthetic data as a comparative benchmark, we show that our algorithm correctly infers mechanics under arbitrary pressure differentials and moderate measurement noise, performing better than existing methods. To illustrate its practical utility, we apply the algorithm to live imaging data from the early stages of Drosophila embryonic development and demonstrate its ability to accurately predict - based on cell geometry alone - the spatial distribution and anisotropy of myosin II, the molecular motor known as a generator of mechanical stress in the developing embryo [2, 34–36]. Synthetic and real data tests suggest practical utility for the new mechanical inference algorithm as a tool for quantifying stress distribution in live tissue in the absence of direct measurement of local forces. The code used to segment apical cell morphology and to perform the variational inference can be found online on Github at nnoll/tissueAnalysisSuite.
Mechanical equilibrium of 2D cell arrays with internal tension and pressure
In order to model the mechanical state of the 2D epithelial tissue, we utilize a generalization of the standard Vertex Model [16] which represents the epithelium by a planar polygonal tiling parameterized solely by the positions of vertices, the location where three or more cells meet, hereafter denoted by ri. We approximate the geometry of cells in the epithelial layer by a Circular Arc Polygonal (CAP) tiling, as shown in Fig. 1A, replacing the straight polygonal edges with circular arcs that correspond to tensed interfaces balancing pressure differentials between the adjacent cells as described by the Young-Laplace (Y-L) law [33, 37]. The equilibrium geometry of a CAP tiling is fully specified by the set of effective interfacial tensions Tαβ, where α, β label the cells partitioned by the given edge, and the set of effective (2D) hydrostatic pressures pα representing the contribution of bulk stress from the cell to the 2D apical force balance.
Figure 1. Circular Arc Polygonal (CAP) tiling and its dual tension triangulation.
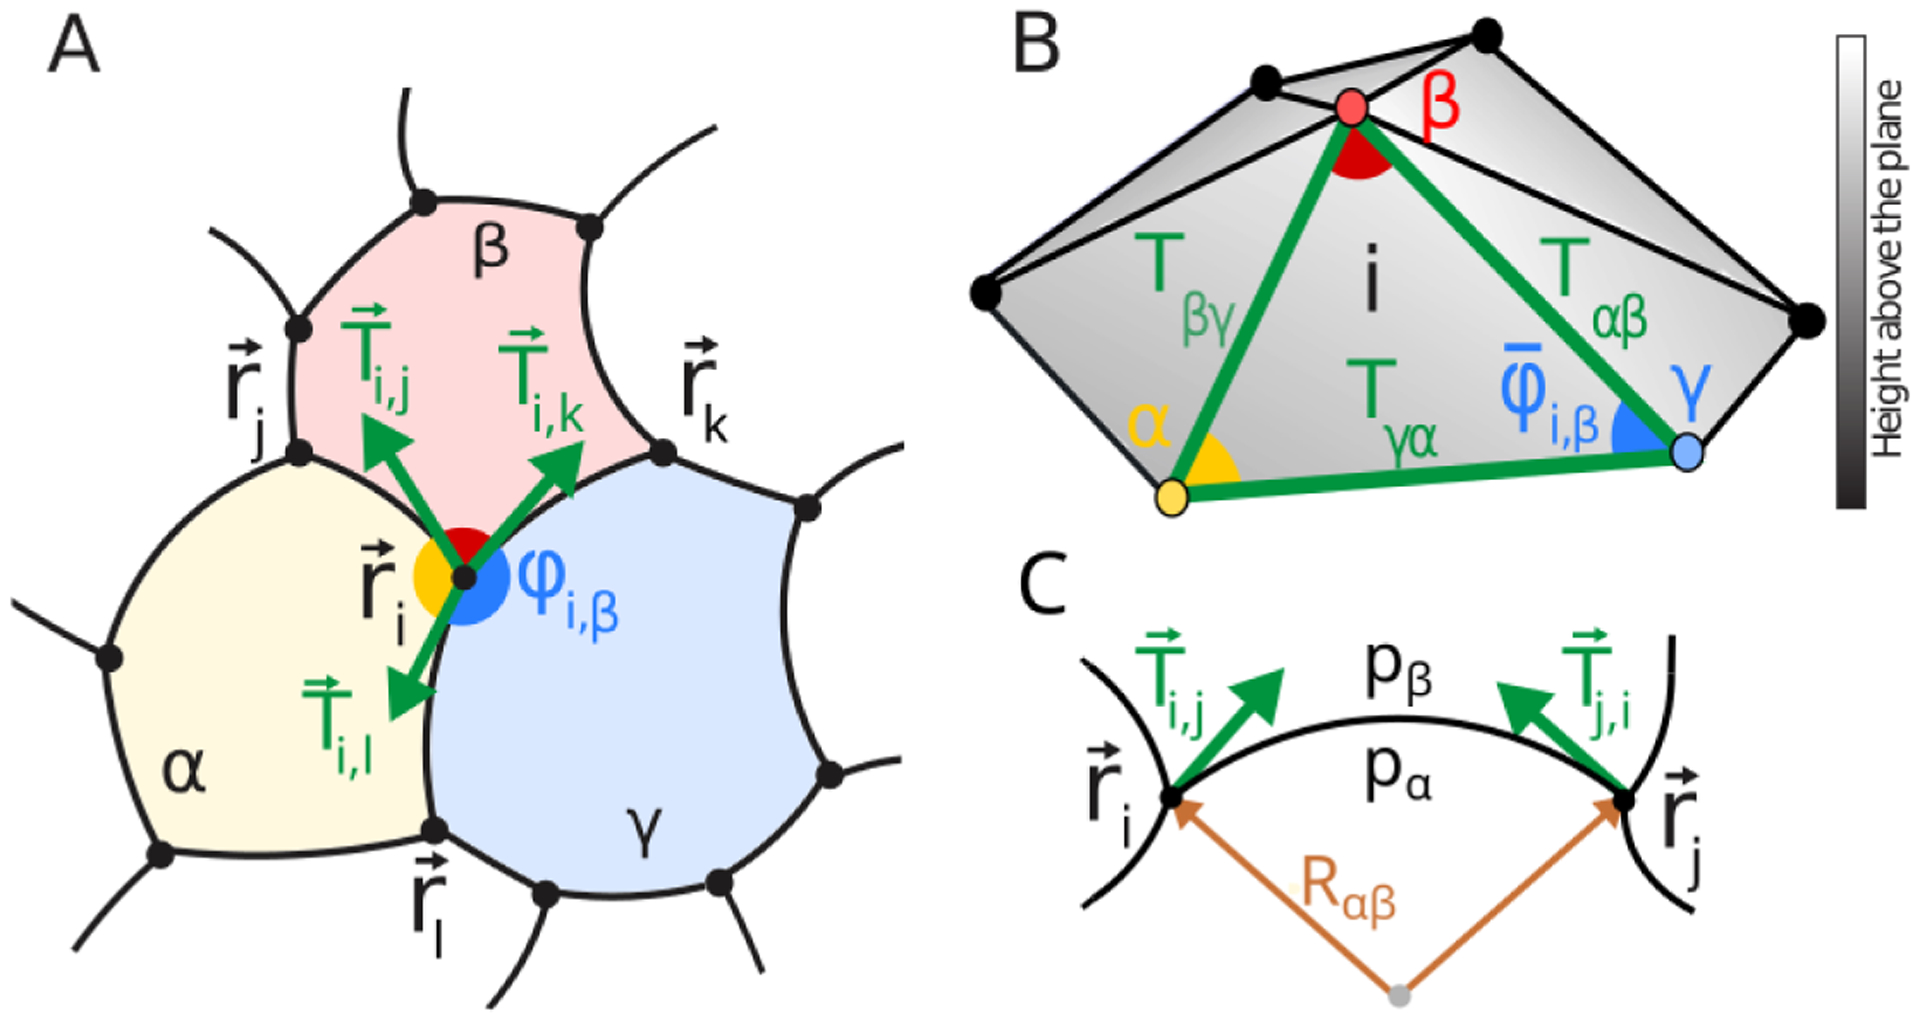
A) Circular arc polygons provide an approximate representation of the equilibrium geometry of a cell array, in which edges are represented as circular arcs and vertices are loci where three cells meet. ϕj,β ~ π implies that Tij << Tik, Til B) Force balance at vertex i requires the three tension vectors tangent to each edge to sum up to zero, which defines a local triangle. As adjacent vertices in A) share edges, the tension triangles of each vertex form a triangulated surface - the dual representation of force balance - with each triangular face corresponding to each vertex. Because of pressure differentials between cells, the dual triangulation does not form a flat surface. The height above the xy plane is represented as grayscale. C) At equilibrium, the curvature of edge αβ is controlled by pressure differences between adjacent cells, pα − pβ and the interfacial tension Tαβ by the Young-Laplace law [37].
The dimensionality of the space of general CAP tilings is given by the number of internal degrees of freedom: two positional degrees of freedom for each vertex plus the radius of curvature for each edge. The total count is 2v+e = 7c where c, e, v respectively denote the number of cells, edges and vertices within the tiling, which satisfy v = 2c and e = 3c. (This count, which follows from Euler’s Formula [38], is exact on a torus and is approximate up to the boundary corrections, for a large planar array). Conversely, the mechanical state of the network is parameterized by e + c = 4c parameters corresponding to independent interfacial tensions and cell pressures. Since the dimension of the space of all equilibrium CAP tilings, 4c, is lower than the dimension of general CAP tiling space, 7c, we conclude that mechanical equilibrium implies on average three constraints per cell. Our analysis below will i) define a relation between the tiling geometry and tensions and pressures and ii) uncover the geometric constraints associated with mechanical balance. These constraints on CAP geometry will serve as the foundation for our Variational Method of Stress Inference (VMSI).
Mechanical equilibrium of a CAP network is reached when tensions balance at every vertex and interfacial curvature obeys the Young-Laplace Law, which relates the radius of the circular arc forming interface αβ, Rαβ to interfacial tension and the pressure differential across the interface: Rαβ = Tαβ/[pα − pβ]. Tension acts tangentially along network edges: Fig. 1A depicts an example of force balance for vertex i due to tensions of interfaces that connect it with adjacent vertices j, k, l. Specifically, tension Tij in the edge connecting vertices i and j acts on vertex i with the force vector Ti,j acting along the ij edge tangent at vertex i (and pointing away from i). Similarly, we define the force vector Tj,i acting on vertex j. Importantly, these two vectors are not parallel, because CAP edges are generally curved, however both have the same magnitude equal to the edge tension |Ti,j| = |Tj,i| = Tij. We note that an edge can be labeled in two equivalent ways: either by the labels of cells the edge partitions or the vertices that the edge connects – e.g. edge ij in Fig. 1A separates cells α, β – so we shall define Tij = Tαβ and hereafter use both schemes interchangeably to simplify labelling in different contexts. Hence force balance at vertex i requires:
| (1) |
(with j, k, l being vertices adjacent to i). Force balance can be re-interpreted geometrically as a triangle formed by the tension vectors incident on vertex i, with adjacent cells α, β, γ, associated as the vertices of the ‘dual’ tension triangle. Crucially, as the local force balance triangles associated with adjacent vertices share an edge, stitching together force balance conditions on all network vertices defines a tension triangulation ‘dual’ to the CAP tiling. Dual triangulation vertices correspond to cells and triangular faces correspond to the vertices of the original CAP tiling. As discussed further in Appendix A, curved edges impose angular ‘defects’ between neighboring triangles, ultimately resulting in non-planarity of the dual triangulation, depicted in Fig. 1B.
We proceed to define the equilibrium constraints on CAP geometry and define the explicit relations between tensions, pressures and geometric observables. By applying the Sine Law to an individual dual triangle, one can relate the ratio of tensions in adjacent edges to the corresponding CAP angles, e.g. for the dual triangle i (associated with adjacent cells α, β, γ): Tαβ/Tαγ = sin φi,γ/sin φi,β. Multiplying such ratios for a set of triangles that share a dual triangulation vertex – i.e. a cell – uncovers a non-trivial constraint on CAP tiling angles
| (2) |
where the product is taken over the set of vertices i that belong to cell α, while β and γ label other cells adjacent to i in clockwise order, which means that each edge tension Tαβ of the cell will appear exactly twice (as edge tension is the equivalent at both bounding vertices) in the second product, once in the numerator and once in the denominator, leading to the above equality to 1. Eq. (2) defines c (one per cell) non-trivial constraints on the angles of an equilibrium CAP network which we recognize as the generalized form of the geometric compatibility condition introduced in [18]. Provided that the geometric constraints on the CAP tiling given by Eq. (2) are satisfied, the dual tension triangulation specifies all Tαβ (up to an overall scale) - the key property making inference possible.
Given the set of tensions Tαβ computable from the tension-triangulation, pressures can be computed on the basis of the Young-Laplace Law, depicted in Fig. 1C, by solving a discrete Poisson equation on the dual triangulation:
| (3) |
Eq. (3) represents c equations (one for each α) that define c pressure unknowns up to the homogeneous solution which has to be fixed by the boundary conditions on pα.
Importantly, the Y-L law implies that Tαβ/Rαβ + Tβγ/Rβγ + Tγα/Rγα = 0 must be satisfied at each vertex (e.g. vertex i shared by cells α, β, γ). Using the Sine Law on the dual triangulation, this constraint is recast in the purely geometric form
| (4) |
which defines v = 2c (one per each vertex) geometric constraints that account for the difference in the number of pressure variables, c, and the number of Rαβ variables, e = 3c. Together, Eqs. (2, 4) impose 3c constraints on a equilibrium CAP network so that the dimensionality of the latter is indeed given by 4c, which is equal to the total number of tension and pressure variables. We note that mechanical equilibrium considerations discussed above cannot fix the overall scale of tensions and pressures and, as evident from Eq. (3), even with fixed tensions, pressure is defined only up to an additive constant.
Variational approach to image based force inference.
In principle, one can infer the underlying balanced mechanical state - the set of equilibrium interfacial tensions {Tαβ} and pressures {pα} - by building the tension-triangulation: utilizing local edge angles at each vertex to build each dual triangular face, and subsequently solving Eq. (3) to obtain cell pressures. This approach is contingent upon cell array geometry satisfying compatibility conditions defined by Eqs. (2, 4). In practice it suffers from two major problems: (i) real cellular arrays undergoing morphogenesis are expected to be close to, but not exactly in, mechanical equilibrium, (ii) the measurement of array geometry from imaging data will always be noisy and imperfect. As a result, an algorithm attempting to stitch together a global tension triangulation could rapidly accumulate errors that would dramatically impair the resulting inference.
Recognizing that mechanical equilibrium cell array is at best an approximation to any observed epithelial tissue, it makes sense to approach the inference problem in the framework of least-square fitting. Specifically, the idea is to approximate the observed cell array with the closest equilibrium CAP tiling. We begin by parameterizing the CAP tiling by circular arc centroids ραβ (using from here on the bold face to denote 2D vectors) and the associated radii of curvature Rαβ and minimize the variational pseudo-energy function
| (5) |
rαβ(n) denotes the position of nth pixel on edge α, β obtained directly from the segmentation and Nαβ denotes the number of pixels segmented per edge. Eq. (5) has a simple geometric interpretation - it penalizes the Euclidean distance between the estimated and measured circular arc for each pixel of a segmented edge. A graphical example of the fitting is shown in Fig. 2A.
Figure 2. Determination of equilibrium CAP tilings.
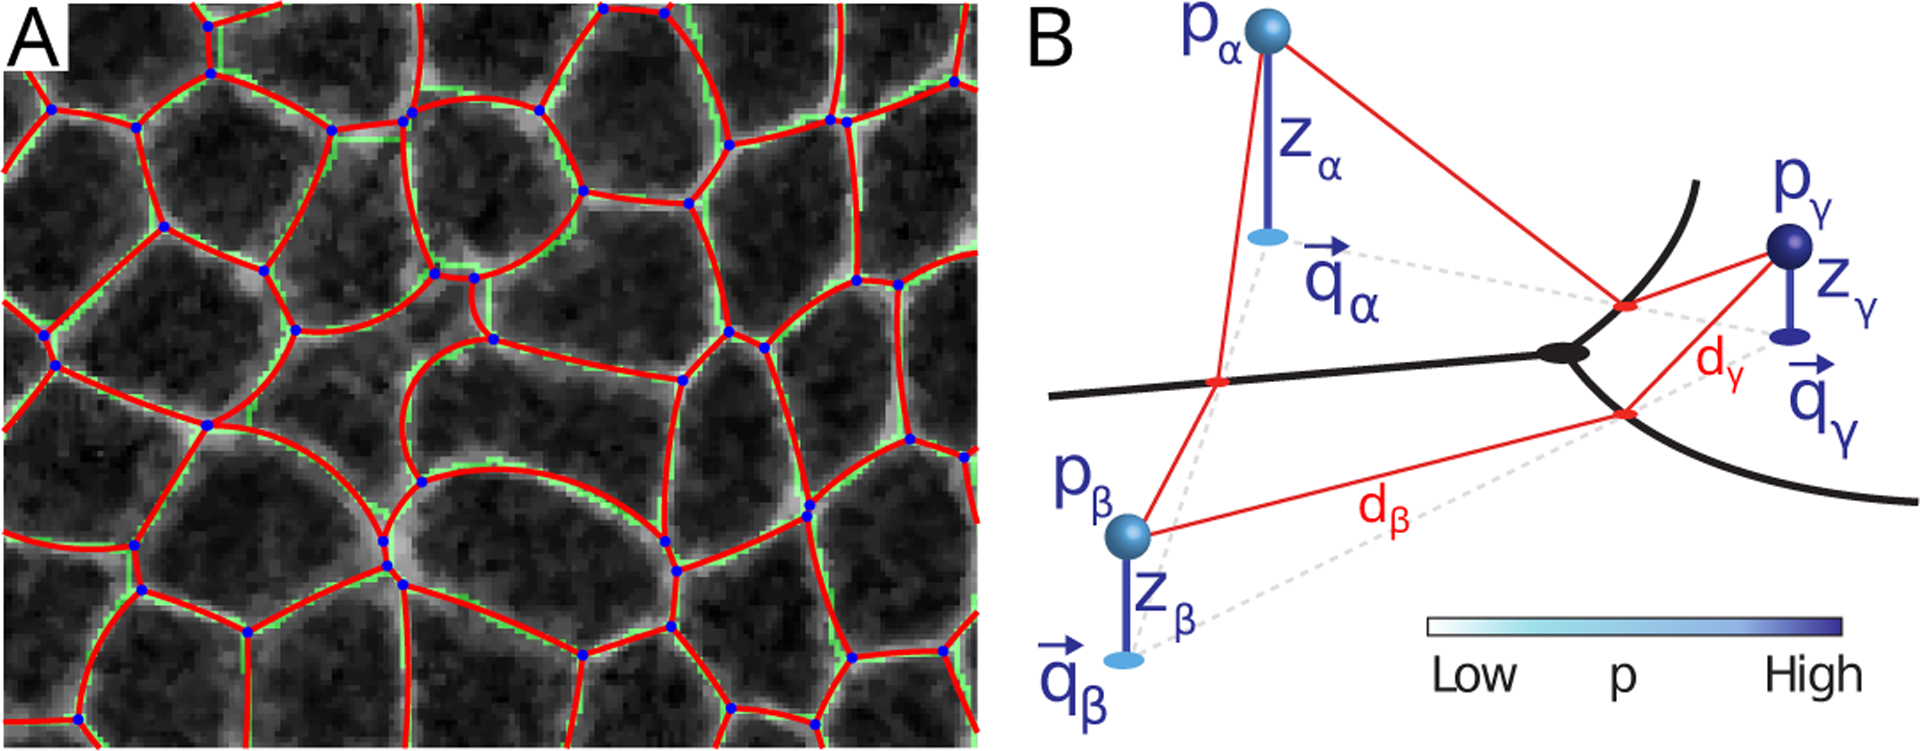
A) Fitting an equilibrium CAP tiling to imaging data. The best fit to raw data (shown in gray scale) by an equilibrium CAP tiling found by minimizing Eq. 5, is shown in red (with vertex positions are in blue). The CAP contour is close, but distinct from the result of standard cell segmentation (see Methods), here shown in green. B) An example of vertex position ri derived from the generalized Voronoi construction - i.e. generating points qα displaced to height zα above the plane and a metric rescaling pα. Each CAP edge βγ is the locus of points with a fixed ratio of distances to a corresponding pair of generating points - e.g. in the above image. The vertex is defined by the intersection of all three arcs. Parameters of this generalized Voronoi construction (including pα) provide a convenient set of reduced variables used in the minimization of Eq. 5.
Arc centroids ραβ and radii Rαβ enter as 2e+e = 9c variational parameters in Eq. (5). Yet, to form a CAP array, the three circles drawn from centroids corresponding to edges that meet at one vertex must all pass through the same point which defines that vertex. This implies v constraints, reducing the number of degrees of freedom to 9c − v = 7c which is exactly the number necessary to describe a general CAP tiling. We, however, wish to constrain our variational approach further, to the subset of CAP tilings corresponding to mechanical equilibrium, which has to satisfy geometric constraints imposed by Eqs. (2, 4).
To implement these constraints we express ραβ and Rαβ in terms of a smaller number of independent variables that explicitly restrict our variational search to the 4c-dimensional space of equilibrium CAP tilings. In Appendix B, we demonstrate that all constraints are explicitly solved by the following representation for arc centroids.
| (6) |
and the radii of curvature
| (7) |
in terms of 4c independent variables {qα, zα, pα}. These variables preserve the geometric constraints defined by Eqs. (2, 4) and provide an explicit, local expression for the tensions via the Y-L law and Eq. 7. Our parameterization shows centroids of edge circular arcs that meet at a vertex are collinear at mechanical equilibrium, as previously noted in foams [39]. We note that Eqs. (6, 7) are explicitly invariant with respect to rescaling of pα.
The reduced variables defined above can be interpreted geometrically in terms of the generalized Voronoi construction that can be used to generate equilibrium CAP tilings (see Fig. 2B). Specifically, we define the distance from point r in the plane to a generating point α positioned at {qα, zα}, with zα denoting the height above the xy plane, as shown in Fig. 2B, as
| (8) |
Each edge αβ of an equilibrium CAP tiling is the locus of points r that satisfy relative to the corresponding pair of generating points. The general solution for the edge geometry is the circle with centroid ραβ and radius Rαβ given by Eqs. (6, 7) respectively. The connection with the standard Voronoi construction becomes evident when all pα are set to one and all zα are set to zero, in which case the edge becomes a straight line bisecting qα − qβ. In that case qα are simply the vertices of the dual Delaunay triangulation. Furthermore, we note that in the constant pressure limit describe the isogonal deformations of the polygonal cell arrays corresponding to equilibrium Tension Networks [18].
The reduced variable representation given by Eqns. (6, 7) makes the task of finding the best fitting equilibrium CAP tiling relatively straightforward. Given a grayscale image of cellular boundaries in an epithelial monolayer, corresponding to a large number of cells (~20–1000) with interfaces resolved at a pixel level, we proceed by minimization of Eq. (5) with respect to reduced variables. Minimization of Eq. (5) is a non-linear optimization problem subject to linear inequalities on ’s that ensure positivity of the argument of the square root in Eq. (7). We solve the problem computationally using MATLAB’s implementation of the interiorpoint algorithm. The simple choice of starting the iteration with zα = 0 and the estimate of {pα, qα} from the observed set of network angles (as explained in detail in the Appendix C) was found to produce reliable convergence. For approximately 1000 cells, the minimization takes a few minutes on a personal laptop.
Validation of the Variational Inference Method.
To evaluate the performance of VMSI method, we tested it against synthetically generated data. Specifically, we performed a systematic sensitivity analysis of our algorithm, and two previous inference schemes [31, 33], for cellular networks in the presence of variable noise and pressure differentials. Under low noise and small intracellular pressure differentials, all algorithms performed equally well. However, as exemplified by Fig. 3, we found the variational inference to be significantly more accurate in the face of moderate to high measurement noise and large pressure differentials. (See Appendix D for more details on the performance of the VMSI algorithm in comparison to [31, 33].)
Figure 3. Validation of VMSI for force inference using synthetic data.
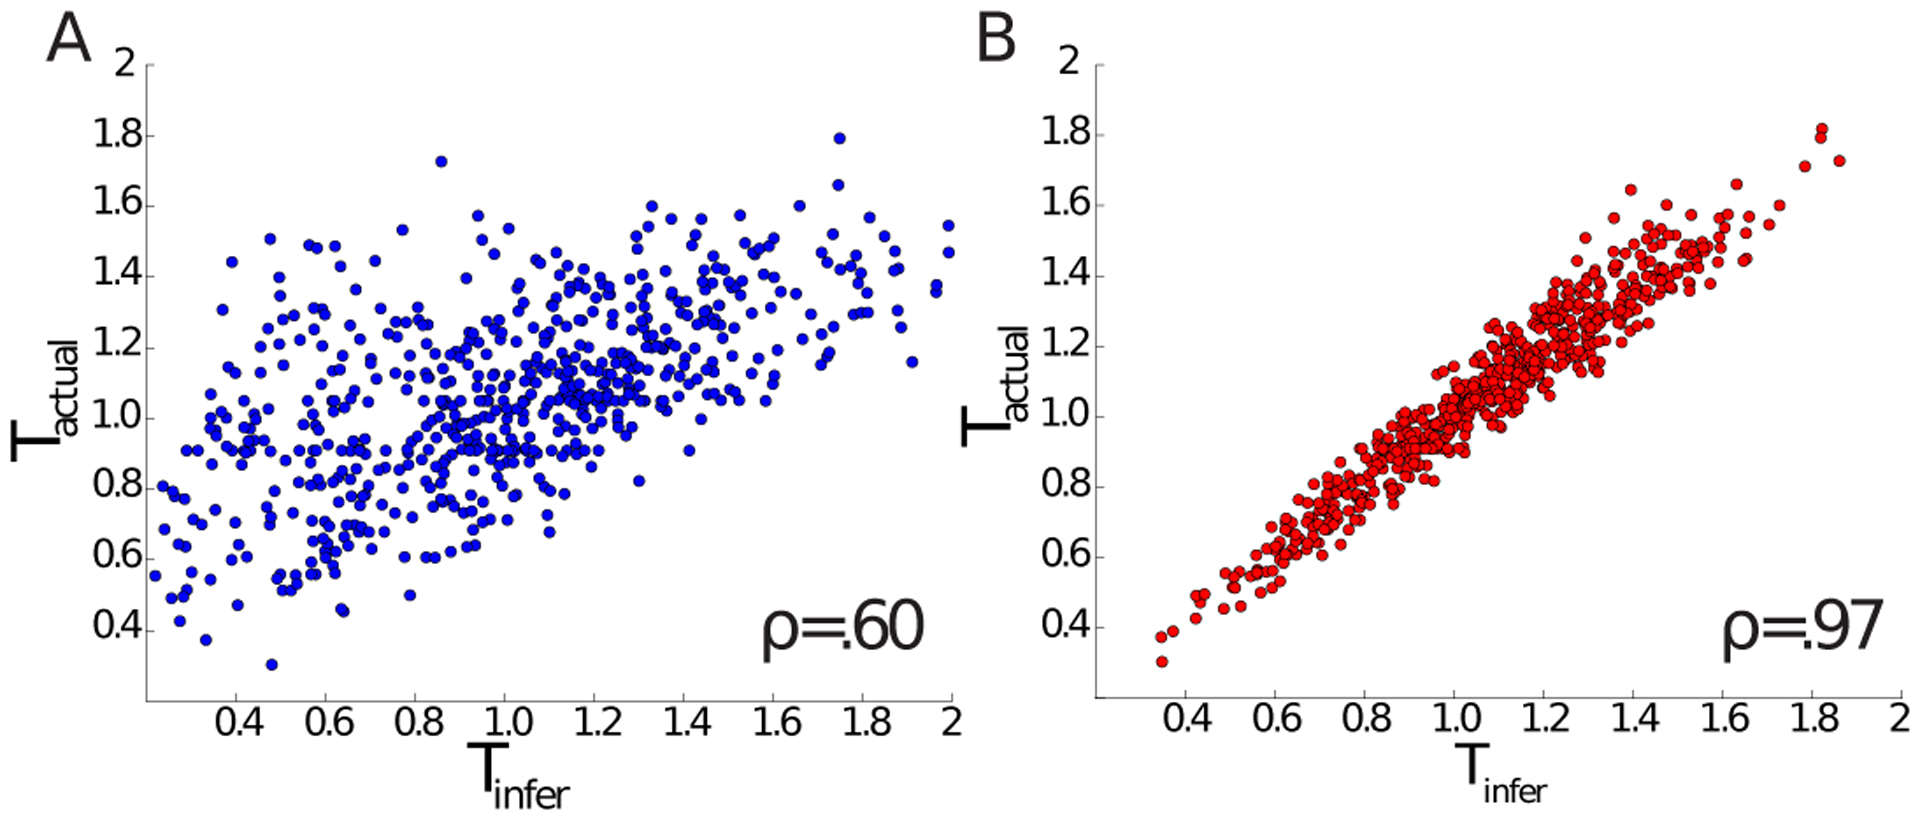
A) Comparison of actual and inferred tensions based on the “matrix inverse”-type inference method introduced in [29] made over-determined using measured edge curvature data, as in [33]. 10% noise was added to the synthetic input data (see Appendix D for details). ρ denotes the Pearson’s correlation coefficient. B) Same as (A) but using the VMSI on the same synthetic data. Note the significant increase of the correlation coefficient.
The key to the improved performance is the overconstrained nature of the present formulation of the mechanical inference problem which combines the estimation of geometric parameters with force inference into a single variational analysis of imaging data. We found empirically that the redundancy of parameterization not only stabilizes the inference in the presence of noise, it also allows us to infer forces at the boundary using just the cell morphology in the 2D bulk. In short, the method is local and thus immediately applicable to inference of intra-tissue forces, as will be discussed below.
Local and global stress inference and its in vivo correlates.
The inferred set of interfacial tensions and cellular pressures allows us to construct a stress tensor for an epithelial layer in mechanical equilibrium. Over the 2D “bulk” of cell α, the stress tensor is isotropic and constant σab = pαδab (where a, b index spatial dimensions) and on edge αβ. One can average this quantity over cell area Aα:
| (9) |
where {β}α denotes all cells connected to cell α and integration is taken along the circular arcs at the perimeter of cell α. Eq. 9 is general for any suspension of force-free particles [40]. In practice, it is useful to coarse-grain the tensor by averaging over neighboring cells to obtain an approximation to the continuum stress tensor. In the following section, we verify the utility of the proposed mechanical inference by comparing the inferred stress tensor to known biological correlates of stress.
We now assay the utility of the VMSI algorithm to imaging data from in-vivo epithelial monolayers. Ideally we would test VMSI against direct measurements of stress. Presently, the most reliable readout of local stress in live tissue is provided by observed levels of (fluorescent labelled) junctional myosin, which has been previously demonstrated to correlate with local interfacial tension measured by laser ablation [2]. We shall carry out the comparison between inferred stress and observed myosin level first on the scale of cells, then on the scale of the whole tissue, using the data on early Drosophila embryonic development.
During the initial stages of Drosophila embryonic development, the ellipsoidal monolayer of epithelial cells forming the embryo undergoes a series of non-trivial mechanical transformations. Immediately following the formation of the ventral furrow (VF) - the first step of gastrulation - Drosophila embryo undergoes germ-band extension (GBE): a major morphogenetic movement involving a convergent extension of the lateral ectoderm, which approximately doubles its length along the embryo’s anterior-posterior (AP) axis. This process has been demonstrated to be driven by the activity of the junctional pool of myosin II, which exhibits a non-uniform and anisotropic distribution on the surface of the embryo, in particular, forming contractile supercellular cables that run along the dorsal-ventral (DV) axis of the embryo [34, 36, 42]. Laser ablation assays have demonstrated that these myosin cables, associated with DV oriented edges, exhibit significantly higher cortical tension than AP oriented cell junctions [42, 43]. The quantitative relation between myosin and mechanical stress was further elaborated in our earlier study of morphogenetic flow [34] which demonstrated that a symmetric 2D tensor mab describing coarse-grained distribution of myosin is a useful proxy for the stress tensor.
Applying VMSI to the embryonic epithelium images [34] we found that cell-array geometry observed over the first 60 minutes of convergent extension, is quite well approximated by an equilibrium cell network: 〈E〉 ≈ 1, which means our best fit equilibrium CAP geometry differs from the image segmentation by on average of one pixel per edge (with the median pixel count per edge being 25)! The complete distribution of residuals over time can be found in the Appendix F.
Fig. 4 shows results of the analysis on the lateral ectoderm during GBE. Qualitatively, the inferred force map exhibits anisotropic stress cables that run along the DV axis in agreement with previous studies [42]. For a quantitative comparison, we compute the correlation coefficient of tension inferred on individual cellular interfaces with the myosin line density measured on same interfaces: a histogram of the calculated results for each time point is shown in Fig. 4C. The mean correlation coefficient, ρ ~ .4, is a two-fold improvement over the earlier “matrix inverse” method [29].
Figure 4. Stress inference results compared to measured myosin distribution for the germ-band extension in Drosophila embryo.
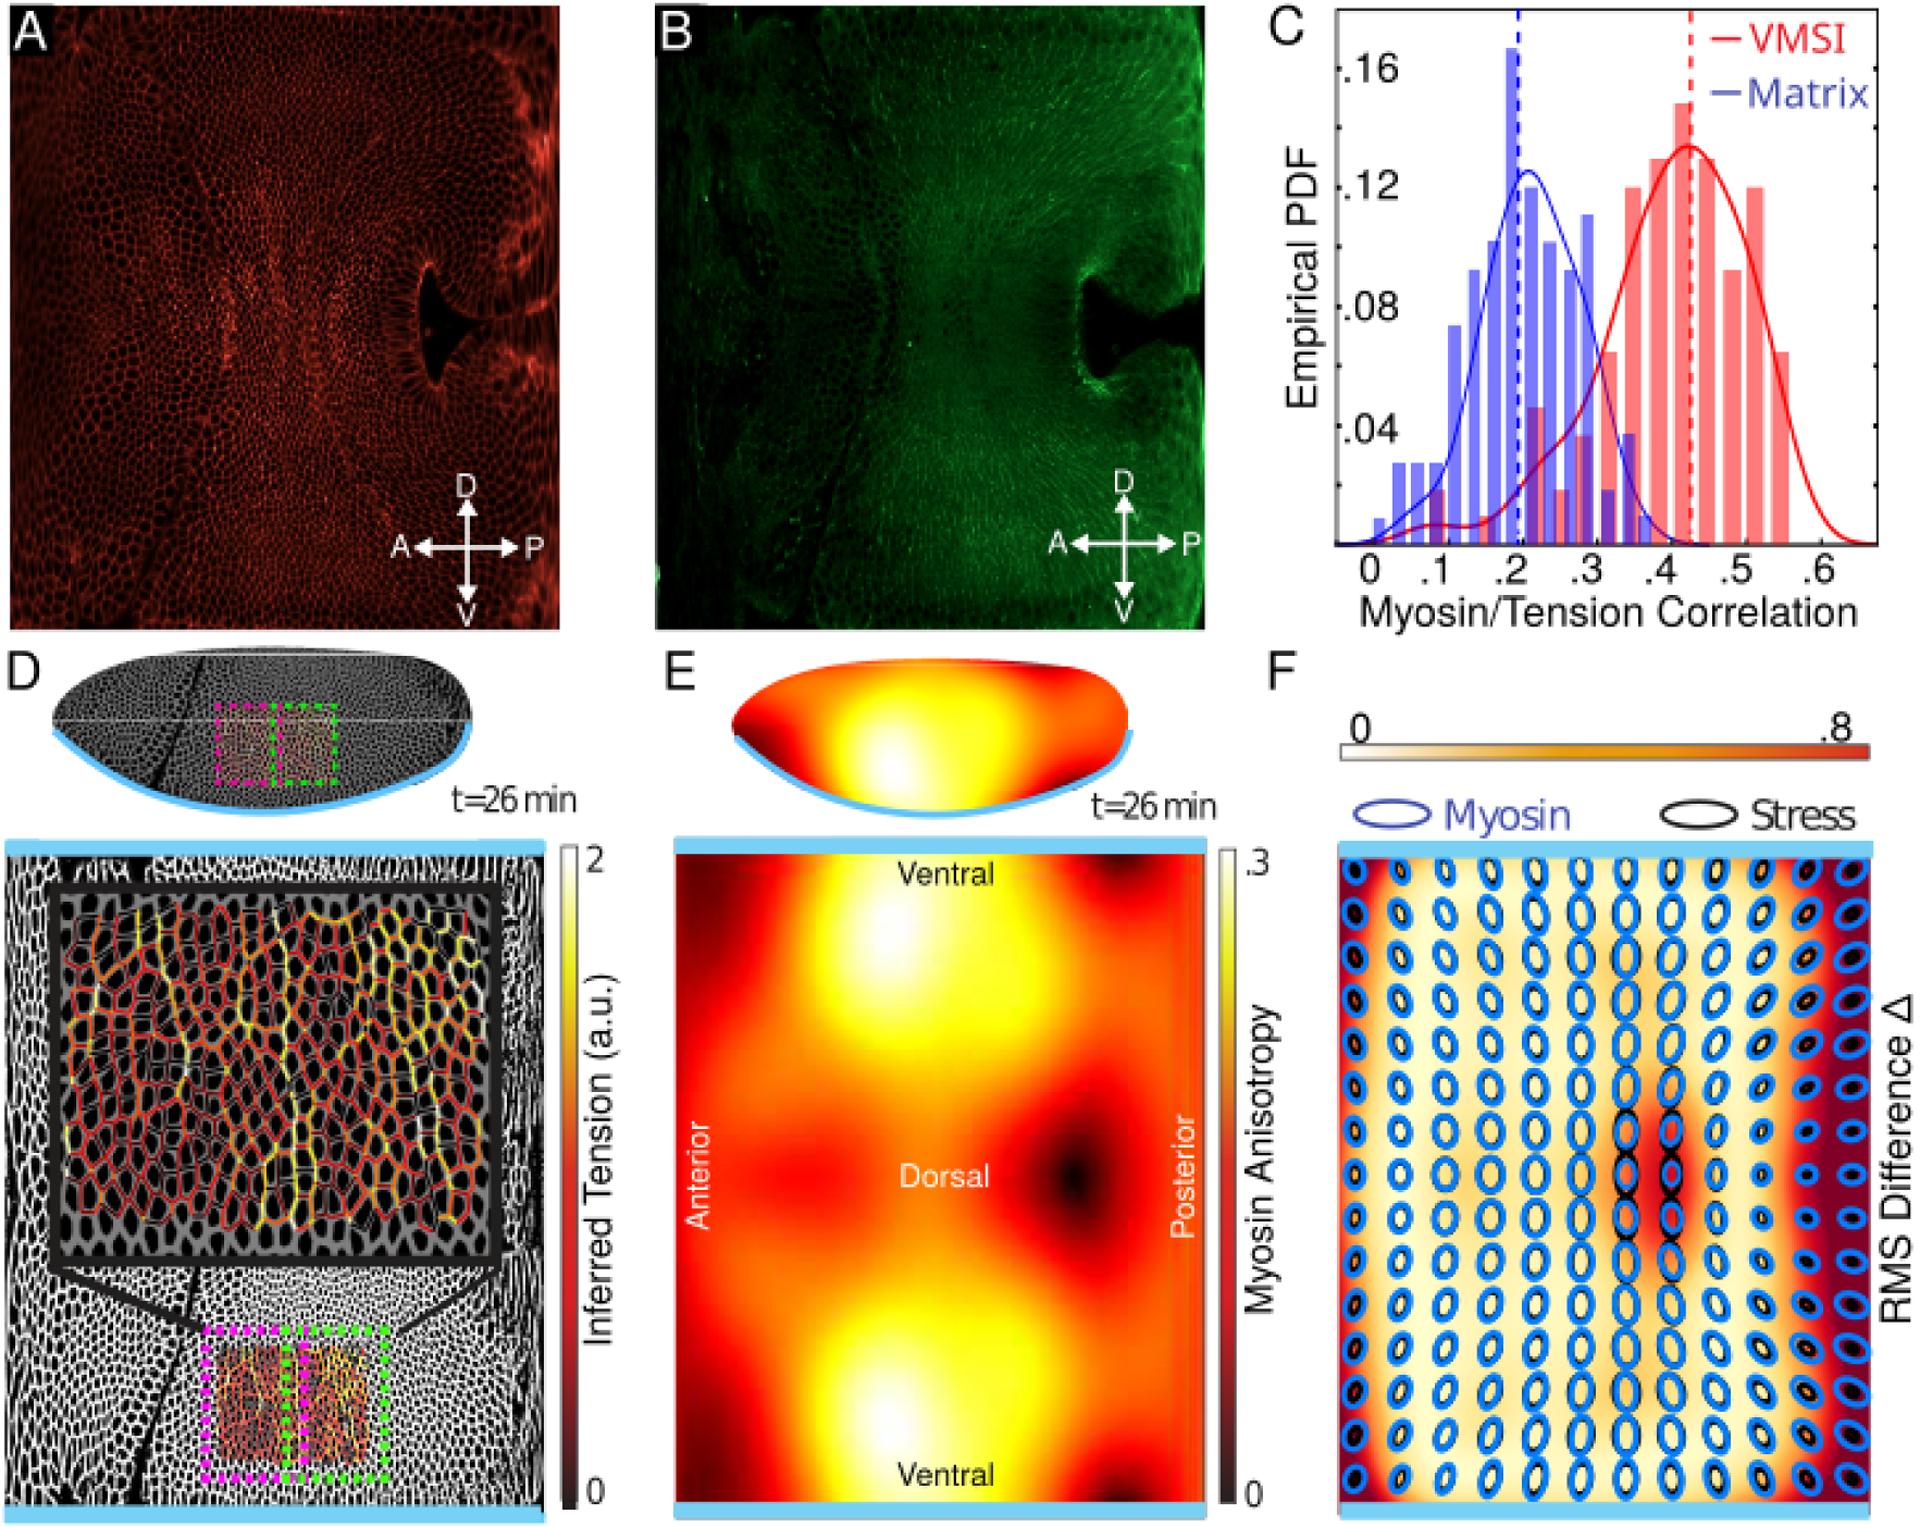
A,B) Raw in-toto images showing fluorescent labelled membrane (mCherry, shown in A) and myosin (Sqh-GFP shown in B) obtained using light sheet microscopy and unrolled into the plane using ImSAnE [41]. Time corresponds to roughly 26 minutes after cephalic furrow formation. C) The correlation between myosin and inferred tensions comparing the “matrix inverse”-based method defined in [29] and the VMSI algorithm during the first 40 minutes of GBE. D) An example of force inference, combining two overlapping image frames used for the analysis, shown directly on the embryo and on a cylindrical projection with the ventral line cut and mapped onto the top and bottom edges of the image with the dorsal side along the midline. Inset shows color-coded edge tension inferred by the VMSI algorithm. The inferred force map displays stress cables as expected for the lateral region of the embryo at the time considered. E) The mesoscopic anisotropy of myosin, 26min post CF formation, shown on the embryo and its cylindrical projection. Anisotropy is largest in the lateral region. The principal axis of myosin in this region points along the DV axis. F) The spatial distribution of the normalized RMS difference (Δ(r)) between the VMSI inferred stress tensor and the measured total myosin tensor (at 26min post CF). Both tensor fields are represented as ellipses for direct comparison. The large discrepancy (Δ ~.8) found in the vicinity of the anterior and posterior poles (mapped to the left and right edges of the cylindrical projection) is due to the poor imaging of the poles. The large discrepancy in the center of the dorsal region is real and can be explained by the difference between the total and “balanced” myosin distributions as explained in the text.
The observed correlation indicates that the inference method is picking up underlying mechanical effects, albeit statistically. There are however numerous sources of noise that weaken correlation. To name two: i) while the analysis was carried out on a single snapshot, cell geometry is fluctuating on the timescale of seconds; ii) linear density of (fluorescent-labelled) myosin is not an exact measurement of line tension. Most importantly, the assumption that cells are in a mechanical equilibrium is at best only an approximation: in the case of GBE, there is a mean morphogenetic flow of cells indicating the presence of unbalanced local forces within the tissue[34]. Below we shall demonstrate that accounting for this systematic deviation from mechanical equilibrium effect improves correlation between inferred stress and measured myosin distribution at the mesoscopic scale.
Edge by edge comparison is the most exacting test as it is sensitive to local fluctuations. Myosin distribution however also exhibits non-trivial variation over the surface of the embryo (see Fig. 4E) and it is informative to compare it with the inferred stress tensor coarse-grained via Eq. 9. In constructing the latter, it is helpful that VMSI inference can be carried out locally on partially overlapping image frames and “stitched” (depicted in Fig. 4D; see Appendix E for details) into a continuous coarse-grained stress field for the whole surface of the embryo. In Fig. 4F we compare the inferred coarse-grained stress tensor with the measured coarse-grained myosin tensor [34]. Both myosin and inferred stress are enriched in the lateral ectoderm and are anisotropic along the DV axis, with the quantitative agreement at the level of about 60% (which corresponds to average Δ ~ .4 in Fig. 4F).
To more exactly quantify the difference between the measured myosin tensor mab (as defined in [34]) and the inferred stress tensor σab we defined a normalized root-mean-square (RMS) deviation:
| (10) |
where m, σ abbreviate mab, σab respectively and 〈…〉r stand in for averaging over a coarse-graining region at location r and λ is the unknown overall scaling factor relating myosin and stress which we chose so as to minimize the global average of Δ. Hence 1 − Δ(r) is the measure of local agreement (in both magnitude and anisotropy) between of σ and m within a coarse-graining region centered at position r.
Comparison of inferred stress to balanced myosin tensor
In general, the inferred stress tensor is consistent with the measured myosin tensor – both exhibit strong anisotropy localized to the lateral ectoderm, with principal axis along the DV axis. The most substantial disagreement between the inferred stress and measured myosin tensors, as shown in Fig. 4F, is localized at the center of the dorsal side of the embryo; myosin is spatially inhomogeneous along the DV axis (high at the lateral sides) in contrast to the inferred stress tensor, observed to be constant along the DV axis. A plausible explanation for this discrepancy is that our comparison involves the total myosin tensor, which is thought to drive early morphogenetic flow [34] and thus is mechanically unbalanced, to our inferred stress tensor which explicitly assumes mechanical equilibrium.
Our previous study [34] related observed meso-scale myosin distribution mab and observed morphogenetic flow, by focusing on the divergence of the myosin tensor ∇αmab which corresponds to the “unbalanced” internal stress within the tissue that generates cellular flow. (Note, following [34] we assume σab ~ mab.) However, only a fraction of myosin contributes the unbalanced stress, the rest generates internal stress which obeys force balance: . The “balanced” fraction of myosin is, by definition, divergence-less: and is explicitly the component of the overall myosin tensor that is expected to correlate with the predictions of VMSI-based inference.
To decompose measured myosin tensor [34] into “balanced” and “unbalanced” components, we note that any 2D symmetric tensor can be written as
| (11) |
(where εac = −εca is the antisymmetric unit tensor). ua denotes the virtual displacement field that would generate the unbalanced component of the myosin tensor. Conversely, the divergence of the last term is zero and it can be identified as , the balanced component of the myosin tensor. Taking the divergence of Eq. (11) yields a partial differential equation for the vector field ub:
| (12) |
which was solved using the same method as in [34], see Methods. (Strictly speaking Eq. (12) defined ua only up to a harmonic gradients ua → ua + ∇aψ + εac∇cω with ∇2ψ = ∇2ω = 0. Since the only solution to the latter equations on a closed surface of genus zero is a constant, our solution for ua is unique.) Eqs. (11, 12) provide an explicit determination of the balanced component of myosin tensor:
| (13) |
Fig. 5 displays the distribution of on the surface of the embryo and compares it with the total myosin distribution and the inferred stress. As shown in Fig. 5D balanced myosin dominates, accounting for more than 80% of the total, but the unbalanced component increases with time, especially upon the onset of the GBE (10min post CF). We also find that removing the unbalanced component from the myosin distribution being compared to the inferred stress, substantially increases the agreement between the two (see Fig. 5D). Specifically, during GBE the alignment of our inferred stress tensor relative to the total myosin tensor decreases to ~60%, consistent with the higher fraction of unbalanced myosin and thus morphogenetic flow.
Figure 5. Balanced myosin versus total myosin.
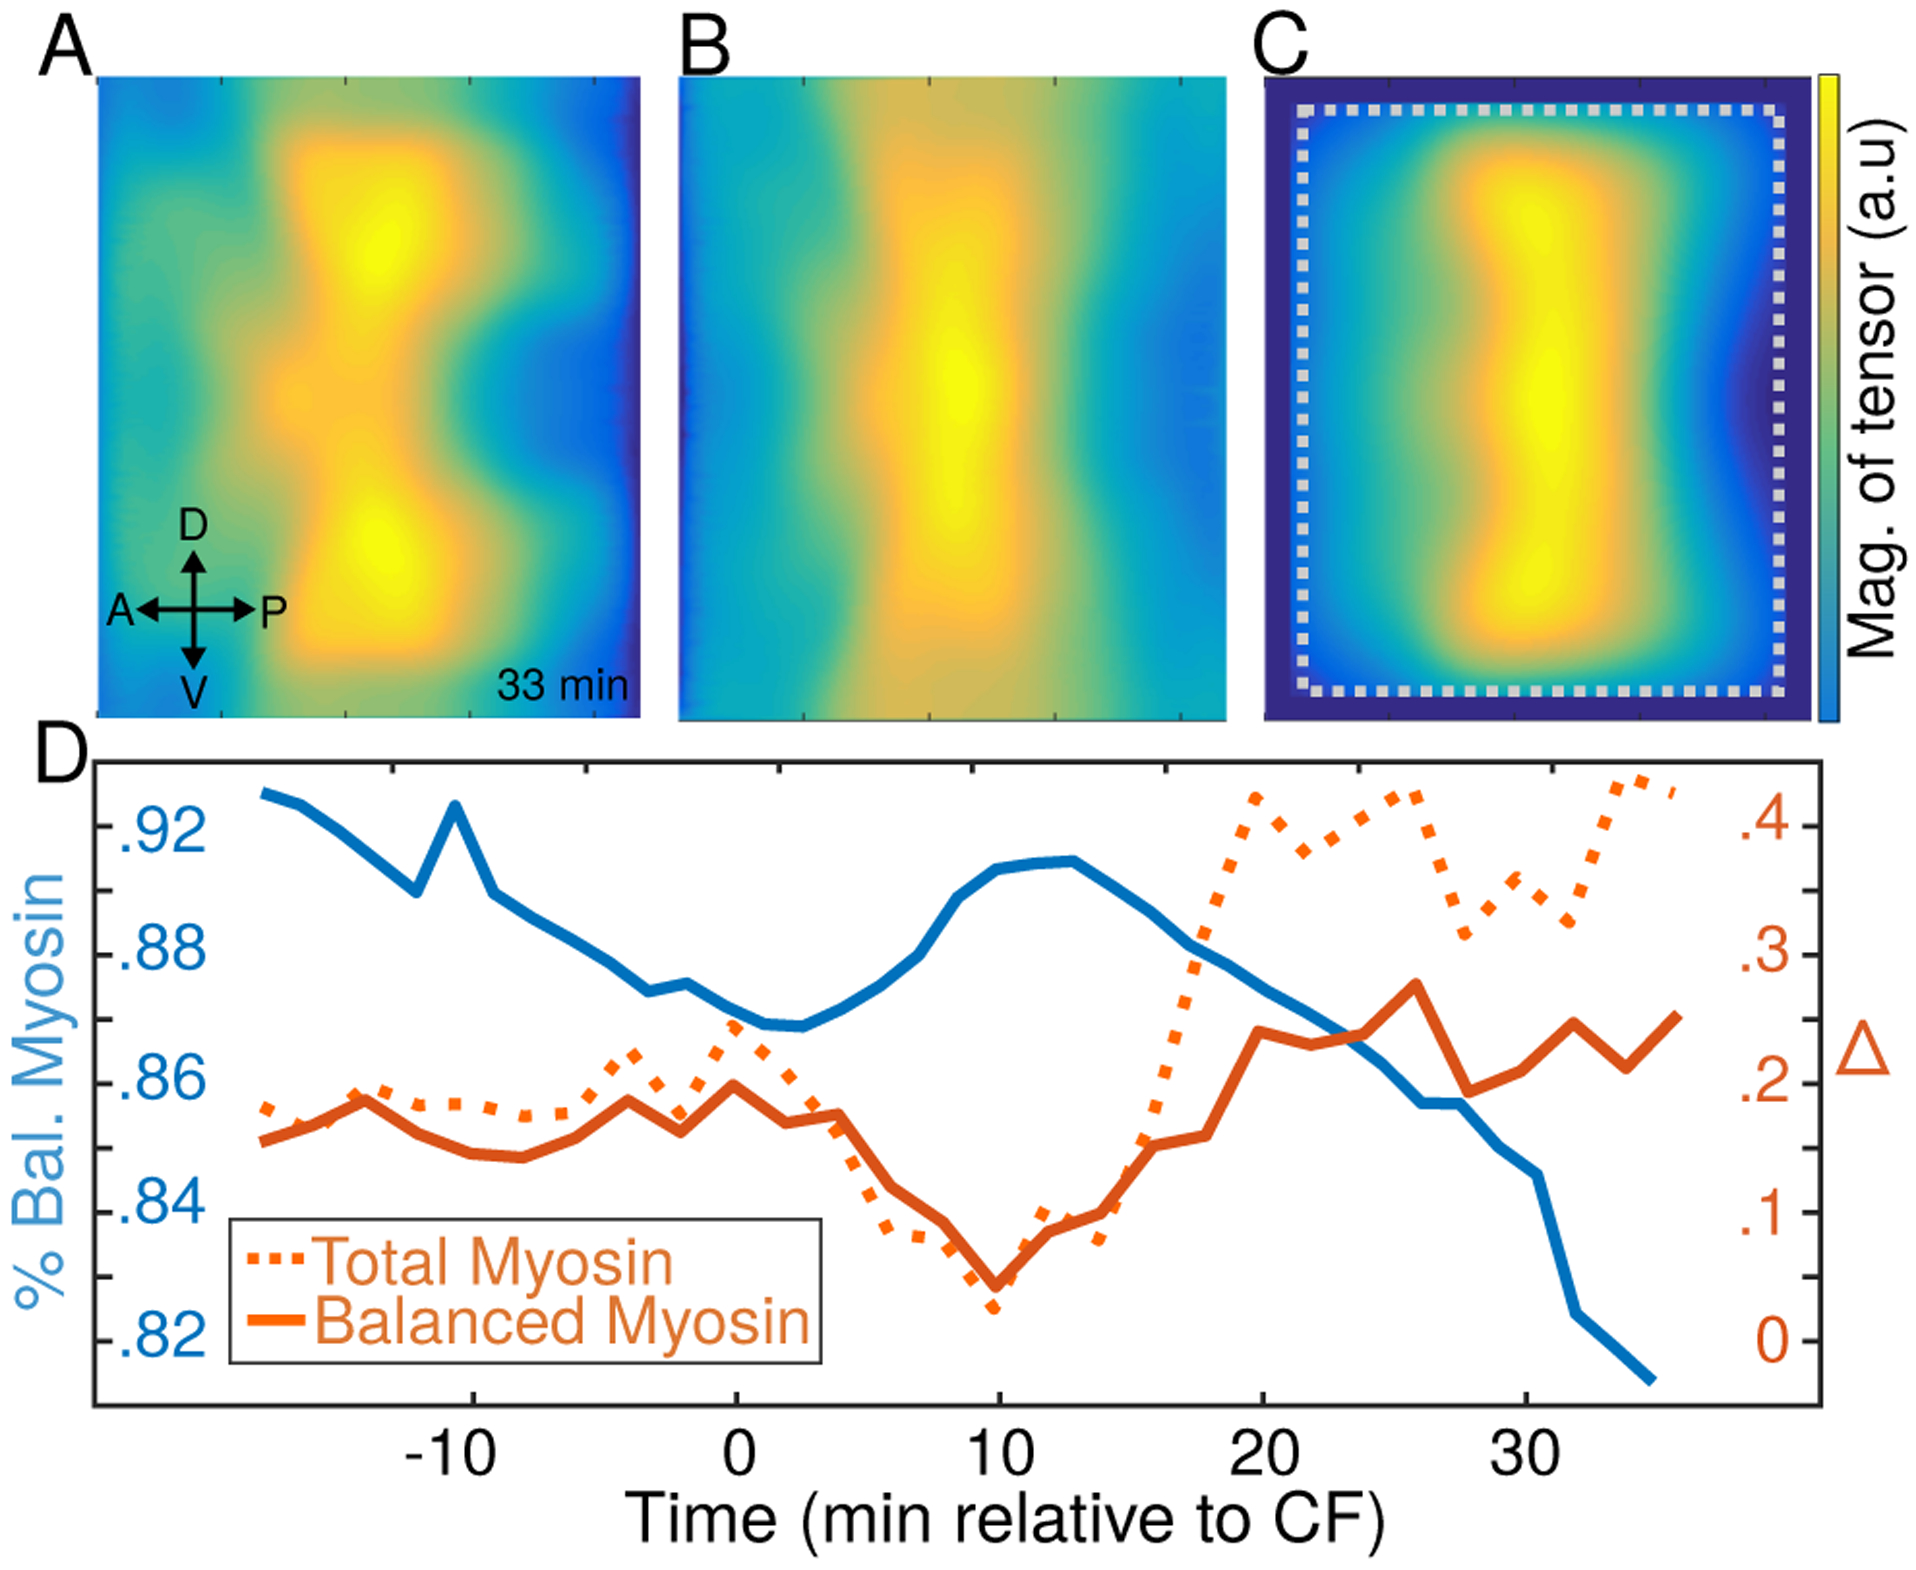
A) The magnitude of the myosin tensor measured in [34] 33 minutes after the formation of the ventral furrow. B) Same for the balanced component myosin tensor, defined by Eq. (13), at the same time. Note that the balanced myosin is approximately constant along the DV axis in contrast with the total myosin displayed in (A). C) The magnitude of the inferred stress tensor at the same time-point. Note greater similarity with (B) than with (A). The dotted gray box shows the region that was amenable to image segmentation. D) The average misalignment Eq. (10) between inferred stress and myosin tensors (balanced/total displayed as solid/dashed orange lines respectively). The balanced fraction of myosin is shown in blue. As expected, the inferred stress tensor provides a better approximation for the balanced component of myosin tensor then for the total.
Principal stress axis predicts mitotic orientation
Let us now provide an example of how our variational stress inference can be used to study interesting questions concerning mechanical control of biological phenomena. It is known that the spatio-temporal patterning and orientation of cell divisions plays an important role in morphogenesis [45]. Mitotic domains of synchronously dividing cells partition the Drosophila embryo in a highly regular manner that directly shape eventual larval segments [44]. Additionally, the patterning of mitotic spindle orientation has been suggested to contribute to elongation of the posterior region of the lateral ectoderm [46]. While the upstream signal that instructs orientation of cell cleavage plane is unknown, studies suggest that mechanical tension within the tissue contributes to spindle alignment [47–49] in the dividing cell. Additional evidence that interphase cell strain orients mitotic cells by recruitment of Mud to tricellular junctions was reported in [50].
To test the hypothesis that cell cleavage axis tends to align with local tension within cells, we analyzed 70 tracked divisions in mitotic domains 6 and 11 (as defined in [44]) during the late phase of GBE (20–35min post CF). Fig. 6AB, provides an example of using the VMSI method to infer tensions in individual interfaces of a cellular network. The cell cleavage axis was compared directly to the orientation of the tension axis determined from the inferred stress tensor, Eq. (9). We found that cell cleavage indeed correlates strongly with inferred tension and that the principal axis of stress is a much better predictor of spindle orientation at the time of division than the commonly used “long axis” defined directly by cell elongation. Furthermore, the VMSI-based inference was more accurate (based upon 95% confidence intervals using t-test) than the earlier “matrix inverse” approach of [29]. The improved accuracy is due to the VMSI’s ability to capture large pressure differentials between cells in a morphologically heterogeneous cell arrays, as exemplified by Fig. 6A.
Figure 6. Correlation of inferred stress and cell-division axis.
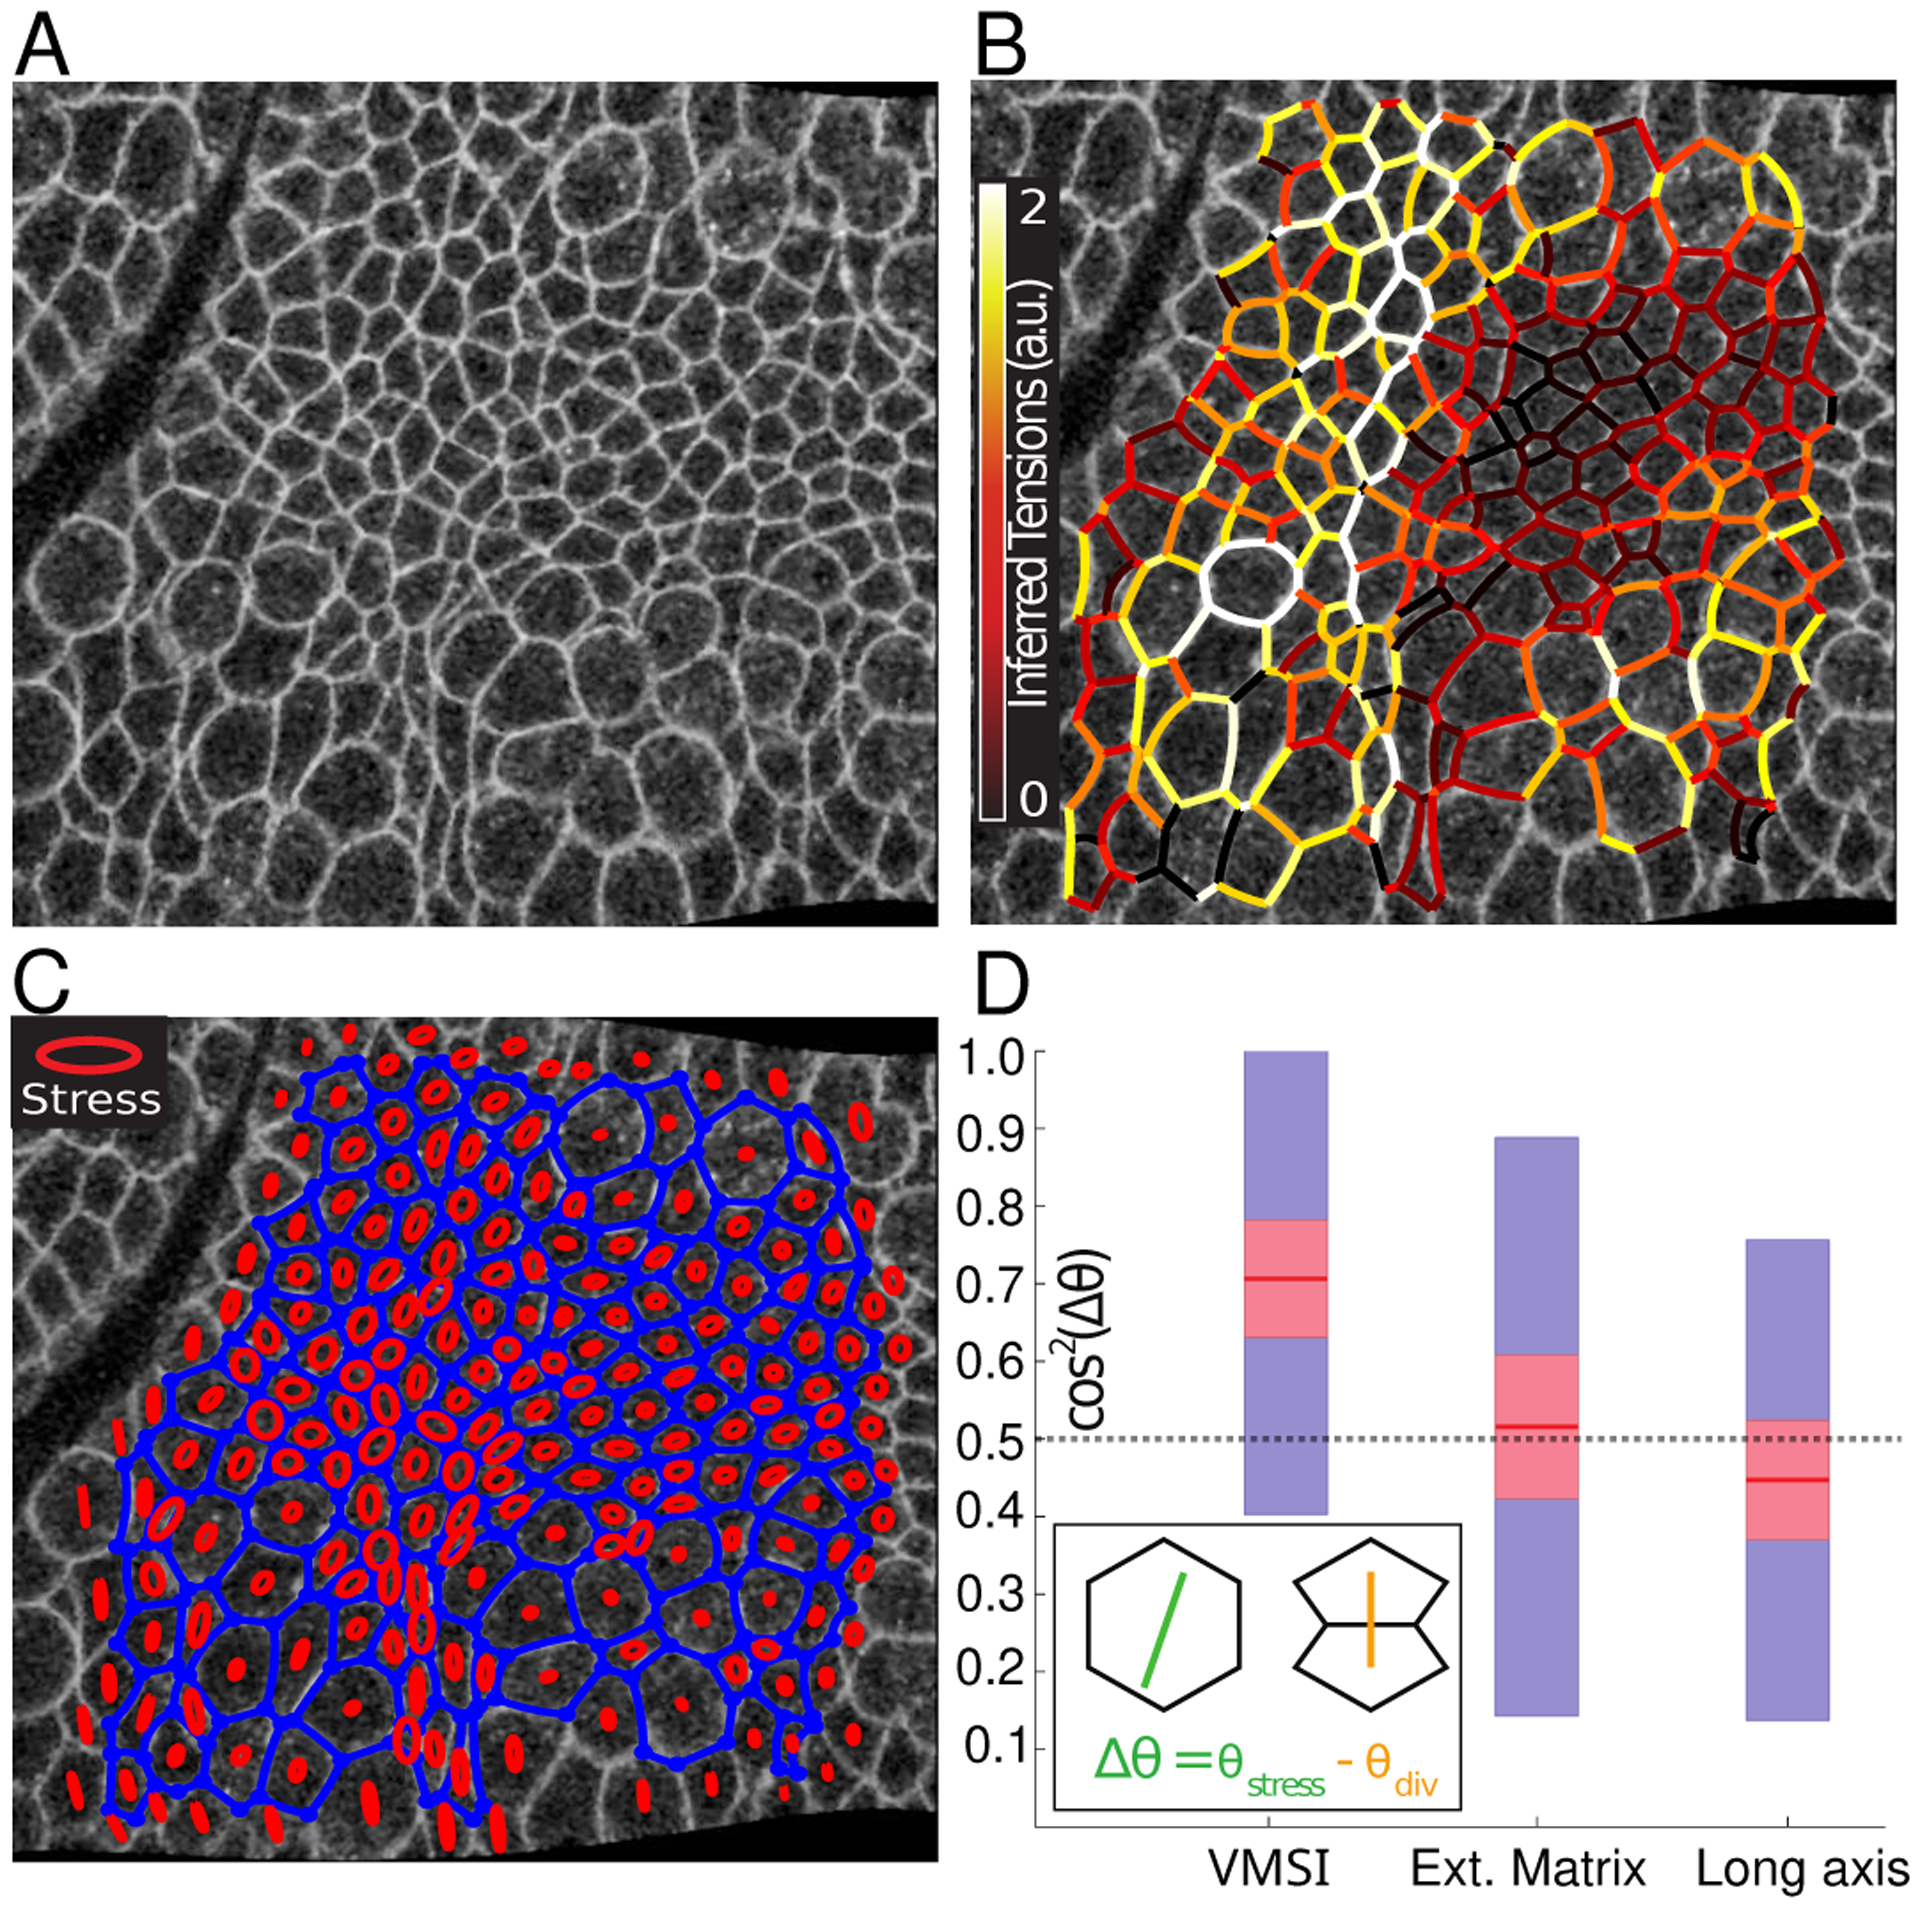
A) Confocal image of the Drosophila lateral ectoderm, near the cephalic furrow, during the late phase of Germ Band Extension (GBE) at the onset of cell divisions, approximately 45 minutes after the formation of the cephalic furrow. B) An overlay of inferred tensions on the CAP array. Note that white and yellow (high tension) edges meet each other at angles close to π while black and red edges (low tension) meet at π/2 C) Same as (B) but with the average stress tensor for each cell plotted as an ellipse. The major/minor axis of the ellipse corresponds to the principal axes of stress. D) Comparison of the cell-cleavage axis for cell division events (within mitotic domains 6 and 11 [44]) and the principal (extension) axis of inferred local stress (using different methods). Stress for mitotic cells was estimated 5 minutes before the registered time of division. While VMSI-based analysis finds significant correlation, predictions based on the extended “matrix inverse” [29, 33] or cell elongation axis are not distinguishable from random (shown as dashed gray line)
Discussion
The VMSI algorithm described here was based on the model which assumed that (i) the 2D epithelial cell array is instantaneously in an approximate mechanical equilibrium, (ii) cell mechanics can be approximated by the balance of cytoskeletal tension localized at cell interfaces (and varying from one edge to another) and the effective areal pressure (preventing collapse of the apical surface of cells). Together, these assumptions place a non-trivial constraint on cell geometry that is readily testable on the basis of imaging data. The existence of local geometric constraints facilitated the formulation of a local mechanical inference scheme that combined the estimation of stress with the simultaneous determination of the best-fit cell geometry from imaging data. The method was observed to be a significant improvement over similar methods, both at the scale of individual cells and the mesoscopic scale. Importantly, we found much stronger agreement in between coarse-grained stress and myosin relative to the comparison at the cellular scale.
While our analysis focused on cellular arrays with threefold vertices, our arguments generalize to an admixture of higher order vertices. A four-fold vertex corresponds to a removal of an edge from a 3-fold network resulting in the coalescence of a pair of 3-fold vertices: two force balance constraints on the array are lost when two vertices merge into one. (The loss of the curvature measurement on the removed edge is offset by the reduction in the number of edge tension “unknowns”.) However, the effect is localized to the four adjacent cells while, critically, VMSI on any 4 cells is overconstrained by 3 ∗ 4 = 12 equations. Hence loss of two constraints will not destabilize the local (and thus global) inference. Mathematically, VMSI would remain overconstrained (although to a lesser degree) even if all of the vertices were 4-fold. The utility of the geometric constraints identified in the present study is that they provide a direct way to test whether an observed cell array at least approximately satisfies the constraints of mechanical equilibrium, purely on the basis of cell morphology and image analysis.
In addition to testing the validity of the VMSI-based force inference, our analysis of myosin and inferred stress distributions in Drosophila embryo has revealed that despite the dynamical nature of GBE, the epithelial shell of the embryo maintains approximate mechanical equilibrium, in the sense that mechanical stress associated with the observed myosin distribution is mostly (at the 80% level) balanced internally and does not contribute to cellular flow. This conclusion is reached by a direct analysis of the measured myosin tensor, Eq. (13). Quite remarkably, the presence of this balanced internal stress is also correctly inferred from the VMSI-based analysis of cell geometry across the surface of the embryo. The conclusion that tissue flow coexists with approximate internal force balance within a rearranging array of cells, provides an interesting insight into the mechanics of tissues.
According to [34], the unbalanced myosin acts as a driver of global morphogenetic flow. Our analysis above decomposed myosin into balanced and unbalanced components; regions with substational unbalanced to balanced fractions are then putative “drivers” of the overall morphogenetic flow. Disregarding the errors at the anterior and posterior poles that arise from image resolution issues, the largest deviation from mechanical balance is found along the dorsal surface (see both Fig. 5 ABC and Fig. 4F.), where total myosin falls below the level needed to for internal force balance, as predicted by the balanced component. This suggests an important role for DV patterning in the convergent extension flow. We believe the ability to estimate global patterns of balanced and unbalanced stress on arbitrary two-dimensional surfaces opens up a novel method in which one can identify the factors that drive morphological change.
We expect the VMSI-based force inference to be immediately useful for experimentalists studying tissue mechanics and the mechanics of morphogenesis of entire organs.
Materials and Methods
Confocal microscopy
Raw data shown in Fig. 4 was taken on a Leica SP8 confocal microscope equipped with two HyD detectors, a 40x / NA 1.1 water immersion objective, and 561 nm laser line.
Light sheet imaging
In toto images for Figs 5 and 6 where taken on a custom-built multi view light sheet microscope described in [51]. Briefly, the setup consisted of two excitation and two detection arms. On each detection arm, the microscope was equipped with a water-dipping lens (Apo LWD 25x, NA 1.1, Nikon Instruments, Inc.), a filter wheel (HS-1032, Finger Lakes Instrumentation LLC) with emission filters (BLP02–561R-25, and BLP01–488R-25, Semrock, Inc), a tube lens (200 mm, Nikon Instruments, Inc.) and sCmos camera (Hamamatsu Flash 4.0 v3). In this way an effective pixel size of .26μm was achieved. Illumination consisted of a water-dipping objective (CPI Plan Fluor 10x, NA .3, Nikon Instruments, Inc), a tube lens (same as above), a scan lens (S4LFT0061/065, Sill optics GmbH Co. KG), and a galvanometric scanner (6215h Cambridge Technology, Inc.). Illumination was based on laser lines (06-MLD 488nm, Cobolt AB, and 561 LS OBIS 561nm, Coherent, Inc.). 3D volumes where generates by translating samples through the sheet using a linear piezo stage (Physik Instrumente P-629.1CD controlled by C-867). Multiple views where generated by a rotation stage (Physik Instrumente U-628.03, C-867 controller), combined with a linear actuator (M-231.17, C-863 controller). Electronic control of the microscope was based on Micro Manager [52], and custom written MATLAB code. Fusion of individual views taken at 45 degrees angles was carried out using FIJI multi-view fusion plugins[53]. Cartographic projections where generated using ImSAnE [41].
Fly stocks
Sqh-GFP; membrane-mCherry
Numerical solution of Eq. (12)
A 2D triangulated mesh of the embryo surface was constructed using ImSaNe [41] and FELICITY [54] – a finite element software package for MATLAB – was utilized to solve the PDE and compute surface derivatives. We refer the reader to [34] for a detailed description of the method.
Image segmentation
In-vivo data was segmented using a custom pipeline implemented in MATLAB, available on Github at nnoll/tissueAnalysisSuite under the “seg” workspace. ilastik, a supervised machine learning classifier, was used as a pre-processing step for each image, followed by the application of a Laplacian of Gaussian filter (MATLAB), with the kernel size chosen to be approximately ~ 5 cell diameters. The resultant image was segmented using the watershed algorithm (MATLAB).
Vertices were defined as branch points of the resultant skeletonization – edges are segmented as the set of boundary pixels that run between two such branch points. Our CAP is parameterized by not only vertex position but also edge curvature. Each edge was fit to a circular arc using the Pratt method, which is robust for small angle samplings of the underlying circle. Interfacial myosin concentration was measured by dilation of each segmented edge by 2 pixels and averaging over the resulting set of pixels in the myosin channel. All segmentation information is stored within a custom data structure and can be immediately used for the VMSI inference. The code needed for the VMSI inference can be found at the same aforementioned Github repository – nnoll/tissueAnalysisSuite under the “fitDual” workspace.
Cell divisions during late germ band extension were registered by tracking cells. Cell tracking was achieved by computing pixel overlaps between segmented cells in subsequent time points – cells were paired based upon the cell they most overlap with in the succeeding frame. Mitotic cells were defined as tracking events where two cells overlapped with one in the previous time point. The tracking was manually curated to ensure no false divisions were called. The long axis and the principal stress axis were computed at approximately 5 minutes before the tracked cell cleavage event. Supplementary figures pertaining to the dynamics of cellular geometry proceeding the division are included in Appendix F.
3D reconstruction
ImSaNe [41] was used to measure, parameterize, and store the surface and embedding coordinates of the Drosophila embryonic surface. Segmentation of cells was done using the cylindrical mapping of the embryo. The 3D vertex positions were subsequently estimated using the embedding grids obtained from the ImSaNe algorithm.
We computed the mesoscopic myosin distribution in the same way as detailed in [34]. The output from the automated segmentation of myosin is a summation over microscopic nematic tensors of the form
| (14) |
This was averaged using a Gaussian filter.
ACKNOWLEDGMENTS
The authors gratefully acknowledge stimulating discussions with Madhav Mani, Idse Heemskerk, and Eric Wieschaus. This work was supported by the NSF PHY-1220616 (BIS) and NICHD 5K99HD088708-02 (SJS).
Appendix A: Non-planarity of tension triangulations
As stated in the main text, the tension triangulation ‘dual’ to a CAP tiling is not planar. It follows from the definition of the dual triangulation - i.e. by rotating tension vectors which meet at a vertex by π/2 - that the angles of each triangle are complements of angles at CAP vertices: . We note that if the edges of the polygonal tiling were straight, then , corresponding to a planar triangulation as discussed in [18]. However, in an equilibrium CAP network, tension vectors acting at either end of an interface are no longer parallel: because of interfacial curvature, the tension vector acting on vertex i (on edge αβ) is rotated by an angle Δφαβ = ℓαβ/Rαβ relative to the tension vector at vertex j, where ℓαβ is the physical arc length of the circular edge. This results in the non-planarity of the tension-triangulation manifested by the “deficit” angle for each cell, Δφα defined as the sum of curvature contributions from all edges that compose the cell:
| (A1) |
The deficit angle Δφα associated with cell α is the discrete Gauss curvature for the corresponding vertex in the dual triangulation.
Appendix B: Reduced variables solve geometric constraints of equilibrium CAP arrays
In this section we show that reduced variables {qα, zα, pα} introduced in Eqs. (6, 7) explicitly resolve geometric constraints implied by mechanical equilibrium, as noted for soap foams in [39]. We begin by noting that tension vector (that appears force balance equations, Eq. 1) Ti,j is tangent to the circular arc radius, depicted in Fig. 1C and can be rewritten using the Y-L law in the form
| (B1) |
where the sign of pα − pβ ensures the correct direction of the vector. Substituting into Eq. 1 we rewrite force balance for vertex i as
| (B2) |
which, quite remarkably, means that in mechanical equilibrium the centroids of all three interfacial circular arcs meeting at a vertex are constrained to be collinear.
Next we note that force balance equations rewritten in this form are trivially solved by ρβα given by Eq. (6) as the left hand side of the equation would have two factors of each pαqα with opposing signs.
In order for all three incident edges, corresponding to collinear centroids to intersect at a single point uniquely defining a CAP vertex, their respective radii must obey
| (B3) |
which imposes v constraints on e curvature variables. One can verify by direct substitution that ρβα and Rαβ defined by Eqs. (6, 7) explicitly satisfy Eq. (B3). The appearance of zα degrees of freedom is explained by observing that, given any set of that solves Eq. (B3), we can generate another geometrically compatible cell array by transforming . Hence, zα provide an explicit parameterization of the c dimensional manifold of solutions of Eq. (B3) that share the same set of edge centroids, but have different radii.
Appendix C: Initial condition for the VMSI
The initial condition for the variational parameters used in the minimization of Eq. (5) is obtained piecewise; we first approximate {qα, pα} independent of zα by fitting edge centroids ραβ. As depicted in Fig. 2, the vector pointing from each arc’s centroid to either of the attached vertices, ri − ραβ, is orthogonal to the local tangent of edge rαβ. Analogous to the main text, we denote the measured tangent of edge αβ at vertex i as .
The orthogonality between the fit radial vector ri − ραβ and the measured can be imposed variationally on our parameters. It is convenient for the following discussion to introduce the shorthand notation . Initial estimates for qα, pα are thus obtained by minimization of
| (C1) |
The solution is constrained so that the average magnitude of |di,j| equals the averaged measured radius of curvature in the image to ensure we do not pick the trivial solution (qα = qβ, pα = pβ).
Initial estimates of is obtained from the variational parameters obtained above by inverting the linear set of equations defined by Eq. (7).
| (C2) |
subject to the constraint that . Rαβ is segmented from the image.
Appendix D: In silico benchmark of VMSI algorithm
To test the robustness of the VMSI inference, synthetic data was generated by initializing a triangular lattice of ~ 120 generating points qα within a rectangle of size . Using generalized Voronoi construction defined in the main text, one can easily generate arbitrary CAP networks – i.e. for any set {qα, pα, zα} – in mechanical equilibrium. Edges within the CAP network are defined by via Eq. (8). This procedure is repeated for each point q. The minimum of for each spatial location is taken - the net result is a scalar field that measures the minimum weighted distance away from any triangulation vertex, . An example of the above procedure is shown in Fig. A.1A. Edges are ‘ridges’ representing local maxima d2(r) that are found easily using the watershed algorithm – Fig. A.1B shows an example. The resultant equilibrium network can then be immediately calculated from the original parameters for {qα}, {pα}, and {zα}.
Figure A.1.
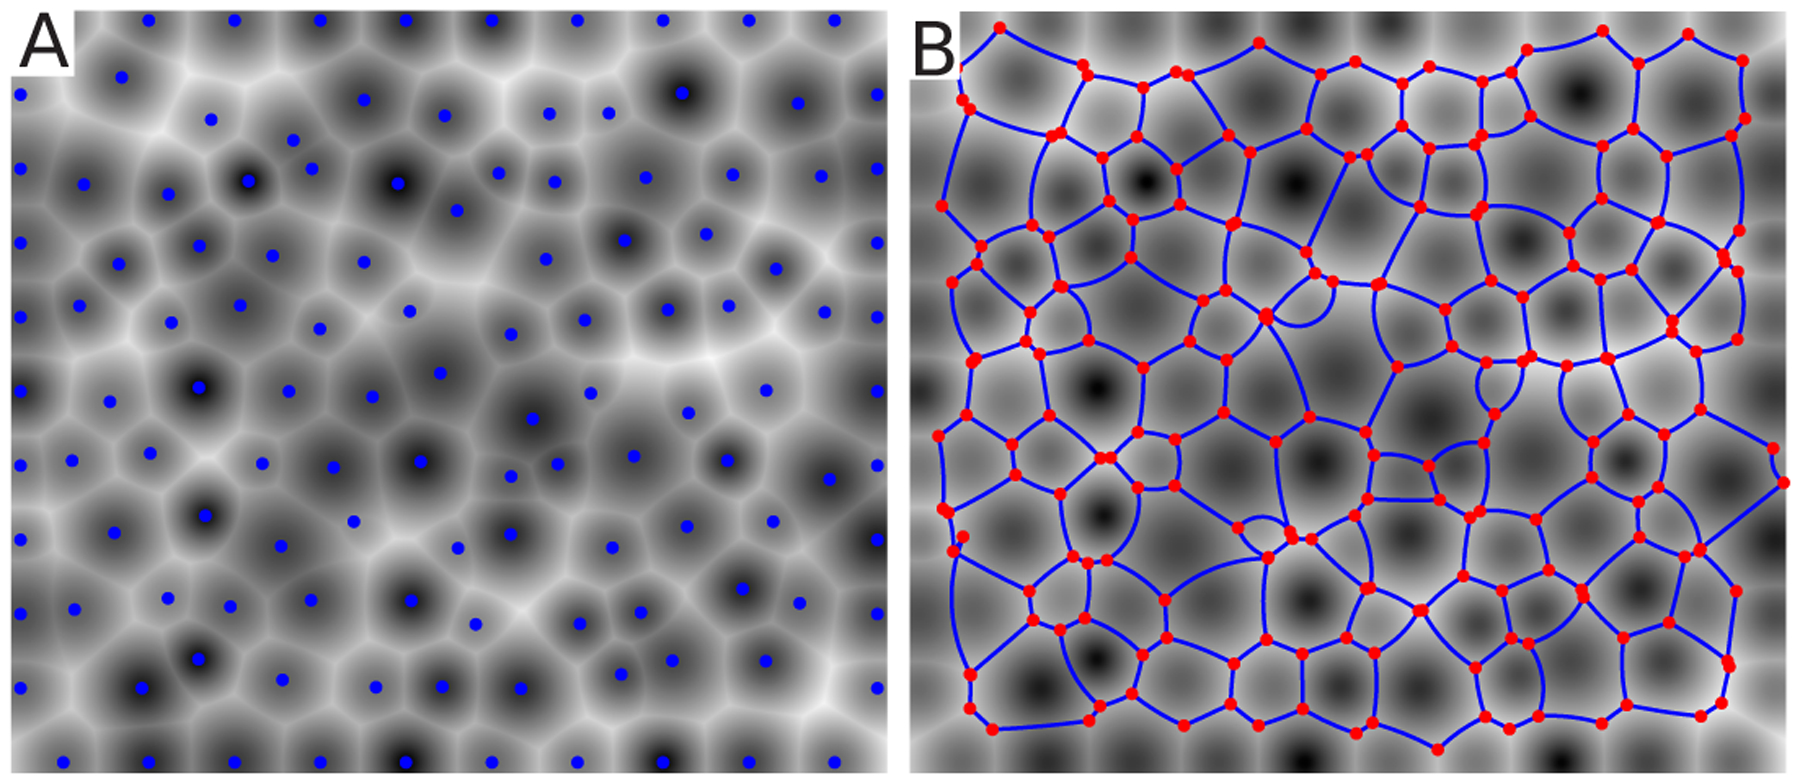
A) An example plot of the image of weighted distance from each generating point produced using MATLAB’s bwdist function and the algorithm described. The location of the generating points qα are shown as blue dots. B) The resultant CAP network. The segmentation output from MATLAB’s watershed algorithm is used to infer the triangulation topology. This is then passed into our forward equations to generate the exact positions of vertices and curvatures of edges. The result, using the original values for the generating points and the measured triangulation topology, is overlayed in blue over the original distance map.
Figure A.2.
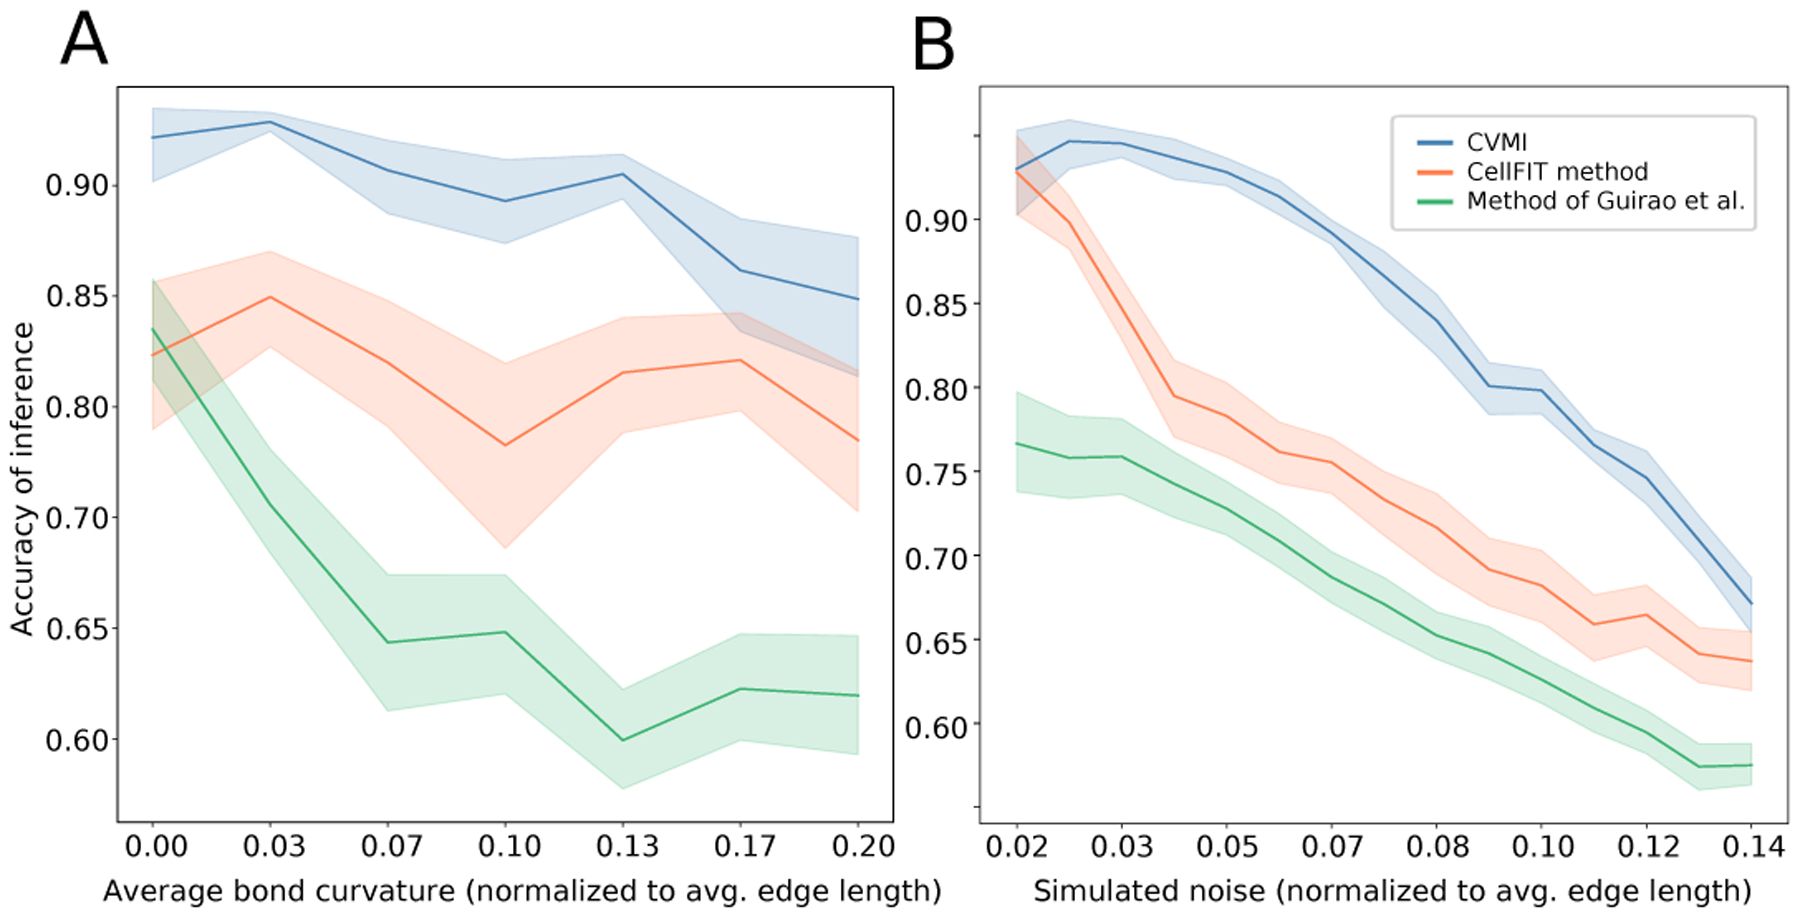
Correlation between inferred tensions and pressures against the known synthetic values for three mechanical inference schemas – (CVMI (blue), our implementation of the CellFit method [33] (orange), and the inverse used within [31] kindly provided by the authors (green) – as a function of the contribution of pressure to mechanical balance (A) and the strength of random perturbations to vertex position (B). Panel (A) represents a simulated lattices with constant noise of .03 (strength of perturbation is normalized to the average edge length). Similarly, panel (B) is taken at a finite average pressure differential of .03 (average ratio of edge length to radius of curvature). All algorithms were run on the same synthetic datasets. Each curve depicts the mean and variance of 100 networks of size 120 cells generated with equivalent parameters as described in the text.
Intracellular pressures pα were sampled from a uniform distribution to generate lattices of varying curvature. For simplicity, all zα were held to zero to keep the number of simulation parameters small. White noise was added to both vertex position ri as well as position of edge centroids ραβ to simulate the effects of measurement and segmentation inaccuracy.
We benchmarked the relative efficacies, as a function of measurement noise and the contribution of pressure to mechanical balance, of three mechanical inverse algorithms: (i) the matrix inverse described in [31] kindly provided by the authors, (ii) an implementation of the extended matrix inverse on the curved cellular network as described in [33], and (iii) the proposed VMSI inference described in the main text.
Figure A.3.
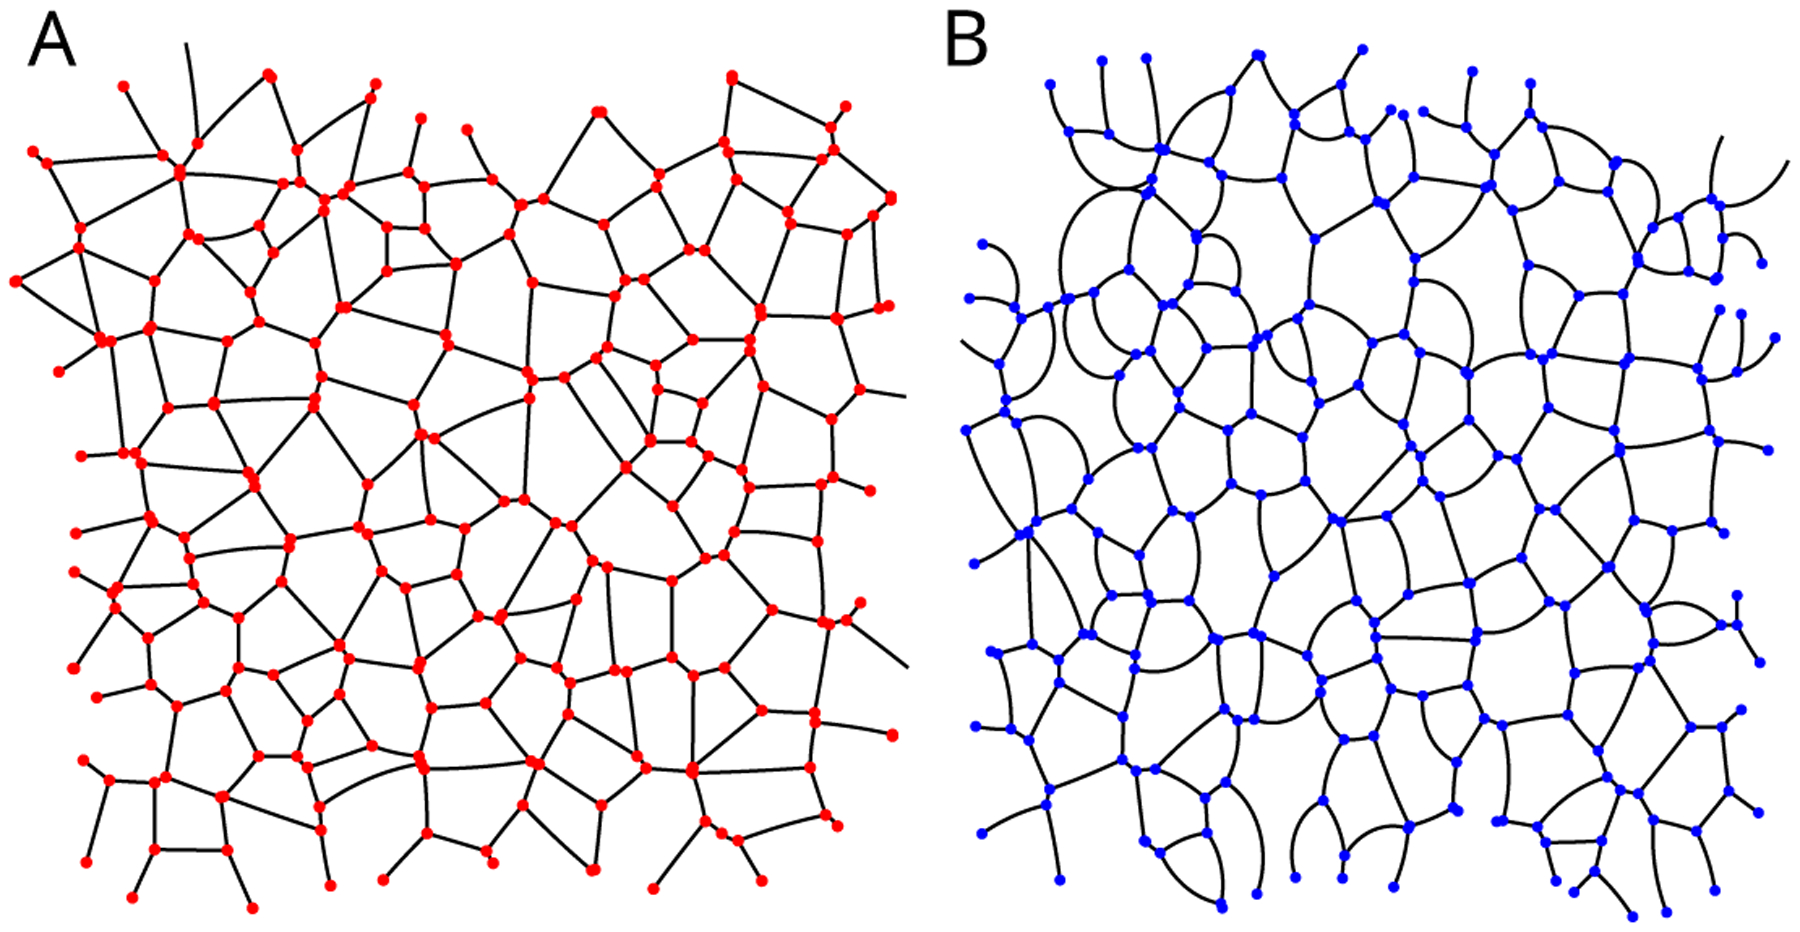
Two examples of simulated CAP networks used in the in-silico verification presented in Appendix D with varying average pressure differences. Networks (A) and (B) were generated with varying degrees of intracellular pressure differentials. The average edge curvature, normalized to edge length, - i.e. Rαβ/rαβ - for (A) and (B) are .01 and .20 respectively.
The resultant correlation between the generated and inferred tensions and pressures are shown in Fig. A.2 for the three algorithms respectively. In general, we found all three algorithms performed well in the regime of low noise and low pressure. However, as pressure started to contribute non-negligibly to the mechanical balance of the network, we observed that using only vertex positions (without curvature data) [31] produced noisier results as shown in Fig. A.2(A). By contrast, (our implementation of) the CellFIT algorithm [33] was more accurate in inferring mechanical parameters as pressure differentials increased, as inclusion of curvature data correctly imposes mechanical balance on the tangential edge network. However, we found the CellFIT algorithm more sensitive to simulated measurement noise than VMSI, seen in the decrease in accuracy given by the red curve in Fig. A.2(B) as one moves to the higher simulated noise values. We conclude that VMSI algorithm is more accurate in inferring the simulated mechanical parameters over the tested regime, albeit at the cost of the computation time required to perform the non-linear least squares regression.
Figure A.4.
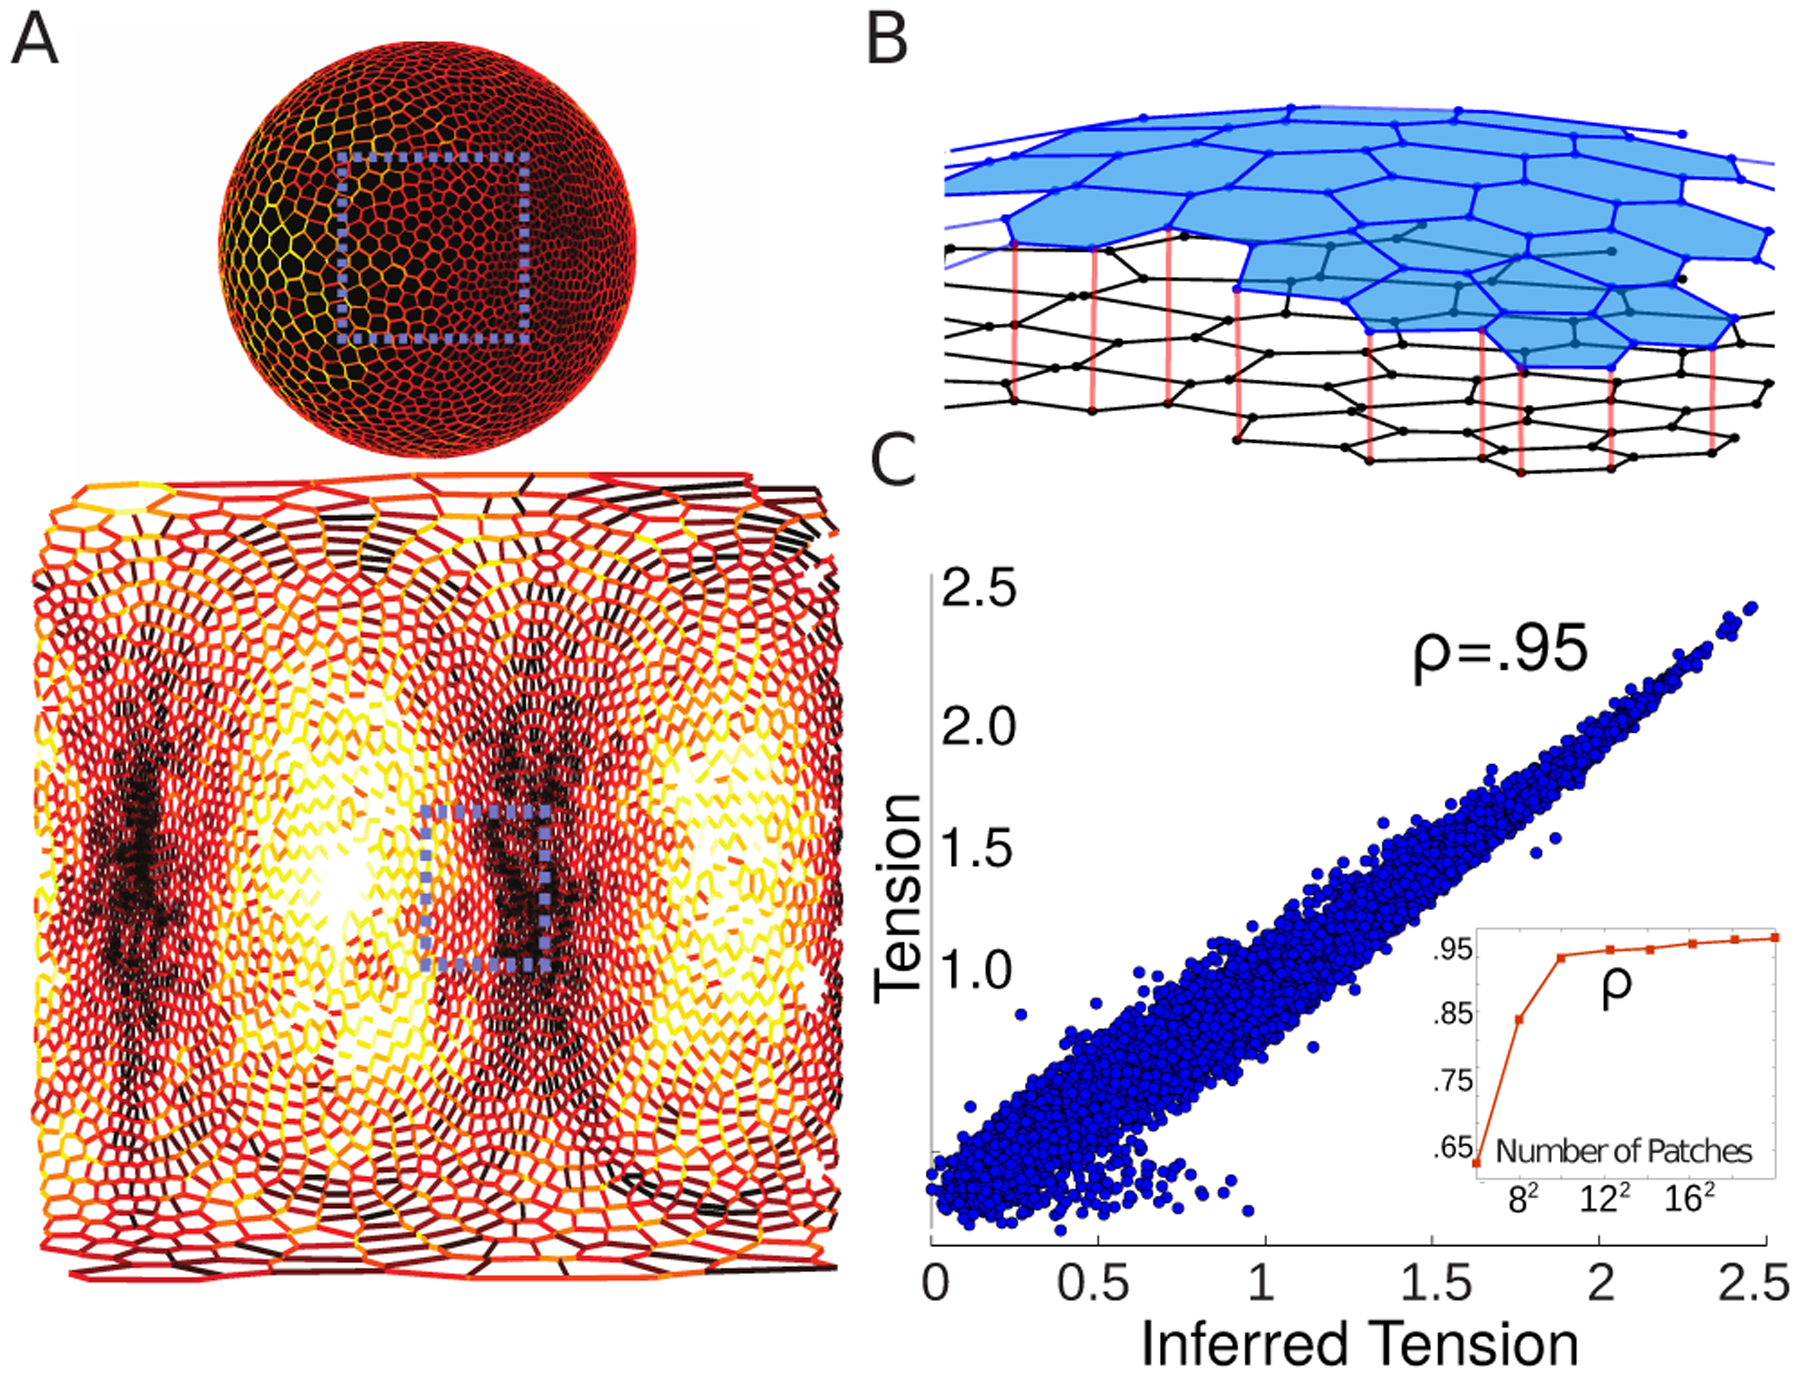
(A) A synthetic spherical embryo of ~ 3000 cells, plotted both in the embedded space, as well as the cylindrical unwrapping analogous to the embryonic data shown in the main text. Simulated interfacial tensions are plotted as a heatmap in both domains. (B) Graphical depiction of the process used to infer stresses in the tangent plane of a small region of cells. All cells are segmented in 3D using ImSaNe [41] Each local cellular patch is projected from the 3D embedding space onto the 2D plane that minimizes the sum of squares of deviation. The resulting projection is used as an input into the VMSI method. (C) Scatter plot between the inferred tensions using the workflow outlined and the known tensions shown in (A). The inset displays the dependence on the number of patches used to cover the sphere. As was expected, correlation is monotonic with sampling resolution.
Appendix E: VMSI algorithm applied to curved surfaces
The VMSI can be easily extended to formulate a tractable inference scheme for the balanced mechanical stress within a curved tissue’s tangent plane. Due to the inclusion of edge curvature information, the inverse is extensively over-determined which allows one to simultaneously infer both bulk and boundary stress using information of just bulk geometry. Consequently, the global mechanical state can be ‘stitched’ together by inferring stress on local patches of cells that can, with good approximation, be treated as planar.
The blue cell array depicted in Fig. A.4B denotes the ‘true’ apical surface of the epithelial tissue. Provided the area of interest is much smaller than the surface’s radius of curvature, we can fit a well defined tangent plane to the patch. Let denote the 3D position of the ith vertex within patch n – it is a matrix of size 3vn where vn is the number of vertices contained in patch n. The best fit triad of vectors is obtained easily via an SVD decomposition
The approximate planar graph of patch n, shown as the black cell array in Fig. A.4B, is obtained by projecting onto the two principal components; VMSI is applied on the distortion. Importantly, the set of inferred tensions and pressures within each patch is unique up to an overall scale and thus there exists an undetermined relative scale between each patch - denoted λn. We fix such scales by definining each patch to overlap by 1/4 their linear extent such that a subset of edges are involved in multiple inferred regions. Hence, the scale λn for each patch is found by minimizing the squared difference between inferred tensions of edges shared by adjacent patches globally, subject to the constraint that the average scale is 1 to ensure a non-trivial solution λn ≠ 0.
This was used to define the patch size used in the empirical measurements during Drosophila embryogenesis. The outlined procedure was validated in-silico for synthetic spherical embryos containing roughly 3000 cells, with mechanics patterned by a vertex model minimized on the surface of a sphere. An example of a simulated embryo with azimuthal pattern of tension is shown in Fig.A.4A, both in the embedding space and in the cylindrical unwrapping of the sphere, analogous to the data shown for the Drosophila embryo. As shown in Fig. A.4C, excellent agreement between the inferred and known tensions was found provided the patch size was small compared to surface curvature. The inset shows this occurred when the defined patches contained 100 or less cells. This was used to define the patch size used in the empirical measurements during Drosophila embryogenesis.
Appendix F: Residuals of VMSI algorithm during GBE
Figure A.5.
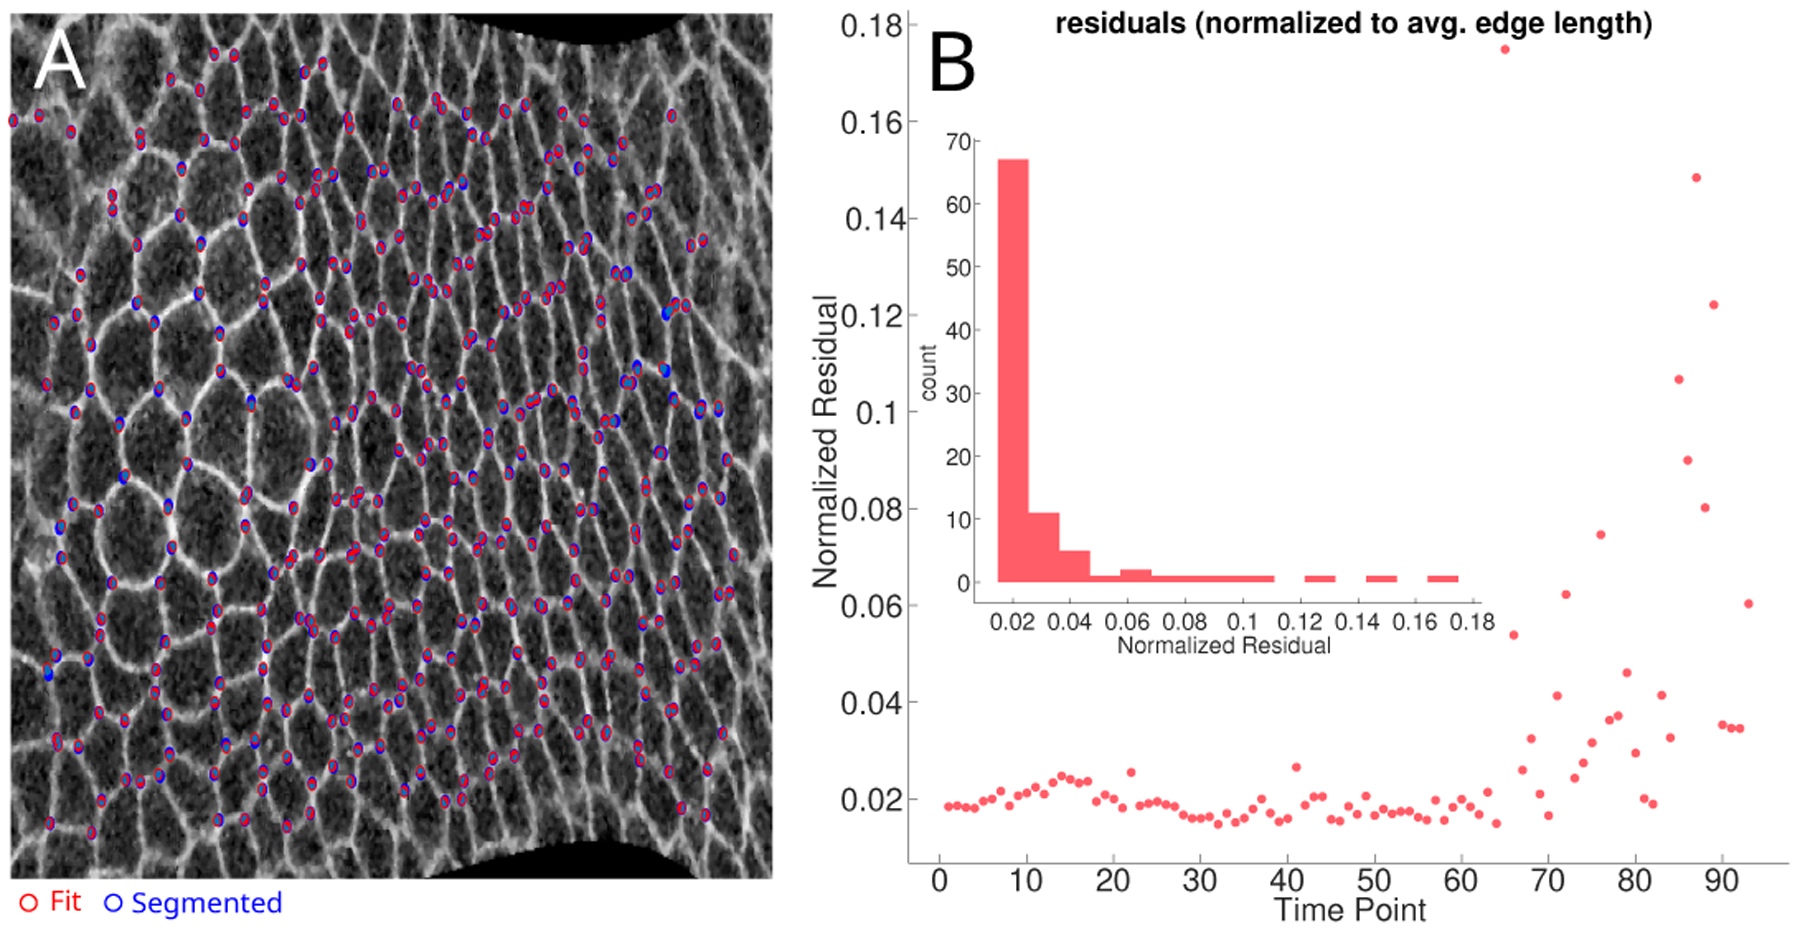
A) A confocal image of GBE comparing the vertex position obtained by segmentation (in blue) and the position obtained by VMSI (in red). B) The plot of residual (Eq. 5) normalized by the average bond length over the time-course of the movie analyzed. The inset displays the distribution of values. The VMSI begins to make qualitative errors during the onset of late GBE, in agreement with our continuum measurements that myosin becomes unbalanced.
Appendix G: Dynamics of mitotic cells in late GBE
Figure A.6.
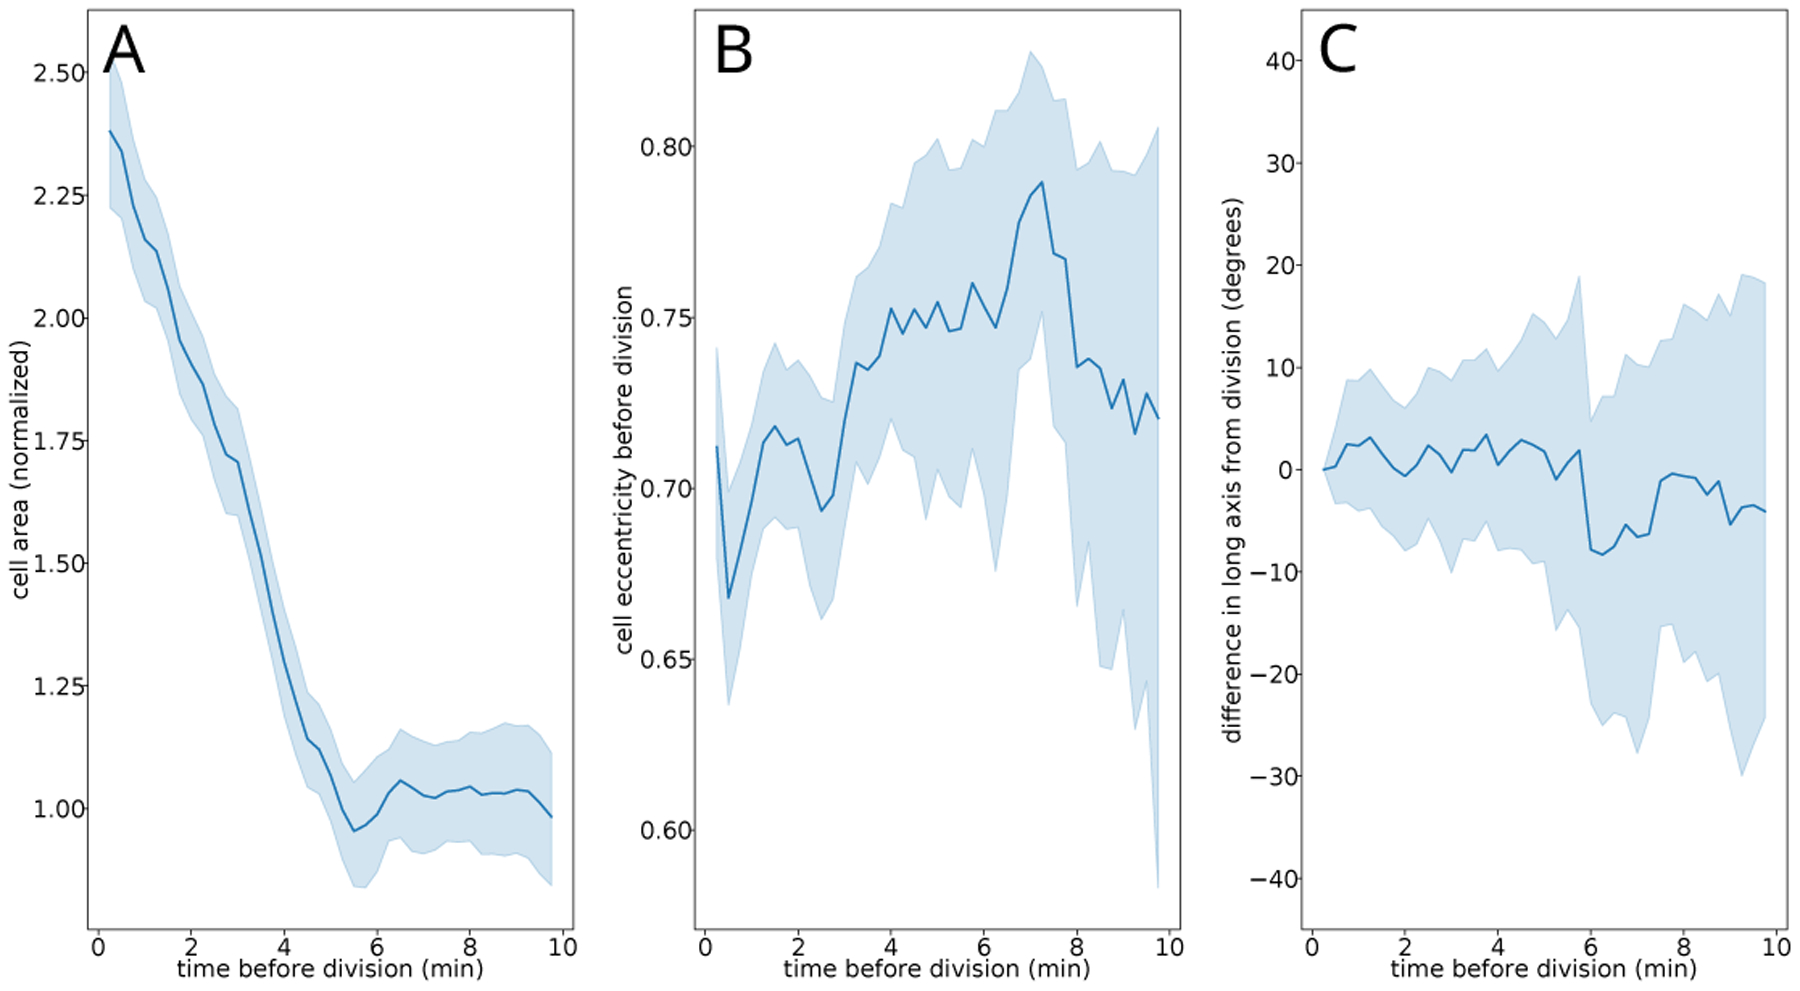
Distributions of cell area (A), cell eccentricity (B), and difference in long axis relative to division (C). Solid lines indicate means while surrounding outline indicates one standard deviation. We see no overall trend and constrained dynamics 5 minutes out from division, our chosen time (based on area growth).
References
- [1].Farhadifar Reza, Röper Jens-Christian, Aigouy Benoit, Eaton Suzanne, and Jülicher Frank, “The influence of cell mechanics, cell-cell interactions, and proliferation on epithelial packing,” Current Biology 17, 2095–2104 (2007). [DOI] [PubMed] [Google Scholar]
- [2].Rauzi Matteo, Verant Pascale, Lecuit Thomas, and Lenne Pierre-François, “Nature and anisotropy of cortical forces orienting drosophila tissue morphogenesis,” Nature cell biology 10, 1401 (2008). [DOI] [PubMed] [Google Scholar]
- [3].Blanchard Guy B, Kabla Alexandre J, Schultz Nora L, Butler Lucy C, Sanson Benedicte, Gorfinkiel Nicole, Mahadevan L, and Adams Richard J, “Tissue tectonics: morphogenetic strain rates, cell shape change and intercalation,” Nature methods 6, 458 (2009). [DOI] [PMC free article] [PubMed] [Google Scholar]
- [4].Etournay Raphael, Merkel Matthias, Marko Popović Holger Brandl, Dye Natalie A, Aigouy Benoît, Salbreux Guillaume, Eaton Suzanne, and Jülicher Frank, “Tissueminer: a multiscale analysis toolkit to quantify how cellular processes create tissue dynamics,” Elife 5, e14334 (2016). [DOI] [PMC free article] [PubMed] [Google Scholar]
- [5].Ingber Donald E, “Mechanical control of tissue growth: function follows form,” Proceedings of the National Academy of Sciences 102, 11571–11572 (2005). [DOI] [PMC free article] [PubMed] [Google Scholar]
- [6].Shraiman Boris I., “Mechanical feedback as a possible regulator of tissue growth,” Proceedings of the National Academy of Sciences 102, 3318–3323 (2005). [DOI] [PMC free article] [PubMed] [Google Scholar]
- [7].Pan Yuanwang, Heemskerk Idse, Ibar Consuelo, Shraiman Boris I, and Irvine Kenneth D, “Differential growth triggers mechanical feedback that elevates hippo signaling,” Proceedings of the National Academy of Sciences 113, E6974–E6983 (2016). [DOI] [PMC free article] [PubMed] [Google Scholar]
- [8].Frantz Christian, Stewart Kathleen M., and Weaver Valerie M., “The extracellular matrix at a glance,” J Cell Sci 123, 4195–4200 (2010). [DOI] [PMC free article] [PubMed] [Google Scholar]
- [9].Hartsock Andrea and Nelson W. James, “Adherens and Tight Junctions: Structure, Function and Connections to the Actin Cytoskeleton,” Biochimica et biophysica acta 1778, 660–669 (2008). [DOI] [PMC free article] [PubMed] [Google Scholar]
- [10].Lodish Harvey, Berk Arnold, Kaiser Chris A., Krieger Monty, Bretscher Anthony, Ploegh Hidde, Amon Angelika, and Martin Kelsey C., Molecular Cell Biology, eighth edition ed. (W. H. Freeman, New York, 2016). [Google Scholar]
- [11].Halbleib Jennifer M and Nelson W James, “Cadherins in development: cell adhesion, sorting, and tissue morphogenesis,” Genes & development 20, 3199–3214 (2006). [DOI] [PubMed] [Google Scholar]
- [12].Franke Josef D, Montague Ruth A, and Kiehart Daniel P, “Nonmuscle myosin ii generates forces that transmit tension and drive contraction in multiple tissues during dorsal closure,” Current Biology 15, 2208–2221 (2005). [DOI] [PubMed] [Google Scholar]
- [13].Lecuit Thomas and Lenne Pierre-Francois, “Cell surface mechanics and the control of cell shape, tissue patterns and morphogenesis,” Nature reviews Molecular cell biology 8, 633 (2007). [DOI] [PubMed] [Google Scholar]
- [14].Salbreux Guillaume, Charras Guillaume, and Paluch Ewa, “Actin cortex mechanics and cellular morphogenesis,” Trends in cell biology 22, 536–545 (2012). [DOI] [PubMed] [Google Scholar]
- [15].Stewart Martin P, Helenius Jonne, Toyoda Yusuke, Ramanathan Subramanian P, Muller Daniel J, and Hyman Anthony A, “Hydrostatic pressure and the actomyosin cortex drive mitotic cell rounding,” Nature 469, 226 (2011). [DOI] [PubMed] [Google Scholar]
- [16].Honda H, Yamanaka H, and Dan-Sohkawa M, “A computer simulation of geometrical configurations during cell division,” Journal of theoretical biology 106, 423–435 (1984). [DOI] [PubMed] [Google Scholar]
- [17].Hufnagel Lars, Teleman Aurelio A, Rouault Hervé, Cohen Stephen M, and Shraiman Boris I, “On the mechanism of wing size determination in fly development,” Proceedings of the National Academy of Sciences 104, 3835–3840 (2007). [DOI] [PMC free article] [PubMed] [Google Scholar]
- [18].Noll Nicholas, Mani Madhav, Heemskerk Idse, Streichan Sebastian J, and Shraiman Boris I, “Active tension network model suggests an exotic mechanical state realized in epithelial tissues,” Nature physics 13, 1221 (2017). [DOI] [PMC free article] [PubMed] [Google Scholar]
- [19].Osborne James M, Fletcher Alexander G, Pitt-Francis Joe M, Maini Philip K, and Gavaghan David J, “Comparing individual-based approaches to modelling the selforganization of multicellular tissues,” PLoS computational biology 13, e1005387 (2017). [DOI] [PMC free article] [PubMed] [Google Scholar]
- [20].Haase Kristina and Pelling Andrew E., “Investigating cell mechanics with atomic force microscopy,” Journal of The Royal Society Interface 12, 20140970 (2015). [DOI] [PMC free article] [PubMed] [Google Scholar]
- [21].Bambardekar Kapil, Clément Raphaël, Blanc Olivier, Chardès Claire, and Lenne Pierre-François, “Direct laser manipulation reveals the mechanics of cell contacts in vivo,” Proceedings of the National Academy of Sciences 112, 1416–1421 (2015). [DOI] [PMC free article] [PubMed] [Google Scholar]
- [22].Hutson M Shane, Tokutake Yoichiro, Chang Ming-Shien, Bloor James W, Venakides Stephanos, Kiehart Daniel P, and Edwards Glenn S, “Forces for morphogenesis investigated with laser microsurgery and quantitative modeling,” Science 300, 145–149 (2003). [DOI] [PubMed] [Google Scholar]
- [23].Bonnet Isabelle, Marcq Philippe, Bosveld Floris, Fetler Luc, Bellaïche Yohanns, and Graner François, “Mechanical state, material properties and continuous description of an epithelial tissue,” Journal of The Royal Society Interface 9, 2614–2623 (2012). [DOI] [PMC free article] [PubMed] [Google Scholar]
- [24].Cost Anna-Lena, Ringer Pia, Chrostek-Grashoff Anna, and Grashoff Carsten, “How to Measure Molecular Forces in Cells: A Guide to Evaluating Genetically-Encoded FRET-Based Tension Sensors,” Cellular and Molecular Bioengineering 8, 96–105 (2015). [DOI] [PMC free article] [PubMed] [Google Scholar]
- [25].Campàs Otger, Mammoto Tadanori, Hasso Sean, Sperling Ralph A, O’Connell Daniel, Bischof Ashley G, Maas Richard, Weitz David A, Mahadevan Lakshminarayanan, and Ingber Donald E, “Quantifying cell-generated mechanical forces within living embryonic tissues,” Nature methods 11, 183–189 (2014). [DOI] [PMC free article] [PubMed] [Google Scholar]
- [26].Doubrovinski Konstantin, Swan Michael, Polyakov Oleg, and Wieschaus Eric F., “Measurement of cortical elasticity in drosophila melanogaster embryos using ferrofluids,” Proceedings of the National Academy of Sciences of the United States of America 114, 1051–1056 (2017). [DOI] [PMC free article] [PubMed] [Google Scholar]
- [27].Sugimura Kaoru, Lenne Pierre-François, and Graner François, “Measuring forces and stresses in situ in living tissues,” Development 143, 186–196 (2016). [DOI] [PubMed] [Google Scholar]
- [28].Brodland G Wayne, Conte Vito, Cranston P Graham, Veldhuis Jim, Narasimhan Sriram, Hutson M Shane, Jacinto Antonio, Ulrich Florian, Baum Buzz, and Miodownik Mark, “Video force microscopy reveals the mechanics of ventral furrow invagination in drosophila,” Proceedings of the National Academy of Sciences 107, 22111–22116 (2010). [DOI] [PMC free article] [PubMed] [Google Scholar]
- [29].Chiou Kevin K, Hufnagel Lars, and Shraiman Boris I, “Mechanical stress inference for two dimensional cell arrays,” PLoS computational biology 8, e1002512 (2012). [DOI] [PMC free article] [PubMed] [Google Scholar]
- [30].Ishihara Shuji and Sugimura Kaoru, “Bayesian inference of force dynamics during morphogenesis,” Journal of theoretical biology 313, 201–211 (2012). [DOI] [PubMed] [Google Scholar]
- [31].Guirao Boris, Rigaud Stéphane U, Bosveld Floris, Bailles Anaïs, Lopez-Gay Jesus, Ishihara Shuji, Sugimura Kaoru, Graner François, and Bellaïche Yohanns, “Unified quantitative characterization of epithelial tissue development,” Elife 4, e08519 (2015). [DOI] [PMC free article] [PubMed] [Google Scholar]
- [32].Kong Weiyuan, Loison Olivier, Shivakumar Pruthvi Chavadimane, Collinet Claudio, Lenne Pierre-François, and Clément Raphaël, “Force inference predicts local and tissue-scale stress patterns in epithelia,” bioRxiv, 475012 (2018). [Google Scholar]
- [33].Brodland GW, Veldhuis J, Kim S, Perrone M, Mashburn D, and Hutson M, “Cellfit: A cellular force-inference toolkit using curvilinear cell boundaries,” PLoS One 9 (2014). [DOI] [PMC free article] [PubMed] [Google Scholar]
- [34].Streichan Sebastian J, Lefebvre Matthew F, Noll Nicholas, Wieschaus Eric F, and Shraiman Boris I, “Global morphogenetic flow is accurately predicted by the spatial distribution of myosin motors,” eLife 7, e27454 (2018). [DOI] [PMC free article] [PubMed] [Google Scholar]
- [35].He Bing, Doubrovinski Konstantin, Polyakov Oleg, and Wieschaus Eric, “Apical constriction drives tissue-scale hydrodynamic flow to mediate cell elongation,” Nature 508, 392–396 (2014). [DOI] [PMC free article] [PubMed] [Google Scholar]
- [36].Collinet Claudio, Rauzi Matteo, Lenne Pierre-François, and Lecuit Thomas, “Local and tissue-scale forces drive oriented junction growth during tissue extension,” Nature cell biology 17, 1247 (2015). [DOI] [PubMed] [Google Scholar]
- [37].Landau LD and Lifshitz EM, Fluid Mechanics.
- [38].Coxeter Harold Scott Macdonald, “Introduction to geometry,” (1961).
- [39].Moukarzel C, “Geometrical consequences of foam equilibrium,” Physical Review E 55, 6866 (1997). [Google Scholar]
- [40].Batchelor GK, “The stress system in a suspension of force-free particles,” Journal of fluid mechanics 41, 545–570 (1970). [Google Scholar]
- [41].Heemskerk Idse and Streichan Sebastian J, “Tissue cartography: compressing bio-image data by dimensional reduction,” Nature methods 12, 1139 (2015). [DOI] [PMC free article] [PubMed] [Google Scholar]
- [42].Zallen Jennifer A. and Blankenship J. Todd, “Multicellular dynamics during epithelial elongation,” Seminars in cell & developmental biology 19, 263–270 (2008). [DOI] [PMC free article] [PubMed] [Google Scholar]
- [43].Rauzi Matteo, Lenne Pierre-François, and Lecuit Thomas, “Planar polarized actomyosin contractile flows control epithelial junction remodelling,” Nature 468, 1110 (2010). [DOI] [PubMed] [Google Scholar]
- [44].Foe VE, “Mitotic domains reveal early commitment of cells in Drosophila embryos,” Development 107, 1–22 (1989). [PubMed] [Google Scholar]
- [45].Baena-López Luis Alberto, Baonza Antonio, and García-Bellido Antonio, “The orientation of cell divisions determines the shape of drosophila organs,” Current Biology 15, 1640–1644 (2005). [DOI] [PubMed] [Google Scholar]
- [46].Morais da Silva Sara and Vincent Jean-Paul, “Oriented cell divisions in the extending germband of drosophila,” Development 134, 3049–3054 (2007). [DOI] [PubMed] [Google Scholar]
- [47].Louveaux Marion, Julien Jean-Daniel, Mirabet Vincent, Boudaoud Arezki, and Hamant Olivier, “Cell division plane orientation based on tensile stress in arabidopsis thaliana,” Proceedings of the National Academy of Sciences 113, E4294–E4303 (2016). [DOI] [PMC free article] [PubMed] [Google Scholar]
- [48].Nestor-Bergmann Alexander, Goddard Georgina, and Woolner Sarah, “Force and the spindle: mechanical cues in mitotic spindle orientation,” in Seminars in cell & developmental biology, Vol. 34 (Elsevier, 2014) pp. 133–139. [DOI] [PMC free article] [PubMed] [Google Scholar]
- [49].Wyatt Tom PJ, Harris Andrew R, Lam Maxine, Cheng Qian, Bellis Julien, Dimitracopoulos Andrea, Kabla Alexandre J, Charras Guillaume T, and Baum Buzz, “Emergence of homeostatic epithelial packing and stress dissipation through divisions oriented along the long cell axis,” Proceedings of the National Academy of Sciences 112, 5726–5731 (2015). [DOI] [PMC free article] [PubMed] [Google Scholar]
- [50].Bosveld Floris, Markova Olga, Guirao Boris, Martin Charlotte, Wang Zhimin, Pierre Anaëlle, Balakireva Maria, Gaugue Isabelle, Ainslie Anna, Christophorou Nicolas, et al. , “Epithelial tricellular junctions act as interphase cell shape sensors to orient mitosis,” Nature 530, 495 (2016). [DOI] [PMC free article] [PubMed] [Google Scholar]
- [51].Krzic Uros, Gunther Stefan, Saunders Timothy E, Streichan Sebastian J, and Hufnagel Lars, “Multiview light-sheet microscope for rapid in toto imaging,” Nature Methods 9, 730–733 (2012). [DOI] [PubMed] [Google Scholar]
- [52].Edelstein Arthur D., Tsuchida Mark A., Amodaj Nenad, Pinkard Henry, Vale Ronald D., and Stuurman Nico, “Advanced methods of microscope control using Manager software,” Journal of biological methods 1 (2014), 10.14440/jbm.2014.36. [DOI] [PMC free article] [PubMed] [Google Scholar]
- [53].Preibisch Stephan, Amat Fernando, Stamataki Evangelia, Sarov Mihail, Singer Robert H, Myers Eugene, and Tomancak Pavel, “Efficient Bayesian-based multiview deconvolution,” Nature methods 11, 645–648 (2014). [DOI] [PMC free article] [PubMed] [Google Scholar]
- [54].Walker Shawn W., “FELICITY: A Matlab/C++ Tool-box for Developing Finite Element Methods and Simulation Modeling,” SIAM Journal on Scientific Computing 40, C234–C257 (2018). [Google Scholar]


