

Abstract
Whole genome analysis of SARS-CoV-2 is important to identify its genetic diversity. Moreover, accurate detection of SARS-CoV-2 is required for its correct diagnosis. To address these, first we have analysed publicly available 10 664 complete or near-complete SARS-CoV-2 genomes of 73 countries globally to find mutation points in the coding regions as substitution, deletion, insertion and single nucleotide polymorphism (SNP) globally and country wise. In this regard, multiple sequence alignment is performed in the presence of reference sequence from NCBI. Once the alignment is done, a consensus sequence is build to analyse each genomic sequence to identify the unique mutation points as substitutions, deletions, insertions and SNPs globally, thereby resulting in 7209, 11700, 119 and 53 such mutation points respectively. Second, in such categories, unique mutations for individual countries are determined with respect to other 72 countries. In case of India, unique 385, 867, 1 and 11 substitutions, deletions, insertions and SNPs are present in 566 SARS-CoV-2 genomes while 458, 1343, 8 and 52 mutation points in such categories are common with other countries. In majority (above 10%) of virus population, the most frequent and common mutation points between global excluding India and India are L37F, P323L, F506L, S507G, D614G and Q57H in NSP6, RdRp, Exon, Spike and ORF3a respectively. While for India, the other most frequent mutation points are T1198K, A97V, T315N and P13L in NSP3, RdRp, Spike and ORF8 respectively. These mutations are further visualised in protein structures and phylogenetic analysis has been done to show the diversity in virus genomes. Third, a web application is provided for searching mutation points globally and country wise. Finally, we have identified the potential conserved region as target that belongs to the coding region of ORF1ab, specifically to the NSP6 gene. Subsequently, we have provided the primers and probes using that conserved region so that it can be used for detecting SARS-CoV-2. Contact: indrajit@nitttrkol.ac.in Supplementary information: Supplementary data are available at http://www.nitttrkol.ac.in/indrajit/projects/COVID-Mutation-10K
Keywords: conserved region, multiple sequence alignment, NSP6, SNP, SARS-CoV-2, whole genome sequencing
1 Introduction
SARS-CoV-2, the virus that causes COVID-19, is thought to have first spread from an animal host to humans in Wuhan, China, in December 2019 [1]. Since then the virus entrenched in most of the countries and became an epidemic with an exponential growth rate creating an alarming situation around the globe. The World Health Organization (WHO) on 11 March 2020 declared COVID-19 to be a pandemic by citing international public health emergency. Mostly exposed population experiences few mild to moderate symptoms, such as high body temperature in conjunction with some respiratory symptoms such as cough, sore throat and headache while some remain asymptomatic [2]. Several measures such as proper nationwide lockdown, social distancing [3] and face masks are adopted around the globe to bring the effect of the virus under control but still more than 79.05 million people are already affected globally with a death count of more than 1737 thousand [4] increasing the need for a cure against this global pandemic.
SARS-CoV-2 virus is a single-stranded enveloped RNA virus of length 29.9 kilobase pairs [5–9]. It has 11 coding regions where ORF1ab occupies majority of the genome, whereas spike (S), envelope (E), membrane (M), nucleocapsid (N) and 6 accessory regions such as ORF3a, ORF6, ORF7a, ORF7b, ORF8 and ORF10 occupying the rest of the genome [5, 6]. The genetic diversity and functionality of many of the coding regions are yet to be discovered. In this early phase of research, it is very important to understand the genetic diversity of this virus globally so that proper drug and vaccine can be developed [10, 11]. In this regard, few small-scale genomic analysis has been performed in [12–16] to show the evolution of SARS-CoV-2. Similarly, we have also analysed Indian SARS-CoV-2 genomes in [17]. On the other hand, the virus detection and epitope-based synthetic vaccine design require genome-wide analysis of pool of virus genomes in order to find the most conserved regions so that RT-PCR kits can be developed to detect virus globally. To the best of our knowledge, analysis of global genetical diversity on such a large scale (of more than 10 thousand SARS-CoV-2 genomes) and subsequently finding conserved regions for those genomes are not reported yet.
For studying genetic diversity, it is important to identify the mutation points such as substitution, deletion, insertion and single nucleotide polymorphism (SNP) in virus population. Among the mutation points, SNPs create a high linkage disequilibrium, which can be then targeted to determine the correct dose of vaccine for a heterogeneous population [18]. Based on the measles genotype-specific SNPs, in [19], Tran et al. describe a process to rapidly determine whether a measles-positive sample is vaccine associated or a wild-type virus. A rapid differentiation of wild-type virus from vaccine strains is done to avoid any further escalation of spread of the disease. Moreover, designing and defining the dose of the vaccine is also a very challenging task [20]. SNPs can be very helpful for this purpose as well. As per the study by [21], candidate SNPs were identified that may be important in regulating humoral immunity to smallpox vaccination. In [22], the authors used SNP-based PCR assay for the detection of a live vaccine strain of Erysipelothrix rhusiopathiae. Chothe et al. [23] performed whole-genome sequencing of Bovine herpesvirus-1 (BoHV-1), which causes reproductive disorders in cattle and used SNPs to cluster them into two different vaccine groups and one distinct cluster of field isolates. Consequently, they developed an SNP-based PCR assay to differentiate between vaccine and clinical strains to accurately determine the prevalence of BoHV-1 in cattle. In [24], detailed analysis of SNPs for Varicella-zoster virus (VZV) was carried out, which suggested 24 potential vaccine-specific sites. For the detection of SARS-CoV-2, [25] have identified targets, primers and probes using Basic Local Alignment Search Tool (BLAST) and reported RdRp, E and N as the target proteins for SARS-CoV-2 detection. In [26], the authors identified ORF8 to be the potential target for SARS-CoV-2 detection. However, these studies were conducted on a small number of virus genomes. Furthermore, since the studies were conducted around four months back, the virus has evolved making it necessary for further analysis to find its new potential target, primers and probes. Taking cues from all the aforementioned studies, we have analysed publicly available 10 664 complete or near-complete SARS-CoV-2 genomes of 73 countries around the globe to find mutation points to determine the SNPs, identify the conserved region as target and subsequently propose the primers and probes for SARS-CoV-2 detection.
Initially, we have analyzed publicly available 10 664 complete or near-complete SARS-CoV-2 genomes of 73 countries around the globe to find mutation points as substitution, deletion and insertion as well as SNPs. For this purpose, multiple sequence alignment (MSA) [27], called Clustal Omega (ClustalO) [28, 29], is performed in the presence of reference sequence from the National Center for Biotechnology Information (NCBI). Multiple sequence alignment methods are algorithmic solutions to align evolutionarily related sequences by considering evolutionary events such as mutations, substitutions, deletions, insertions and rearrangements under certain conditions. These methods can be applied to DNA, RNA or protein sequences. MSA methods are responsible for a large number of in silico analysis, which include phylogenetic reconstruction, domain analysis, motif finding and other applications as well [30]. Once the alignment is done, a consensus sequence is built to analyse each genomic sequence to identify the mutation points. As a result, we have found 7209, 11700, 119 and 53 as substitutions, deletions, insertions and SNPs globally across 29.9 kbp. Thereafter, unique mutations as substitutions, deletions, insertions and SNPs are shown for individual countries with respect to other 72 countries. The results have been illustrated taking India as an example where 385, 867, 1 and 11 unique substitutions, deletions, insertions and SNPs are present while 458, 1343, 8 and 52 mutation points in such categories are common with other countries. The outcomes of our analysis are shown quantitatively and visually by providing BioCircos, showing major mutation points in protein structures and genetic diversity through phylogenetic analysis. Moreover, a web application has also been provided for browsing through the mutation points globally and across 73 countries individually. Finally, we have identified a conserved region as target, which is more than 100 nt long. This conserved region belongs to ORF1ab coding region, specifically to the NSP6 gene. This ultimately resulted in the identification of primers and probes using that conserved region for SARS-CoV-2 detection. To summarise, the main contributions of this works are the following: (a) more than 10000 SARS-CoV-2 genomes are aligned in high-performance computing environment so that the mutation in virus sequences globally can be determined, (b) unique mutations in terms of substitutions, deletions and SNPs are shown for individual countries with respect to other 72 countries, (c) a website is prepared to help the researchers to conduct further research after having the mutation information and (d) identify the conserved region as target in ORF1ab, specifically NSP6 gene and subsequently provide primers and probes for SARS-CoV-2 detection. Thus, the target region of NSP6 gene can be used as a confirmatory assay in current context.
2 Materials and Methods
In this section, the source of 10 664 virus genomes across 73 countries and methods used to analyse such genomes are discussed to identify the genetic diversity and target gene.
2.1 Data Collection and Preparation
SARS-CoV-2 has 11 coding regions and 25 coded proteins, which are shown and reported in Figure 1 and Table S1, respectively. Initially, the Reference Genome (NC_045512.2) of SARS-CoV-2 virus is collected from NCBI (https://www.ncbi.nlm.nih.gov/nuccore/1798174254) followed by the collection of 10 664 complete or near complete SARS-CoV-2 genomes or sequences from the Global Initiative on Sharing All Influenza Data (GISAID) (https://www.gisaid.org/) in fasta format. These sequences are distributed in 73 countries. The same is shown using geoplot in Figure 2A while day and month wise statistics are shown in 2B. The distribution of the sequences in different countries is reported in supplementary Table S2. It is important to note that GISAID contains many incomplete sequences or virus genome that we have filtered out while preparing our dataset. The dataset contains sequence ID and virus genome as a fasta format. The maximum and average length of the 10 664 virus genome are 29 903 and 28 831 bp. Please note that for the data visualization and editing, BioEdit was used, and for the alignment of sequences, high-performance computing (HPC) facility of NITTTR, Kolkata, was used. The HPC cluster has a master node with dual Intel Xeon Gold 6130 Processor having 32 Cores, 2.10 GHz, 22 MB L3 Cache and 128 GB DDR4 RAM and 2 GPU and 4 CPU computing nodes with dual Intel Xeon Gold 6152 Processor having 44 Cores, 2.1 GHz, 30 MB L3 Cache and 192 GB DDR4 RAM each, while GPU nodes have NVIDIA Tesla V100 GPU with 16 GB memory each. MSA was performed using the 2 GPU and 4 CPU computing nodes.
Figure 1.

Coding regions and corresponding proteins of SARS-CoV-2 genome.
Figure 2.

(a) Geoplot to show the distribution of SARS-CoV-2 genomes around the globe and (b) bar and pie charts show the daily and monthly statistics of SARS-CoV-2 genomes from January 2020 to May 2020.
2.2 Pipeline of the Workflow
The pipeline of the workflow is shown in Figure 3A. In order to find the mutation points from 10 664 SARS-CoV-2 sequences globally and country wise, the sequences are aligned first using MSA technique called ClustalO in the presence of reference sequence from NCBI. The choice of selecting ClustalO is taken because of its popularity, speed and accuracy. k-tuple method is used in ClustalO to produce pairwise alignment followed by mBed, which is used to cluster the sequences. Thereafter, k-means clustering algorithm is used. Guide tree is then built using unweighted pair group method with arithmetic mean (UPGMA) method. Finally, HHalign package is used to construct the MSA. After performing ClustalO, a consensus sequence is built so that mutation points such as substitution, deletion and insertion can be extracted from each genome. The preparation of consensus sequence is done based on the (a) higher frequency of nucleotides and (b) in case, if there is a tie in the frequency of the nucleotides, then such genomic places are replaced by the nucleotides of reference sequence. In this process of consensus building, the consent of population and reference sequence can be taken. The overall detection scheme is shown in Figure 3B to identify substitution, deletion and insertion. This is applied for each virus genome. There are three ways in which substitution can be identified in virus genomes. With respect to consensus sequence, these changes are the following: (i) only one change in the nucleotide of the genomic sequence, (ii) two changes in the nucleotide of the genomic sequence and (iii) three changes in the nucleotide of the genomic sequence. A mutation is considered as deletion if there is a nucleotide present in the consensus sequence, which is replaced by a gap in the genomic sequence while for insertion, the vice-versa is true. After having the lists of substitution, deletion and insertion, SNP is further computed from substitution list as the SNPs occur in more than 1% of the virus population and create variants in the population. Figure 3C shows examples of substitution, deletion and SNP after multiple alignment of sequences. Once we have done the mutation analysis globally and country wise sequences, these mutation details are further used to compute unique mutations as substitutions, deletions and insertions and SNPs are shown for individual countries with respect to other 72 countries. Moreover, we have developed a web application for searching the mutation points. This web application has its front end designed in PHP while the back end uses MySQL server.
Figure 3.

(a) Pipeline of the workflow. (b) Mutation detection schemes. (c) Examples of mutation in multiple aligned sequences.
Furthermore, to identify the conserved regions, entropy ( ) is computed as
 |
(1) |
where  represents the frequency of each residue
  occurring at position
  and 5 represents the four possible residues as nucleotides plus gap. To identify the conserved regions, a minimum segment length of 15 is considered with maximum average entropy as 0.2. Furthermore, after finding the consensus sequence, maximum entropy per position is taken as 0.2 with no gaps. All these values are taken after following the literature. Subsequently, a particular conserved region with more than 100 nucleotides is considered as potential target. This is ultimately used in the identification of primers and probes using Primer-BLAST (https://www.ncbi.nlm.nih.gov/tools/primer-blast/) for the detection of SARS-CoV-2. Moreover, the genetic diversity of the virus genomes is depicted through phylogenetic analysis and the important mutation points are shown in protein structures.
3 Results
In the result section, initially identification of mutation points as substitutions, deletions, insertions and SNPs are discussed. Next, unique mutation points in individual countries with respect to 72 other countries are shown. Apart from this, the steps of identifying SNPs are elaborated followed by the discussion on the development of web application. Furthermore, potential conserved region of SARS-CoV-2 as target is determined to identify the primers and probes.
3.1 Identification of Mutation Points
Initially, we have found 7209, 11700, 119 and 53 mutation points as substitutions, deletions, insertions and SNPs globally by considering all the 73 countries. In total, 19028 mutation points are found by considering substitutions, deletions and insertions. It is to be noted that in this work, we have only considered the mutation points in the coding regions. To understand the mutation of virus population in a particular country as compared to the global mutation, as an example, we have shown the mutation of Indian virus population. In this regard, there are 17775, 6824, 10833, 118 and 48 global mutation excluding India while in the case of India, we have found 3062, 843, 2210, 9 and 63 mutations as all mutations, substitutions, deletions, insertions and SNPs. This is reported in Table 1. It is found from the table that the Indian sequences have 59.08% ((1809/3062)*100%), 54.32% ((458/843)*100%), 60.76% ((1343/2210)*100%), 88.88% ((8/9)*100%) and 28.57% ((18/63)*100%) common mutation points with global sequences in the five categories. In order to compute such common points, Venn diagrams are prepared and shown in Figure 4(a). As can be seen from the Venn diagrams, though the mutations in Indian sequences have 59.08%, 54.32%, 60.76%, 88.88% and 28.57% common mutation points with global sequences, when seen from the global perspective, these percentage of common mutations become 10.17% ((1809/17775)*100%), 6.71% ((458/6824)*100%), 12.39% ((1343/10833)*100%), 6.78% ((8/118)*100%) and 37.50% ((18/48)*100%), respectively. For other countries, similar calculations can be performed as well. Apart from this representation, circos plots are reported in Figure 4B to show the frequency of mutation points through different tracks as substitution, deletion, insertion and SNP. It gives a clear visualization regarding mutation in different coding regions of SARS-CoV-2. Unique mutations, substitutions, deletions, insertions and SNPs for individual countries are computed and reported in Table 2. The details of mutation globally and country wise are provided in supplementary Tables S3 and S4 while BioCircos of 72 countries are also given in supplementary Figure S1.
Table 1.
Number of unique mutations, substitutions, deletions, insertions and SNPs
| Country | All mutations | Substitution | Deletion | Insertion | SNP |
|---|---|---|---|---|---|
| Global including India | 19028 | 7209 | 11700 | 119 | 53 |
| Global excluding India | 17775 | 6824 | 10833 | 118 | 48 |
| India | 3062 | 843 | 2210 | 9 | 63 |
| % of common mutation points with India | 59.08 | 54.32 | 60.76 | 88.88 | 28.57 |
Figure 4.

(a) Venn diagrams between global without India and India for all unique mutation, substitutions, deletions, insertions and SNP, (b) BioCircos to illustrate the frequency of mutations across the global excluding India and Indian SARS-CoV-2 genomes through different tracks e.g. substitution as outer track 1, deletion as track 2, insertion as track 3 and SNP as inner track 4 while in other images substitution as outer track 1 and SNP as inner track 2, (c) SNPs present in more than 10% of SARS-CoV-2 population for global and India, (d) screen shots of the web application before and after executing search query, (e) identified primers and probes from Primer-BLAST.
Table 2.
Statistics of unique mutations, substitutions, deletions, insertions and SNPs in individual countries
| Country | All Mutations | Substitutions | Deletions | Insertions | SNPs | Country | All Mutations | Substitutions | Deletions | Insertions | SNPs |
|---|---|---|---|---|---|---|---|---|---|---|---|
| Algeria | 11 | 11 | 0 | 0 | 11 | Luxembourg | 579 | 113 | 459 | 7 | 113 |
| Argentina | 13 | 13 | 0 | 0 | 13 | Malaysia | 192 | 36 | 151 | 5 | 36 |
| Australia | 2551 | 946 | 1515 | 90 | 86 | Mexico | 440 | 71 | 364 | 5 | 71 |
| Austria | 178 | 47 | 126 | 5 | 47 | Morocco | 57 | 17 | 39 | 1 | 17 |
| Bangladesh | 88 | 17 | 70 | 1 | 17 | Nepal | 1 | 1 | 0 | 0 | 1 |
| Belarus | 12 | 12 | 0 | 0 | 12 | Netherlands | 644 | 476 | 163 | 5 | 64 |
| Belgium | 586 | 462 | 116 | 8 | 62 | New Zealand | 582 | 216 | 361 | 5 | 77 |
| Brazil | 134 | 108 | 21 | 5 | 108 | Nigeria | 122 | 25 | 96 | 1 | 25 |
| Cambodia | 1 | 1 | 0 | 0 | 1 | Northern Ireland | 182 | 48 | 129 | 5 | 48 |
| Canada | 218 | 117 | 93 | 8 | 117 | Norway | 183 | 37 | 141 | 5 | 37 |
| Chile | 44 | 29 | 10 | 5 | 29 | Oman | 89 | 87 | 1 | 1 | 87 |
| China | 1886 | 831 | 1047 | 8 | 48 | Pakistan | 53 | 15 | 37 | 1 | 15 |
| Colombia | 178 | 45 | 128 | 5 | 45 | Panama | 159 | 8 | 149 | 2 | 8 |
| Croatia | 156 | 51 | 100 | 5 | 51 | Peru | 8 | 8 | 0 | 0 | 8 |
| Czech Republic | 112 | 41 | 69 | 2 | 41 | Poland | 176 | 64 | 107 | 5 | 64 |
| DRC | 159 | 43 | 111 | 5 | 43 | Portugal | 732 | 386 | 338 | 8 | 64 |
| Denmark | 373 | 139 | 226 | 8 | 51 | Qatar | 404 | 7 | 395 | 2 | 7 |
| England | 5594 | 2370 | 3112 | 112 | 53 | Romania | 46 | 46 | 0 | 0 | 46 |
| Estonia | 58 | 43 | 10 | 5 | 43 | Russia | 73 | 36 | 32 | 5 | 36 |
| Finland | 309 | 47 | 257 | 5 | 47 | Saudi Arabia | 12 | 12 | 0 | 0 | 12 |
| France | 386 | 208 | 173 | 5 | 56 | Scotland | 1407 | 712 | 645 | 50 | 90 |
| Georgia | 94 | 34 | 59 | 1 | 34 | Senegal | 229 | 79 | 148 | 2 | 79 |
| Germany | 342 | 159 | 178 | 5 | 159 | Serbia | 14 | 14 | 0 | 0 | 14 |
| Greece | 19 | 19 | 0 | 0 | 19 | Singapore | 91 | 48 | 38 | 5 | 48 |
| Hungary | 13 | 13 | 0 | 0 | 13 | Slovakia | 13 | 10 | 3 | 0 | 10 |
| Iceland | 1582 | 599 | 919 | 64 | 66 | Slovenia | 22 | 17 | 4 | 1 | 17 |
| India | 3062 | 843 | 2210 | 9 | 63 | South Africa | 267 | 41 | 221 | 5 | 41 |
| Indonesia | 186 | 12 | 169 | 5 | 12 | South Korea | 44 | 44 | 0 | 0 | 44 |
| Ireland | 34 | 20 | 13 | 1 | 20 | Spain | 1054 | 457 | 523 | 74 | 114 |
| Israel | 8 | 8 | 0 | 0 | 8 | Sweden | 166 | 154 | 12 | 0 | 44 |
| Italy | 266 | 67 | 194 | 5 | 67 | Switzerland | 1194 | 252 | 934 | 8 | 62 |
| Japan | 126 | 74 | 47 | 5 | 74 | Thailand | 233 | 69 | 159 | 5 | 69 |
| Kazakhstan | 64 | 56 | 7 | 1 | 56 | Turkey | 108 | 82 | 24 | 2 | 82 |
| Kenya | 144 | 84 | 59 | 1 | 84 | USA | 5387 | 1988 | 3384 | 15 | 42 |
| Kuwait | 137 | 23 | 109 | 5 | 23 | Vietnam | 62 | 36 | 25 | 1 | 36 |
| Latvia | 42 | 39 | 3 | 0 | 39 | Wales | 1544 | 435 | 1092 | 17 | 83 |
| Lithuania | 4 | 4 | 0 | 0 | 4 |
Figure 6.

SNPs highlighted in protein structure of Spike where (a) represents the SNPs common in both global excluding India and India, (b) represents the SNPs common in other 72 countries and India (c) represents the SNPs unique in India.
Furthermore, unique mutations as substitutions, deletions, insertions and SNPs for individual countries with respect to other 72 countries are reported in Table 3. Let us take an example to illustrate the difference between Tables 2 and 3. Suppose, country A has mutation points such as 574, 575, 576, 577 and 578 and the mutation points of country B are 575, 578, 582, 583, 584 and 590. In case of Table 2, the results that will be reported are 5 and 6 mutation points, respectively, for countries A and B. So, these are the mutation points that are unique to each individual country. On the other hand, Table 3 will report the value as 3 mutation points for country A as the points 574, 576 and 577 are present only in country A and nowhere else. Similarly, for country B, the value is 4 as 582, 583 and 584 and 590 are the mutation points completely unique to country B. To further illustrate, India has a total of 843, 2210, 9 and 63 unique mutations as substitutions, deletions, insertions and SNPs while with respect to other 72 countries India has 385, 867, 1 and 11 unique mutations as substitutions, deletions, insertions and SNPs, respectively. This can be visualised through Venn diagrams in Figure 4A.
Table 3.
Statistics of unique mutations, substitutions, deletions, insertions and SNPs for individual countries with respect to other 72 countries
| Country | All Mutations | Substitutions | Deletions | Insertions | SNPs | Country | All Mutations | Substitutions | Deletions | Insertions | SNPs |
|---|---|---|---|---|---|---|---|---|---|---|---|
| Algeria | 2 | 2 | 0 | 0 | 2 | Luxembourg | 48 | 23 | 25 | 0 | 23 |
| Argentina | 1 | 1 | 0 | 0 | 1 | Malaysia | 45 | 9 | 36 | 0 | 9 |
| Australia | 961 | 311 | 650 | 0 | 3 | Mexico | 130 | 19 | 111 | 0 | 19 |
| Austria | 13 | 3 | 10 | 0 | 3 | Morocco | 2 | 2 | 0 | 0 | 2 |
| Bangladesh | 69 | 5 | 64 | 0 | 5 | Nepal | 0 | 0 | 0 | 0 | 0 |
| Belarus | 2 | 2 | 0 | 0 | 2 | Netherlands | 203 | 141 | 62 | 0 | 6 |
| Belgium | 165 | 142 | 23 | 0 | 6 | New Zealand | 208 | 45 | 163 | 0 | 6 |
| Brazil | 32 | 25 | 7 | 0 | 25 | Nigeria | 79 | 4 | 75 | 0 | 4 |
| Cambodia | 1 | 1 | 0 | 0 | 1 | Northern Ireland | 8 | 6 | 2 | 0 | 6 |
| Canada | 54 | 26 | 28 | 0 | 26 | Norway | 56 | 3 | 53 | 0 | 3 |
| Chile | 2 | 1 | 1 | 0 | 1 | Oman | 14 | 14 | 0 | 0 | 14 |
| China | 757 | 380 | 377 | 0 | 10 | Pakistan | 8 | 2 | 6 | 0 | 2 |
| Colombia | 49 | 6 | 43 | 0 | 6 | Panama | 58 | 0 | 58 | 0 | 0 |
| Croatia | 65 | 15 | 50 | 0 | 15 | Peru | 2 | 2 | 0 | 0 | 2 |
| Czech Republic | 59 | 6 | 53 | 0 | 6 | Poland | 80 | 13 | 67 | 0 | 13 |
| DRC | 2 | 2 | 0 | 0 | 2 | Portugal | 186 | 123 | 63 | 0 | 11 |
| Denmark | 120 | 31 | 89 | 0 | 6 | Qatar | 125 | 1 | 124 | 0 | 1 |
| England | 2121 | 1026 | 1095 | 0 | 6 | Romania | 19 | 19 | 0 | 0 | 19 |
| Estonia | 7 | 7 | 0 | 0 | 7 | Russia | 7 | 7 | 0 | 0 | 7 |
| Finland | 125 | 1 | 124 | 0 | 1 | Saudi Arabia | 1 | 1 | 0 | 0 | 1 |
| France | 158 | 63 | 95 | 0 | 10 | Scotland | 254 | 167 | 87 | 0 | 9 |
| Georgia | 6 | 6 | 0 | 0 | 6 | Senegal | 9 | 9 | 0 | 0 | 9 |
| Germany | 22 | 13 | 9 | 0 | 13 | Serbia | 2 | 2 | 0 | 0 | 2 |
| Greece | 1 | 1 | 0 | 0 | 1 | Singapore | 27 | 7 | 20 | 0 | 7 |
| Hungary | 0 | 0 | 0 | 0 | 0 | Slovakia | 0 | 0 | 0 | 0 | 0 |
| Iceland | 553 | 212 | 341 | 0 | 9 | Slovenia | 0 | 0 | 0 | 0 | 0 |
| India | 1253 | 385 | 867 | 1 | 11 | South Africa | 151 | 10 | 141 | 0 | 10 |
| Indonesia | 24 | 3 | 21 | 0 | 3 | South Korea | 11 | 11 | 0 | 0 | 11 |
| Ireland | 2 | 2 | 0 | 0 | 2 | Spain | 213 | 148 | 61 | 4 | 13 |
| Israel | 0 | 0 | 0 | 0 | 0 | Sweden | 42 | 42 | 0 | 0 | 4 |
| Italy | 63 | 26 | 37 | 0 | 26 | Switzerland | 429 | 59 | 370 | 0 | 7 |
| Japan | 34 | 17 | 17 | 0 | 17 | Thailand | 38 | 14 | 24 | 0 | 14 |
| Kazakhstan | 17 | 14 | 3 | 0 | 14 | Turkey | 40 | 36 | 4 | 0 | 36 |
| Kenya | 84 | 46 | 38 | 0 | 46 | USA | 2540 | 878 | 1660 | 2 | 3 |
| Kuwait | 38 | 1 | 37 | 0 | 1 | Vietnam | 9 | 9 | 0 | 0 | 9 |
| Latvia | 4 | 4 | 0 | 0 | 4 | Wales | 357 | 104 | 253 | 0 | 4 |
| Lithuania | 0 | 0 | 0 | 0 | 0 |
3.2 Identification of SNPs
SNPs are computed based on the occurrence of substitution for a given genomic coordinate if it is more than 1% of the population. Therefore, the calculation of SNPs is dependent on the number of genomic sequences of a country. For example, since there are 566 sequences in India, those substitutions will be considered as SNPs whose occurrence is more than 5. On the other hand, for global excluding India, SNPs are those substitutions that have occurred more than 100 (0.01*(10664-566)) times in the population. Considering this, while computing unique SNPs for India out of 63 with respect to 48 global SNPs excluding India as mentioned in Table 1, it results in 45 unique SNPs for India. However, out of these 45 SNPs, 34 SNPs are present in other countries as well and only 11 SNPs are unique in India. This can be attributed to the fact that 48 SNPs are calculated globally based on the substitutions that have occurred more than 100 times in the population while for India, such occurrences are more than 5 in the 63 SNPs. Similarly, while computing SNPs for individual countries, it is obvious that the other countries can have same mutation points as SNPs because their population size varies. As a consequence, when the 48 and 63 SNPs are taken, 34 SNPs out of 45 are present in other countries, which crop up in Indian SNPs. To overcome this, unique SNPs are calculated by following the given steps: (i) initially, unique substitutions need to be identified for a country, (ii) with these unique substitutions, unique SNPs are identified that are present in these substitutions and (iii) such SNPs are excluded from all the identified SNPs in a country to identify the common and unique SNPs in Global. In this way, all those SNPs can be identified, which are unique to a particular country with respect to other 72 countries. For example, in case of India after executing step (i), we identified 385 substitutions. Subsequently 11 SNPs are identified by following step (ii) while 30 SNPs are unique globally and India shares 52 (34 and 18) common SNPs with other countries as identified in step (iii). These calculations can be carried out for the other countries as well. In Figure 4(a), the Venn diagram for the aforementioned SNPs are visualised where (i) 30 represents the SNPs unique in global excluding India, (ii) 18 represents the SNPs common in both global excluding India and India, (iii) 34 represents the SNPs common in other 72 countries and India and (iv) 11 represents the SNPs unique in India. The details of these SNPs are reported in Table 4. SNPs in the protein structures for RdRp and Spike are shown in Figures 5 and 6 respectively while the rest of the protein structures with SNPs are provided in the supplementary. Further to the aforementioned analysis, signicant SNPs e.g. that are present in more than 10% of the virus population is shown in Figure 4(c) for global excluding India and only India and reported in Table 5. The table also reports their corresponding change in nucleotide, amino acid, entropy value and coding region. It is to be noted that for certain mutation points, there may be multiple changes in nucleotide which may lead to multiple changes in amino acid as well. For example, in Table 5, at mutation point 14408, the two nucleotide changes C>T and C>A have led to two amino acid changes, P>L and P>H.
Table 4.
Details of the identified SNPs.
| Coded Protein | Global Excluding India | Common in Global Excluding India and India | Common in other 72 countries and India | Unique in India | ||||||||
|---|---|---|---|---|---|---|---|---|---|---|---|---|
| All SNPs | Non-Synonymous | Change in Amino Acid | All SNPs | Non-Synonymous | Change in Amino Acid | All SNPs | Non-Synonymous | Change in Amino Acid | All SNPs | Non-Synonymous | Change in Amino Acid | |
| NSP1 | 1 | 0 | 0 | 0 | 0 | 0 | 1 | 0 | 0 | 0 | 0 | 0 |
| NSP2 | 5 | 4 | T85I, G212D, I559V, P585S |
1 | 1 | V198I | 4 | 4 | R27C, A159V, S301F, G339S |
0 | 0 | 0 |
| NSP3 | 2 | 2 | A58T, P153L |
2 | 0 | 0 | 7 | 4 | S697F, S1197R, T1198K, A1769G |
4 | 3 | S716I, A994D, D1121G |
| NSP4 | 1 | 1 | F308Y | 0 | 0 | 0 | 4 | 3 | M33I, T295I, A380V |
0 | 0 | 0 |
| 3CL-Pro | 1 | 1 | G15S | 0 | 0 | 0 | 0 | 0 | 0 | 0 | 0 | 0 |
| NSP6 | 0 | 0 | 0 | 1 | 1 | L37F | 0 | 0 | 0 | 0 | 0 | 0 |
| NSP7 | 1 | 1 | S25L | 0 | 0 | 0 | 0 | 0 | 0 | 0 | 0 | 0 |
| NSP8 | 0 | 0 | 0 | 0 | 0 | 0 | 2 | 0 | 0 | 1 | 1 | Q198H |
| NSP9 | 0 | 0 | 0 | 0 | 0 | 0 | 0 | 0 | 0 | 1 | 0 | 0 |
| RdRp | 1 | 0 | 0 | 2 | 1 | P323L | 1 | 1 | A97V | 3 | 2 | L329I, V880I |
| Helicase | 3 | 2 | P504L, Y541C |
0 | 0 | 0 | 0 | 0 | 0 | 1 | 0 | 0 |
| Exon | 2 | 1 | A320V | 3 | 2 | F506L, S507G |
1 | 0 | 0 | 0 | 0 | 0 |
| endoRNAse | 2 | 0 | 0 | 0 | 0 | 0 | 0 | 0 | 0 | 0 | 0 | 0 |
| 2’- O- RMT | 0 | 0 | 0 | 0 | 0 | 0 | 2 | 2 | N298H, (N298I/N298T) |
0 | 0 | 0 |
| Spike | 2 | 0 | 0 | 3 | 2 | T315N, D614G |
8 | 5 | L54F, R78M, T572I, E583D, Q677H |
1 | 1 | K77M |
| ORF3a | 3 | 3 | V13L, G196V, G251V |
1 | 1 | Q57H | 0 | 0 | 0 | 0 | 0 | 0 |
| Membrane | 2 | 1 | T175M | 0 | 0 | 0 | 1 | 0 | 0 | 0 | 0 | 0 |
| ORF8 | 2 | 2 | S24L, V62L |
1 | 1 | L84S | 0 | 0 | 0 | 0 | 0 | 0 |
| Nucleocapsid | 2 | 1 | S197L | 4 | 2 | R203K, G204R |
3 | 3 | P13L, S194L, S202T |
0 | 0 | 0 |
Figure 5.

SNPs highlighted in protein structure of RNA-directed RNA polymerase (RdRp) where (a) represents the SNPs common in both global excluding India and India, (b) represents the SNPs common in other 72 countries and India and (c) represents the SNPs unique in India.
Table 5.
Mutation as SNPs in more than 10% of population of global SARS-CoV-2 genomes excluding India and only India
| Mutation as SNPs in 10098 SARS-CoV-2 Genomes excluding India | |||||||
|---|---|---|---|---|---|---|---|
| Coordinate of Mutation | Occurrence of Mutation in 10998 Genomes | Type of Mutation | Change in Nucleotide | Change in Amino Acid | Entropy | Mapped with Coding Region | |
| 1059 | 2048 | Substitution | C>T | T>I | 0.4958 | ORF1ab | |
| 3037 | 6768 | Substitution | C>T | Synonymous | 0.6468 | ORF1ab | |
| 8782 | 1212 | Substitution | C>T | Synonymous | 0.3720 | ORF1ab | |
| 11083 | 1107 | Substitution | G>T | L>F | 0.4001 | ORF1ab | |
| 14408 | 6753 | Substitution | (C>T)(C>A) | (P>L)(P>H) | 0.6471 | ORF1ab | |
| 19557 | 2246 | Substitution | (T>A)(T>C)(T>G) | (F>L), Synonymous, (F>L) | 0.5860 | ORF1ab | |
| 19558 | 2260 | Substitution | (A>G)(A>C)(A>T) | (S>G)(S>R)(S>C) | 0.5769 | ORF1ab | |
| 23403 | 6780 | Substitution | A>G | D>G | 0.6517 | Spike | |
| 25563 | 2489 | Substitution | (G>T)(G>C) | Q>H | 0.5699 | ORF3a | |
| 28144 | 1262 | Substitution | (T>C)(T>A) | (L>S)(L>*) | 0.3722 | ORF8 | |
| 28881 | 2098 | Substitution | (G>A)(G>T) | (R>K)(R>I) | 0.5246 | Nucleocapsid | |
| 28882 | 2087 | Substitution | (G>A)(G>T) | Synonymous, (R>S) | 0.5191 | Nucleocapsid | |
| 28883 | 2086 | Substitution | G>C | G>R | 0.5177 | Nucleocapsid | |
| Mutation as SNPs in 566 SARS-CoV-2 Genomes from India | |||||||
| Coordinate of Mutation | Occurrence of Mutation in 566 | Genomes | Type of Mutation | Change in Nucleotide | Change in Amino Acid | Entropy | Mapped with Coding Region |
| 3037 | 339 | Substitution | C>T | Synonymous | 0.7016 | ORF1ab | |
| 6312 | 177 | Substitution | C>A | T>K | 0.6523 | ORF1ab | |
| 11083 | 189 | Substitution | (G>T)(G>A) | (L>F), Synonymous | 0.8143 | ORF1ab | |
| 13730 | 184 | Substitution | C>T | A>V | 0.6777 | ORF1ab | |
| 14408 | 332 | Substitution | C>T | P>L | 0.7064 | ORF1ab | |
| 18877 | 117 | Substitution | C>T | Synonymous | 0.5221 | ORF1ab | |
| 19557 | 218 | Substitution | T>A | F>L | 0.6665 | ORF1ab | |
| 19558 | 218 | Substitution | A>G | S>G | 0.6665 | ORF1ab | |
| 22444 | 69 | Substitution | C>T | Synonymous | 0.3707 | Spike | |
| 22506 | 99 | Substitution | C>A | T>N | 0.4635 | Spike | |
| 22507 | 99 | Substitution | T>C | Synonymous | 0.4635 | Spike | |
| 23403 | 334 | Substitution | A>G | D>G | 0.7125 | Spike | |
| 23929 | 165 | Substitution | C>T | Synonymous | 0.6728 | Spike | |
| 25563 | 122 | Substitution | G>T | Q>H | 0.5212 | ORF3a | |
| 26735 | 112 | Substitution | C>T | Synonymous | 0.4974 | Membrane | |
| 28311 | 174 | Substitution | C>T | P>L | 0.6790 | Nucleocapsid | |
| 28854 | 71 | Substitution | C>T | S>L | 0.3903 | Nucleocapsid | |
3.3 Development of Web Application for Identification of Mutation Points
Also, a web application is provided to extract the mutation points globally for 10 664 sequences as well as country wise by providing either genomic coordinates of the virus genome or name of the coding region and mutation type. The screen shots of the web application are provided in Figure 4D. Moreover, the aligned sequences are provided as supplementary (http://www.nitttrkol.ac.in/indrajit/projects/COVID-Mutation-10K/) for further use.
3.4 Identification of Conserved Region as Target and corresponding Primers and Probes
Furthermore, we have identified a conserved region as target, which belongs to ORF1ab coding region, specifically to the NSP6 gene that is shown in Table 6. The specificity of conserved region is verified by Nucleotide BLAST with the BLAST score of 220 and specificity score as query coverage equal to 100%. It confirms global stability of this conserved region as a potential target. In order to highlight the conserved region in NSP6 protein, the structure of NSP6 is taken from Zhanglab (https://zhanglab.ccmb.med.umich.edu/COVID-19/) in the form of a PDB file and subsequently shown in Table 6 where the target conserved region is highlighted in red. The structure of NSP6 protein is generated by using C-I-TASSER [31]. Using the targeted conserved region, 10 primers and probes are identified from Primer-BLAST and reported in Table 7. In this regard, both the forward and the reverse primers are reported in this table. The GC score is found to be high for the identified primers and lie around 40%–50%. It shows these primers can be used for virus detection in RT-PCR. Moreover, the primers and probes are shown in Figure 4E. In this regard, it is worth mentioning that Griffoni et al. [32] have also identified NSP6 gene as a possible target for vaccine design while in this work the aforementioned primers and probes are the regions in NSP6 gene, which can be used for the detection of SARS-CoV-2 to diagnose COVID-19 patients correctly.
Table 6.
Targeted Conserved Region in SARS-CoV-2 Genome and its corresponding protein sequence in NSP6 which is highlighted by red colour in NSP6 gene
| DNA Sequence of Conserved Region of ORF1ab | Part of NSP6 Protein Sequence of Conserved Region ORF1ab | NSP6 Protein Structure with Target Region |
|---|---|---|
| 11277-ATACTAGTTTGTCTGGTTTTAAGCTAAAAGACTGTGTTATGTATGCATCAGCTGTAGTGTTACTAATCCTTATGACAGCAAGAACTGTGTATGATGATGGTGCTAGGAGAGTGTGGACA-11395 | TSLSGFKLKDCVMYASAVVLLILMTARTVYDDGARRVWT |
|

Table 7.
Details of primers and probes in NSP6 gene for SARS-CoV-2 detection
| Primer | Primers | Probe | ||||
|---|---|---|---|---|---|---|
| Pair | Type | Sequence (5‘->3’) | Length | Tm | GC (%) | Sequence |
| 1 | Forward | ATGCATCAGCTGTAGTGTTACT | 22 | 59.20 | 40.91 | ATGCATCAGCTGTAGTGTTACTAATCCTTATGACAGCAAGAACTGTGTATGATGATGGTGCTAGGAGAGTGTG |
| Reverse | CACACTCTCCTAGCACCATC | 20 | 59.04 | 55.00 | ||
| 2 | Forward | TATGCATCAGCTGTAGTGTTACT | 23 | 59.09 | 39.13 | TATGCATCAGCTGTAGTGTTACTAATCCTTATGACAGCAAGAACTGTGTATGATGATGGTGCTAGGAGAGTG |
| Reverse | CACTCTCCTAGCACCATCATC | 21 | 59.27 | 52.38 | ||
| 3 | Forward | TATGTATGCATCAGCTGTAGTGTT | 24 | 59.77 | 37.50 | TATGTATGCATCAGCTGTAGTGTTACTAATCCTTATGACAGCAAGAACTGTGTATGATGATGGTGCTAGGAGAGTGTG |
| Reverse | CACACTCTCCTAGCACCATCA | 21 | 60.85 | 52.38 | ||
| 4 | Forward | ATGTATGCATCAGCTGTAGTGTTA | 24 | 59.77 | 37.50 | ATGTATGCATCAGCTGTAGTGTTACTAATCCTTATGACAGCAAGAACTGTGTATGATGATGGTGCTAGGAGAG |
| Reverse | CTCTCCTAGCACCATCATCA | 20 | 57.78 | 50.00 | ||
| 5 | Forward | GTATGCATCAGCTGTAGTGTTACT | 24 | 60.32 | 41.67 | GTATGCATCAGCTGTAGTGTTACTAATCCTTATGACAGCAAGAACTGTGTATGATGATGGTGCTAGGAGAGTGTGG |
| Reverse | CCACACTCTCCTAGCACCATC | 21 | 61.52 | 57.14 | ||
| 6 | Forward | TATGCATCAGCTGTAGTGTTAC | 22 | 57.65 | 40.91 | TATGCATCAGCTGTAGTGTTACTAATCCTTATGACAGCAAGAACTGTGTATGATGATGGTGCT |
| Reverse | AGCACCATCATCATACACAGTT | 22 | 59.46 | 40.91 | ||
| 7 | Forward | GCATCAGCTGTAGTGTTACTAATC | 24 | 59.13 | 41.67 | GCATCAGCTGTAGTGTTACTAATCCTTATGACAGCAAGAACTGTGTATGATGATGGTGCTAGGA |
| Reverse | TCCTAGCACCATCATCATACAC | 22 | 59.07 | 45.45 | ||
| 8 | Forward | GCATCAGCTGTAGTGTTACTAAT | 23 | 58.10 | 39.13 | GCATCAGCTGTAGTGTTACTAATCCTTATGACAGCAAGAACTGTGTATGATGATGGTGCTAGGAGAGTG |
| Reverse | CACTCTCCTAGCACCATCATCA | 22 | 60.99 | 50.00 | ||
| 9 | Forward | ATGCATCAGCTGTAGTGTTACTAAT | 25 | 60.12 | 36.00 | ATGCATCAGCTGTAGTGTTACTAATCCTTATGACAGCAAGAACTGTGTATGATGATGGTGC |
| Reverse | GCACCATCATCATACACAGTTC | 22 | 59.09 | 45.45 | ||
| 10 | Forward | TCAGCTGTAGTGTTACTAATCCTT | 24 | 58.85 | 37.50 | TCAGCTGTAGTGTTACTAATCCTTATGACAGCAAGAACTGTGTATGATGATGGTGCTAGGAGAGTGT |
| Reverse | ACACTCTCCTAGCACCATCATC | 22 | 60.99 | 50.00 |
4 Discussions
SARS-CoV-2 has gripped the whole world and has caused a pandemic of epic proportions. In this situation, it is very important to understand the genetic diversity among the SARS-CoV-2 genomes. In this regard, the genome-wide analysis of 10 664 SARS-CoV-2 sequences has resulted in four outcomes: (a) global and country wise mutation points are identified, (b) with this mutation information, unique mutations as substitutions, deletions, insertions and SNPs for individual countries with respect to other 72 countries are identified, (c) development of a web application for searching the mutation points with the mutation information and (d) identification of a conserved region as target that belongs to ORF1ab coding region, specifically NSP6 gene that provides 10 primers and probes to detect SARS-CoV-2. Initially, we have found mutation points as substitutions, deletions, insertions and SNPs. Next, unique mutations as substitutions, deletions, insertions and SNPs for individual countries with respect to other 72 countries are identified. Also, comparative studies of global excluding India and India are performed for both the aforementioned cases.
Figure 4C depicts the SNPs in global excluding India and Indian SARS-CoV-2 sequences. It can be seen from the figure that the SNPs at 3037, 14 408 and 23 403 genomic coordinates occur close or more than 60% of the virus population. The coding regions of these SNPs are ORF1ab and Spike. It is to be noted that these genomic coordinates have been identified as frequent mutation points in the literature [33] as well, especially A23403G in virus genome that corresponds to D614G in Spike protein has been associated with enhancing viral replication in the upper respiratory tract, thereby increasing its susceptibility to neutralisation by antibodies [34]. Apart from A23403G, other significant SNPs which occur frequently include C3037T (Synonymous mutation) in NSP3 gene of ORF1ab and C14408T (P323L) in RdRp gene of ORF1ab in both global excluding India and Indian sequences. In addition to these mutation points, the most frequent (in more than 10% of virus population) and common mutation points between global excluding India and India are G11083T (L37F), T19557A (F506L), A19558G (S507G) and G25563T (Q57H) in NSP6, Exon and ORF3a respectively. Similarly for India, the other most frequent mutation points are C6312A (T1198K), C13730T (A97V), C22506A (T315N) and C28311T (P13L) in NSP3, RdRp, Spike and ORF8 respectively. All these SNPs have high entropy values, which signify that the corresponding change in nucleotide is more informative. As discussed earlier, the details of these SNPs are reported in Table 4 and 5.
In order to see the common mutation points as all mutations, substitutions, deletions, insertions and SNPs among the 73 countries, five heatmaps are created. In the heatmaps, deep blue indicates lesser number of common mutation points as opposed to yellow, which shows more number of common mutation points. The heatmap for all mutations is shown in Figure 7 for 73 countries. This heatmap is not symmetric. For example, if we consider row wise, then India has 27.91% of common mutation points with England while considering column wise, England shares 15.28% common mutation points with India. Thus, India and England have mostly different mutation points. The row and column for India are marked in red in the figure. This genetic diversity can be seen from the phylogenetic tree as well, which is discussed later. The rest of the heatmaps for substitution, deletion, insertion and SNP are reported in supplementary Figures S2 to S5.
Figure 7.

Heatmap to represent the common mutation points among 73 countries.
Moreover, to understand the spread and evolution of SARS-CoV-2, Nextstrain [35] is used to create phylogenetic tree. Nextstrain is a collection of open-source tools, which helps to understand pathogen spread and evolution, especially during outbreak. Nextstrain is one of the very recent tools through which evolution of large number of virus genomes can be visualised properly and meaningfully. It consists of auspice that is a web-based visualisation program used to present and interact with phylogenomic and phylogeographic data. There are a sequence of tools in Nextstrain that perform phylodynamic analysis [36] that includes subsampling, alignment, phylogenetic inference, temporal dating of ancestral nodes and discrete trait geographic reconstruction and inference of the most likely transmission events. The spread and evolution of virus genomes can be visualised at nextstrain.org using auspice. By taking the advantage of this tool, in this work the evolution of SARS-CoV-2 genomes is visualised by creating the metadata in our HPC environment. The evolution of 10664 SARS-CoV-2 genomes is shown in Figure 8A. As can be visualised from the figure, there are five major clades of SARS-CoV-2: 19A: China/Thailand, 19B: China, 20A: USA, Belgium, India, 20B: UK, Belgium, Sweden and 20C: USA. Separate clades identify different genetic groupings. For example, 20A and 20B, respectively, have India and England as primary countries, thereby supporting the earlier statistics that India and England do not share many common mutation points among them. To show the spread of SARS-CoV-2, phylogeographic spread and the transmission lines are shown in Figure 8B and C, respectively.
Figure 8.
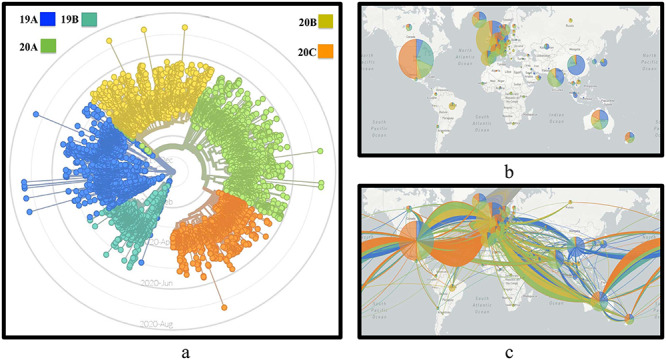
(A) Phylogenetic tree to show the evolution of SARS-CoV-2 genomes, (B) phylogeographic spread of SARS-CoV-2 genomes, (C) transmission of SARS-CoV-2 genomes in 73 countries.
Also, a web application is developed to help other researchers to explore all the mutation points. Although some target genes have already been discovered to detect SARS-CoV-2, new target locations can be further helpful in this task as the virus is evolving. In this regard, NSP6 is a new target gene that has not been considered before. Thereafter, the conserved region as target that belongs to ORF1ab coding region, specifically to the NSP6 gene, is subsequently used to identify primers and probes for the detection of SARS-CoV-2. Therefore, the target region of NSP6 gene can be considered as a confirmatory assay.
It is worth mentioning the reason for using ClustalO in this work, though there are other techniques as well for MSA like ClustalW, MUSCLE and MAFFT. As we have already mentioned, ClustalO has high speed and accuracy making it a highly likely candidate for MSA. Now, when executed in HPC cluster environment, ClustalO provided alignment results of 10 664 sequences near about in one month, while the other techniques were unable to provide results due to overflow of memory. Thus, for the timely publication of this research work, we have proceeded with the alignment results of ClustalO. It is also to be noted that the online MSA tool EMBL-EBI [37] uses ClustalO and has discontinued the use of ClustalW. However, even this tool can align only up to 4000 sequences. Hence, for the 10 664 virus sequences we have used our HPC cluster environment to get the alignment results. This alignment result is provided in the supplementary website so that research community can get the benefit out of this. Therefore, apart from the four major contributions as mentioned in this article, this can also be considered as an additional contribution.
5 Conclusion
This work has four major contributions. Initially, we have analysed publicly available 10 664 complete or near-complete SARS-CoV-2 genomes of 73 countries around the globe in order to find unique mutation points as substitution, deletion and insertion as well as SNPs. This analysis has identified 7209, 11700, 119 and 53 as substitutions, deletions, insertions and SNPs globally, respectively. Next, mutation details are taken into consideration to find the unique mutations as substitutions, deletions, insertions and SNPs for individual countries with respect to other 72 countries. For example, in the case of India, unique 385, 867, 1 and 11 substitutions, deletions, insertions and SNPs are present while 458, 1343, 8 and 52 mutation points in such categories are common with other countries. Furthermore, SNPs are visualised using protein structures and to show the genetic diversity, phylogenetic analysis has been performed using Nextstrain. Moreover, to help researchers conduct further research, a web application is also provided for browsing through the mutation points globally and across 73 countries individually. Finally, a conserved region is identified as target that belongs to ORF1ab coding region, specifically to the NSP6 gene that provided 10 primers and probes for SARS-CoV-2 detection. It can also be studied for designing epitope-based synthetic vaccine in future research. Additionally, the multiple sequence alignment result of ClustalO, which was executed on an HPC facility, is also shared in the supplementary website to help the research community.
Key Points
This study performs genome-wide analysis of 10 664 SARS-CoV-2 genomes around the globe.
Genetic mutation has been found as substitution, deletion, insertion and SNP.
Unique mutations for individual countries have been identified.
Virus genomes are collected from GISAID database.
Web application is provided for finding mutation points in SARS-CoV-2 genomes.
NSP6 as target is identified and provide primers and probes for virus detection.
Supplementary Material
Acknowledgments
We thank all those who have contributed sequences to GISAID and NCBI databases.
Indrajit Saha Dr Saha is a faculty member in the Department of Computer Science and Engineering, NITTTR, Kolkata, India. His research interest includes computational intelligence, computational biology, machine learning, image processing and pattern recognition.
Nimisha Ghosh Dr Ghosh is a faculty member in the Department of Computer Science and Information Technology, ITER, Bhubaneswar, India. Her research interest includes computational intelligence, computational biology, machine learning, wireless sensor network and internet of things.
Ayan Pradhan Mr Pradhan is a faculty member in the Department of Computer Science and Engineering, Techno India University, Kolkata, India. His research interest includes optimization techniques, machine learning, artificial intelligence and data science.
Nikhil Sharma Mr Sharma is currently pursuing his B. Tech in the Department of Electronics and Communication Engineering, Jaypee Institute of Information Technology, Noida, India. His research interest includes computational biology and machine learning.
Debasree Maity Ms Maity is a faculty member in the Department of Electronics and Communication Engineering, MCKV Institute of Engineering, Howrah, India. Her research interest includes radiogenomics, population genetics and biosensor.
Kaushik Mitra Dr Mitra is presently working as an Associate Professor in the Department of Community Medicine, Burdwan Medical College, India. His area of expertise includes non-communicable diseases like diabetes, hypertension, cardiovascular diseases and cancers.
Contributor Information
Indrajit Saha, Department of Computer Science and Engineering, National Institute of Technical Teachers’ Training and Research, Kolkata, West Bengal, India.
Nimisha Ghosh, Department of Computer Science and Information Technology, Institute of Technical Education and Research, Siksha ‘O’ Anusandhan (Deemed to be University), Bhubaneswar, Odisha, India.
Ayan Pradhan, Department of Computer Science and Engineering, Techno India University, West Bengal, India.
Nikhil Sharma, Department of Electronics and Communication Engineering, Jaypee Institute of Information Technology, Noida, Uttar Pradesh, India.
Debasree Maity, Department of Electronics and Communication Engineering, MCKV Institute of Engineering, Howrah, West Bengal, India.
Kaushik Mitra, Department of Community Medicine, Burdwan Medical College, Barddhaman, West Bengal, India.
7 Ethics approval and consent to participate
The ethical approval or individual consent was not applicable.
8 Availability of data and materials
The aligned 10664 SARS-CoV-2 genomes with reference and consensus sequences, software to find mutation and supplementary are available at ‘http://www.nitttrkol.ac.in/indrajit/projects/COVID-Mutation-10K/’. Moreover, all the virus genomes used in this work are publicly available at GISAID database.
9 Consent for publication
Not applicable.
10 Competing interests
There is no competing interest.
11 Author contributions statement
I.S. is responsible for the following: conceptualization; data curation; supervision; funding acquisition; formal analysis; investigation; methodology; web development; project administration; resources; validation; visualization; writing—review and editing; writing—review and editing. N.G. is responsible for the following: conceptualization; formal analysis; software; validation; visualization; writing—original draft. A.P. is responsible for the following: methodology; web development; writing—review and editing. N.S. is responsible for the following: methodology; web development; writing—review and editing. D.M. is responsible for the following: conceptualization; data curation; methodology; writing—review and editing. K.M. is responsible for the following: conceptualization; methodology; writing—review and editing.
Funding
Short-term Core Research Grant (CRG) on COVID-19 (CVD/2020/000991) from Science and Engineering Research Board, Department of Science and Technology, Govt. of India.
References
- 1. Zhu N, Zhang D, Wang W, et al. A novel coronavirus from patients with pneumonia in China, 2019. N Engl J Med 2020; 382(8): 727–33. [DOI] [PMC free article] [PubMed] [Google Scholar]
- 2. Zhou R, Li F, Chen F, et al. Viral dynamics in asymptomatic patients with covid-19. Int J Infect Dis 2020; 96:228–90. [DOI] [PMC free article] [PubMed] [Google Scholar]
- 3. Block P, Hoffman M, Raabe IJ, et al. Social network-based distancing strategies to flatten the covid-19 curve in a post-lockdown world. Nat Hum Behav 2020; 4:588–96. [DOI] [PubMed] [Google Scholar]
- 4.Worldometer. Coronavirus disease 2019 (covid-19) cases in India. https://www.worldometers.info/coronavirus/country/india/, 2020. (24 December 2020, date last accessed).
- 5. Zhou P, Yang XL, Wang XG, et al. A pneumonia outbreak associated with a new coronavirus of probable bat origin. Nature 2020; 579:270–3. [DOI] [PMC free article] [PubMed] [Google Scholar]
- 6. Gordon DE, Jang GM, Bouhaddou M, et al. A sars-cov-2 protein interaction map reveals targets for drug repurposing. Nature 2020; 583:459–68. [DOI] [PMC free article] [PubMed] [Google Scholar]
- 7. Lu I-N, Muller CP, He FQ. Applying next-generation sequencing to unravel the mutational landscape in viral quasispecies. Virus Res 2020; 283:197963. [DOI] [PMC free article] [PubMed] [Google Scholar]
- 8. Yin C. Genotyping coronavirus sars-cov-2: methods and implications. Genomics 2020; 112(5): 3588–96. [DOI] [PMC free article] [PubMed] [Google Scholar]
- 9. Sk S, Hassan PP, Choudhury PB, et al. Molecular conservation and differential mutation on orf3a gene in Indian sars-cov2 genomes. Genomics 2020; 112(5): 3226–37. [DOI] [PMC free article] [PubMed] [Google Scholar]
- 10. Poland GA. Tortoises, hares, and vaccines: a cautionary note for SARS-CoV-2 vaccine development. Vaccine 2020; 38:4219–20. [DOI] [PMC free article] [PubMed] [Google Scholar]
- 11. Hassan SS, Choudhury PP, Roy B. Sars-cov2 envelope protein: non-synonymous mutations and its consequences. Genomics 2020; 112(6): 3890–2. [DOI] [PMC free article] [PubMed] [Google Scholar]
- 12. Phan T. Genetic diversity and evolution of SARS-CoV-2. Infect Genet Evol 2020; 81:104260. [DOI] [PMC free article] [PubMed] [Google Scholar]
- 13. Khailany RA, Safdar M, Ozaslan M. Genomic characterization of a novel sars-cov-2. Gene Reports 2020; 19:100682. [DOI] [PMC free article] [PubMed] [Google Scholar]
- 14. Vankadari N. Overwhelming mutations or snps of sars-cov-2: a point of caution. Gene 2020; 752:144792. [DOI] [PMC free article] [PubMed] [Google Scholar]
- 15. Bajaj A, Purohit HJ. Understanding sars-cov-2: genetic diversity, transmission and cure in human. Indian J Microbiol 2020; 60:398–401. [DOI] [PMC free article] [PubMed] [Google Scholar]
- 16. van Dorp L, Acman M, Richard D, et al. Emergence of genomic diversity and recurrent mutations in sars-cov-2. Infect Genet Evol 2020; 83:104351. [DOI] [PMC free article] [PubMed] [Google Scholar]
- 17. Saha I, Ghosh N, Maity D, et al. Genome-wide analysis of Indian sars-cov-2 genomes for the identification of genetic mutation and snp. Infect Genet Evol 2020;104457. [DOI] [PMC free article] [PubMed] [Google Scholar]
- 18. Pavlovic-Lazetic GM, Mitic NS, Beljanski, MV. Bioinformatics analysis of sars coronavirus genome polymorphism. BMC Bioinform 2004; 65. [DOI] [PMC free article] [PubMed] [Google Scholar]
- 19. Tran T, Kostecki R, Catton M, et al. Utility of a stressed single nucleotide polymorphism (SNP) real-time pcr assay for rapid identification of measles vaccine strains in patient samples. J Clin Microbiol 2018; 56. [DOI] [PMC free article] [PubMed] [Google Scholar]
- 20. Paital B, Das K, Parida SK. Inter nation social lockdown versus medical care against covid-19, a mild environmental insight with special reference to India. Sci Total Environ 2020; 728. [DOI] [PMC free article] [PubMed] [Google Scholar]
- 21. Ovsyannikova IG, Kennedy RB, O’Byrne M, et al. Genome-wide association study of antibody response to smallpox vaccine. Vaccine 2012; 30(28): 4182–9. [DOI] [PMC free article] [PubMed] [Google Scholar]
- 22. Shiraiwa K, Ogawa Y, Eguchi M, et al. Development of an snp-based pcr assay for rapid differentiation of a Japanese live vaccine strain from field isolates of erysipelothrix rhusiopathiae. Journal of Microbiological Methods, 2015; 117:11–3. [DOI] [PubMed] [Google Scholar]
- 23. Chothe SK, Sebastian A, Thomas A, et al. Whole-genome sequence analysis reveals unique snp profiles to distinguish vaccine and wild-type strains of bovine herpesvirus-1 (bohv-1). Virology 2018; 522:27–36. [DOI] [PubMed] [Google Scholar]
- 24. Jeon JS, Won YH, Kim IK, et al. Analysis of single nucleotide polymorphism among varicella-zoster virus and identification of vaccine-specific sites. Virology 2016; 496:277–86. [DOI] [PubMed] [Google Scholar]
- 25. Corman VM, Landt O, Kaiser M, et al. Detection of 2019 novel coronavirus (2019-ncov) by real-time rt-pcr. Eurosurveillance, 2020; 25(3): 2000045. [DOI] [PMC free article] [PubMed] [Google Scholar]
- 26. Kamali Kakhki R, Kamali Kakhki M, Neshani A. Covid-19 target: a specific target for novel coronavirus detection. Gene Rep 2020; 20:100740. [DOI] [PMC free article] [PubMed] [Google Scholar]
- 27. Wallace IM, Blackshields G, Higgins DG. Multiple sequence alignments. Curr Opin Struct Biol 2005; 15(3): 261–6. [DOI] [PubMed] [Google Scholar]
- 28. Sievers F, Wilm A, Dineen D, et al. Fast, scalable generation of high-quality protein multiple sequence alignments using clustal omega. Mol Syst Biol 2011; 7:539. [DOI] [PMC free article] [PubMed] [Google Scholar]
- 29. Sievers F, Higgins DG. Clustal Omega, accurate alignment of very large numbers of sequences. Methods Mol Biol 2014; 1079:105–16. [DOI] [PubMed] [Google Scholar]
- 30. Chatzou M, Magis C, Chang JMet al. Multiple sequence alignment modeling: methods and applications. Briefings in Bioinformatics, 2015; 17(6): 1009–23, 11. [DOI] [PubMed] [Google Scholar]
- 31. Zheng W, Li Y, Zhang C, et al. Deep-learning contact-map guided protein structure prediction in casp13. Proteins 2019; 87(12): 1149–64. [DOI] [PMC free article] [PubMed] [Google Scholar]
- 32. Grifoni A, Weiskopf D, Ramirez S, et al. Targets of t cell responses to sars-cov-2 coronavirus in humans with covid-19 disease and unexposed individuals. Cell 2020; 181(05). [DOI] [PMC free article] [PubMed] [Google Scholar]
- 33. Hou YJ, Okuda K, Edwards CE, et al. Sars-cov-2 reverse genetics reveals a variable infection gradient in the respiratory tract. Cell 2020; 182(2): 429–446.e14. [DOI] [PMC free article] [PubMed] [Google Scholar]
- 34. Plante JA, Liu Y, Liu J, et al. Spike mutation d614g alters sars-cov-2 fitness. Nature, 2020. [DOI] [PMC free article] [PubMed] [Google Scholar]
- 35. Hadfield J, Megill C, Bell SM, et al. Nextstrain: real-time tracking of pathogen evolution. Bioinformatics 2018; 34(23): 4121–3. [DOI] [PMC free article] [PubMed] [Google Scholar]
- 36. Volz EM, Koelle K, Bedford T. Viral phylodynamics. PLoS Comput Biol 2013; 9(3):e1002947. [DOI] [PMC free article] [PubMed] [Google Scholar]
- 37. Madeira F, Park YM, Lee J, et al. The embl-ebi search and sequence analysis tools apis in 2019. Nucleic Acids Res 2019; 47(W1): W636–41. [DOI] [PMC free article] [PubMed] [Google Scholar]
Associated Data
This section collects any data citations, data availability statements, or supplementary materials included in this article.
Supplementary Materials
Data Availability Statement
The aligned 10664 SARS-CoV-2 genomes with reference and consensus sequences, software to find mutation and supplementary are available at ‘http://www.nitttrkol.ac.in/indrajit/projects/COVID-Mutation-10K/’. Moreover, all the virus genomes used in this work are publicly available at GISAID database.