Abstract
The study aims to examine the CO2 emissions by considering the implication of COVID-19 under strict lockdown in India. The nonlinear (asymmetric) relationship is investigated between CO2 emission and COVID-19 with its specific determinants. The positive and negative asymmetries of COVID-19 determinants are also captured by using econometric techniques. The daily data series of CO2 emission, new confirmed cases, confirmed deaths, and lockdown as dummy variables from January 30, 2020, to December 1, 2020, for India is analyzed by employing the nonlinear autoregressive distributed lag model. This research revealed a significant nonlinear relationship between CO2 emission and COVID-19. The bound test and asymmetric coefficients are confirmed by the variables' long- and short-run relationships. The dynamic multiplier graphs present that India's strict lockdown due to the rapid increase in COVID-19 patients significantly reduces toxic gas emissions, especially CO2 emissions. This asymmetric relationship has been proficiently declared that unhealthy public routine, extra traffic, and unhygienic gases released in the air become the reason for environmental destruction. The lockdown is practically imposed for specific periods and reasons, contributing to reducing toxic emissions, but it is not a permanent solution for environmental sustainability. The government of India, policymakers, and environmentalists should make people aware of unhealthy and environmentally envying activities and policies and long-term applicable strategies should be designed to upgrade the environment's quality.
Keywords: CO2 emission, Sustainable Development, Lockdown, COVID-19, NARDL
Introduction
Human history is riddled with infectious diseases that left thousands of people dead from the start. Global pandemics have always caused issues to human lives and the global environment. Researchers believe that pandemics' probabilities have been dramatically amplified over the past century, mainly due to greater exploitation of the natural environment, urbanization, improved global travel and integration, and land-use changes (Jones, Patel & Levy, 2008). These trends will keep on getting intensify with each passing day. In the early 2000s, when SARS (severe acute respiratory syndrome) was started spreading worldwide, the World Health Organization (WHO) issued a warning of massive damage to the whole world (Madhav & Wolfe, 2017).
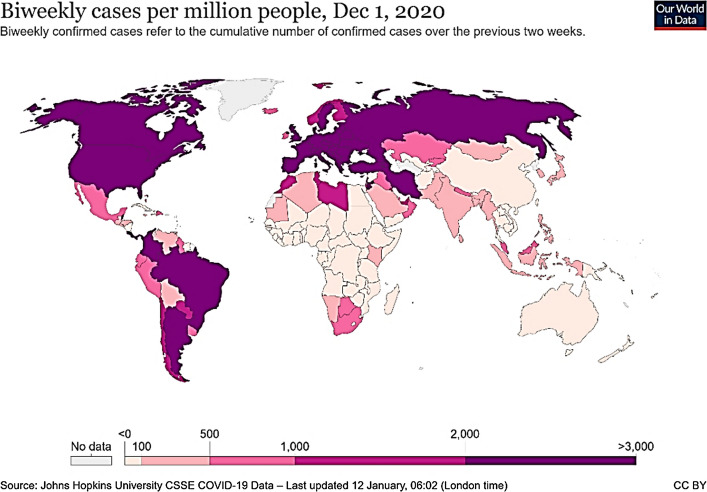
No doubt, the world has suffered pandemics throughout history, and they keep on appearing with higher frequency each time. The world is currently dealing with another great pandemic of the century that is COVID 19. Coronavirus is a highly contagious virus in Wuhan, China, in December 2019 (Haleem & Javaid, 2020). From China, it has spread all across the world. Millions of people have lost the battle of their lives against this deadly virus. COVID-19 has rapidly affected our daily life and business activities. It has caused restricted movements and disrupted supply chain activities worldwide. Most businesses face lower or no sales, reducing manufacturing activities. COVID-19 has also greatly influenced the global environment. Figure 1 shows biweekly CPVID-19 cases per million people.
Fig. 1.
Biweekly COVID-19 daily-confirmed cases
Since the last few decades, the world has experienced a tremendous environmental pollution increase. Despite the enormous efforts, environmental pollution is a significant issue and poses a continuing risk to human lives. In the current global environment, where business activities are increasing, environmental pollution is also going upward at a higher pace. Most researchers believe that environmental pollution is a source of various diseases and affects human health by increasing exposure to different diseases (Kelishadi, 2012). Undoubtedly, this problem is most significant in developing countries. The traditional sources of pollution are still in processes, such as contaminated water supply, inadequate waste management, poor sanitation, and high exposure to indoor air pollution (Kumar, Taxak, et al., 2021). Pollution is directly correlated with the population. According to the United Nations (2019), the world population may rise to 11 billion by 2100, which will cause the environmental population.
Environmental pollution has reached to troublesome amount all over the world. Economic development, industrialization, and urbanization have caused an increase in greenhouse emissions (Kumar & Sharma, 2017; Kumar, Thanki, et al., 2021; Sharma et al., 2020; Tobías et al., 2020; Wang, Chen, et al., 2020; Wang, Zhang, et al., 2020). Thus, carbon dioxide and other toxic gases are released into the atmosphere polluting the air and increasing its temperature. This has become the reason for the depletion of the ozone layer, which significantly affects the daily lives of the people (Edwards, 2018).
Undoubtedly, the novel coronavirus has caused worldwide disruptions that affected the environment and the climate. A significant decrease in travel activities due to lockdowns has dropped air pollution considerably. According to recent research, China has experienced a 25% and 50% decrease in carbon emissions and nitrogen oxides, respectively, since the pandemic (Myllyvirta, 2020). A scientist estimated that it might save at least 77,000 lives over two months. Almost every country has implemented lockdowns to reduce coronavirus spread, which reduced industrial activities and transportation services. This has dramatically brought down the worldwide pollution level. The European Space Agency observed a significant decline in nitrous emissions from factories, power plants, and cars in Northern Italy, mainly due to strict curfew in the region (Green, 2020).
The European Space Agency (ESA) and the National Aeronautics and Space Administration (NASA) have been closely monitoring the ozone layer in the current pandemic. According to them, the decrease in nitrogen oxide started in Wuhan, China, and then slowly spread throughout the world drastically (Zhang & Zhang, 2020). No doubt, COVID-19 has caused havoc to the whole world. However, it is also considered a “Blessing in Disguise,” as nature is reclaiming itself. Poor quality is harmful to the entire population. Around 4.6 million people die every year due to poor quality worldwide. Air pollution is a huge problem, and its effects are visible to the developed nations. In 2012, around 193,000 people died in Europe due to air pollution (Brauer & Burnett, 2017).
COVID-19 in India
Like any other country, India has also experienced a sudden decrease in carbon emission and environmental pollution due to lockdown implementation since March 2020 (Gautam et al., 2020). Delhi, India's capital is considered one of the most polluted megacities of the whole world. A report was issued by the World Health Organization in 2018, in which Delhi ranked high in the list of most polluted cities of the world (United Nations, 2018). Mumbai and Delhi, the megacities, are experiencing PM 2.5 concentrations for the last several years, far above tolerable limits, defined by NAAQS (National Ambient Air Quality Standards). The increased air pollution has become the source of various health issues, including acute asthma, pneumonia, respiratory disorders, etc. (Chakraborty & Maity, 2020; Rizou et al., 2020; SanJuan-Reyes et al., 2020). In 2017, owing to increased air pollution, the Indian Council of Medical Research (ICMR) has declared a community health emergency in Delhi (Verma & Prakash, 2020; Lokhandwala & Gautam, 2020; Wang & Su, 2020; Amdade et al., 2021; Gautam et al., 2020, 2021). India's bad air quality is a key reason for premature deaths (Dandona & Shukla, 2017).
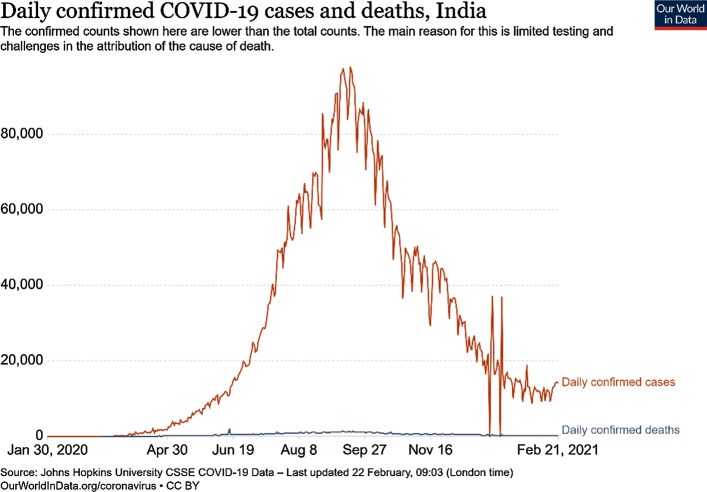
To minimize coronavirus spread, the Indian government implemented a nationwide lockdown from March 24 for three weeks, and later, it further extended. The government has also banned all kinds of industrial activities and mass transportations all over the country. Resultantly, Sharma et al. (2020) stated pollution level had been significantly decreased in 88 cities of India, only after four days of commencing the lockdown event. The nitrogen oxide level has also dropped to 90 µmol/m2 in March 2020 in Delhi, 158 µmol/m2 in March 2019. Mumbai further dropped to 77 µmol/m2, 122 µmol/m2 last year (Poetzscher, 2020). The coronavirus has caused disruptions in India, but it has proved a “blessing in disguise” for minimizing the country’s environment and air pollution (Eroğlu, 2020; Shakil et al., 2020; Wilder-Smith & Freedman, 2020). Figure 2 represents daily COVID-19-confirmed cases and deaths in India from January 30, 2020, to February 21, 2021.
Fig. 2.
Daily confirmed cases and deaths in India
The current study aims to analyze the effect of carbon emission on sustainable development during COVID-19. As per the rules and regulations of lockdown, all types of human activities were banned, and India's people were restricted from living in their homes. The daily pausing activities reduce transportation emissions, and the businesses do not contribute to pollution and emission of toxic gases during the lockdown. Purposely, this research analyses the relationship between lockdown and carbon dioxide emission and the nature and direction of relation to its long-run relationship or short-run relationship.
Literature review
The coronavirus outbreak restricted almost all avoidable activities in China and worldwide since the first call of lockdown in Wuhan on January 23, 2020. The transmission rate of SARS-COVID-2 is comparatively high compared to its predecessors (Bherwani, Anjum, et al., 2020). By employing the Community Multi-Scale Air Quality (CMAQ) model with monthly anthropogenic emission data of China, it is observed that the concentration of PM2.5 decreased almost 20% in Guangzhou, Shanghai, Beijing, Shijiazhuang, Tianjin, Jinan, Taiyuan, Xi’an, Zhengzhou, and Wuhan. It is observed that the meteorology was unfavorable during the simulation episode. The PM2.5 emission’s concentration is reduced ~ 2 times in lockdown. A large emission reduction is observed in transportation and slight emission reduction in the industrial sector due to working being stopped in the industrial sector. Still, it does not decrease the pollution of China prominently. The pandemic and lockdown are imposed on all countries for a specific time and specific reason, so it is not applicable for reducing pollution. For avoiding severe air pollution, more efforts should be made to complete the task of environmental sustainability (Ambade et al., 2021; Bherwani, Nair, et al., 2020; Srivastava et al., 2020; Wang, Chen, et al., 2020; Wang, Zhang, et al., 2020). To control the rapidly increasing affected cases and death rate, the major strategies in clinical trials, medications, vaccinations, and social distancing for social and individual protection were designed by individual countries and the World Health Organization (WHO) (Gautam & Hens, 2020).
The morbidity and mortality are being increased due to air pollution, and the rate of it is rapidly increased year by year. Air pollution leads to health risks and environmental degradation by acid rains and reduced visibility. The rise in obstructive pulmonary disease (COPD), cardiovascular disease, and respiratory ailments like asthma and chronic bronchitis are just because of poor air quality management. As we know that the COVID-19 outbreak abruptly stopped all human activities, so in these situations and circumstances, the air pollution showed a significant reduction in it. If the rate of newly affected cases of COVID-19 was increased, the causes of morbidity and mortality with air pollution were decreased. The National Aeronautics and Space Administration (NASA) and European Space Agency (ESA) released the data of healing environmental sustainability during strict lockdown during an outbreak of COVID-19. The reduction rate of pollution in some of the epicenters like Wuhan, Italy, Spain, and the USA has 30%, which increases the sustainability of the environment and quality of air (Muhammad et al., 2020). Bherwani, Anjum, et al. (2020) monetarily quantified the declining trend in health impact due to air pollution reduction during the lockdown. Utilizing two types of data, i.e., environmental-related data and monetized health impact data from 2019 to 2020 and capturing four cities—Delhi, London, Paris, and Wuhan, analyzed air pollution reduction. Undoubtedly, these four cities suffered from economic damages, but this research noted the comparative preventing air pollution reduction benefits due to lockdown. This research also provides a pathway to compare the magnitude of actual damage environmentally and the damage-related lockdown.
Gautam et al. (2020) used seven environmental pollutants, i.e., PM2.5, PM10, NO2, NH3, SO2, CO2, and O3, to calculate the Air Quality Index (AQI) from February 17, 2020, to May 4, 2020. In this research, Gautam et al. (2021) measured the variations of air quality of Delhi (DTU, Okhla, and Patparganj), Haryana (Jind, Palwal, and Hisar), and Uttar Pradesh (Agra, Kanpur, and Greater Noida) and data have been retrieved from the Central Pollution Control Board website. The Air Quality Index has upgraded 30–47% approximately during the lockdown. The air mass contribution and healing layers of O3 have been observed by the air mass back trajectory (AMBT) analysis in India and Europe, Africa, and Gulf countries during the lockdown. Gautam et al. (2021) revised the research by including extra air quality factors and upgraded the research direction's accuracy. This research captured the eight most polluted cities of India, i.e., Mumbai, Delhi, Bangalore, Hyderabad, Lucknow, Chandigarh, Kolkata, and Ahmedabad. The environmental sustainability behavior of these cities is checked during the COVID-19 lockdown. The significant reduction of environmental pollutants over Major Dhyan Chand Stadium has been observed as PM2.5 (63%), PM10 (56%), NO2 (50%), SO2 (9%), and CO (59%). In comparison, the PM2.5 (44%), PM10 (50%) decreased over Chhatrapati Shivaji International Airport in India's initial few weeks of strict lockdown.
The overall Air Quality Index (AQI) of Chandigarh and Ballygunge was dramatically upgraded from 7 to 67%. Divergent places of India's major cities were observed, and individual cities of crowded places showed the same results. Long-range transportation has occupied a large portion of toxic emissions. During the lockdown, the trade activities between Iran, Afghanistan, Saudi Arabia, Indian Gangetic plains, and Delhi Non-capital region were stopped. The results of the Hybrid Single-Particle Lagrangian Integrated Trajectory (HYSPLIT) analysis also confirmed the up-gradation of environmental quality during the lockdown. Bherwani, Nair, et al. (2020) analyzed India's data, especially the states of Maharashtra, Gujarat, Madhya Pradesh, Rajasthan, Tamil Nadu, West Bengal, Uttar Pradesh, and Delhi as a union territory on lockdown and social distancing policies by employing Bayesian probability model (BPM). The accuracy and positive resulting of lockdown were analyzed using the change point analysis (CPA), which confirmed the diminishing trend in newly reported cases and the death rate of COVID-19 patients. The delta values are between 9.6 and 4.7 for Gujarat and Madhya Pradesh and Maharashtra, respectively, At the same time, all states showed a strong significant correlation toward a different period of CPA and lockdown (cases per population (CPP) and cases per unit area (CPUA)). The weak correlation is observed by delta and cases per unit population density (CPD). Although the correlation is significant for CPP and CPUA, Pearson’s correlation confirmed a negative direction.
Methodology
Data description
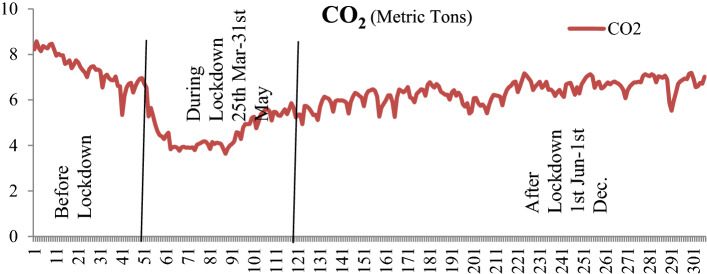
The daily data of deaths, covid-19-confirmed cases, and lockdown are utilized to analyze the impact of COVID-19 on CO2 emission. This research comprises data from January 31, 2020, to December 1, 2020. The data series is divided into three parts: pre-lockdown, during the lockdown, and post-lockdown (Mohsin, Naiwen, et al., 2020; Mohsin, Naseem, et al., 2020). In India, the first confirmed COVID-19 case was reported on January 30, 2020. Under India's pandemic government, the global and domestic adverse spreading situation announced a strict lockdown on March 25, 2020, and it was prolonged till May 31, 2020. The visual presentation of CO2 emission data from January 30, 2020, to December 1, 2020, can be seen in Fig. 1. The daily data of confirmed cases and deaths are extracted from the World Health Organization (WHO). In contrast, the daily data of CO2 emission in India are obtained from carbon monitor (Asadi et al., 2020; Chakraborty & Ghosh, 2020; Guo et al., 2020).
The analysis is performed on the below-mentioned model:
| 1 |
The partial sum of positive and negative shocks in NC, ND, and LD is determined by employing the nonlinear autoregressive distributed lag (NARDL) method. Before exploring the primary model, the divergent test's data series have been checked for suitability of the NARDL method. The unsuitable data set can be misled due to fundamental analysis (Ouattara, 2004).
Unit root test
Unit root test is used to check the stationarity of data series. The augmented Dickey–Fuller (ADF) and Phillips–Perron (PP) tests are employed to inspect the unit root.
| 2 |
| 3 |
The equation-2 is ADF, and equation-2 PP test equation for unit root to check the data series's stationarity. These equations represent the first difference operator, and shows a high order of autocorrelation concerning time. The endogenous variables are presented as . The is the error term in both tests of equation-2 and equation-3 (Fig. 3).
Fig. 3.
CO2 emission in India during pandemic (COVID-19)
Standard nonlinear autoregressive distributed lag (NARDL) model
The nonlinear autoregressive distributed lag (NARDL) model is introduced by Shin et al. (2014). The standard ARDL model is restricted to check the linear relationship between independent and dependent variables, while some are nonlinearly related (Hu et al., 2018; Shahzad et al., 2017). The nonlinear ARDL model is covered with negative and positive changes of variables. The in the following equation of the NARDL model shows the decomposition into a partial sum of positive and negative changes as:
| 4 |
The following equation can be used to examine the asymmetric long-run equilibrium relationship:
| 5 |
In equation-3, the parameter and are asymmetric long-run parameters which accordingly related to positive and negative variations in . The combination of equation-4 and equation-5 with the ARDL model generates the following NARDL model:
| 6 |
The equation-6 consists of two parts: the short-run asymmetry is tested by while the long-run asymmetry determined by (i.e.,
The nonlinear ARDL model is formulated for this study as:
| 7 |
where represents the CO2 emission of India in the COVID-19 era at time , the partial sum of positive and negative changes in new confirmed cases of COVID-19 represented by and respectively, at time . The newly confirmed death is shown as and and the positive partial sum and negative partial sum of lockdown are presented as and with time . The lockdown is used as a dummy variable in this analysis (Barati & Fariditavana, 2020; Bahmani‐Oskooee & Saha, 2017). The dummy variable is justified in assigning the binary number; 1 is assigned to the lockdown period and 0 for the unlocked period. The error term is presented as . The NARDL model can only be employed in variables integration at the order I(0) or I(1). The NARDL model is not suitable if the variables are integrated into two I(2) (Greenwood-Nimmo & Shin, 2013; Shin et al., 2014). Using the ADF and PP test, the PP test applies a nonparametric correction to the standard ADF test statistics. More general dependence in error and conditional heteroskedasticity is also checked. Both tests are used to check the stationarity of the series.
Results and discussion
The summary statistics of CO2 emission, newly confirmed cases, and newly confirmed deaths are presented in Table 1. The mean of CO2 emission (6.127) is lower than NC (30,924.210) and ND (449.745). The maximum and minimum values of variables present a clear picture of the relationship between CO2 emission and COVID-19. The maximum value of the CO2 emission is 8.580, and the minimum value is 3.630. The 4.950 metric tones reduction in CO2 emission is observed in India during COVID-19, while an increasing trend is observed in new confirmed cases and newly confirmed deaths. The drastic increase in the standard deviation of NC (30,921.330) and ND (405.705) is shown. The value of standard deviation variation of CO2 emission is 1.057. The latest confirmed cases and newly confirmed deaths show positive skewness, while CO2 emission is negatively skewed. The kurtosis value of all variables is significant at a 1% level of significance, and more than three, which means data are not normally distributed (Mohsin, Naiwen, et al., 2020; Mohsin, Naseem, et al., 2020; González et al., 2020; Shehzad et al., 2020; Hashmi et al., 2020).
Table 1.
Descriptive statistics
| CO2 | NC | ND | |
|---|---|---|---|
| Mean | 6.127 | 30,924.210 | 449.745 |
| Median | 6.320 | 19,682.500 | 438.500 |
| Maximum | 8.580 | 97,894.000 | 2003.000 |
| Minimum | 3.630 | 0.000 | 0.000 |
| Std. Dev | 1.057 | 30,921.330 | 405.705 |
| Skewness | −0.465 | 0.556 | 0.513 |
| Kurtosis | 2.996 | 1.929 | 2.328 |
| Jarque–Bera | 11.041* | 30.416* | 19.182* |
| Probability | 0.004 | 0.000 | 0.000 |
| Observations | 306 | 306 | 306 |
*, **, and *** represent 1%, 5%, and 10% level of significance, respectively
The data series's stationarity is checked by performing two unit root tests, i.e., the augmented Dickey–Fuller (ADF) and Phillips–Perron (PP) test. The unit root test results are presented in Table 2, which shows that all variables are stationary at first difference. There are two terms to show cointegration I(0) for non-stationary series and I(1) for stationary data series. The data series's stationarity confirms the data fit for the cointegration process in the NARDL framework.
Table 2.
Unit root test
| Variables | ADF | PP | Order of cointegration | ||
|---|---|---|---|---|---|
| Level | First difference | Level | First difference | ||
| CO2 | −2.28218 | −9.979* | −2.434 | −19.523* | I(1) |
| 0.1785 | 0.000 | 0.133 | 0.000 | ||
| NC | −1.02597 | −14.215* | −1.366 | −19.177* | I(1) |
| 0.7447 | 0.000 | 0.599 | 0.000 | ||
| ND | −1.31653 | −13.303* | −2.554 | −49.982* | I(1) |
| 0.6226 | 0.000 | 0.104 | 0.000 | ||
| LD | −1.71519 | −7.668* | −1.724 | −17.378* | I(1) |
| 0.4226 | 0.000 | 0.418 | 0.000 | ||
*, **, and *** represent 1%, 5%, and 10% level of significance, respectively
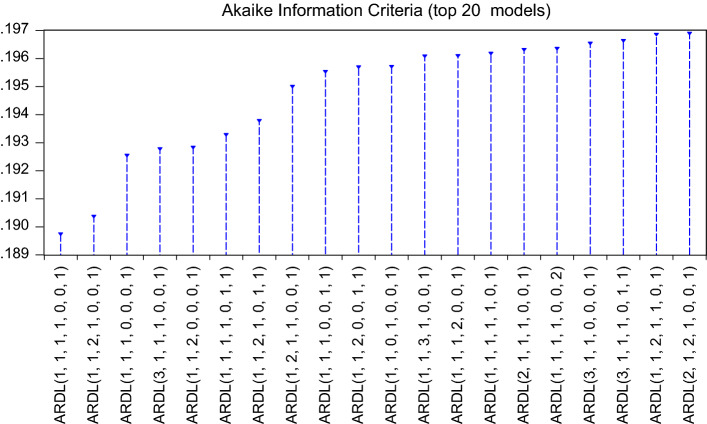
The results of the bound test for cointegration are displayed in Table 3. The F-statistics value (3.993) is larger than the upper critical value (3.99) at a 1% level of significance. The automatic lag specification of the NARDL model is 1, 1, 1, 1, 0, 0, 1, which is selected based on the Akaike information criterion (AIC) (Mohsin, Naiwen, et al., 2020; Mohsin, Naseem, et al., 2020; Zhang et al., 2017; Shah et al., 2020). The model specification with AIC-based lag length is presented in Fig. 4. It vehemently rejects the null hypothesis of no cointegration (F-statistics < lower bound critical value). F-statistics significance at a 1% level confirms the cointegration occurrence for a long-run relationship between CO2 emission and COVID-19 with its determinants (Katrakilidis & Trachanas, 2012; Sarfraz et al., 2018, 2020; Zhang et al., 2017).
Table 3.
The result of bound tests for cointegration test
| 10% | 5% | 2.50% | 1% | |||||
|---|---|---|---|---|---|---|---|---|
| F-statistics | I(0) | I(1) | I(0) | I(1) | I(0) | I(1) | I(0) | I(1) |
| 3.993 | 1.99 | 2.94 | 2.27 | 3.28 | 2.55 | 3.61 | 2.88 | 3.99 |
Fig. 4.
AIC top 20 models
After confirming the long-run cointegration relationship between CO2 emission and COVID-19 (new confirmed cases, new confirmed deaths, and lockdown), the next step particularly determined the long-run or short-run asymmetry from the primary model (7). The long-run dynamic asymmetry estimation results are presented in Table 4. The long-run coefficient of CO2 emission (0.87225) is positively significant at a 1% level of significance. As per the results, we can say that a 1% increase in COVID-19 with its determinants becomes the reason for an 87.225% decrease in CO2 emission. The NC+ (−1), NC−, LD+, LD−, and LD− (−1) are significant at 1% level, while NC+ and ND− are significant at 10% and 5% level of significance. The NC− (−1), ND+, and ND+ (−1) demonstrate the positivity with insignificance.
Table 4.
Dynamic asymmetric estimation of CO2 emission
| Variable | Coefficient | Std. Error | t-Statistic | Prob |
|---|---|---|---|---|
| CO2(−1) | 0.87225* | 0.02977 | 29.29808 | 0.00000 |
| NC+ | 0.00001*** | 0.00001 | 1.83384 | 0.06770 |
| NC+ (−1) | −0.00002* | 0.00001 | −3.14186 | 0.00190 |
| NC− | −0.00002* | 0.00001 | −2.99747 | 0.00300 |
| NC− (−1) | 0.00001 | 0.00001 | 1.94004 | 0.05330 |
| ND+ | 0.00011 | 0.00015 | 0.72058 | 0.47170 |
| ND+ (−1) | 0.00061 | 0.00037 | 1.64726 | 0.10060 |
| ND− | 0.00070** | 0.00034 | 2.03899 | 0.04240 |
| LD+ | −0.31990* | 0.09516 | −3.36185 | 0.00090 |
| LD− | −0.79436* | 0.26400 | −3.00894 | 0.00290 |
| LD− (−1) | 0.75017* | 0.27074 | 2.77077 | 0.00600 |
| C | 0.86460* | 0.21884 | 3.95087 | 0.00010 |
*, **, and *** represent 1%, 5%, and 10% level of significance, respectively
The asymmetrically short- and long-run results are displayed in Tables 5 and 6. The recent confirmed case is significant at 5% with a positive sign and the negative new confirmed cases also significant at a 1% level. The new confirmed death positive is displayed in a table, which is positively insignificant. The lockdown coefficient shows negative significance at a 1% level for the short run. The ECT term confirms the long-run relationship between CO2 emission and COVID-19 with its determinants with its significance at 1% and the negative sign's assumption. The second half of Table 5 presents long-run asymmetric coefficients with their confirmation of significance or insignificance. The NC+ and NC− are significant at a 5% level of significance, while ND + and ND are significant at a 10% level of significance. The LD+ is significant at the 1% level, and LD− is insignificant. The significance of LD+ at 1% with value −2.5040 is explained by the nonlinear relationship between CO2 emission and lockdown. The CO2 emission decreases due to strict lockdown in India during pandemic spread (Azam et al., 2020; Mohsin, Naiwen, et al., 2020; Mohsin, Naseem, et al., 2020; Omoke et al., 2020). As per the graphical presentation, the CO2 emission started decreasing from the starting point of COVID-19 breakout because people stayed in their homes to avoid the risk of viruses. A rapid decrease in CO2 emission is observed after strict lockdown. All types of business and the flow of transport were stopped in strict lockdown, which becomes the reason for CO2 emission reduction in India. This research has covered three phases: pre-lockdown, during-lockdown, and post-lockdown. The adjusted assessment of asymmetry in the presented long-run equilibrium with positive and negative shocks is displayed in a dynamic multiplier graph (Figs. 5, 6, 7). The negative and positive CO2 emission shocks generate a linear mixture of dynamic multiplier asymmetric curves.
Table 5.
Result of asymmetric short run
| Variable | Coefficient | Std. error | t-Statistic | Prob |
|---|---|---|---|---|
| D() | 1.19E-05** | 5.14E-06 | 2.3208 | 0.0210 |
| D() | −2.36E-05* | 5.98E-06 | −3.9457 | 0.0001 |
| D() | 0.0001 | 0.0001 | 0.7603 | 0.4477 |
| D() | −0.7944* | 0.2577 | −3.0824 | 0.0022 |
| ECTt−1 | −0.1278* | 0.0223 | −5.7190 | 0.0000 |
Table 6.
Result of asymmetric long-run coefficients
| Variable | Coefficient | Std. Error | t-Statistic | Prob |
|---|---|---|---|---|
| −7.06E-05** | 3.41E-05 | -2.0711 | 0.0392 | |
| −7.42E-05** | 3.56E-05 | -2.0842 | 0.0380 | |
| 0.0056*** | 0.0029 | 1.9576 | 0.0512 | |
| 0.0055*** | 0.0029 | 1.8932 | 0.0593 | |
| −2.5040* | 0.3937 | −6.3594 | 0.0000 | |
| −0.3459 | 0.7250 | −0.4771 | 0.6337 | |
| C | 6.7677* | 0.3021 | 22.3990 | 0.0000 |
*, **, and *** represent 1%, 5%, and 10% level of significance, respectively
Fig. 5.
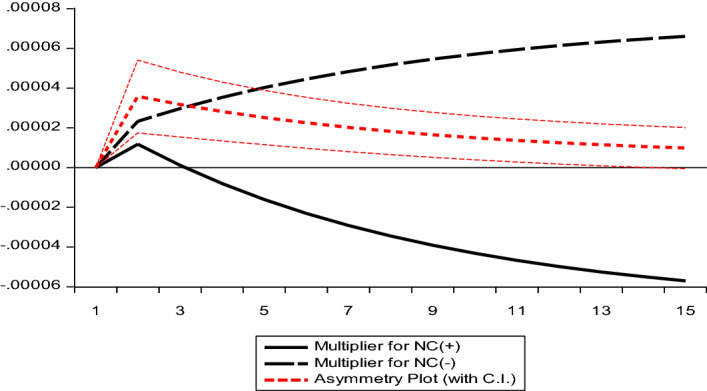
CO2 and NC dynamic multiplier
Fig. 6.
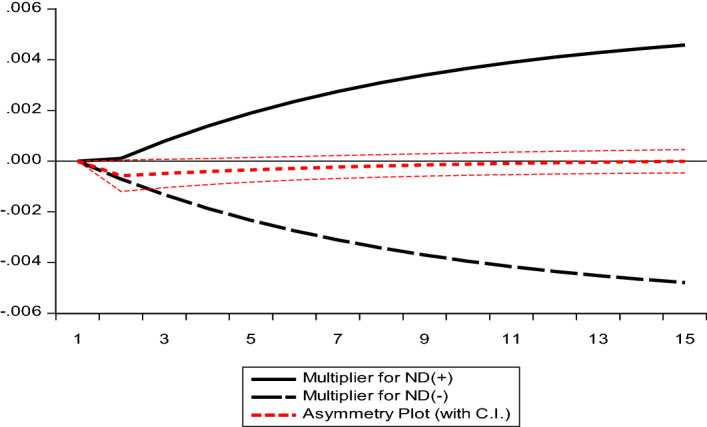
CO2 and ND dynamic multiplier
Fig. 7.
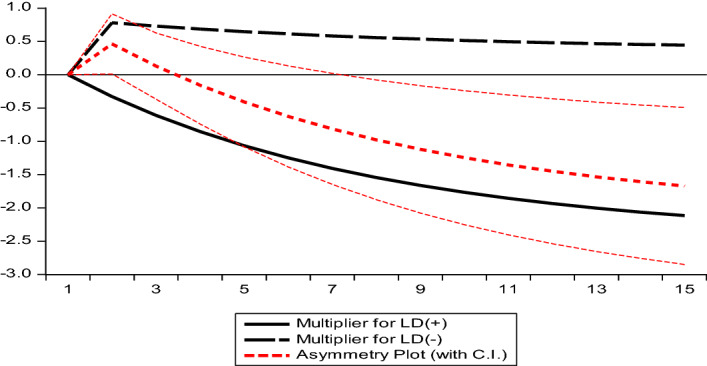
CO2 and LD dynamic multiplier
Table 7 contains the results of diagnostic tests. The value of Breusch–Godfrey is 1.301, which confirms the model is free from serial correlation. The insignificance of Jarque–Bera with 1.524, ARCH test with 1.734, and Ramsey RESET test with F-statistics value of 0.511 confirmed the normality, absence of heteroskedasticity, and correct specification of the model, respectively. The CUSUM and CUSUM square test shows the stability of the model. The CUSUM and CUSUM2 are visually presented in Figs. 8, 9, which shows the cumulative sum of recursive residuals and its square lies between critical bound 5% level of significance. The employed model is stable and trustworthy to determined short- and long-run relationship coefficients (Van & Bao, 2019).
Table 7.
Diagnostic test
| Test description | Problem | F-statistic | P-value | Decision |
|---|---|---|---|---|
| Breusch–Godfrey serial correlation LM test | Serial correlation | 1.301 | 0.273 | No serial correlation |
| Jarque–Bera | Normality | 1.524 | 0.354 | Residuals are normal distributed |
| Heteroskedasticity test: ARCH | Heteroskedasticity | 1.734 | 0.142 | No heteroskedasticity |
| Ramsey RESET test | Model specification | 0.511 | 0.475 | Model is stable |
| CUSUM | Stability | – | – | Model is stable |
| CUSUM-SQ | Stability | – | – |
Fig. 8.
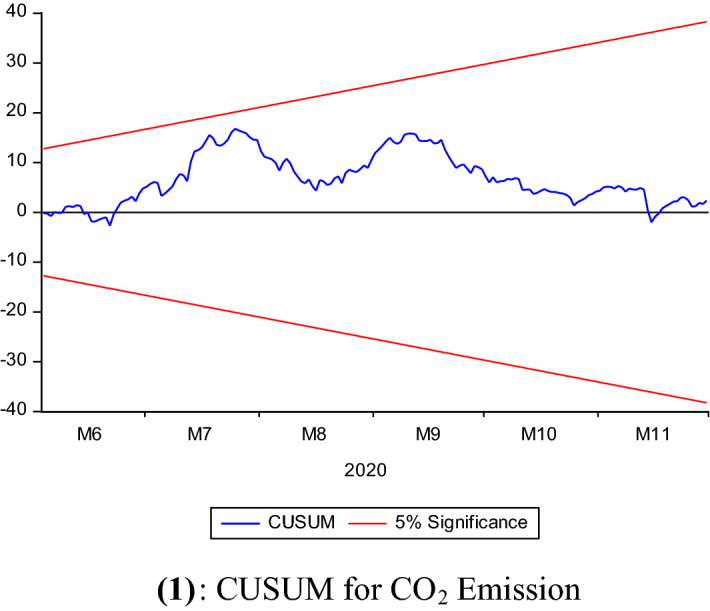
CUSUM for CO2 emission
Fig. 9.
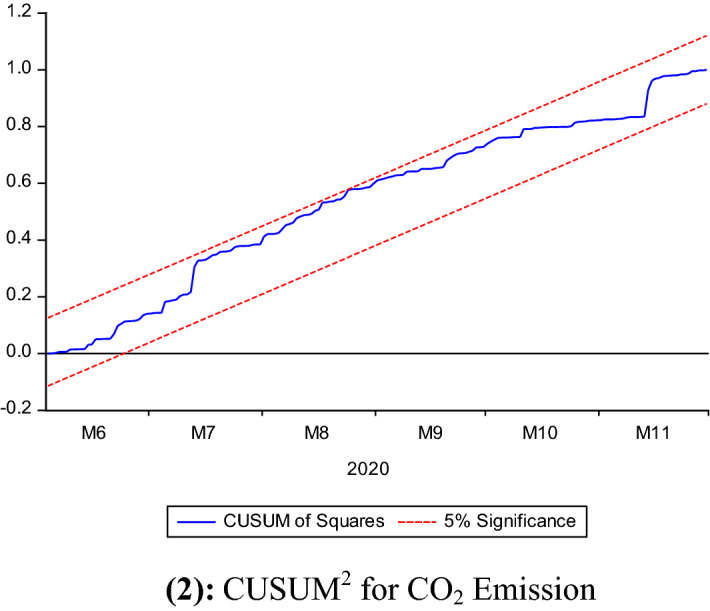
CUSUM2 for CO2 emission
Conclusion
Every field of life has been adversely shaken by spreading pandemic COVID-19, but it left some positive effect on environmental sustainability. The holes of ozone layers were healing in this pandemic era because of lockdowns worldwide. People were stuck in their homes and all types of businesses and transportations were closed, which reduced the emission of toxic gases in the air. This research focused on the relationship between CO2 emission and COVID-19 with its determinants. The asymmetric relationship among CO2 emission, newly confirmed cases, newly confirmed deaths, and lockdown in the COVID-19 era is observed by utilizing daily data from January 30, 2020, to December 1, 2020, for India. The nonlinear autoregressive distributed lag (NARDL) or asymmetric ARDL model is employed to check the long- and short-run relationship between variables. This model's constructive contribution is to simultaneously capture both short- and long-run relationships of variables with negative and positive nature of the relationship. The results of this research confirm the long-run relationship between CO2 emission and COVID-19 in India.
The CO2 emission is negatively influenced by strict lockdown in India. In India, the pandemic starts spreading on January 30, 2020. At the start of COVID-19 spreading, people individually took care to avoid the risk of being infected. Later on, the rapid increase in confirmed cases of COVID-19 patients and increasing death toll compel India's government for strict lockdown. On March 25, 2020, government of India announced a strict lockdown, which extended until May 31, 2020. From January 30, 2020 to March 25, 2020, a minor decrease in CO2 emission has been observed, but a sudden downward trend with a high rate observed after one day of strict lockdown in India. The unlocked situation again contributed to India's CO2 emission, but it is still below the starting value (30 January 2020) of CO2 emission. This research suggested that government, policymakers, and businesses reduce the toxic emission of gases for a sustainable environment. No doubt, the lockdown became the cause of CO2 emission reduction in India’s environment, but a short-period strategy under special circumstances. This lockdown declared one thing that the human activities and industrial activities in India are unhealthy and environmental unfriendly. The government of India, policymakers, and environmentalists should make the people know about environmentally friendly activities and restricted industries in the sense of toxic gas emissions to enhance environmental purity and prolong its sustainability.
Footnotes
Publisher's Note
Springer Nature remains neutral with regard to jurisdictional claims in published maps and institutional affiliations.
Contributor Information
Muddassar Sarfraz, Email: muddassar.sarfraz@gmail.com.
Muhammad Mohsin, Email: mohsinlatifntu@gmail.com.
Sobia Naseem, Email: Sobiasalamat4@gmail.com.
Amit Kumar, Email: amitkdah@nuist.edu.cn.
References
- Ambade B, Sankar TK, Kumar A, et al. COVID-19 lockdowns reduce the Black carbon and polycyclic aromatic hydrocarbons of the Asian atmosphere: source apportionment and health hazard evaluation. Environment, Development and Sustainability. 2021 doi: 10.1007/s10668-020-01167-1. [DOI] [PMC free article] [PubMed] [Google Scholar]
- Asadi S, Bouvier N, Wexler AS, Ristenpart WD. The coronavirus pandemic and aerosols: Does COVID-19 transmit via expiratory particles? Aerosol Science and Technology. 2020 doi: 10.1080/02786826.2020.1749229. [DOI] [PMC free article] [PubMed] [Google Scholar]
- Azam T, Mohsin M, Naseem S, Nilofar M, Zia-UR-Rehman M, Nelofer S, SongJiang W. Economic growth vulnerability amid the COVID-19 epidemic: A systematic review of different sectors of Pakistan. Revista Argentina de Clínica Psicológica. 2020;29(4):705–713. [Google Scholar]
- Bahmani-Oskooee M, Saha S. Nonlinear autoregressive distributed lag approach and bilateral J-curve: India versus her trading partners. Contemporary Economic Policy. 2017;35(3):472–483. doi: 10.1111/coep.12197. [DOI] [Google Scholar]
- Barati M, Fariditavana H. Asymmetric effect of income on the US healthcare expenditure: Evidence from the nonlinear autoregressive distributed lag (ARDL) approach. Empirical Economics. 2020;58(4):1979–2008. doi: 10.1007/s00181-018-1604-7. [DOI] [Google Scholar]
- Bherwani H, Anjum S, Kumar S, Gautam S, Gupta A, Kumbhare H, Kumar R. Understanding COVID-19 transmission through Bayesian probabilistic modeling and GIS-based Voronoi approach: A policy perspective. Environment, Development and Sustainability. 2020 doi: 10.1007/s10668-020-00849-0. [DOI] [PMC free article] [PubMed] [Google Scholar]
- Bherwani H, Nair M, Musugu K, Gautam S, Gupta A, Kapley A, Kumar R. Valuation of air pollution externalities: Comparative assessment of economic damage and emission reduction under COVID-19 lockdown. Air Quality, Atmosphere & Health. 2020;13(6):683–694. doi: 10.1007/s11869-020-00845-3. [DOI] [PMC free article] [PubMed] [Google Scholar]
- Brauer M, Burnett R. Estimates and 25-year trends of the global burden of disease attributable to ambient air pollution: An analysis of data from the global burden of diseases study 2015. The Lancet. 2017;389(10082):1907–1918. doi: 10.1016/S0140-6736(17)30505-6. [DOI] [PMC free article] [PubMed] [Google Scholar]
- Chakraborty I, Maity P. COVID-19 outbreak: Migration, effects on society, global environment and prevention. Science of the Total Environment. 2020 doi: 10.1016/j.scitotenv.2020.138882. [DOI] [PMC free article] [PubMed] [Google Scholar]
- Chakraborty, T., & Ghosh, I. (2020). Real-time forecasts and risk assessment of novel coronavirus (COVID-19) cases: A data-driven analysis. Chaos, Solitons & Fractals, 135, 109850. 10.1016/j.chaos.2020.109850 [DOI] [PMC free article] [PubMed]
- Dandona L, Shukla D. India state-level disease burden initiative collaborators, 2017. Nations within a nation: Variations in epidemiological transition across the states of India 1990–2016 in the global burden of disease study. Lancet. 2017;390(10111):2437–2460. doi: 10.1016/S0140-6736(17)32804-0. [DOI] [PMC free article] [PubMed] [Google Scholar]
- Edwards, C. (2018, 12, 11). Future Effects of Pollution. Retrieved from Sciencing: https://sciencing.com/future-effects-of-pollution-5690014.html
- Eroğlu H. Effects of Covid-19 outbreak on environment and renewable energy sector. Environment, Development and Sustainability. 2020 doi: 10.1007/s10668-020-00837-4. [DOI] [PMC free article] [PubMed] [Google Scholar]
- Gautam AS, Dilwaliya NK, Srivastava A, Kumar S, Bauddh K, Siingh D, Gautam S. Temporary reduction in air pollution due to anthropogenic activity switch-off during COVID-19 lockdown in northern parts of India. Environment, Development and Sustainability. 2020 doi: 10.1007/s10668-020-00994-6. [DOI] [PMC free article] [PubMed] [Google Scholar]
- Gautam AS, Kumar S, Gautam S, Anand A, Kumar R, Joshi A, Singh K. Pandemic induced lockdown as a boon to the Environment: Trends in air pollution concentration across India. Asia-Pacific Journal of Atmospheric Sciences. 2021 doi: 10.1007/s13143-021-00232-7. [DOI] [PMC free article] [PubMed] [Google Scholar]
- Gautam S. COVID-19: air pollution remains low as people stay at home. Air Quality, Atmosphere & Health. 2020;2020(13):853–857. doi: 10.1007/s11869-020-00842-6. [DOI] [PMC free article] [PubMed] [Google Scholar]
- Gautam S, Hens L. COVID-19: Impact by and on the environment, health and economy. Environment, Development and Sustainability. 2020;22:4953–4954. doi: 10.1007/s10668-020-00818-7. [DOI] [PMC free article] [PubMed] [Google Scholar]
- González MDLO, Jareño F, Skinner FS. Nonlinear autoregressive distributed lag approach: An application on the connectedness between bitcoin returns and the other ten most relevant cryptocurrency returns. Mathematics. 2020;8(5):810. doi: 10.3390/math8050810. [DOI] [Google Scholar]
- Green, M. (2020, 03, 13). Air pollution clears in northern Italy after coronavirus lockdown, satellite shows. Retrieved from Reuters: https://www.reuters.com/article/us-health-coronavirus-italy-pollution/air-pollution-clears-in-northern-italy-after-coronavirus-lockdown-satellite-shows-idUSKBN2102X4
- Greenwood-Nimmo M, Shin Y. Taxation and the asymmetric adjustment of selected retail energy prices in the UK. Economics Letters. 2013;121(3):411–416. doi: 10.1016/j.econlet.2013.09.020. [DOI] [Google Scholar]
- Guo YR, Cao QD, Hong ZS, Tan YY, Chen SD, Jin HJ, Yan Y. The origin, transmission and clinical therapies on coronavirus disease 2019 (COVID-19) outbreak–an update on the status. Military Medical Research. 2020;7(1):1–10. doi: 10.1186/s40779-020-00240-0. [DOI] [PMC free article] [PubMed] [Google Scholar]
- Haleem A, Javaid M. Effects of COVID 19 pandemic in daily life. Current Medicine Research and Practice. 2020;10(2):78–79. doi: 10.1016/j.cmrp.2020.03.011. [DOI] [PMC free article] [PubMed] [Google Scholar]
- Hashmi SM, Chang BH, Shahbaz M. Asymmetric effect of exchange rate volatility on India's cross-border trade: Evidence from global financial crisis and multiple threshold nonlinear autoregressive distributed lag model. Australian Economic Papers. 2020 doi: 10.1111/1467-8454.12194. [DOI] [Google Scholar]
- Hu C, Liu X, Pan B, Chen B, Xia X. Asymmetric impact of oil price shock on stock market in China: A combination analysis based on SVAR model and NARDL model. Emerging Markets Finance and Trade. 2018;54(8):1693–1705. doi: 10.1080/1540496X.2017.1412303. [DOI] [Google Scholar]
- Jones KE, Patel N, Levy M. Global trends in emerging infectious diseases. Nature. 2008;451:990–993. doi: 10.1038/nature06536. [DOI] [PMC free article] [PubMed] [Google Scholar]
- Katrakilidis C, Trachanas E. What drives housing price dynamics in Greece: New evidence from asymmetric ARDL cointegration. Economic Modelling. 2012;29(4):1064–1069. doi: 10.1016/j.econmod.2012.03.029. [DOI] [Google Scholar]
- Kelishadi, R. (2012). Environmental pollution: Health effects and operational implications for pollutants removal. Journal of Environmental and Public health, 1–2. [DOI] [PMC free article] [PubMed]
- Kumar A, Jigyasu DK, Kumar A, Subrahmanyam G, Mondal R, Shabnam AA, Pinto MMSC, Malyan SK, Chaturvedi AK, Khan S, Bhatia A. Nickel in terrestrial biota: Comprehensive review on contamination, toxicity, tolerance and its remediation approaches. Chemosphere. 2021 doi: 10.1016/j.chemosphere.2021.129996. [DOI] [PubMed] [Google Scholar]
- Kumar A, Sharma MP. Estimation of greenhouse gas emissions from Koteshwar hydropower reservoir, India. Environ Monit Asses. 2017;189(5):240–249. doi: 10.1007/s10661-017-5958-7. [DOI] [PubMed] [Google Scholar]
- Kumar A, Taxak AK, Mishra S, Pandey R. Long term trend analysis and suitability of water quality of River Ganga at Himalayan hills of Uttarakhand, India. Environmental Technology & Innovation. 2021 doi: 10.1016/j.eti.2021.101405. [DOI] [PMC free article] [PubMed] [Google Scholar]
- Kumar A, Thanki A, Padhiyar H, Singh NK, Pandey S, Yadav M, Yu ZG. Greenhouse gases emission control in WWTS via potential operational strategies: A critical review. Chemosphere. 2021 doi: 10.1016/j.chemosphere.2021.129694. [DOI] [PubMed] [Google Scholar]
- Lokhandwala S, Gautam P. Indirect impact of COVID-19 on environment: A brief study in Indian context. Environmental research. 2020;188:109807. doi: 10.1016/j.envres.2020.109807. [DOI] [PMC free article] [PubMed] [Google Scholar]
- Madhav, N., & Wolfe, N. (2017). Chapter 17 Pandemics: Risks, impacts, and mitigation. In Disease Control Priorities: Improving Health and Reducing Poverty. The International Bank for Reconstruction and Development. [PubMed]
- Mohsin M, Naiwen L, Zia-UR-Rehman M, Naseem S, Baig SA. The volatility of bank stock prices and macroeconomic fundamentals in the Pakistani context: an application of GARCH and EGARCH models. Oeconomia Copernicana. 2020;11(4):609–636. doi: 10.24136/oc.2020.025. [DOI] [Google Scholar]
- Mohsin M, Naseem S, Zia-ur-Rehman M, Baig SA, Salamat S. The crypto-trade volume, GDP, energy use and environmental degradation sustainability: An analysis of top 20 crypto-trader countries. International Journal of Finance and Economics. 2020 doi: 10.1002/ijfe.2442. [DOI] [Google Scholar]
- Muhammad S, Long X, Salman M. COVID-19 pandemic and environmental pollution: A blessing in disguise? Science of the total environment. 2020;728:138820. doi: 10.1016/j.scitotenv.2020.138820. [DOI] [PMC free article] [PubMed] [Google Scholar]
- Myllyvirta, L. (2020, 02, 19). Analysis: Coronavirus temporarily reduced China’s CO2 emissions by a quarter. Retrieved from CarbonBrief: https://www.carbonbrief.org/analysis-coronavirus-has-temporarily-reduced-chinas-co2-emissions-by-a-quarter
- Omoke PC, Opuala-Charles S, Nwani C. Symmetric and asymmetric effects of financial development on carbon dioxide emissions in Nigeria: Evidence from linear and nonlinear autoregressive distributed lag analyses. Energy Exploration & Exploitation. 2020;38(5):2059–2078. doi: 10.1177/0144598720939377. [DOI] [Google Scholar]
- Ouattara, B. (2004). Foreign aid and fiscal policy in Senegal (pp. 262–267). Manchester: Mimeo University of Manchester.
- Poetzscher, J. (2020, 05, 12). The effect of Covid-19 on India’s air quality. Retrieved from The HindusBusiness: https://www.thehindubusinessline.com/opinion/columns/the-effect-of-covid-19-on-indias-air-quality/article31564038.ece
- Rizou M, Galanakis IM, Aldawoud TM, Galanakis CM. Safety of foods, food supply chain and environment within the COVID-19 pandemic. Trends in food science & technology. 2020;102:293–299. doi: 10.1016/j.tifs.2020.06.008. [DOI] [PMC free article] [PubMed] [Google Scholar]
- SanJuan-Reyes S, Gómez-Oliván LM, Islas-Flores H. COVID-19 in the environment. Chemosphere. 2020 doi: 10.1016/j.chemosphere.2020.127973. [DOI] [PMC free article] [PubMed] [Google Scholar]
- Sarfraz M, Qun W, Hui L, Abdullah M. Environmental risk management strategies and the moderating role of corporate social responsibility in project financing decisions. Sustainability. 2018;10:2771. doi: 10.3390/su10082771. [DOI] [Google Scholar]
- Sarfraz M, Shehzad K, Farid A. Gauging the air quality of New York: a non-linear Nexus between COVID-19 and nitrogen dioxide emission. Air Qual Atmos Heal. 2020;13:1135–1145. doi: 10.1007/s11869-020-00870-2. [DOI] [PMC free article] [PubMed] [Google Scholar]
- Shah SGM, Sarfraz M, Ivascu L. Assessing the interrelationship corporate environmental responsibility, innovative strategies, cognitive and hierarchical CEO: A stakeholder theory perspective. Corporate Social Responsibility and Environmental Management. 2020 doi: 10.1002/csr.2061. [DOI] [Google Scholar]
- Shahzad SJH, Nor SM, Ferrer R, Hammoudeh S. Asymmetric determinants of CDS spreads: US industry-level evidence through the NARDL approach. Economic Modelling. 2017;60:211–230. doi: 10.1016/j.econmod.2016.09.003. [DOI] [Google Scholar]
- Shakil MH, Munim ZH, Tasnia M, Sarowar S. COVID-19 and the environment: A critical review and research agenda. Science of the Total Environment. 2020 doi: 10.1016/j.scitotenv.2020.141022. [DOI] [PMC free article] [PubMed] [Google Scholar]
- Sharma S, Zhang M, Anshika, Gao J, Zhang H, Kota SH. Effect of restricted emissions during COVID-19 on air quality in India. Science of the Total Environment. 2020;728:138878. doi: 10.1016/j.scitotenv.2020.138878. [DOI] [PMC free article] [PubMed] [Google Scholar]
- Shehzad K, Xiaoxing L, Arif M, Rehman KU, Ilyas M. Investigating the psychology of financial markets during COVID-19 Era: A case study of the US and European Markets. Frontiers in Psychology. 2020 doi: 10.3389/fpsyg.2020.01924. [DOI] [PMC free article] [PubMed] [Google Scholar]
- Shin Y, Yu B, Greenwood-Nimmo M. Festschrift in honor of Peter Schmidt. New York: Springer; 2014. Modelling asymmetric cointegration and dynamic multipliers in a nonlinear ARDL framework; pp. 281–314. [Google Scholar]
- Srivastava S, Kumar A, Bauddh K, Gautam AS, Kumar S. 21-Day lockdown in India dramatically reduced air pollution indices in Lucknow and New Delhi, India. Bulletin of environmental contamination and toxicology. 2020;105:9–17. doi: 10.1007/s00128-020-02895-w. [DOI] [PMC free article] [PubMed] [Google Scholar]
- Tobías A, Carnerero C, Reche C, Massagué J, Via M, Minguillón MC, et al. Changes in air quality during the lockdown in Barcelona (Spain) one month into the SARS-CoV-2 epidemic. Science of the Total Environment. 2020;726:138540. doi: 10.1016/j.scitotenv.2020.138540. [DOI] [PMC free article] [PubMed] [Google Scholar]
- United Nations . World urbanization prospects 2018. United Nations; 2018. [Google Scholar]
- United Nations. (2019, 06 17). Billion in 2050 and could peak at nearly 11 billion around 2100. Retrieved from United Nations: https://www.un.org/development/desa/en/news/population/world-population-prospects-2019.html
- Van, D. T. B., & Bao, H. H. G. (2019, January). A nonlinear autoregressive distributed lag (NARDL) analysis on the determinants of Vietnam’s stock market. In International Econometric Conference of Vietnam. Springer: Cham. pp. 363–376
- Verma A, Prakash S. Impact of covid-19 on environment and society. Journal of Global Biosciences. 2020;9(5):7352–7363. [Google Scholar]
- Wang G, Zhang Y, Zhao J, Zhang J, Jiang F. Mitigate the effects of home confinement on children during the COVID-19 outbreak. The Lancet. 2020;395(10228):945–947. doi: 10.1016/S0140-6736(20)30547-X. [DOI] [PMC free article] [PubMed] [Google Scholar]
- Wang P, Chen K, Zhu S, Wang P, Zhang H. Severe air pollution events not avoided by reduced anthropogenic activities during COVID-19 outbreak. Resources, Conservation and Recycling. 2020;158:104814. doi: 10.1016/j.resconrec.2020.104814. [DOI] [PMC free article] [PubMed] [Google Scholar]
- Wang Q, Su M. A preliminary assessment of the impact of COVID-19 on environment–A case study of China. Science of the Total Environment. 2020 doi: 10.1016/j.scitotenv.2020.138915. [DOI] [PMC free article] [PubMed] [Google Scholar]
- Wilder-Smith A, Freedman DO. Isolation, quarantine, social distancing and community containment: Pivotal role for old-style public health measures in the novel coronavirus (2019-nCoV) outbreak. Journal of Travel Medicine. 2020 doi: 10.1093/jtm/taaa020. [DOI] [PMC free article] [PubMed] [Google Scholar]
- Zhang R, Zhang Y. NOx Emission Reduction and Recovery during COVID-19 in East China. The Atmosphere. 2020;11(4):433. doi: 10.3390/atmos11040433. [DOI] [Google Scholar]
- Zhang Z, Tsai SL, Chang T. New evidence of interest rate pass-through in Taiwan: A nonlinear autoregressive distributed lag model. Global Economic Review. 2017;46(2):129–142. doi: 10.1080/1226508X.2017.1278710. [DOI] [Google Scholar]


