

Abstract
Several studies have demonstrated the potential of short wavelength infrared (SWIR) reflectance, thermal imaging and optical coherence tomography for the nondestructive assessment of the activity of caries lesions. The purpose of this study was to test the hypothesis that the activity of arrested caries lesions on the coronal surfaces of extracted teeth would be changed by reducing the thickness of the highly mineralized transparent surface layer, which was measured using polarization sensitive optical coherence tomography (PS-OCT). The lesion activity was assessed using SWIR reflectance and thermal imaging during forced air drying of the lesion before and after mechanical removal of a surface layer ~ 50-μm thick covering the lesion. Both the intensity change in SWIR reflectance images at 1500–1750-nm wavelengths after drying the lesions and the change in thermal emission measured with a thermal camera at 8–13-μm wavelengths increased significantly (P<0.05) after reducing the thickness of the mineralized surface layer in the lesions indicating the permeability of the lesion to fluids increased. These results provide further evidence that the presence of a highly mineralized outer surface layer is a key indicator of lesion arrest.
Keywords: lesion activity, optical coherence tomography, SWIR imaging, thermal imaging
1. INTRODUCTION
Dental caries is a significant oral health problem in most industrialized countries [1]. The nature of the caries problem has changed markedly due to the introduction of fluoride to the drinking water, application of topical fluoride in dental office and improved dental hygiene [2–4]. Despite these advances, dental caries continues to be the major cause of tooth loss [5]. It is well known that demineralization and remineralization occur in caries lesions [6,7]. Remineralization can reverse the caries process by repairing existing crystal remnants with the help of calcium and phosphate ions, primarily from saliva, and fluoride ions from topical sources arresting the lesion. Fluoride inhibits demineralization and enhances remineralization by promoting crystal growth and producing fluorapatite crystals that are much more resistant to acid challenge than the carbonated hydroxyapatite of enamel and dentin.
Enamel is highly transparent in the short wavelength infrared (SWIR) beyond 1300 nm [2,8,9]. Therefore, the SWIR is well-suited for imaging lesions on both proximal and occlusal surfaces. Early caries lesions in enamel have a chalky white appearance with an intact surface layer [10]. The lesion body shows increased porosity due to mineral loss while the surface layer is maintained due to mineral deposition from saliva. The International Caries Detection and Assessment System (ICDAS) II criteria for enamel caries lesion activity assessment are largely based on the Nyvad criteria, which are based on the results of a three-year longitudinal study involving modification to oral hygiene routine and use of fluoride dentifrice [11]. Arrested caries lesions exhibit a glossy appearance with a surface hardness that is comparable to sound enamel because they have a highly mineralized transparent surface layer on the outer surface of the lesion. Active caries often manifest a non-glossy appearance because they lack a distinct highly mineralized transparent surface layer on the outer surface of the lesion and are often rough in texture. The highly mineralized surface layer of a lesion is important for diagnosis of the current “state of the lesion”, whether or not the lesion is active or whether the lesion has been arrested and is undergoing remineralization. The highly mineralized surface layer is typically transparent when examined in cross section using microscopic methods such as polarized light microscopy (PLM). Histological methods such as PLM and transverse microradiography (TMR) require destruction of the tooth, and are unsuitable for use in-vivo [3,12–14]. Many caries lesions have been arrested or are undergoing remineralization and do not require intervention. New optical methods are needed to assess lesion activity and avoid unnecessary cavity preparations. Accurate determination of the lesion activity and severity is important for the effective employment of new optical diagnostic technologies. Accurate assessment of lesion activity with these novel methods is extremely promising and important for the further clinical diagnostic and treatment of enamel caries lesion. Therefore, new non-destructive technologies are needed to assess the lesion activity in order to determine whether the lesion requires chemical or surgical intervention.
Optical coherence tomography (OCT) can provide high resolution cross-sectional images of lesion structure non-invasively [15]. However, conventional OCT can only generate intensity-based cross-sectional images of the microstructures of tissues. Polarization-sensitive optical coherence tomography (PS-OCT) is a functional extension of intensity-based OCT that utilizes the polarization properties of back-reflected light to obtain additional physiological information [16,17]. Previous studies of PS-OCT have shown that PS-OCT has the particular capability of revolving the structure of early caries lesions because caries lesions strongly scatter incident polarized light and the image in the polarization axis orthogonal to that of the incident polarization can provide improved lesion contrast. PS-OCT has been successfully used to acquire images of simulated and natural caries lesions, assess their severity in depth and assess the remineralization of such lesions on enamel and dentin [18,19]. PS-OCT has also effectively been used to obtain high contrast of demineralization on tooth surfaces at wavelengths beyond 1300 nm due to reduced light scattering in sound enamel. Several studies have demonstrated that PS-OCT is able to measure remineralization on tooth surfaces and to detect the formation of a highly mineralized layer on the lesion surface exposure to a remineralization solution [20]. In addition, methods have been developed to automatically detect the highly mineralized surface layer of enamel lesions exposed to remineralization solutions and measure its thickness [21].
As lesions become arrested by mineral deposition or remineralization, the permeability of the mineralized surface layer decreases [22]. Thus, the rate of diffusion of water from lesions depends on the lesion structure and reflects the degree of lesion activity. The relationship between the optical changes and water loss have been exploited via quantitative light-induced fluorescence (QLF) [23,24], thermal imaging [25,26] and SWIR imaging [27, 28].
During the dehydration process, heat loss is caused by two major mechanisms: the varying temperature between the flowing air and the sample, as well as the highly endothermic evaporation of water molecules from the surface of the sample. Kaneko et al. reported that thermography data could be used to obtain quantitative information on the extent of demineralization such as lesion area, mineral loss and lesion depth and that ΔQ was correlated with ΔZ [26]. Zakian et al. showed that ΔQ maps created on the tooth occlusal surface manifested high correlation with histological scores based on visual diagnosis [25]. That same approach can has also been used to differentiate active and arrested lesions on tooth coronal and root surfaces [30–33].
SWIR reflectance imaging has also been exploited for caries detection because sound enamel is transparent in the SWIR and the scattering coefficient increases significantly with increasing mineral loss [29]. Zakian et al. carried out SWIR reflectance measurements from 1000 – 2500 nm using a hyperspectral imaging system and showed that the reflectance from sound tooth areas decreases at longer wavelengths where water absorption is higher [27]. Previous studies demonstrated that the rate of water diffusion from enamel could be analyzed for the assessment of remineralization [30]. The relationship between surface zone thickness and lesion permeability is highly non-linear, and that a small increase in the surface layer thickness can lead to a markedly decrease in permeability.
In our recent studies, SWIR reflectance imaging manifested the highest performance for monitoring the activity of enamel lesions and PS-OCT and thermal imaging performed better for assessing the activity of root caries lesions. The purpose of this study was to demonstrate that the removal of the outer surface layer of arrested lesions would produce a significant increase in lesion permeability or activity. The lesion structure was measured with polarization sensitive optical coherence tomography (PS-OCT). The results suggest that the area enclosed by the intensity curve, ΔI, measured with SWIR reflectance and the time-temperature curve, ΔQ, measured with thermal imaging increased significantly with decreasing thickness of the transparent mineralized surface layer in lesions measured with PS-OCT. The relationship between surface layer thickness and lesion activity is correlated. This study provides further evidence that the presence of an outer surface zone of higher mineral content can be used as a marker for arrested lesions.
2. MATERIALS AND METHODS
2.1. Sample Preparation
Five human teeth with suspected arrested interproximal enamel caries lesions were collected and sterilized with gamma radiation. PS-OCT images indicated that all the lesions had a distinct intact surface zone indicative of arrested lesions. Teeth were mounted in black orthodontic acrylic blocks and stored in a moist environment of 0.1% thymol to maintain tissue hydration and prevent bacterial growth [8]. The experiment design involved three steps. In the first step, the samples were imaged with PS-OCT, SWIR reflectance imaging and thermal imaging. A thin layer approximately 50 μm thick was removed using a diamond grinding wheel, and the teeth were reimaged using PS-OCT, thermal and SWIR reflectance. Four measurements were taken for each sample: (before) lesion, sound, (after) ground lesion and ground sound.
A custom grinding platform employing a 6” 360 grit diamond embedded grinding wheel from (Crystalite Co, Lewis Center, OH), a translation stage with a digital indicator and a water spray was used to grind the samples. After grinding, PS-OCT was used to measure the reduced thickness of surface layer.
2.2. PS-OCT Measurements
An all fiber-based PS-OCT system was used in this study with polarization maintaining (PM) optical fiber, high speed piezoelectric fiber-stretchers and two balanced InGaAs receivers that was designed and fabricated by (Optiphase, Inc., Van Nuys, CA) [8]. This two-channel system was integrated with a broadband superluminescent diode (SLD) DL-CS3159A, (Denselight, Jessup, MD) and a high-speed XY-scanning motion controller system, ESP 300 controller with ILS100PP and 850G-HS stages, (Newport, Irvine, CA) for in-vitro optical tomography. The source used in this system was a polarized SLD source with a center wavelength of 1317 nm and a spectral bandwidth full-width-half-maximum (FWHM) of approximately 84 nm, which can provide an axial resolution of 9 μm in air and 6 μm in enamel (refractive index = 1.6). The maximum power of the laser source was 15 mW. Light from the sample arm was focused onto the sample surface using a 20 mm focal length plano-convex lens providing a lateral resolution of approximately 20 μm.
The PS-OCT system was completely controlled using LabView™ software (National Instruments, Austin, TX). Samples were dried with pressurized air for 30 seconds prior to imaging. Each B-scan consisted of 200 A-lines spaced 50 μm apart. The A-line sweep rate was 150 Hz with a dynamic range of 48 dB and each A-scan was an average of 10 scans. The total number of data points in each A-scan was 2000 over a scan range of approximately 5 mm in air. The thickness of the transparent surface layer in lesion sample was measured by the position of the strong surface reflection in the co-polarization axis and the strong scattering of polarized light from the underlying lesion body in the cross-polarization axis. The surface layer thickness was calculated by utilizing an edge detection technique with the zero-crossing first-order derivative as described in previous study [21]. In this study, the threshold values for the ratio of the intensities of the two peaks were set to 0.1 for the co-polarization axis and 0.5 for the cross-polarization axis, respectively.
The lesion depth and integrated reflectivity over the lesion depth were estimated using a previously developed algorithm [20,21]. An edge locator was used to make two passes along each A-scan of the processed PS-OCT images to locate the respective positions at which the intensity has decreased to half of the lesion peak maximum. Integrated reflectivity, ΔR, was calculated by integrating from the base of the transparent layer through the entire estimated lesion body in the PS-OCT images, which was correlated with the mineral loss with depth [12]. A region of interest was specified for the sound region from each sample in order to discriminate between lesion and sound enamel. In general, the sound area was selected close to the lesion area. The transparent surface layer, lesion depth and ΔR measurements were calculated by averaging 25 A-scans from a 5 × 5 pixel region of interest. A median filter was applied to the final 2D projection images for improved visualization.
2.3. Dehydration Measurements
The following setup was used for the thermal and SWIR reflectance dehydration experiments of Sec. 2.4 and 2.5. Each sample was placed in a mount connected to a high-speed XY-scanning motion controller system, Newport ESP 300 controller & 850G-HS stages coupled with an air nozzle as previously reported [31]. Each sample was immersed in the water bath for 30 seconds while being moved in a back and forth motion using a linear stage to increase the rate of diffusion into the lesions for rehydration. After the sample was removed from the water bath, an image was captured as an initial reference image and the air spray was activated. The air pressure was set to 15 psi and the computer-controlled air nozzle was positioned 20 mm away from the sample. Each measurement consisted of capturing a sequence of images at 4 frames per second for 30 seconds. For each measurement, the air nozzle was centered on the ROI, and this process was repeated for each window. The dehydration setup was completely automated using LabView™ software. All windows from all samples were exposed to the same dehydration protocol.
2.4. SWIR Reflectance Imaging and Analysis
Each sample was placed in a mount connected to a high-speed XY-scanning motion controller system (Newport, Irvine, CA) ESP301 controller and 850G-HS stages, coupled with an air nozzle. A Model SU320KTSX InGaAs focal plane array (Sensor-Unlimited, Princeton, NJ) with a spectral sensitivity range from 900 to 1750 nm, a resolution of 320 × 256 pixels, and an InfiniMite lens (Infinity, Boulder, CO) was used to acquire all the images during the dehydration process. Light from a 150 W fiber-optic illuminator FOI-1 (E Licht Company, Denver, CO) was directed at the sample at an incident angle of approximately 30° from surface normal of the tooth occlusal surface to reduce specular reflection and the source to sample distance was fixed at 5 cm. A FEL LP series long-pass filter at 1500 nm (Thorlabs, Newton, NJ) was used. SWIR reflectance images were processed and automatically analyzed using a dedicated program constructed with LabView software. A region of interest (ROI) encompassing the whole sample was used. The intensity difference between the final and initial images, ΔI (t=30), was calculated using I30 - I0, where I30 is the mean intensity at t = 30 seconds and I0 is the mean intensity prior to turning on the air nozzle.
2.5. Thermal Imaging and Analysis
An infrared thermography camera, Model A65 (FLIR Systems, Wilsonville, OR, USA) sensitive from 8 – 13 μm with a resolution of 640 × 512 pixels, a thermal sensitivity of 50 mK and a lens with a 13 mm focal length was used to record temperature changes during the dehydration process [30]. The area per pixel was approximately 0.02 mm. The ambient room temperature, flowing air temperature and water bath temperature were approximately 21 °C (294.15 K) and were consistent throughout the experiment. The object emissivity was set to 0.92, and the atmospheric temperature was set to 294.15 K [31]. Relative humidity was set at a default value of 50%; humidity values were not recorded, but every sample was measured under the same conditions. Previous studies have shown that ΔQ, the area enclosed by the time-temperature curve, can be used as a quantitative measure of porosity and can be used to discriminate between the demineralized enamel and the remineralized or sound enamel in-vitro [32,33].
Thermal images were processed and analyzed using a dedicated program written in LabView™. The thermography camera outputs a series of temperature measurements over time. The initial reference temperature measurements varied slightly (± 0.5 K) due to the different emissivity, lesion structure, mineral composition and water content among windows. Calibration was carried out via matching the measurements from the initial reference image to the ambient temperature. ΔQ was calculated from the area enclosed by the initial temperature and the time-temperature curve, acquired from an average measurement of a 5 × 5 pixel ROI for each window.
2.6. Statistical Analysis
Four groups of enamel lesion samples were compared using one-way analysis of variance with repeated measures (RM-ANOVA) with Tukey’s multiple comparisons post-test using Prism 7 statistical software (GraphPad Software, Inc., La Jolla, CA) for dehydration measurements. Significance level was set at P < 0.05.
3. RESULTS AND DISCUSSION
Figure 1 shows a color image of one of the lesions along with 2D projection images calculated from the 3D PS-OCT images before and after removal of the mineralized surface layer. The lesion shows microcavitation of the surface with a distinctive surface layer in Figs. 1(e) – (g).
Fig 1.
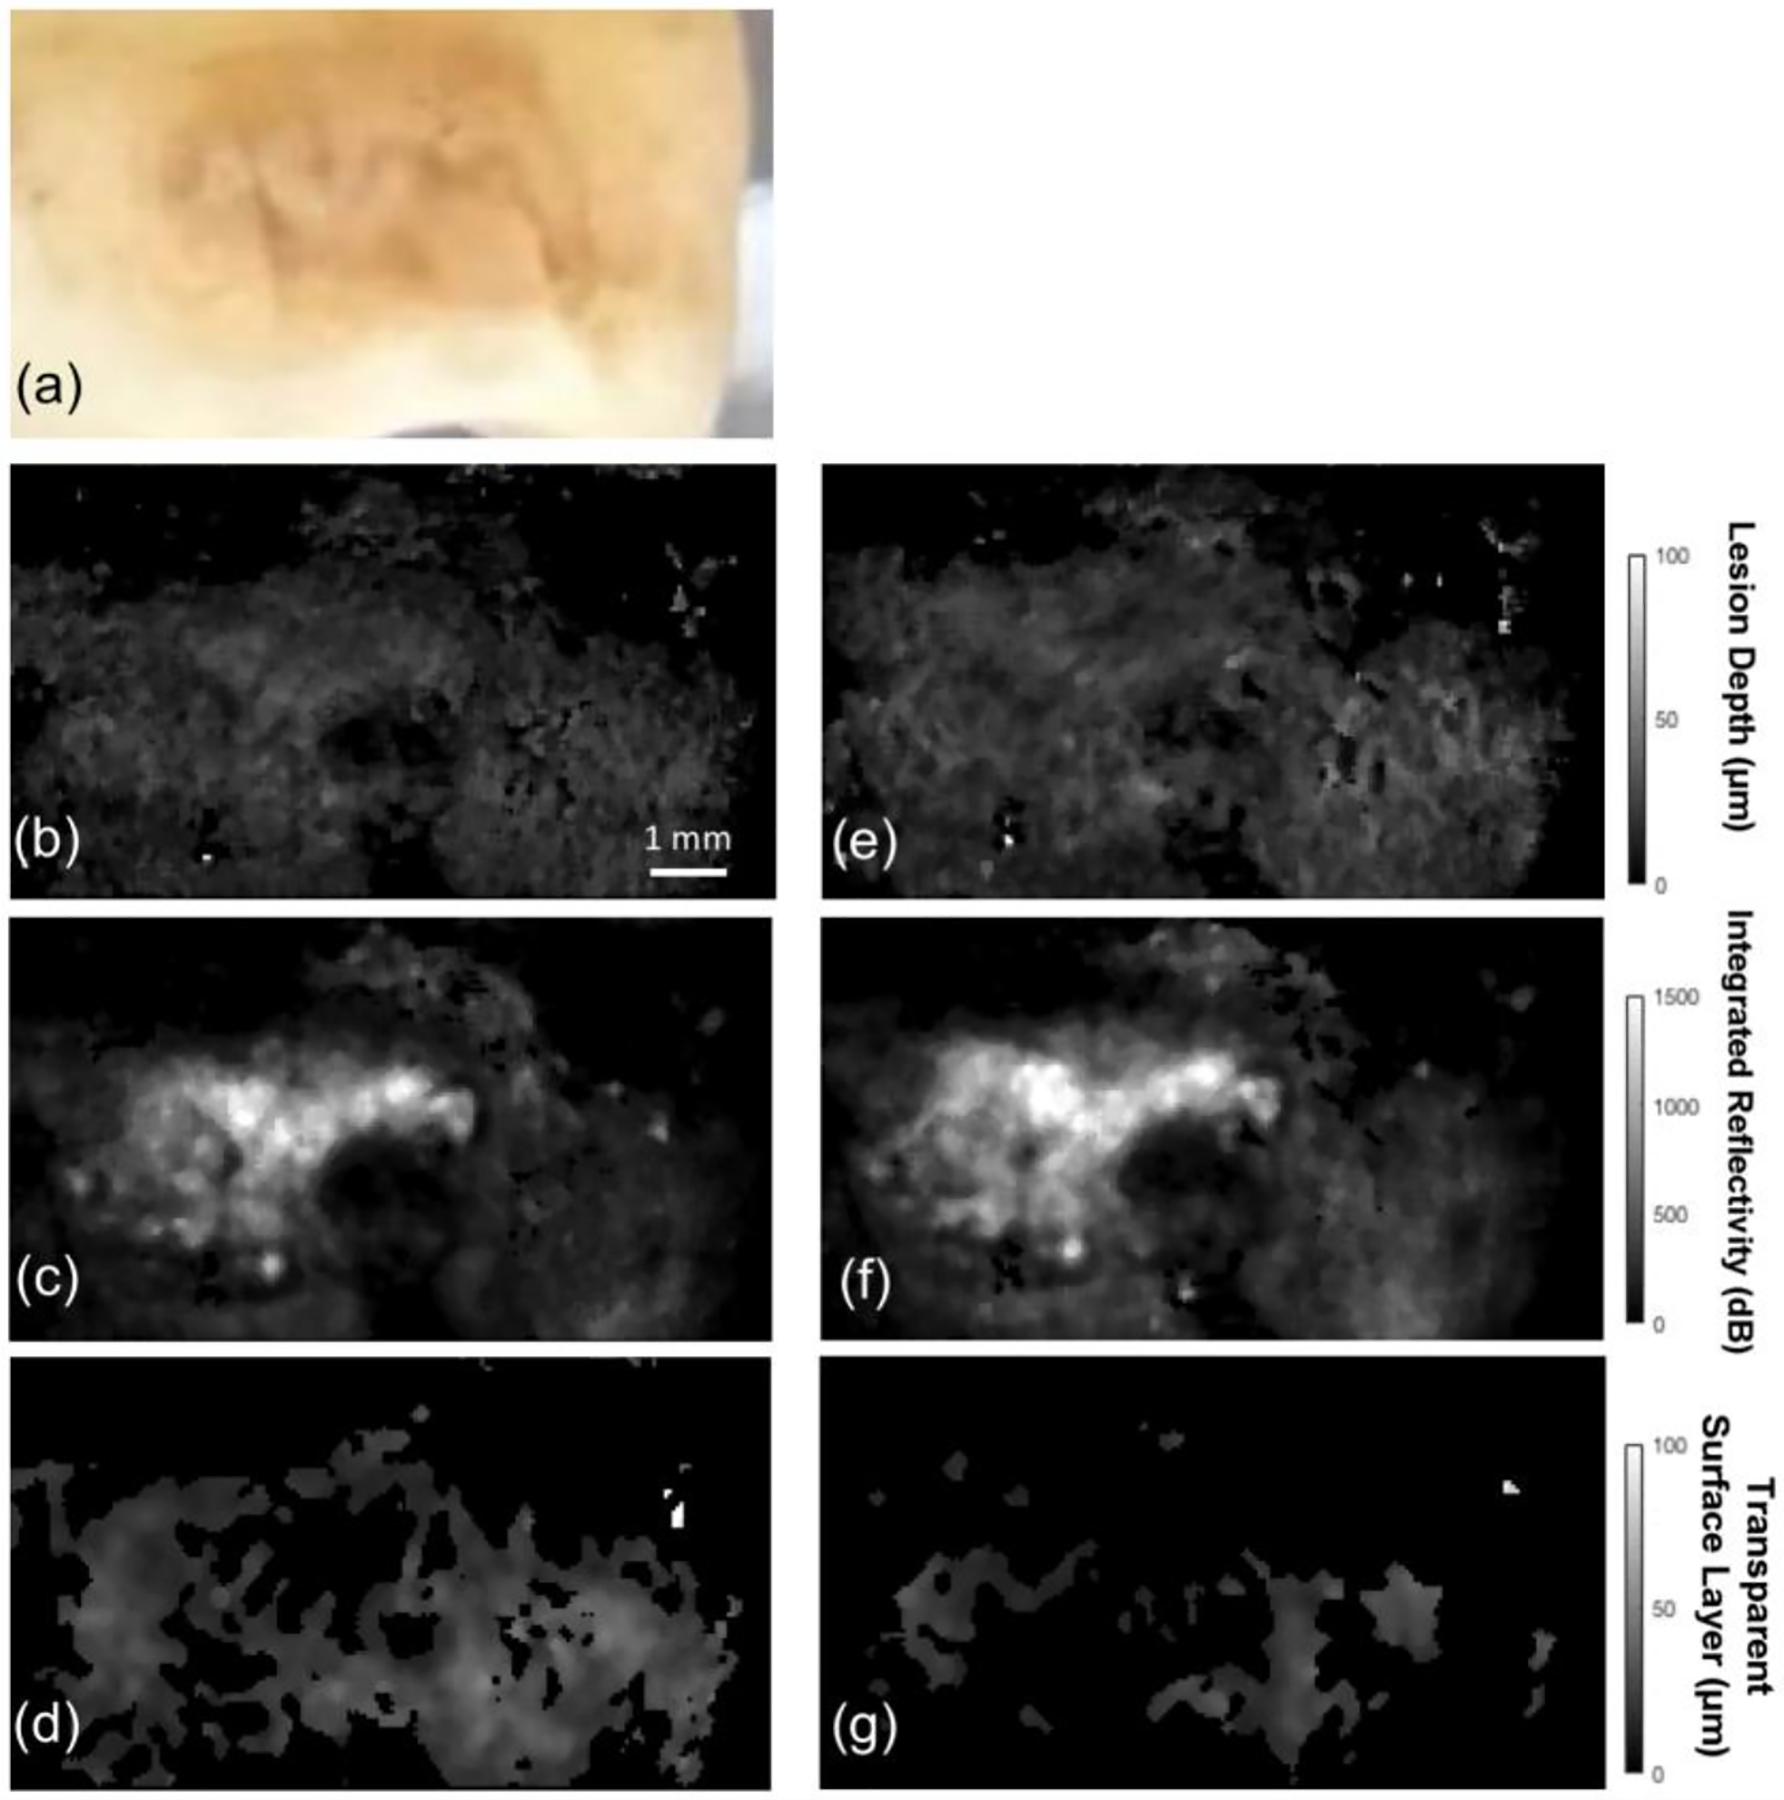
2D projection images of one of the lesions before and after removal of the surface layer derived from the 3D PS-OCT data. (a) Color (visible light) image of the lesion, (b, e) 2D projection images of the lesion depth before and after removal of the layer, (c, f) 2D projection images of the integrated reflectivity over the lesion depth (ΔR) before and after removal, and (d, g) 2D projection images of the transparent surface layer thickness before and after removal.
The visible image in Fig. 1(a) shows a caries lesion that is both light and dark brown in color. The 2D projection images of Fig. 1 were produced using automated image processing algorithms for determination of the lesion depth, integrated reflectivity with depth (ΔR) and the thickness of the transparent mineralized surface layer [21]. There was a significant decrease in the thickness of transparent surface layer before and after grinding in Fig. 1(d) and (g). The mean thickness of the surface layer removed was 42 μm and it varied in thickness from 30–70 μm. Before removal a transparent surface layer was present over most of the lesion area and the mean value of the surface layer thickness was approximately 80 μm Fig. 1(d).
In this study, we expected the SWIR lesion contrast and ΔI to increase as the transparent surface layer of the lesion was removed. Temporal profiles of the SWIR reflectance from the lesion shown in Fig. 1 are shown in Fig. 2 during drying. The intensity difference, ΔI, was recorded instead of raw intensity data due to changes in anatomical structure of the sample, i.e. variation in depth to dentin and enamel junction, presence of cracks, enamel birefringence due to orientation of enamel spindles. There are large changes in the shape of the dehydration time-intensity curve for the lesion after removal of the outer surface layer while there was minimal change for the sound area after removal in Fig. 2(a). The small change in the sound enamel area after grinding away a layer of the surface indicates that the large changes in the lesion are due to removal of the highly mineralized surface zone and are not due to the increased roughening of the surface due to grinding. The lesion time-intensity curves exhibited a sigmoidal-like shape in Fig. 2(a). Mean±S.D. for ΔI for the fives samples is shown in Table 1. There was a significant increase in ΔI in the lesion areas after reducing the thickness of the surface layer (P < 0.05) while there was no significant increase in ΔI in sound areas (P > 0.05) after removal of a surface layer of similar thickness.
Fig 2.
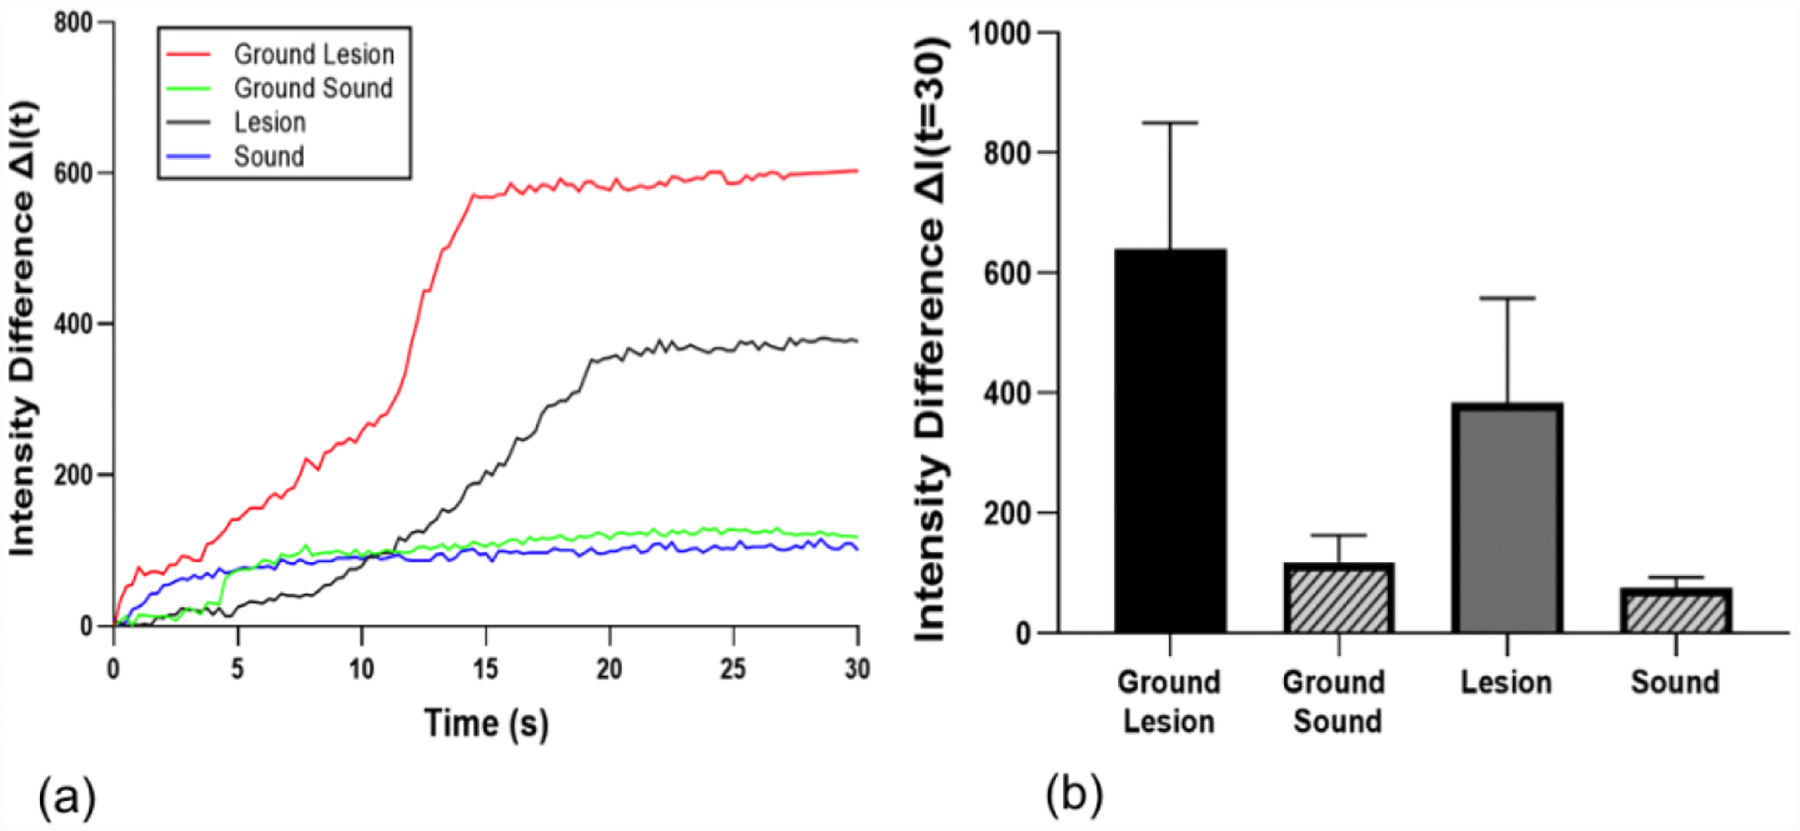
(a) SWIR reflectance intensity profiles from sound and lesion areas of each tooth before and after removal of the surface layer (ground sample) for the lesion shown in Fig. 1. (b) Mean ± S.D. of ΔI measurement of the samples. Bars of the same color are statistically similar, P > 0.05 (n=5).
Table 1.
Mean ± S.D. of intensity differences ΔI (t = 30) from SWIR reflectance, ΔQ from thermal imaging and PS-OCT measurements for the ground and natural lesion groups. Groups with the same letters are not significantly different, P > 0.05 in each column.
| ΔI(t = 30) | ΔQ (K × s) | ΔR(t = 30) (dB × μm) | TSL Thickness (PS-OCT, μm) | Lesion Body Depth (PS-OCT, μm) | |
|---|---|---|---|---|---|
| Ground Lesion | 641 ± 210 a | 39.7 ± 14.0 a | 890±395 | 40.5 ± 7.8 | 58.9 ± 9.2 |
| Ground Sound | 113 ± 43 b | 10.1 ± 5.9 b | - | - | - |
| Lesion | 384 ± 174 c | 18.6 ± 16.1 c | 833±351 | 82.3 ± 24.6 | 66.2 ± 8.6 |
| Sound | 80 ± 21 b | 8.4 ± 7.5 b | - | - | - |
Thermal profiles of the sample from Fig. 1 are shown in Fig. 3(a). All samples approached ambient temperature with the dehydration process within 30 seconds. Figure 3(a) shows that the lesion window exhibited the greatest decrease in the first 5 seconds of forced drying and manifested the slowest recovery to equilibrium. Changes in the mean ΔQ values before and after removal of the surface layer for the lesion are not as great as the changes observed for ΔI. The mean values of ΔQ in Fig. 3(b) are listed in Table 1. However, there was still a significant difference (P <0.05) in the mean ΔQ values before and after reducing the thickness of the surface layer in lesion areas, Fig. 3(b). There was no significant difference in ΔQ in the sound areas after removal of a surface layer of similar thickness.
Figure 3.
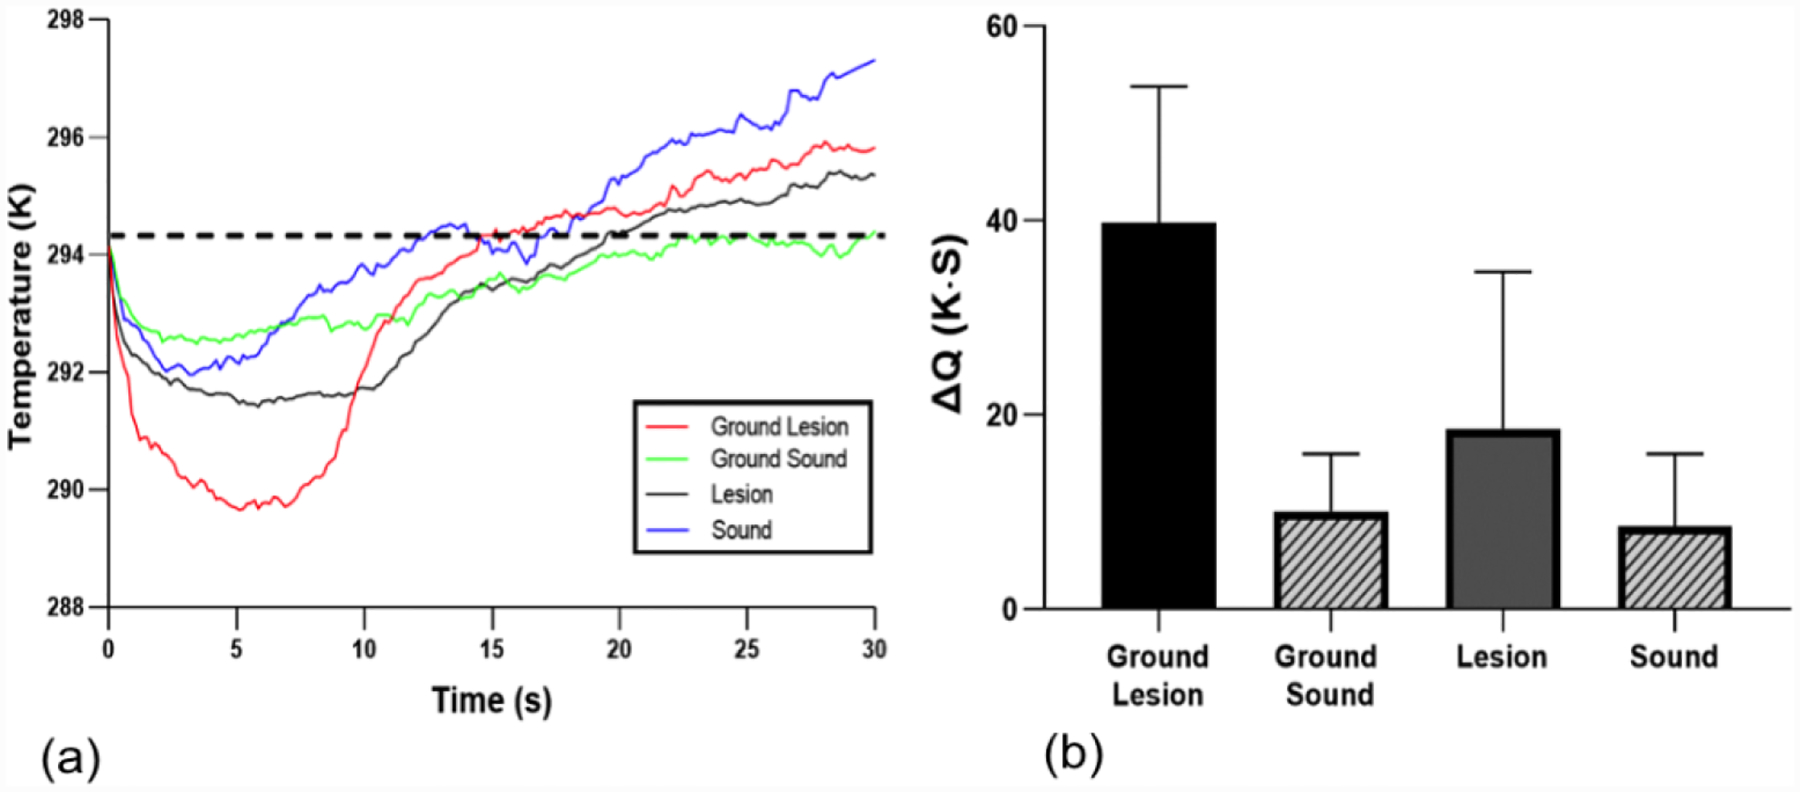
(a) Temperature profiles from sound and lesion areas of each tooth before and after removal of the surface layer (ground sample) for the lesion shown in Fig. 1. (b) Mean ± S.D. of ΔQ measurement of the enamel lesion samples. Dashed line in (a) represents the initial temperature and ΔQ is the area under the dashed line enclosed by the time-temperature curve. Bars of the same color are statistically similar, P > 0.05 (n=5).
In a previous study, we reported that the highly mineralized surface layer plays an important role in the dehydration kinetics of coronal lesions and that both the thermal and SWIR imaging methods are suitable for detection of remineralization [30]. In that study, SWIR reflectance imaging (ΔI) performed better than thermal imaging for assessing the activity of lesions in enamel [33]. Thermal imaging performed better than the SWIR for lesions on root surfaces [33]. In this study, both ΔI and ΔQ increased significantly as predicted after removal of the surface layer.
The principal aim of this study was to investigate that the lesion permeability and hence activity manifests significant changes with a reduction in thickness of the highly mineralized surface layer and that those changes can be detected and assessed using PS-OCT, thermal and SWIR reflectance imaging methods. The highly mineralized surface layer inhibits free diffusion from the lesion body to the outer surface. We demonstrated that as the thickness of the highly mineralized surface layer was reduced, ΔQ and ΔI increased which is consistent with an increase in the permeability of the lesion. Therefore, the rate of loss of mobile water from the lesion is likely to be highly dependent on the thickness and mineral content of that highly mineralized surface layer.
There is no gold standard for the activity of caries lesions. PLM, TMR and microCT can provide images of the lesion structure ex vivo and one of the features that is prominent on arrested lesions is a thick surface zone. The highly mineralized surface zone that inhibits diffusion into the lesion is responsible for arresting the lesion however it is unclear how thick or how highly mineralized that zone has to be to arrest the lesion. There have been few studies investigating the nature of the surface zone in active and arrested lesions [34]. Simulated lesion models show that new mineral is first deposited at the surface of the lesion during remineralization and as the outside pores of the lesion are filled a highly mineralized surface zone forms, limiting diffusion and further remineralization of the body of the lesion, i.e., the lesion reaches an arrested state where there is no further demineralization or remineralization [34]. However, in vivo remineralization takes place over a much greater time period and very thick surface zones have been observed on caries lesions that have been present in the mouth for many years [35]. A comparison of lesions from a young population likely to have new and active lesions versus lesions from an older population likely to have old arrested lesions indicated that the lesions in the older population had significantly thicker surface zones [35].
This study provides additional evidence regarding the mechanism of arresting caries lesions and suggests that the transparent surface layer above the subsurface lesion greatly inhibits the diffusion of liquids in the lesion.
4. ACKNOWLEDGEMENTS
This research was funded by NIH/NIDCR grants (F30-DE023278 and RO1-DE027335). The authors would like to acknowledge the help of Vincent Yang, William Fried, Yihua Zhu and Cynthia Darling.
5. REFERENCES
- 1.Petersen PE The World Oral Health Report 2003: continuous improvement of oral health in the 21st century – the approach of the WHO Global Oral Health Programme, Community Dentistry and Oral Epidemiology 2003, 31, 3–23. [DOI] [PubMed] [Google Scholar]
- 2.Hale GM; Querry MR Optical Constants of Water in the 200-nm to 200-microm Wavelength Region, Appl Opt 1973, 12, 555–563 [doi: 10.1364/AO.12.000555]. [DOI] [PubMed] [Google Scholar]
- 3.Alfano R; Lam W; Zarrabi H; Alfano M; Cordero J Human teeth with and without caries studied by laser scattering, fluorescence, and absorption spectroscopy, IEEE J. Quantum Elect 1984, 20, 1512–1516 [doi: 10.1109/JQE.1984.1072351]. [DOI] [Google Scholar]
- 4.Ten CJ; Featherstone JD Mechanistic aspects of the interactions between fluoride and dental enamel, Crit Rev Oral Biol Med 1991, 2, 283–296 [DOI] [PubMed] [Google Scholar]
- 5.Kidd EA The histopathology of enamel caries in young and old permanent teeth, Brit. Dent. J 1983, 155, 196–198 [doi: 10.1038/sj.bdj.4805177]. [DOI] [PubMed] [Google Scholar]
- 6.Featherstone JD; Glena R; Shariati M; Shields CP Dependence of in vitro demineralization of apatite and remineralization of dental enamel on fluoride concentration, J. Dent. Res 1990, 69 Spec No, 620–625, 634–636 [doi: 10.1177/00220345900690S121]. [DOI] [PubMed] [Google Scholar]
- 7.Fontana M; Young DA; Wolff MS; Pitts NB; Longbottom C Defining Dental Caries for 2010 and Beyond, Dental Clinics of North America 2010, 54, 423–440 [doi: 10.1016/j.cden.2010.03.007]. [DOI] [PubMed] [Google Scholar]
- 8.Fried D; Xie J; Shafi S; Featherstone JD; Breunig TM; Le C Imaging caries lesions and lesion progression with polarization sensitive optical coherence tomography, J. Biomed. Opt 2002, 7, 618–627 [doi: 10.1117/1.1509752]. [DOI] [PubMed] [Google Scholar]
- 9.Fried D; Glena RE; Featherstone JDB; Seka W Nature of light scattering in dental enamel and dentin at visible and near-infrared wavelengths, Appl. Optics 1995, 34, 1278 [doi: 10.1364/AO.34.001278]. [DOI] [PubMed] [Google Scholar]
- 10.Fried D; Featherstone JDB; Darling CL; Jones RS; Ngaotheppitak P; Bühler CM Early caries imaging and monitoring with near-infrared light, Dental Clinics of North America 2005, 49, 771–793 [doi: 10.1016/j.cden.2005.05.008]. [DOI] [PubMed] [Google Scholar]
- 11.Nyvad B et al. , Construct and predictive validity of clinical caries diagnostic criteria assessing lesion activity, J. Dent. Res, 2003, 82, 117–122. [DOI] [PubMed] [Google Scholar]
- 12.Benson PE; Pender N; Higham SM Quantifying enamel demineralization from teeth with orthodontic brackets--a comparison of two methods. Part 2: validity, Eur. J. Orthodont 2003, 25, 159–165 [doi: 10.1093/ejo/25.2.159]. [DOI] [PubMed] [Google Scholar]
- 13.Lussi A; Hibst R; Paulus R DIAGNOdent: An Optical Method for Caries Detection, J. Dent. Res 2004, 83, 80–83 [doi: 10.1177/154405910408301s16]. [DOI] [PubMed] [Google Scholar]
- 14.Jones GC; Jones RS; Fried D Transillumination of interproximal caries lesions with 830-nm light, 2004, 5313, 17–22 [doi: 10.1117/12.539289]. [DOI] [Google Scholar]
- 15.Fercher AF; Hitzenberger CK; Kamp G; El-Zaiat SY Measurement of intraocular distances by backscattering spectral interferometry, 1995, 117, 43–48 [doi: 10.1016/0030-4018(95)00119-S]. [DOI] [Google Scholar]
- 16.Hee MR; Huang D; Swanson EA; Fujimoto JG Polarization-sensitive low-coherence reflectometer for birefringence characterization and ranging, J. Opt. Soc. Am. B 1992, 9, 903–0. [Google Scholar]
- 17.de Boer JF; Milner TE; Nelson JS Determination of the depth-resolved Stokes parameters of light backscattered from turbid media by use of polarization-sensitive optical coherence tomography, Opt. Lett 1999, 24, 300–302 [DOI] [PubMed] [Google Scholar]
- 18.Manesh SK; Darling CL; Fried D Polarization-sensitive optical coherence tomography for the nondestructive assessment of the remineralization of dentin, J. Biomed. Opt 2009, 14, 44002 [doi: 10.1117/1.3158995]. [DOI] [PubMed] [Google Scholar]
- 19.Lee C; Darling CL; Fried D Polarization-sensitive optical coherence tomographic imaging of artificial demineralization on exposed surfaces of tooth roots, Dent. Mater 2009, 25, 721–728 [doi: 10.1016/j.dental.2008.11.014]. [DOI] [PMC free article] [PubMed] [Google Scholar]
- 20.Le MH; Darling CL; Fried D Automated analysis of lesion depth and integrated reflectivity in PS-OCT scans of tooth demineralization, Laser. Surg. Med 2010, 42, 62–68 [doi: 10.1002/lsm.20862]. [DOI] [PMC free article] [PubMed] [Google Scholar]
- 21.Lee RC; Kang H; Darling CL; Fried D Automated assessment of the remineralization of artificial enamel lesions with polarization-sensitive optical coherence tomography, Biomed. Opt. Express 2014, 5, 2950 [doi: 10.1364/BOE.5.002950]. [DOI] [PMC free article] [PubMed] [Google Scholar]
- 22.Lussi A; Imwinkelried S; Pitts NB; Longbottom C; Reich E Performance and Reproducibility of a Laser Fluorescence System for Detection of Occlusal Caries in vitro, Caries Res. 1999, 33, 261–266 [doi: 10.1159/000016527]. [DOI] [PubMed] [Google Scholar]
- 23.Stookey GK Quantitative Light Fluorescence: A Technology for Early Monitoring of the Caries Process, Dental Clinics of North America 2005, 49, 753–770 [doi: 10.1016/j.cden.2005.05.009]. [DOI] [PubMed] [Google Scholar]
- 24.Shi XQ; Tranaeus S; Angmar-Mansson B Comparison of QLF and DIAGNOdent for quantification of smooth surface caries, Caries Res. 2001, 35, 21–26 [doi: 10.1159/000047426]. [DOI] [PubMed] [Google Scholar]
- 25.Zakian CM; Taylor AM; Ellwood RP; Pretty IA Occlusal caries detection by using thermal imaging, J. Dent 2010, 38, 788–795 [doi: 10.1016/j.jdent.2010.06.010]. [DOI] [PubMed] [Google Scholar]
- 26.Kaneko K; Matsuyama K; Nakashima S Quantification of early carious enamel lesions by using an infrared camera, Proc. the 4th Annual Indiana Conference: Early Detection of dental caries II 1999, Indianapolis, IN, 83–99. [Google Scholar]
- 27.Zakian C; Pretty I; Ellwood R Near-infrared hyperspectral imaging of teeth for dental caries detection, J. Biomed. Opt 2009, 14, 64047 [doi: 10.1117/1.3275480]. [DOI] [PubMed] [Google Scholar]
- 28.Buhler C; Ngaotheppitak P; Fried D Imaging of occlusal dental caries (decay) with near-IR light at 1310-nm, Opt. Express 2005, 13, 573–582 [doi: 10.1364/opex.13.000573]. [DOI] [PubMed] [Google Scholar]
- 29.Söchtig F; Hickel R; Kühnisch J Caries detection and diagnostics with near-infrared light transillumination: clinical experiences, Quintessence International 2014, 45, 531–538 [doi: 10.3290/j.qi.a31533]. [DOI] [PubMed] [Google Scholar]
- 30.Lee RC; Darling CL; Fried D Assessment of remineralization via measurement of dehydration rates with thermal and near-IR reflectance imaging, J. Dent 2015, 43, 1032–1042 [doi: 10.1016/j.jdent.2015.03.005]. [DOI] [PMC free article] [PubMed] [Google Scholar]
- 31.Chang NN; Jew JM; Simon JC; Chen KH; Lee RC; Fried WA; Cho J; Darling CL; Fried D Influence of multi-wavelength laser irradiation of enamel and dentin surfaces at 0.355, 2.94, and 9.4 μm on surface morphology, permeability, and acid resistance, Laser. Surg. Med 2017, 49, 913–927 [doi: 10.1002/lsm.22700]. [DOI] [PMC free article] [PubMed] [Google Scholar]
- 32.Lee RC; Darling CL; Staninec M; Ragadio A; Fried D Activity assessment of root caries lesions with thermal and near-IR imaging methods, J. Biophotonics 2017, 10, 433–445 [doi: 10.1002/jbio.201500333]. [DOI] [PMC free article] [PubMed] [Google Scholar]
- 33.Lee RC; Staninec M; Le O; Fried D Infrared Methods for Assessment of the Activity of Natural Enamel Caries Lesions, IEEE J. Sel. Top. Quant 2016, 22, 102–110 [doi: 10.1109/JSTQE.2016.2542481]. [DOI] [PMC free article] [PubMed] [Google Scholar]
- 34.Ekstrand KR; Zero DT; Martignon S; Pitts NB Lesion activity assessment, Monographs in Oral Science 2009, 21, 63–90. [DOI] [PubMed] [Google Scholar]
- 35.Kidd EA The histopathology of enamel caries in young and old permanent teeth, British Dental Journal, 1983, 155, 196–198. [DOI] [PubMed] [Google Scholar]