

Abstract
Dental fluorosis is an increasing problem in the U.S. due to excessive exposure to fluoride from the environment. Fluorosis causes hypomineralization of the enamel during tooth development and mild fluorosis is visible as faint white lines on the tooth surface while the most severe fluorosis can result in pitted surfaces. It is difficult to quantify the severity of fluorosis and assessments are limited to subjective visual assessments. Dental fluorosis appears with very high contrast at short wavelength infrared (SWIR) wavelengths beyond 1400-nm and we hypothesize that these wavelengths may be better suited for detecting mild fluorosis and for estimating the severity. In this study the contrast of fluorosis of varying severity on extracted human permanent teeth was measured at SWIR wavelengths ranging from 1300–2000-nm using an extended range InGaAs camera and broadband light sources. Cross polarization optical coherence tomography was used to measure the depth of hypomineralization.
Keywords: dental fluorosis, SWIR imaging, optical coherence tomography
1. INTRODUCTION
With the increase of fluoride use, the prevalence of dental caries has been reduced, but fluorosis has become a growing problem. Fluorosis is the hypomineralization of enamel due to fluoride ingestion during tooth development (first 6 years of life for most permanent teeth). Enamel fluorosis is characterized by greater surface and subsurface porosity [1]. Severe fluorosis can be readily distinguished, but the more common mild fluorosis can be easily mistaken for early enamel demineralization due to caries. Since fluorosis appears on areas of the tooth that are not common plaque accumulation sites such as tooth facial or buccal surfaces, white areas on those surfaces are assumed to be hypomineralization. The CDC published a report in August 2005 showing a 9% higher prevalence of fluorosis in American children than was found in a similar study 20 years ago [2]. Currently, fluorosis is scored based on color and tooth morphology commonly using the Thylstrup-Fejerskov (TF) index or Dean’s Fluorosis Index [1]. Most cases of fluorosis can be identified using these criteria. However, it has not been confirmed that the pattern and distribution of the lesions due to fluorosis are a unique occurrence. Angmar-Mansson et al [3] researched several optical techniques for improving the assessment of dental fluorosis. Mild enamel fluorosis is characterized clinically by diffuse opacities [3]. The appearance is due to optical properties of a subsurface or surface porous layer with lower mineral content. These areas usually have texture and color similar to those of initial caries lesions but generally another shape and location [3]. Quantitative light-induced fluorescence (QLF) has been used as a potential diagnostic tool for fluorosis since the subsurface porosities scatter light in a similar manner to demineralized carious lesions [4]. McGrady et al. [5, 6] employed QLF in an epidemiological fluorosis survey in fluoridated and non-fluoridated communities in England and Thailand. In the epidemiological fluorosis survey carried out by McGrady et al. [5] using QLF, extrinsic stain was the most common confounding factor identified. Since images acquired using SWIR reflectance measurements are free of interference from stains beyond 1150-nm the lesion contrast may provide a more quantitative measure of demineralization which may be advantageous for screening large numbers of teeth in epidemiological studies. Hirasuna et al. [7] reported SWIR images and PS-OCT images of teeth at 1300 nm with fluorosis and showed that these methods can be used to characterize hypomineralization or developmental defects. OCT is ideally suited for measuring the subsurface structure of fluorotic lesions for quantifying their severity. OCT measurements of the subsurface structure of fluorotic lesions are also useful for clinical diagnosis and treatment. Measurements of the depth of hypomineralization with OCT can inform the clinician whether physical or chemical abrasion of the lesion for aesthetic reasons is likely to be successful without removing an excessive thickness of enamel. For example, if the OCT scan shows that the area of hypomineralization is quite severe and penetrates more than halfway through the enamel, it is likely that removal would result in excessive loss of tooth structure and should not be attempted. OCT measurements of the zone of higher mineral content can also be used to assess the susceptibility of the fluorotic lesion to further erosion and decay. Lesions with a thick transparent surface zone are likely more resistant to further erosion, decay and cavitation than lesions in which the hypomineralized body of the fluorotic lesion is exposed at the tooth surface.
SWIR reflectance imaging has been exploited for caries detection because sound enamel is transparent in the SWIR and the scattering coefficient increases significantly with increasing mineral loss [8–15]. Zakian et al. [16] carried out SWIR reflectance measurements from 1000–2500 nm using a hyperspectral imaging system and showed that the reflectance from sound tooth structure decreases at longer wavelengths where water absorption is higher. Further measurements over the past ten years have shown that the contrast between sound and demineralized enamel continues to increase with increasing wavelength [10, 12] due to the decreasing scattering coefficient of sound enamel [9], increased water absorption and decreased interference from stains [11]. Recent measurements have been extended to 1950 nm where extremely high contrast of demineralization has been observed [9, 11, 17]. The purpose of this study is to measure the contrast of hypomineralization on tooth surfaces at these longer SWIR wavelengths.
2. MATERIALS AND METHODS
2.1. Tooth Samples
Five posterior teeth were collected with fluorosis on the buccal and lingual surfaces. Teeth were collected from patients in the San Francisco Bay area with approval from the UCSF Committee on Human Research. The teeth were sterilized using gamma radiation and stored in 0.1% thymol solution to maintain tissue hydration and prevent bacterial growth. Samples were mounted in black orthodontic resin in order to facilitate repeatable imaging angle and orientation.
2.2. Cross Polarization Optical Coherence Tomography (CP-OCT)
The cross-polarization OCT system used for this study was purchased from Santec (Komaki, Aichi, Japan). This system acquires only cross polarization images (CP-OCT), not both the cross and co-polarization images (PS-OCT). The Model IVS-3000-CP utilizes a swept laser source; Santec Model HSL-200-30 operating with a 30 kHz a-scan sweep rate. The Mac-Zehnder interferometer is integrated into the handpiece which also contains the microelectromechancial (MEMS) scanning mirror and the imaging optics. It is capable of acquiring complete tomographic images of a volume of 6 × 6 × 7 mm in approximately 3 seconds. The body of the handpiece is 7 × 18 cm with an imaging tip that is 4 cm long and 1.5 cm across. This system operates at a wavelength of 1321-nm with a bandwidth of 111-nm with a measured resolution in air of 11.4 μm (3 dB). The lateral resolution is 80-μm (1/e2) with a transverse imaging window of 6 mm × 6 mm and a measured imaging depth of 7-mm in air. The polarization extinction ratio was measured to be 32 dB.
2.3. Visible/Color Images
A USB digital microscope, Model 5MP Edge AM7915MZT, AnMO Electronics Corp. (New Taipei City,Taiwan) equipped with a visible polarizer was use used to acquired visible images of all samples. The digital microscope captures 5 mega-pixel (2952 × 1944) color images. Eight white LED lights contained in the camera illuminate the sample and a single polarization element is utilized to reduce glare.
2.4. SWIR Reflectance Measurements
Samples were stored in a moist environment to preserve internal hydration and the samples were immersed in a water bath before mounting and performing measurements. A computer-controlled air nozzle with a 1 mm aperture and an air pressure set to 25 psi was positioned 4 cm away at a 20° angle above the sample plane as shown in Fig. 1.
Fig. 1.
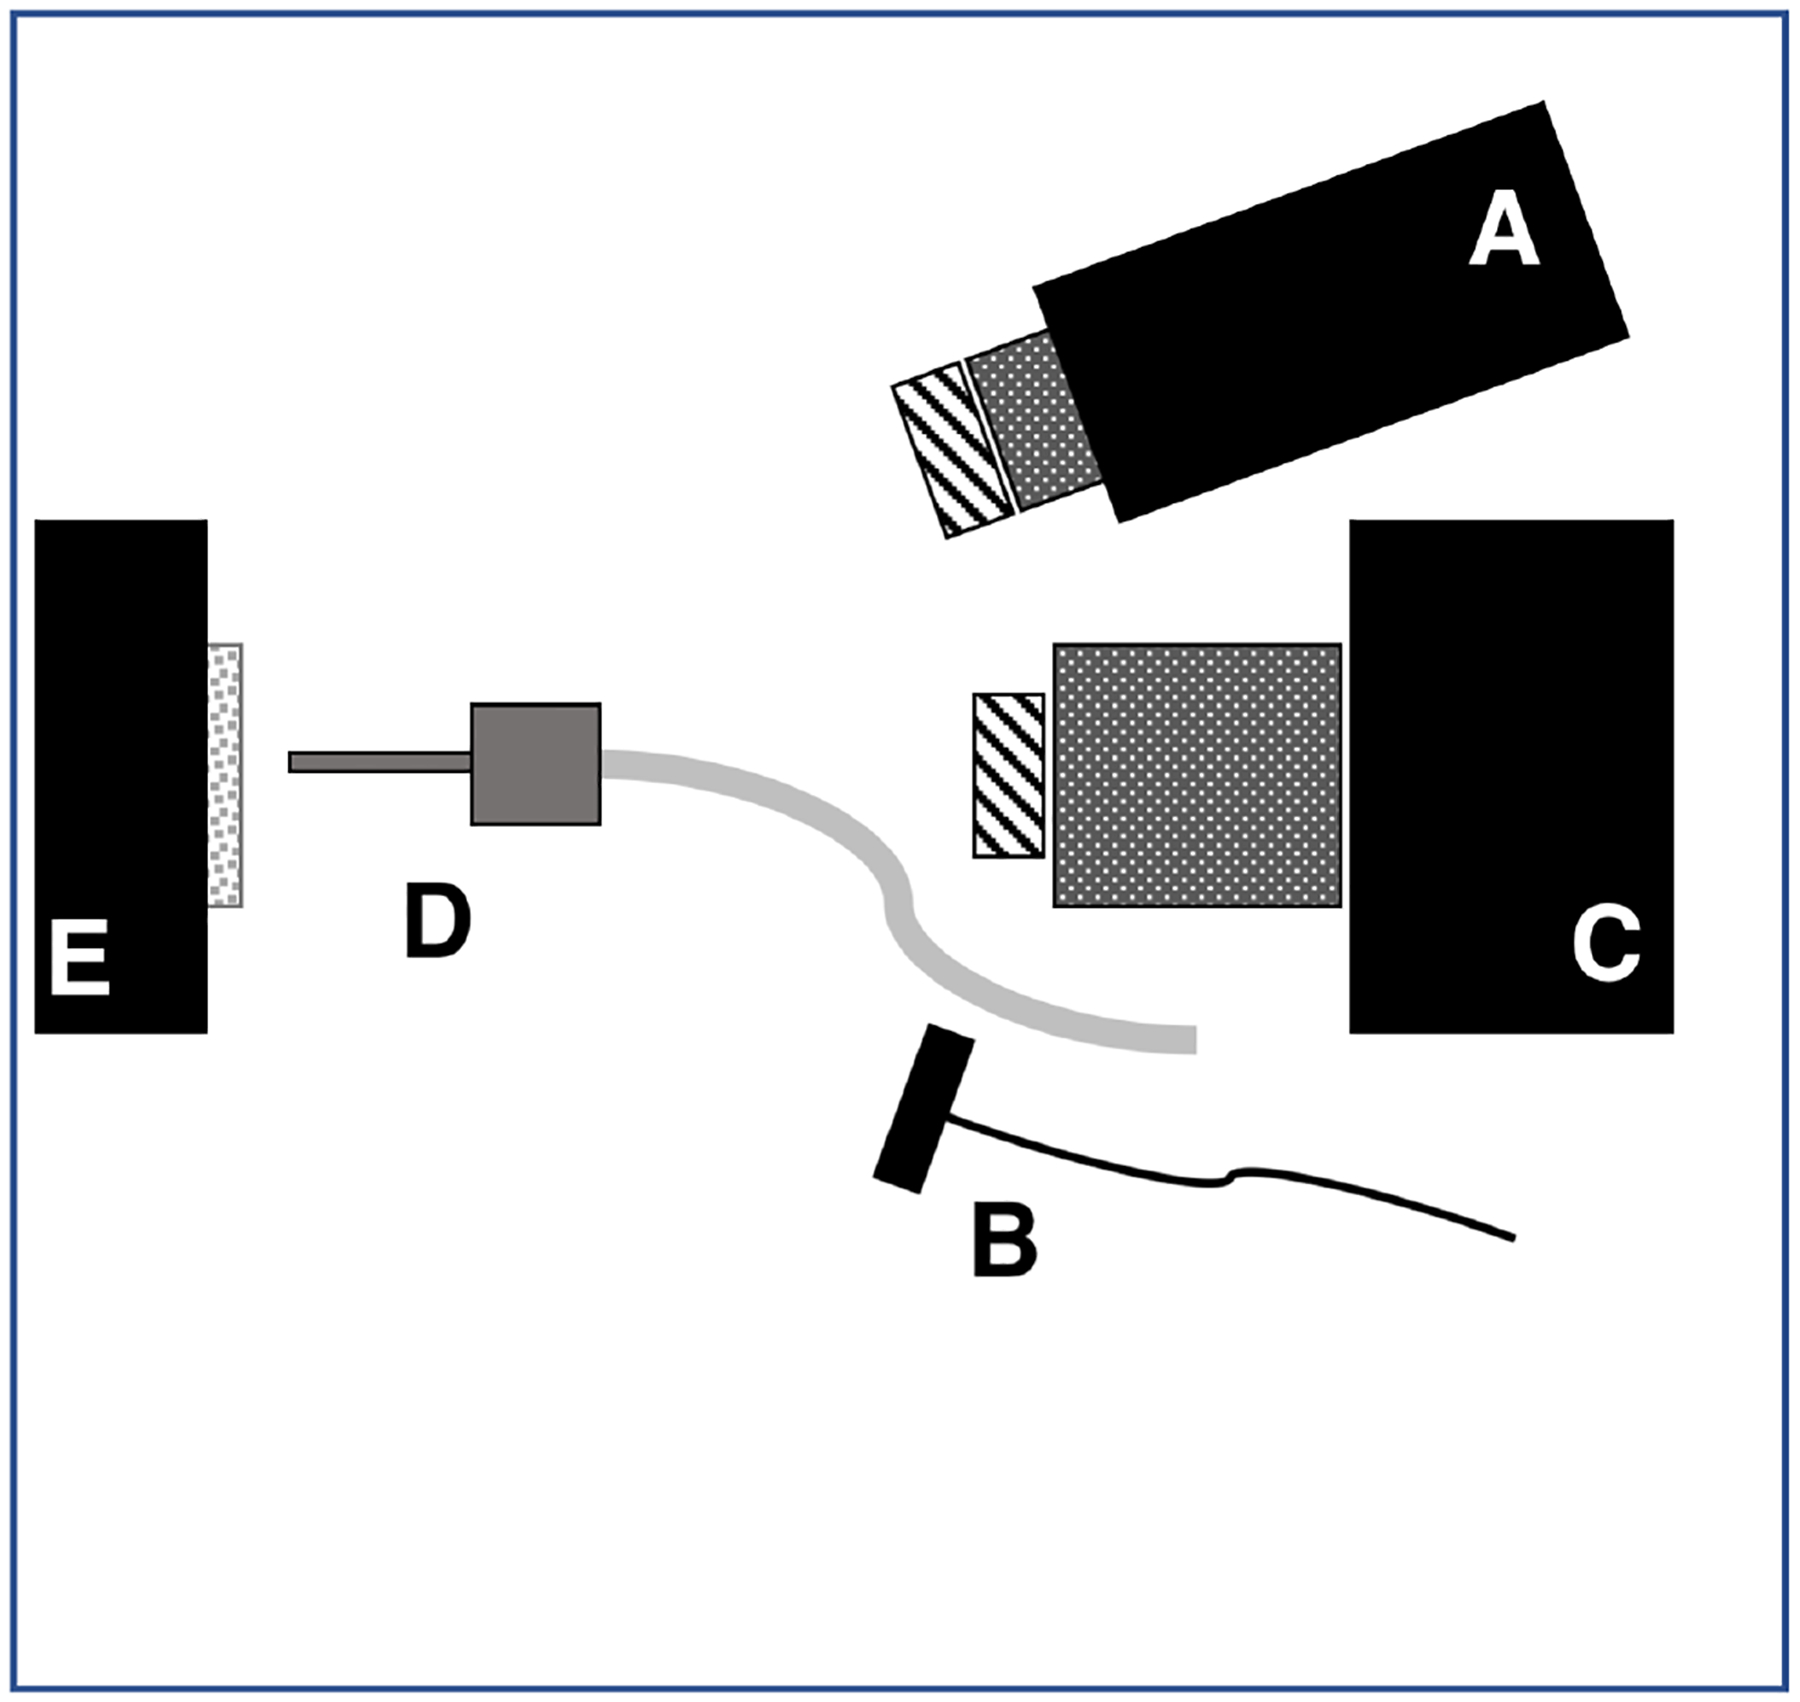
Schematic of the experimental setup showing (A) tungsten-halogen light source with bandpass filters, collimating lens and polarizer, (B) polarized 1950-nm fiber optic light source, (C) Xenics extended range InGaAs camera with lens and polarizer, (D) air nozzle and (E) tooth samples mounted on XYZ stage. Light sources A & B were positioned on the same side for these measurements.
A Xenics (Leuven, Belgium) Model Xeva-2.35–320 extended range InGaAs camera sensitive from 900–2350 nm (320×240 pixel) was used to acquire the SWIR images. The camera was equipped with a Navitar f=35-mm SWIR optimized (f/1.4) lens and a 60 mm achromat lens was positioned 40 mm from the 35 mm lens. A high extinction polarizer was used to acquire cross polarization images from 1500–2350 nm. The quantum efficiency peaks at 1500 nm near 65% and drops off rapidly to 30% after 1700 nm and drops off again to below 20% after 2000 nm. A Model SLS202 extended wavelength tungsten-halogen light source from Thorlabs (Newton, NJ) with a peak output at 1500 nm and collimating optics and a high extinction polarizer was used. Bandpass filters of varying wavelength (bandwidth) 1300 nm (90), 1460 nm (85), 1535 nm (80), and 1675 nm (90) were used. A polarized, broadband amplified spontaneous emission (ASE) light source Model AP-ASE-2000 from AdValue Photonics (Tucson, AZ) with a center wavelength of 1959 nm and a bandwidth of ~100 nm (−3 dB), 230 nm (−30 dB) and an output power of 11 mW was used for the 1950 nm light source. The light sources were placed at 20° angles to the camera as shown in Fig. 1 but positioned on the same side. Images were processed and automatically analyzed using a dedicated program constructed with LabVIEW software. The contrast of hypomineralization was calculated using (IL − IS) / IL where L represents areas of hypomineralization and S represents sound areas. The contrast varies from 0 to 1 for positive contrast.
2.5. Quantitative Light Fluorescence (QLF)
Quantitative light fluorescence (QLF) images using a USB microscope with 5 blue (480 nm) illumination blue light emitting diodes and a 510-nm longpass filter, Model AM4115TW-GFBW from BigC (Torrance, CA). The same hypomineralization (IL) and sound enamel (Is) areas were measured with QLF. However, QLF utilizes fluorescence loss so the intensity of sound enamel is higher than stained and hypomineralized enamel and the following formula for contrast was used (IS − IL) / IS.
3. RESULTS AND DISCUSSION
Figure 2 shows CP-OCT, visible and SWIR reflectance, and QLF measurements of a tooth with mild fluorosis (hypomineralization). An CP-OCT scan shown in (A) taken at the position of the dashed line in (B) shows the depth of hypomineralization to be more severe near the crown of the tooth. In the visible images the contrast appears similar along the length of enamel (length of dotted line) while in the SWIR images there appears to be large changes in contrast with position from coronal to cervical. The green and red arrows shown in the CP-OCT image (A) and the SWIR image at 1950-nm (D) are directed at two positions that vary markedly in depth and contrast. The red arrow indicates a position where the SWIR contrast is high and the depth of hypomineralization is a maximum in the CP-OCT image while the position indicated by the green arrow shows low SWIR contrast and a shallow depth of hypomineralization in the CP-OCT image. The contrast is very high at SWIR wavelengths due to the decreasing reflectivity of sound hypomineralization enamel and the higher water absorption at 1460 (F) and 1950-nm. Sound areas of the tooth were almost invisible at wavelengths beyond 1535 nm and significant reflectivity from sound areas is only visible at 1300 nm (E). The contrast of hypomineralization is plotted for selected areas on five teeth in Fig. 3 at the five SWIR wavelengths. The highest contrast was at 1950 nm which is the longest wavelength and also the wavelength coincident with the highest water absorption. The second highest contrast was at 1460 nm which is coincident with another water absorption band that is weaker in intensity relative to 1950 nm. The lowest contrast was measured at 1300 nm.
Fig. 2.
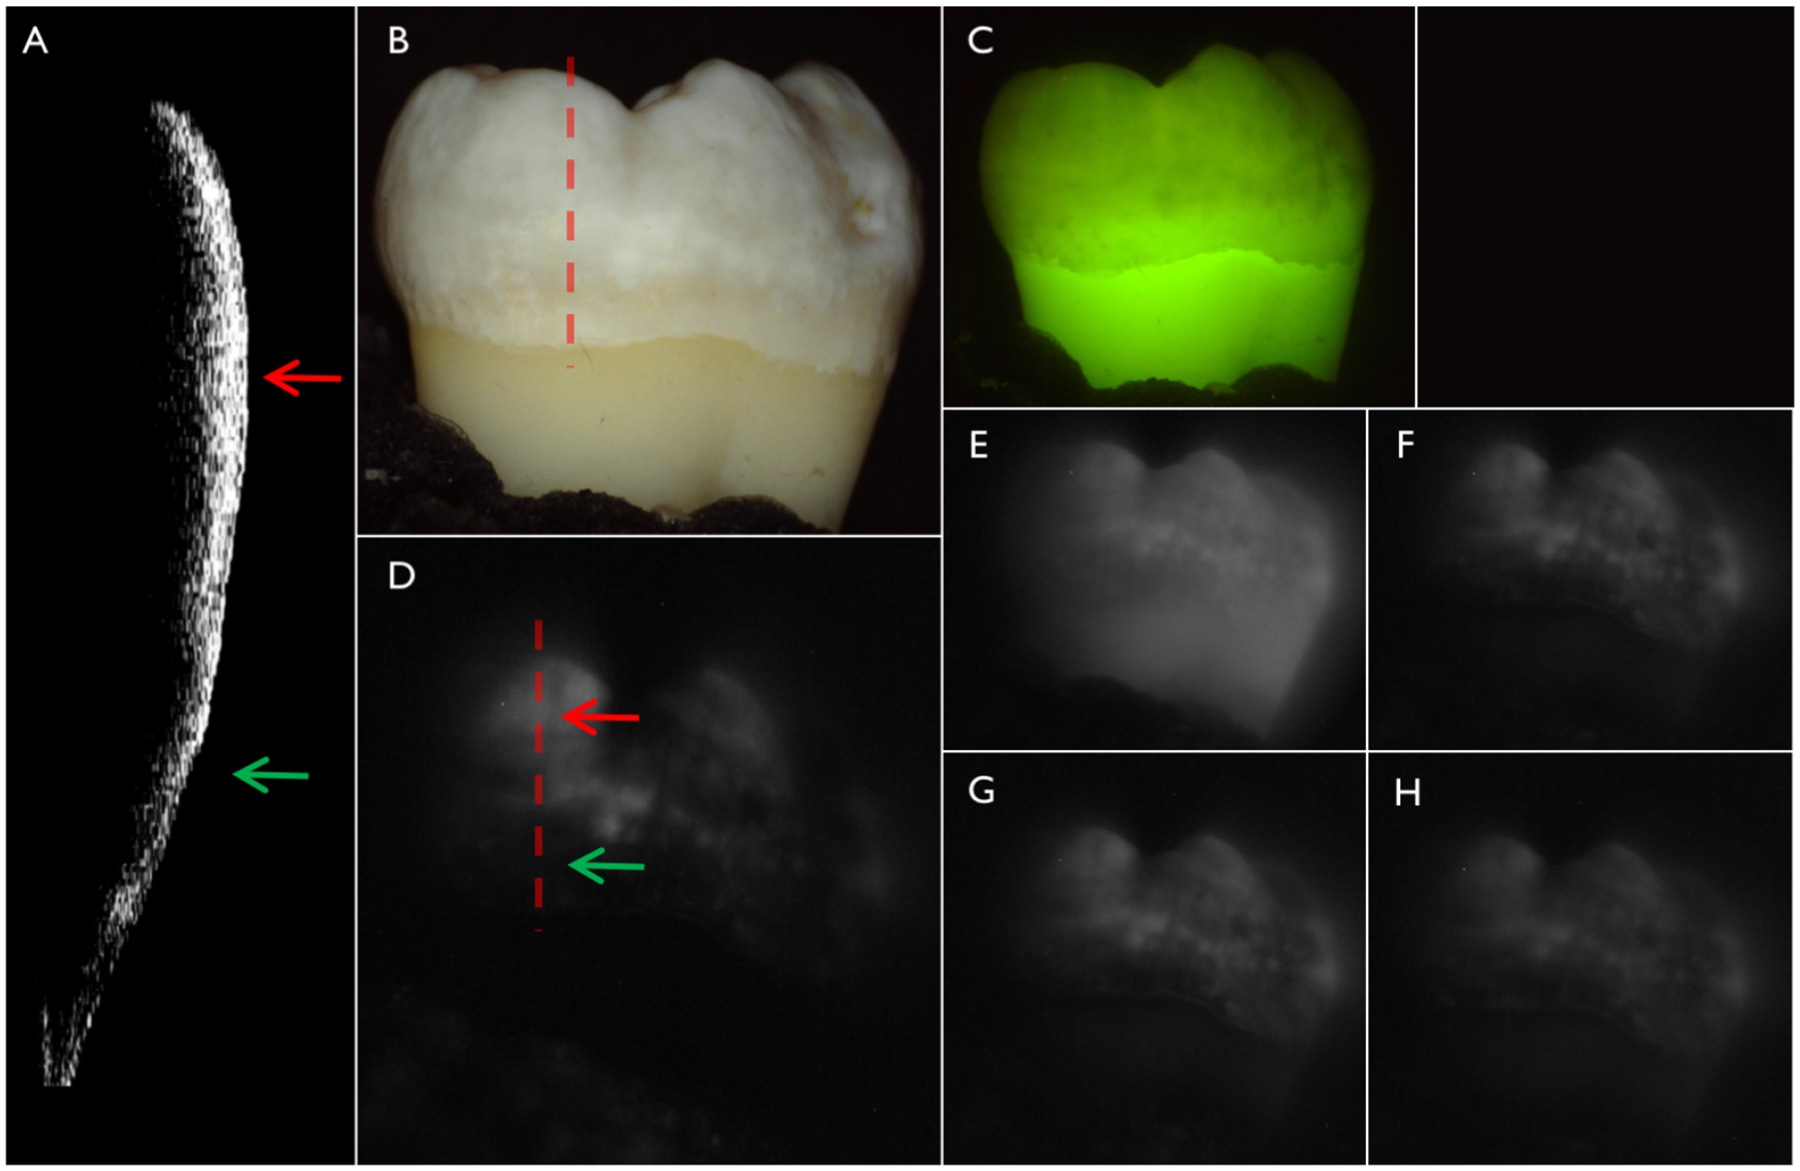
(A) CP-OCT b-scan acquired at the position of the dashed line in the (B) color image of one of the teeth with fluorosis. (C) QLF and cross-polarization SWIR images at (D) 1950, (E) 1300 (F) 1460, (G) 1535 and (H) 1675 nm.
Fig. 3.
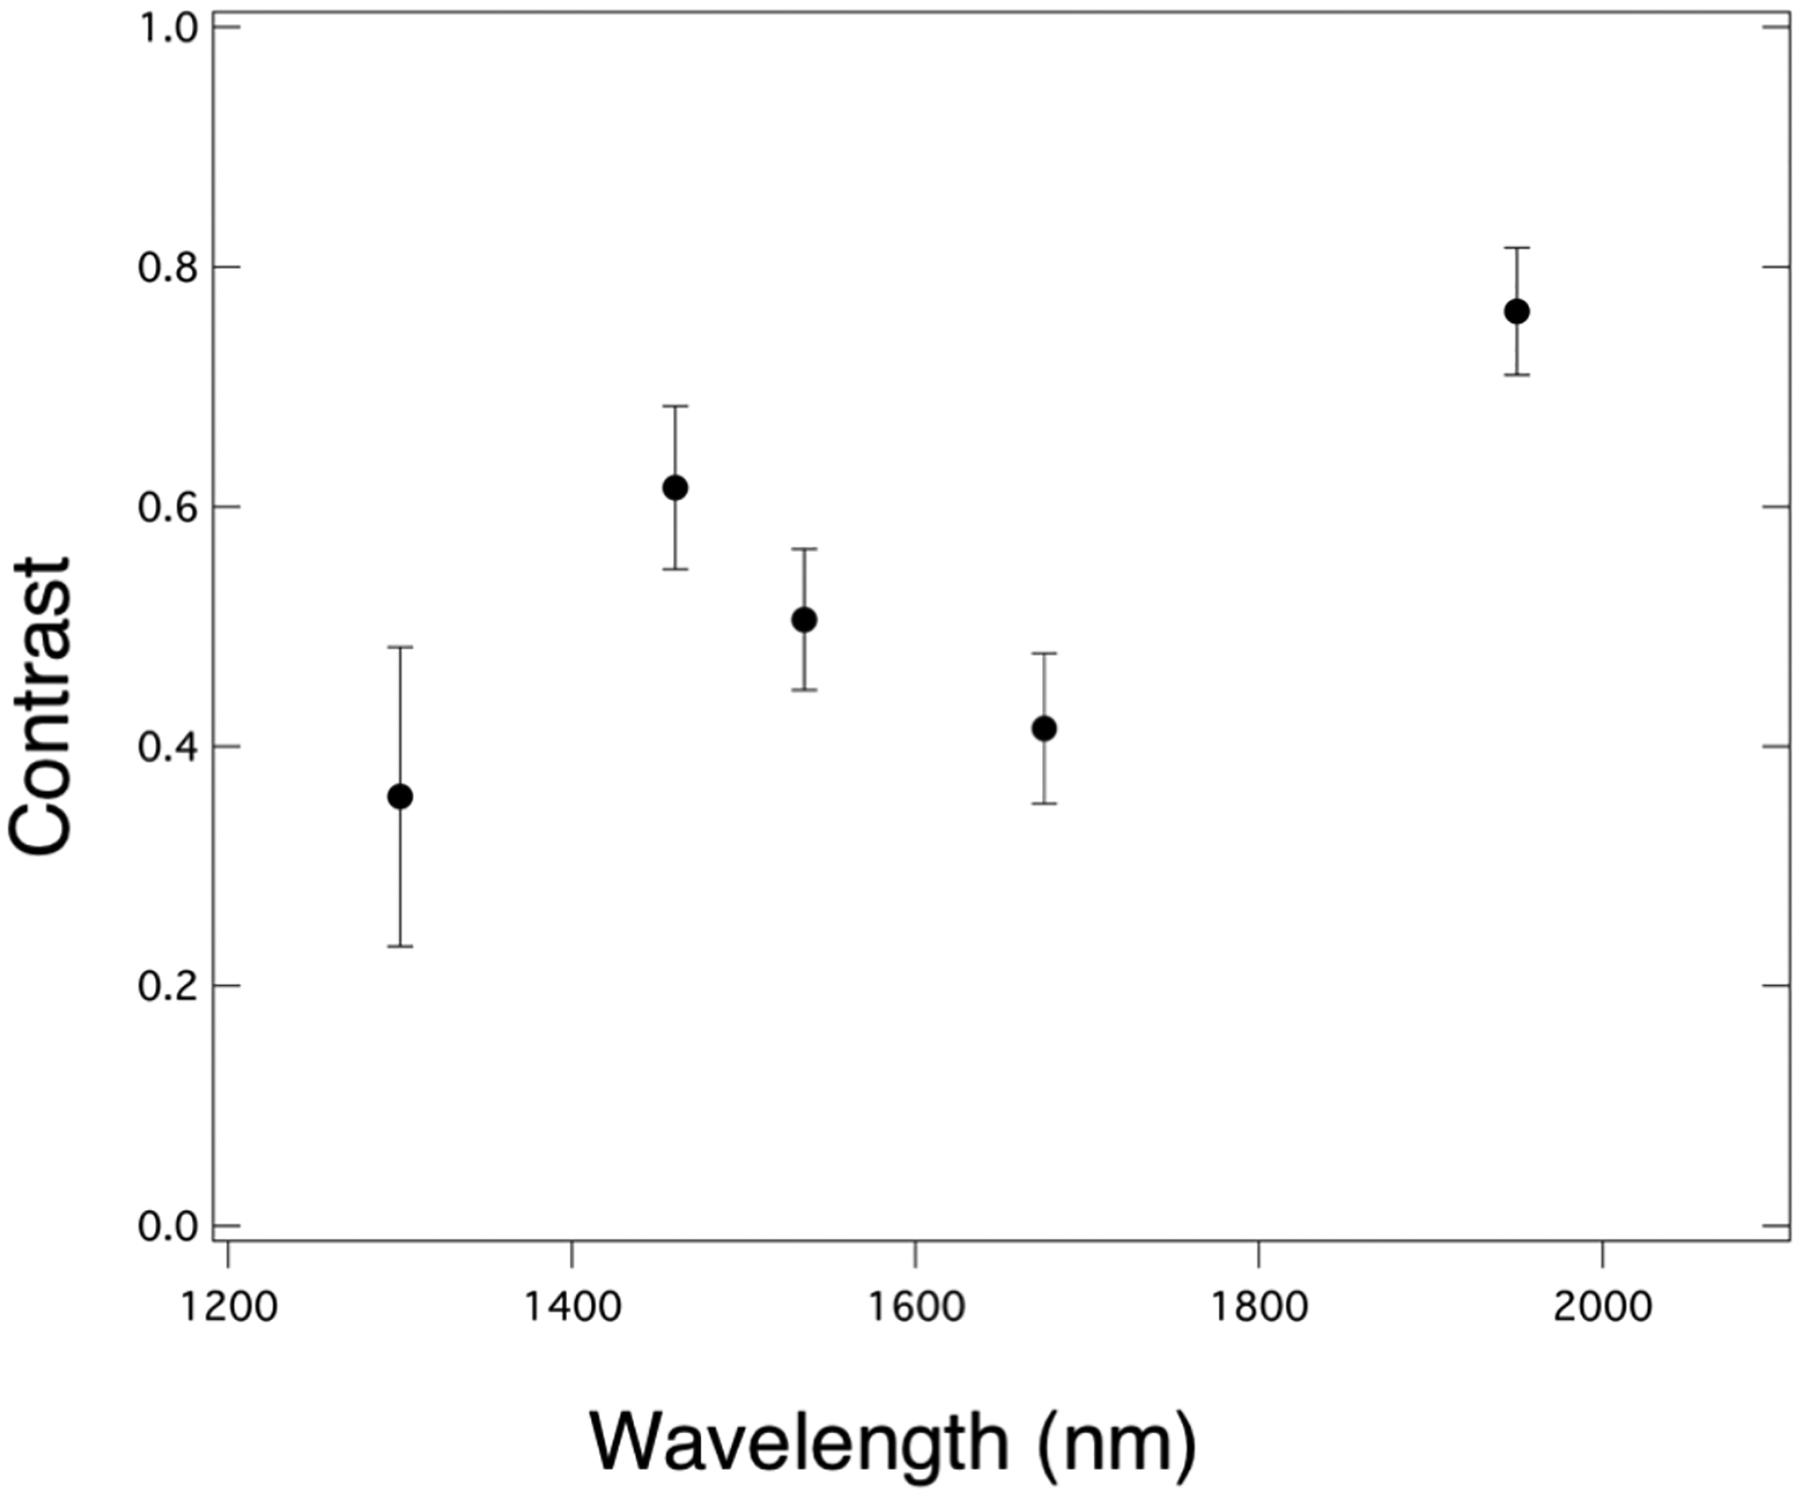
Plot of contrast of hypomineralization mean±S.D. for five teeth with fluorosis versus wavelength.
Methods are needed to enable earlier detection of fluorosis and better quantify the severity of hypomineralization. QLF has been used to enhance the detection of fluorosis and increase the contrast on tooth surfaces [5, 6]. These preliminary measurements show that longer SWIR wavelengths particularly those coincident with water absorption bands greatly increase the contrast of hypomineralization in a similar fashion to tooth demineralization and have considerable promise for this application. The highest contrast was observed for 1950 nm, however it was not much higher than at 1460 nm and both wavelengths could be employed to successful diagnosis. Currently it is easier and less expensive to use devices at 1460 nm than at 1950 nm. More extensive studies are underway to measure the contrast of hypomineralization at these wavelengths and correlate that contrast with the depth of hypomineralization measured with CP-OCT.
4. ACKNOWLEDGEMENTS
The authors would like to acknowledge the help of John Tressel and Yihua Zhu and support from NIDCR/NIH grants R01-DE0228295 and F30-DE026052.
5. REFERENCES
- [1].Fejerskov O, Nyvad B, and Kidd E, Dental Caries: The Disease and its Clinical Management Wiley Blackwell, (2015).
- [2].Beltran-Aguilar ED, Barker LK, Canto MT, Dye BA, Gooch BF, Griffin SO, Hyman J, Jaramillo F, Kingman A, Nowjack-Raymer R, Selwitz RH, and Wu T, “Surveillance for dental caries, dental sealants, tooth retention, edentulism, and enamel fluorosis--United States, 1988–1994 and 1999–200,” MMWR Surveill Summ, 54(3), 1–43 (2005). [PubMed] [Google Scholar]
- [3].Angmar-Mansson B, de Josselin de Jong E, Sundstrom F, and ten Bosch JJ, “Strategies for improving the assessment of dental fluorosis: focus on optical techniques,” Adv Dent Res, 8(1), 75–9 (1994). [DOI] [PubMed] [Google Scholar]
- [4].Li SM, Zou J, Wang Z, Wright JT, and Zhang Y, “Quantitative assessment of enamel hypomineralization by KaVo DIAGNOdent at different sites on first permanent molars of children in China,” Pediatr Dent, 25(5), 485–90 (2003). [PubMed] [Google Scholar]
- [5].McGrady MG, Ellwood RP, Taylor A, Maguire A, Goodwin M, Boothman N, and Pretty IA, “Evaluating the use of fluorescent imaging for the quantification of dental fluorosis,” BMC Oral Health, 12, 47 (2012). [DOI] [PMC free article] [PubMed] [Google Scholar]
- [6].Pretty IA, McGrady M, Zakian C, Ellwood RP, Taylor A, Sharif MO, Iafolla T, Martinez-Mier EA, Srisilapanan P, Korwanich N, Goodwin M, and Dye BA, “Quantitative light fluorescence (QLF) and polarized white light (PWL) assessments of dental fluorosis in an epidemiological setting,” BMC Public Health, 12, 366 (2012). [DOI] [PMC free article] [PubMed] [Google Scholar]
- [7].Hirasuna K, Fried D, and Darling CL, “Near-IR imaging of developmental defects in dental enamel.,” J Biomed Opt, 13(4), 044011:1–7 (2008). [DOI] [PubMed] [Google Scholar]
- [8].Darling CL, Huynh GD, and Fried D, “Light Scattering Properties of Natural and Artificially Demineralized Dental Enamel at 1310-nm,” J Biomed Optics, 11(3), 034023 (2006). [DOI] [PubMed] [Google Scholar]
- [9].Chan KH, and Fried D, “Multispectral cross-polarization reflectance measurements suggest high contrast of demineralization on tooth surfaces at wavelengths beyond 1300-nm due to reduced light scattering in sound enamel ” J Biomed Opt, 23(6), 060501 (2018). [DOI] [PMC free article] [PubMed] [Google Scholar]
- [10].Chung S, Fried D, Staninec M, and Darling CL, “Multispectral near-IR reflectance and transillumination imaging of teeth ” Biomed Opt Express, 2(10), 2804–2814 (2011). [DOI] [PMC free article] [PubMed] [Google Scholar]
- [11].Ng C, Almaz EC, Simon JC, Fried D, and Darling CL, “Near-infrared imaging of demineralization on the occlusal surfaces of teeth without the interference of stains,” J Biomed Optics, 24(3), 036002 (2019). [DOI] [PMC free article] [PubMed] [Google Scholar]
- [12].Fried WA, Chan KH, Fried D, and Darling CL, “High Contrast Reflectance Imaging of Simulated Lesions on Tooth Occlusal Surfaces at Near-IR Wavelengths,” Lasers Surg Med, 45(8), 533–541 (2013). [DOI] [PMC free article] [PubMed] [Google Scholar]
- [13].Simon JC, Chan KH, Darling CL, and Fried D, “Multispectral near-IR reflectance imaging of simulated early occlusal lesions: variation of lesion contrast with lesion depth and severity,” Lasers Surg Med, 46(3), 203–15 (2014). [DOI] [PMC free article] [PubMed] [Google Scholar]
- [14].Simon JC, Lucas SA, Lee RC, Staninec M, Tom H, Chan KH, Darling CL, and Fried D, “Near-IR Transillumination and Reflectance Imaging at 1300-nm and 1500–1700-nm for in vivo Caries Detection,” Lasers Surg Med, 48(6), 828–836 (2016). [DOI] [PMC free article] [PubMed] [Google Scholar]
- [15].Wu J, and Fried D, “High contrast near-infrared polarized reflectance images of demineralization on tooth buccal and occlusal surfaces at lambda = 1310-nm,” Lasers Surg Med, 41(3), 208–13 (2009). [DOI] [PMC free article] [PubMed] [Google Scholar]
- [16].Zakian C, Pretty I, and Ellwood R, “Near-infrared hyperspectral imaging of teeth for dental caries detection,” J Biomed Opt, 14(6), 064047–7 (2009). [DOI] [PubMed] [Google Scholar]
- [17].Fried WA, Abdellaziz M, Darling CL, and Fried D, “High Contrast Reflectance Imaging of Enamel Demineralization and Remineralization at 1950-nm for the Assessment of Lesion Activity,” Lasers Surg Med, in press (2021). [DOI] [PMC free article] [PubMed] [Google Scholar]