

Summary
Flexibly adapting to novel situations is critical for survival, which is impaired in neuropsychiatric disorders1. Thus, understanding whether and how novelty prepares, or primes, brain circuitry to facilitate cognitive flexibility has important translational relevance. Novelty recruits the hippocampus and medial prefrontal cortex (mPFC)2 and may prime hippocampal-prefrontal circuitry for subsequent learning-associated plasticity. We find that novelty resets ventral hippocampal-prefrontal (vHPC-mPFC) circuitry and facilitates overcoming an established strategy. Exposing mice to novelty disrupted a previously encoded strategy by reorganizing vHPC activity to local theta (4–12 Hz) oscillations and weakening existing vHPC-mPFC connectivity. As mice subsequently adapted to a new task, vHPC neurons developed new task-associated activity, vHPC-mPFC connectivity was strengthened, and mPFC neurons updated encoding with new rules. Without novelty, mice adhered to their established strategy. Blocking dopamine D1-receptors (D1Rs) or inhibiting novelty-tagged cells expressing D1Rs in the vHPC prevented these behavioral and physiological effects of novelty. Further, D1R activation mimicked the effects of novelty. These results suggest that novelty promotes adaptive learning by D1R-mediated resetting of vHPC-mPFC circuitry, thereby enabling learning-associated circuit plasticity.
Spatial learning induces activity-dependent circuit plasticity (or functional connectivity changes), strengthening vHPC-mPFC connectivity3 and supporting improved performance4,5. However, strong pre-learning hippocampal-prefrontal connectivity impairs adaptation to new tasks6–8, while disrupting pre-existing theta-frequency connectivity enhances performance9,10. Synaptic depression facilitates learning new rules11–13, while inducing long-term potentiation (LTP) blocks subsequent learning8,14. Furthermore, LTP-expressing synapses cannot be further potentiated, while low-frequency theta stimulation de-potentiates existing LTP, allowing subsequent LTP induction15,16. We hypothesized that weakening established circuit connectivity might increase learning capacity by permitting subsequent learning-associated plasticity. To test this hypothesis, we examined how novelty, which induces synaptic depression17,18, impacts vHPC-mPFC circuitry during adaptive spatial learning.
Novelty facilitates learning
Cognitive challenges often involve updating old routines. We tested this capacity to modify an existing strategy by training mice to freely choose either arm of a T-shaped maze for rewards (Free Choice; Fig. 1a). Over 3 days, mice developed the efficient strategy of choosing one arm consistently (Fig. 1b). Then, in the same maze, the mice underwent Flexible Choice training (Fig 1a), which required them to flexibly choose a goal in a delayed-non-match-to-sample task (Fig. 1c). Successfully performing this new task required the mice to overcome their established arm bias. Learning across training was assessed by a logistic regression model learning curve. Under control conditions, mice did not fully overcome their bias (Fig. 1c) but did gradually improve performance over 40 trials of training (Fig. 1d).
Figure 1 |. Novel experience enhances learning.

a, Experimental design. b, Mice (n = 10) established an arm bias after Free Choice sessions (t-test, t(9) = 8, P < 0.0001). c, Mice underperformed when rewards were on their non-biased side during Flexible Choice training (F(1,18) = 25.4, P < 0.0001). d, Mice performed below chance level measured with a logistic regression model learning curve. e, Arm type-dependent performance during Flexible Choice training. (Novel: 17, familiar: 20 mice; trial X group, biased goal: F(19,665) = 0.8, P = 0.7, non-biased goal: F(19,665) = 3.5, P < 0.0001). f, Learning curve (logistic regression model; F(39,1365) = 2.4, P < 0.0001). The average inflection point (learning trial) was 21 (Novel), and 38 (Familiar) (Mann-Whitney test, P = 0.008). Insets, learning trial of each mouse. g, Learning curve (state-space model; F(2,44) = 15.5, P < 0.0001; Novel vs. Control: P < 0.0001, Novel vs. Familiar: P < 0.0001). h, Day 3 and 4 arm bias (Paired t-test, familiar: t(8) = 0.7, P = 0.5, Novel: t(7) = 0.3, P = 0.8; One-way ANOVA, F(3,30) = 0.2, P = 0.9; n familiar: 9, novel: 8 mice group.). Two-way RM ANOVA test for c, e-g. n.s. not significant. * P < 0.05. *** P < 0.0005. Data are represented as mean ± SEM.
To explore how novelty affects learning, additional mice were exposed to a novel arena19 1 hour before Flexible Choice training. To control for non-novelty related aspects of arena exploration, another group was exposed to a familiar arena that they had previously explored for 3 consecutive days (Fig. 1e). Both groups initially retained their arm bias during Flexible Choice training. However, the novelty-exposed mice progressively overcame this bias, improving their performance more rapidly than familiar-exposed mice on trials in which their arm bias conflicted with the new task (Fig. 1e & f). We estimated the trial at which mice learned the new rule using the learning curve inflection point. On average, the novelty-exposed group learned the rule midway through the session (Trial 21; Fig. 1f). Learning curves for the familiar-exposed group (Fig. 1f) and control group (mice not exposed to any arena; Fig. 1d) did not demonstrate learning. We also used a state-space learning curve model (see Methods) to determine the trial-by-trial probability that mice made the correct choice. Novelty-exposed mice performed better than the other groups (Fig. 1g).
We re-tested a subset of mice in the Free Choice task after Flexible Choice training and found that novelty-exposed mice reverted to consistently choosing one arm in the Free Choice task, indicating that they adaptively use task-specific strategies (Fig. 1h). Next, we asked which aspects of novelty facilitated learning. Novel mouse exposure also enhanced learning (Extended Fig. 1), demonstrating that this effect generalizes across different novel stimuli. In an additional cohort, we induced arousal from sleep or rest one hour before Flexible Choice training. Although, like novelty-exposed animals, these mice remained active until the onset of Flexible Choice training, their task performance was not facilitated (Extended Fig. 1). These convergent measures demonstrate that novelty facilitates new learning.
Novelty resets vHPC-mPFC circuitry
If novelty primes neural circuitry for subsequent learning, it should elicit neural signals that persist for at least 1 hour, the time between novelty exposure and Flexible Choice training. We therefore looked for persistent novelty-induced neural signals (Extended Fig. 2a). We hypothesized that local field potential (LFP) power, which reflects collective local activity20, might show this priming signature. The novel group exhibited higher vHPC theta power during, and 1 hour after arena exposure than the familiar group (Fig. 2a, & Extended Fig. 2b). Additionally, in mice that explored a novel maze for 2 consecutive days, vHPC theta power decreased as the environment became familiar (Extended Fig. 2e, f). Novelty also increased vHPC single-unit entrainment to local theta oscillations, and theta phase-locked cells displayed higher firing rate than non-phase-locked cells (Fig. 2b). Moreover, vHPC units in the novel group preferentially fired at local theta trough (Fig. 2c). These findings indicate that novelty induces persistent theta rhythms that reorganize vHPC activity.
Figure 2 |. Novelty reorganizes vHPC activity patterns.

a, Left, normalized LFP examples. Right, vHPC theta power during novelty (novel: 14, familiar: 16 mice; Mann-Whitney test, P = 0.001). Inset, average theta power of each mouse. b, Left, the ratio of vHPC units phase-locked to local theta oscillations (Chi-square test, P = 0.03; novel: 29, familiar: 26 cells). Right, vHPC unit firing rate in the novel group (Mann-Whitney test, P = 0.04). Cumulative distribution shows all single unit values. c, Left, examples showing normalized theta filtered LFP and vHPC single-unit spikes (ticks). Right, preferred theta phases at which vHPC units fired (Kolmogorov-Smirnov test, P = 0.01). * P < 0.05. ** P < 0.005. Data are represented as mean ± SEM.
Because adapting to new spatial rules requires hippocampal-prefrontal communication7,21 and increased neuronal activity at theta trough (Fig. 2c) causes synaptic depression22, we checked whether novelty weakens vHPC-mPFC functional connectivity. We examined the phase-locking of mPFC single units to vHPC theta oscillations, as phase-locking reflects synaptic connectivity23. Both during arena exposure and 1 hour later, the novel group displayed lower phase-locking than the familiar group (Fig. 3a, & Extended Fig. 3a). We also examined vHPC multiunit activity (MUA)-evoked mPFC single-unit spike firing (Extended Fig. 3b). The novel group exhibited lower vHPC-evoked mPFC unit activity than the familiar group, during and 1 hour after arena exposure (Extended Fig. 3c). To test if this novelty-induced persistent weakening facilitates subsequent learning-dependent connectivity strengthening3, we compared vHPC-mPFC connectivity before and after Flexible Choice trial 21, the average learning point of the novel group. As in pre-training (Fig. 3a), mPFC single unit phase-locking to vHPC theta was lower in the novel than the familiar group during early training (Trials 1–20; P = 0.02). However, both mPFC unit phase-locking to vHPC theta and vHPC MUA-evoked mPFC spike firing increased in late training (Trials 21–40) only in the novel group (Fig. 3b & Extended Fig. 3d). In fact, novel group phase-locking reached familiar group levels (P = 0.1). Novelty particularly impacts vHPC-mPFC circuitry, as dorsal hippocampal-prefrontal (dHPC-mPFC) circuitry displayed neither prolonged novelty signal (Extended Fig. 2c, d, g, h & 3e) nor learning-dependent functional connectivity changes (Extended Fig. 3f). These results indicate that novelty exposure weakens existing vHPC-mPFC synaptic strength, thereby facilitating subsequent learning-associated plasticity.
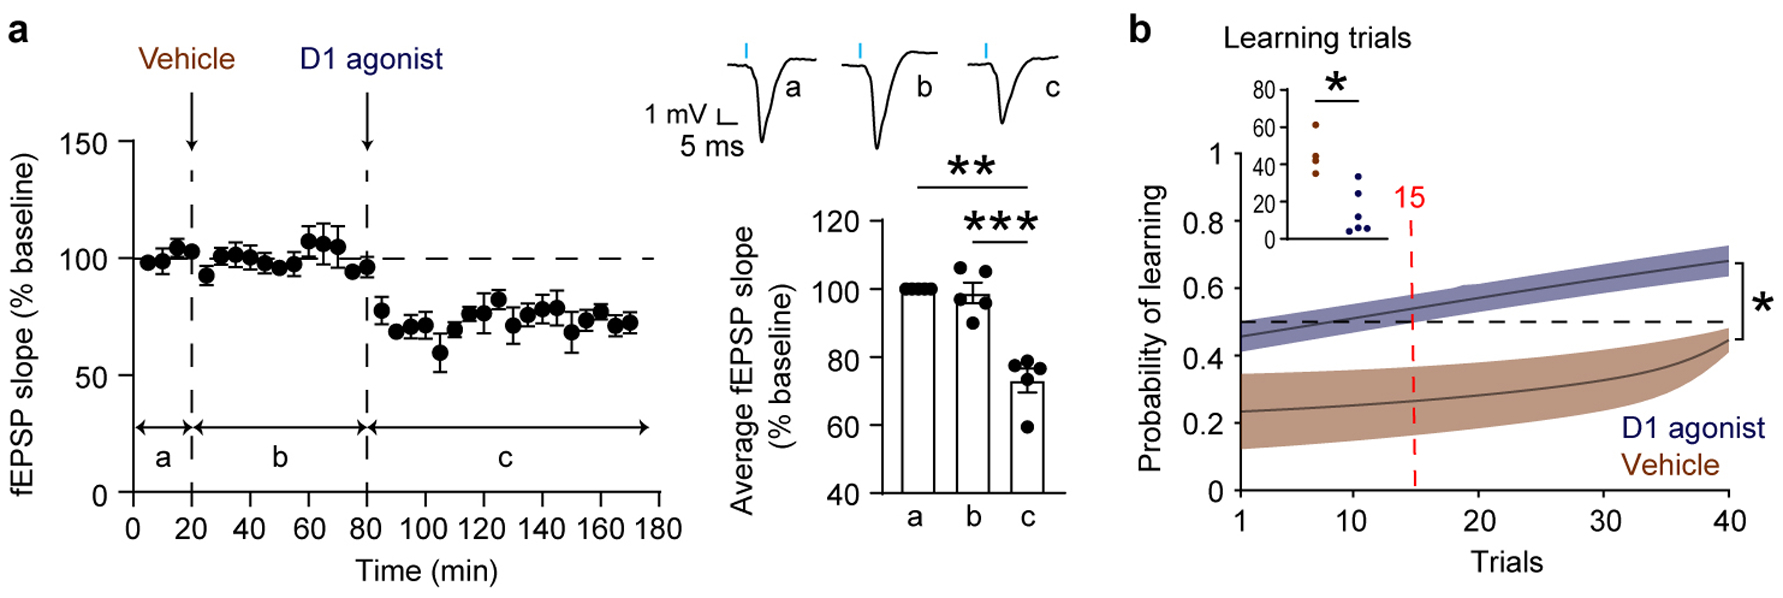
Figure 3 |. Novelty permits vHPC-mPFC circuit plasticity and mPFC information updating.

a & b, Left, Example mPFC unit phase-locking to vHPC theta oscillations. a, Phase-locking strength (novel: 29, familiar: 27 cells; Mann-Whitney test, P = 0.003). b, Phase-locking strength changes through training (novel: 66 cells, P = 0.0008; familiar: 105 cells, P = 0.8). Wilcoxon signed-rank test. c, Optogenetic vHPC terminal stimulation in the mPFC. d, The impact of novelty on vHPC-mPFC fEPSPs (Two-way RM ANOVA test, time X group, F(3,24) = 9.2, P = 0.0003; 5 mice each). Right top, example average fEPSP traces. Right bottom, average fEPSPs. e, Stimulating vHPC terminals immediately after novelty blocked novelty-enhanced learning (ChR group: 5, eGFP group: 6 mice; Two-way RM ANOVA test, F(1,9) = 12.6, P = 0.006). The average learning trials were 17 (eGFP) and 41 (ChR) (Mann-Whitney test, P = 0.008). f, Arm bias and rewarded arm MI changes through training (novel: 66 cells, P < 0.0001 for both; familiar: 105 cells, P = 0.9, and < 0.0001, each). Wilcoxon signed-rank test. The novelty-exposed group increases rewarded arm MI more (Mann-Whitney test, P = 0.01). g, Left, the ratio of mPFC units switching information encoding (same cells numbers as f, Chi-square test, P = 0.0001). Right, changes in phase-locking through training in the novel group. MI switchers (23 cells, P = 0.0001) and non-switchers (43 cells, P = 0.07). Two-way RM ANOVA test, cell type X training phase, F(1,179) = 5.5, P = 0.02. Box plots show median and 95% confidence interval with maximum and minimum. Cumulative distribution shows all single unit values. n.s. not significant. * P < 0.05. ** P < 0.005. *** P < 0.0005. Data are represented as mean ± SEM.
To directly test this hypothesis, we induced plasticity in vivo by optogenetically stimulating vHPC terminals in the mPFC (Fig. 3c). Optical Stimulation (see Methods & Fig. 3e) potentiated vHPC-mPFC synaptic strength. Exposing mice to the novel, but not familiar, arena de-potentiated synaptic strength back to baseline (Fig. 3d). Subsequent stimulation delivered 1 hour after arena exposure re-potentiated vHPC-mPFC synaptic activity in the novel group, yet potentiation remained occluded in the familiar group (Fig. 3d). These findings suggest that novelty facilitates new learning by weakening existing vHPC-mPFC connectivity, opening a window for learning-associated circuit plasticity. Indeed, closing this window by stimulating immediately after novelty blocked subsequent novelty-enhanced learning (Fig. 3e).
Novelty facilitates strategy updating
We assessed task-specific information encoding by training machine learning classifier models on vHPC unit activity in the Free Choice condition. Unit firing patterns were collected during the center arm-run (before turning to the chosen arm) to test whether they predict arm choice (see Methods, Extended Fig. 4). Each mouse had a specific arm bias (see Methods), and the models successfully classified (across all mice) biased vs. non-biased arm trials (Extended Fig. 4a).
To determine whether novelty-induced activity reorganization (Fig. 2b & c) alters this encoding, vHPC unit activity from Flexible Choice trials were tested using models trained on Free Choice data (Extended Fig. 4b). If vHPC unit activity continues to encode the Free Choice strategy, the models should predict biased arm choice during early Flexible Choice trials when both groups maintained their arm bias (Fig. 1e). While the model did so in the familiar group, it performed at chance levels in the novel group (Extended Fig. 4c). Thus, novelty disrupts vHPC unit activity underlying the established Free Choice strategy.
The vHPC may flexibly encode a strategy that predicts future reward. If so, the same classifier that predicted biased arm choice for reward during the Free Choice task would predict choosing the reward arm once mice acquired a Flexible Choice strategy. Indeed, while the models failed to predict reward acquisition in both groups during early training, it predicted reward acquisition in the novel, but not familiar, group during late training (Extended Fig. 4d). These findings demonstrate that novelty facilitates vHPC information updating.
Because direct vHPC inputs to the mPFC provide task-relevant information24, we postulated that novelty-induced vHPC encoding changes and vHPC-mPFC circuit plasticity might facilitate information updating in mPFC neurons. During the center arm-run in Flexible Choice training, mPFC neurons may encode the future arm choice based on a Free Choice (biased vs. non-biased arm) or Flexible Choice (rewarded vs. non-rewarded arm) strategy. We used mutual information (MI), or the amount of information shared by mPFC spikes and arm choice, to quantify learning-dependent changes in arm choice encoding for each strategy. Training only reduced Free Choice-based encoding (arm bias MI) in the novel group (see Methods, Fig. 3f). Conversely, Flexible Choice-based encoding (rewarded arm MI) increased in all groups, with the novel group showing the largest increase (Fig. 3f). Thus, mPFC neurons in the novel group update with task-relevant information during training. Indeed, proportionally more mPFC neurons switched strategy encoding in the novel than familiar group (see Methods, Fig. 3g). Notably, it was these ‘switching’ neurons that increased their phase-locking to vHPC theta in late training (Fig. 3g). Thus, novelty exposure enhances information updating in the mPFC by increasing vHPC-mPFC functional connectivity.
D1Rs mediate the effects of novelty
Consistent with our findings that novelty persistently activates the vHPC, but not dHPC or mPFC, ventral tegmental area (VTA) dopaminergic inputs to the vHPC convey novelty information25. Indeed, the VTA densely projects to vHPC CA1, but minimally to dHPC CA1 (Extended Fig. 5). Activating D1Rs induced vHPC-mPFC synaptic depression and enhanced learning (Extended Fig. 6). We used the D1R-like antagonist SCH23390 (SCH), which blocks novelty-induced synaptic depression26,27, to test whether vHPC infusion of SCH abolishes the priming effect of novelty (Fig. 4a). SCH, but not vehicle, treatment before novelty exposure impaired Flexible Choice task learning (Fig. 4b). Moreover, SCH treatment reversed all of the physiological effects of novelty. Compared with the vehicle group, the SCH group showed lower vHPC theta power (Fig. 4c & Extended Fig. 7a), higher mPFC unit phase-locking to vHPC theta, and higher vHPC MUA-evoked mPFC spike firing during novelty exposure (Fig. 4d & Extended Fig. 7b). The vehicle, but not SCH, group displayed increased vHPC-mPFC connectivity with training, measured by phase-locking or evoked firing (Extended Fig. 7c & d). Furthermore, SCH prevented the training-induced reduction in arm bias MI seen in the vehicle group (Fig. 4e). Rewarded arm MI decreased in the SCH group with training but increased in the vehicle group (Fig. 4e). Thus, vHPC D1Rs mediate novelty-enhanced learning. SCH did not affect dHPC theta power and dHPC-mPFC connectivity (Extended Fig. 7e, g & h), consistent with an absence of novelty-induced influence on these parameters. SCH did impair mPFC theta power during novelty exposure, but not 1 hour later (Extended Fig. 7f).
Figure 4 |. Blocking D1-receptors or inhibiting novelty-tagged cells in the vHPC reverses the effects of novelty.

a, Experimental design (n = 7 for both SCH and vehicle groups). SCH treatment impaired the effects novelty on learning (b, F(1,12) = 13.25, P = 0.003; the average learning trials were 22 (Vehicle) and 63 (SCH), Mann-Whitney test, P = 0.004), vHPC theta power (c, 7 mice each; Mann-Whitney test, P = 0.002), and mPFC unit phase-locking to vHPC theta oscillations (d, SCH: 31, vehicle: 69 cells; Mann-Whitney test, P = 0.02). e, Arm bias and rewarded arm MI changes through training (vehicle: P < 0.0001, and 0.0008, each; SCH: P = 0.2, and 0.04, each). Wilcoxon signed-rank test. SCH: 31, vehicle: 69 cells. f, The Cal-Light technique. D1Rs (blue) and eNpHR (green) expression (vHPC; novel: 628, familiar: 611 cells; Chi-square test, P < 0.0001). Scale bars, 10 μm. g, Inhibiting novelty-responsive vHPC cells impaired novelty-enhanced learning (n = 5 for each group, F(1,8) = 12.4, P = 0.008). The average learning trials were 23 (eGFP) and 61 (eNpHR) (Mann-Whitney test, P = 0.02). h, Inhibiting non-novelty vHPC cells did not affect novelty-enhanced learning (n = 7 for each group; F(1,12) = 0.2, P = 0.6). Both groups showed average learning trials of 26 (Mann-Whitney test, P = 0.8). Insets, learning trial of each mouse (b, g, & h) or individual average theta power (c). Cumulative distribution shows all mPFC unit values. Two-way RM ANOVA test for b, g, & h. n.s. not significant. * P < 0.05. ** P < 0.005. *** P < 0.0005. Data are represented as mean ± SEM.
Novelty or D1R activation increases cell excitability28 and vHPC cells phase-locked to novelty-induced theta are more active (Fig. 2b), suggesting that D1R-expressing vHPC neurons might mediate the effects of novelty. We used the Cal-Light technique – which induces reporter expression in virally infected cells active during blue light illumination29 – to label novelty-responsive vHPC cells with high spatiotemporal resolution. In Cal-Light injected mice exposed to blue light alone, the novel arena alone, or to both, only the last group displayed robust eGFP reporter expression in the vHPC (Extended Fig. 8a–c).
We next expressed the inhibitory halorhodopsin (eNpHR) instead of the eGFP. Mice exposed to blue light in the novel arena robustly expressed eNpHR in activated vHPC cells, and these novelty-tagged cells co-expressed D1-receptors and projected to the mPFC (Fig. 4f, Extended Fig. 8e & f). Green light inhibited the spiking of these cells in vitro (Extended Fig. 8d). To specifically interfere with novelty-induced priming without affecting cell activity during novelty exposure or Flexible Choice training, we inhibited eNpHR-expressing novelty-tagged vHPC cells with green light (10 minutes) immediately after novelty exposure. This inhibition disrupted task acquisition relative to eGFP-expressing mice (Fig. 4g). As a control, we labeled vHPC cells while mice consumed reward in the start box during a Free Choice session, the day before novelty exposure. Comparing eNpHR expression from this non-novelty labeling with novelty-specific labeling (Extended Fig. 8a–c) revealed that the non-novelty condition similarly labeled vHPC cells, but with greater eNpHR expression (green:red ratio; novelty-specific: 0.69 ± 0.01, 975 cells, novelty-non-specific: 0.8 ± 0.01, 1008 cells; Kolmogorov-Smirnov test, P < 0.0001). Nonetheless, inhibiting these non-novelty-associated cells after novelty exposure did not disrupt novelty-enhanced learning (Fig. 4h). Further, inhibiting familiar-tagged vHPC cells did not affect learning (Extended Fig. 8g), confirming the critical and specific role of novelty-responsive vHPC cells in novelty-enhanced learning.
Discussion
Our study provides a model by which novel experience resets vHPC-mPFC circuitry to facilitate learning. Novelty reorganizes vHPC neuronal activity to local theta trough when membrane potential drops30, disrupting established Free Choice strategy encoding and weakening vHPC-mPFC connectivity. These changes prime vHPC-mPFC circuitry, enabling subsequent learning-associated plasticity. During new learning, the vHPC develops new task-driven activity and vHPC-mPFC connectivity improves. Then vHPC neurons convey new task-specific information to mPFC neurons, which encode the new task strategy alongside the old one (Extended Fig. 9). The D1R-dependent activation of vHPC neurons triggers these effects of novelty. Future studies will determine how D1R activation reorganizes vHPC neuronal activity to the theta trough. We provide detailed mechanisms underlying the general learning principle that disrupting existing representations facilitates subsequent learning-associated plasticity.
Our findings expand the role of dopaminergic signaling along the hippocampal dorsoventral axis. Although locus coeruleus (LC) dopaminergic inputs to the dHPC mediate novelty-induced memory enhancement31, we found no evidence of novelty-triggered priming signals in the dHPC. While others introduced novelty after training to study memory retention31, we show that introducing novelty before training enhances encoding. We speculate that the VTA-vHPC underlies novelty-enhanced learning, while the LC-dHPC enhances subsequent memory retention. Indeed, theta oscillations in the dHPC and vHPC represent distinct entities32. However, dHPC may play a role in novelty-enhanced learning, as knocking out D1Rs impairs spatial novelty detection in the dHPC33, perhaps mediated by vHPC34 and VTA inputs (Extended Fig. 5e & f). Because many neuropsychiatric disorders display pathologic vHPC-mPFC connectivity35, our study provides new mechanistic insights for potential therapeutic interventions.
Methods
Subjects.
Male and female C57BL/6J mice (Jackson Labs) were used for all experiments. Mice were maintained on a 12-hour light/ 12-hour dark cycle with lights on at 7 am. Food and water were available ad libitum until mice were food-restricted for the behavioral experiments Behavioral experiments were conducted between 9 am and 7 pm. After chronic drive/optic fiber implants, mice were singly housed in cages divided into two compartments by a perforated plastic divider. Mice were randomly assigned to each experimental group. For the experiments in Extended Figure 2e–h, 5 male and 4 female mice were used. No sex differences were observed (P > 0.8). Power analysis (alpha: 5%, power: 80%) showed sample size of 4 is sufficient to see the novelty effect on behavior. Experimenters were blind to the groups when treatments were the same. All procedures were carried out following the NIH Guidelines and approved by Columbia University and the New York State Psychiatric Institute Institutional Animal Care and Use Committees (IACUC).
Surgical procedures.
Three-month-old mice were anesthetized with 2% isoflurane in a flow box until sedated and placed in a stereotaxic apparatus. For the duration of the surgery, isoflurane was maintained at 0.8%, and mice were kept warm on a heating pad. Carprofen (0.15 mL) and dexamethasone (0.05 mL) were injected subcutaneously before the surgery. Mice were allowed to recover for 4 weeks before behavioral experiments were conducted. Because of a discrepancy across mouse brain atlases36, we used custom coordinates and confirmed the placements of our electrodes, cannula, and optic fibers (see Histology).
Drive implant.
For 44 mice (9 for novel, 11 for familiar, 10 for control, 7 for D1 antagonist, and 7 for vehicle groups), a tungsten wire field electrode (76 μm diameter) was implanted into the dHPC (targeting CA1 pyramidal layer; 1.9 mm posterior to, 1.3 mm lateral to, 1.26 mm below bregma) and vHPC (targeting ventral CA1/subiculum; 3.2 mm posterior to, 3.3 mm lateral to, 4.59 mm below bregma) each to record LFPs. For combined LFP and single-unit recordings, a bundle of 13 tungsten wire stereotrodes (13 μm diameter) was implanted into the mPFC (targeting prelimbic/ infralimbic cortex, layer II/III;1.8 mm anterior to, 0.3 mm lateral to, 2.1 mm below bregma). For 17 mice (8 for novel, and 9 for familiar groups), the stereotrode bundle was implanted into the vHPC, and the field electrodes were implanted into the dHPC, and mPFC. Reference and ground screws were placed in the skull overlying the frontal cortex and cerebellum, respectively. Wires were then connected to a 36-channel electrode interface board (Neuralynx), which was fixed to the skull with dental cement.
Cannula implant.
Guide cannulae (26 gauge; Plastics One, Roanoke, VA 24018) were implanted bilaterally into the vHPC (angled by 10 degrees, 3.2 mm posterior to, 3.88 mm lateral to, 3.3 mm below bregma) and held by dental cement. The dummy cannulae (Plastics One) were inserted into the guide cannulae until the day of drug infusion. On the day of infusion, 33-gauge internal cannulae with a 0.5 mm projection were inserted into the guide cannulae. To record LFPs in the vHPC, a tungsten wire field electrode was attached to a guide cannula with the tip of the electrode 0.7 mm below the cannula. Another field electrode was implanted into the dHPC and a stereotrode bundle was implanted into the mPFC as described above for this cohort.
Histology.
Electrode placements were verified after behavioral experiments by visual examination of electrolytic lesions. Mice were anesthetized with ketamine/xylazine mix, and lesions were induced by passing 50 μA current through an electrode for 20 seconds. Mice were transcardially perfused with PBS, followed by 4% paraformaldehyde in PBS. Brains were fixed in 4% paraformaldehyde at 4°C overnight and cryoprotected in 30% phosphate-buffered sucrose for 3 days at 4°C. Brains were sectioned (40 μm) using a cryostat and mounted with DAPI Fluoromount-G mounting medium (Southern Biotech, Cat. #: 0100-20). Only recordings from verified recording sites were used for analyses.
Drug.
SCH23390 (Tocris, Cat. #: 0925), a standard selective D1-like antagonist, was prepared as a 100 mM stock solution in saline and delivered at 1 mM final concentration in saline for cannulation experiments. The potent full efficacy D1R agonist Dihydrexidine (Tocris, Cat. #: 0884) was prepared as a 10 mM stock solution in deionized water.
Behavior.
Our delayed-non-match-to-sample Flexible Choice task is fundamentally distinct from the conventional delayed-non-match-to-sample working memory task24,37. Conventional T-maze working memory task protocols include ‘shaping’ sessions in which mice are guided to spontaneously alternate goal arms prior to training. Then the mice undergo days of training sessions until they learn the delayed non-match-to-sample rule to reach over 70% correct criterion performance levels. Therefore, spatially unbiased working memory representation is assessed from subjects who already know about the task rule during working memory testing24,37. The present study, however, omitted both shaping and repeated training sessions. As a result, after Free Choice sessions, mice developed a strong arm bias, which they had to overcome in order to successfully perform in the delayed-non-match-to-sample Flexible Choice task. Both goal arms were in the same conditions (color, scent, brightness, reward amount, etc.). Also, the orientation of the experimental area was kept consistent. Moreover, the arm bias of each mouse was not consistent across all groups, indicating that the bias was not guided by external cues. Specifically, among total 131 mice, 50 mice switched their biased arm side over the course of 3 Free Choice sessions. On the last day of Free Choice, 74 mice were biased toward the left arm and 57 mice were biased toward the right arm. This indicates that mice were not exclusively biased to one particular side and their arm choice was not guided by external cues.
Mice underwent behavioral procedures 4 weeks after surgeries. Food restriction was started 3 days before the beginning of Free Choice sessions to maintain 85% of the pre-restriction weight of mice. All mice were gently handled for 3 minutes for 3 days before starting Free Choice sessions to acclimate mice to experimenters. The circular arena was 50 cm in diameter and 25 cm in height. For behavioral scoring of exploration, the center of the circular arena was defined as the innermost half of the total area. Each arm of the custom-built automated T-maze was 10 cm wide and 15 cm high, and the length of the arms was 55 cm for the center arm and 32 cm for the goal arms.
Because novelty elicits a complex mixture of behavioral states including anxiety, we designed experiments to minimize the impact of non-specific anxiety or arena exploration. Previous reports demonstrated that exposing mice to a brightly lit open arena induces anxiety-related behavior and increases synchrony between the vHPC and mPFC, effects not seen when the experiments were performed in the dark38. Moreover, delivering bright light to a novel arena abolishes novelty-induced synaptic depression18. Hence, all experiments were performed in the dark to reduce the possibility of non-specific anxiety-related effects. Indeed, we did not observe anxiety-related behavior (reduced pathlength and time spent in the center of the arena)38 in the novel arena (Extended Fig. 10).
On day 1–3, all groups of mice had Free Choice sessions in the T-maze for 30 minutes each day. The familiar group also explored in the circular arena for 30 minutes, 1 hour before Free Choice sessions. During Free Choice sessions, mice were allowed to freely visit all of the arms to get rewards (condensed milk diluted 1:3 in deionized water). After getting a reward from one of the two goal arms, mice had to return to and consume a reward in the start box before entering another goal arm in order to initiate another round of rewards. By the last day of Free Choice sessions, mice across groups displayed similar numbers of arm visits (Control: 13.8 ± 0.6, Familiar: 14.7 ± 0.7, Novel: 13.8 ± 0.5, F(2,44) = 0.7, P = 0.5) and had developed a strong arm bias, choosing that arm approximately 90% of the time (Control: 86.6% ± 4.5, Familiar: 87.1 ± 3.2, Novel: 86.6 ± 3.8, F(2,44) = 0.006, P > 0.9) (Fig. 1b). On day 4, the novel and familiar groups underwent 10 min of exposure to the circular arena followed 1 hour later by 40 trials of training in a delayed-non-match-to-sample Flexible Choice training. The 1-hour interval was chosen because novelty effects typically last about 2 hours19,31,39. Mice in the control group went directly from their home cages to Flexible Choice training without exposure to the circular arena. The delayed-non-match-to-sample task consisted of sample, delay, and choice phases. In the sample phase, mice were guided to receive the reward in one of the goal arms. Then they returned to the start box and stayed there for a delay of 60 seconds. In the choice phase, mice had to choose the arm opposite to the arm they visited during the sample phase in order to get the reward (Fig. 1c). After finishing Flexible Choice training, mice were returned to their home cage. Once the maze was cleaned, a subset of mice (8 for novel, and 9 for familiar group) underwent another 30 minutes of Free Choice session to test whether Flexible Choice training affects previously established Free Choice behavior.
Social novelty experiments.
Three-month-old male mice interacted with a novel one-month-old male juvenile mouse in their home cage for 5 minutes, 1 hour before Flexible Choice training.
General arousal experiments.
Mice were awakened by opening the cage lid and disturbing nesting materials once. Ten minutes later, mice were returned to the cage rack for 1 hour until Flexible Choice training starts. As observed after the arena exposure or interaction with a novel mouse, this waking procedure made the mice active in the home cage until the onset of training. Mice were habituated to the waking procedures for 3 days before the training day to minimize potential novelty of the procedures. This daily acclimation handling procedure awakes mice without affecting neuronal physiology, behavior, and blood corticosterone levels40.
Optical stimulation of vHPC terminals in the mPFC.
To measure vHPC-mPFC synaptic transmission, the AAV5-CaMKIIα-hChR2(H134R)-EYFP (UNC Viral Vector Core) was injected into the vHPC. The coordinates of the injection sites were three mediolateral rows at posterior 3.1, 3.2 and 3.3 mm, with sites at lateral/ ventral: 3/ 4.89 and 4.59, 3.55/ 4.69 and 4.39 mm, with respect to bregma. A glass micropipette (20 – 40 μm diameter) was used to inject 100 nl/ site at a rate of 100 nl/ min. The time interval between injections was 5 minutes. To optically stimulate vHPC terminals in the mPFC and record synaptic responses, a tungsten wire electrode (13 μm diameter) was attached to an optic fiber (Thorlabs, 200 μm diameter, 0.22 NA) with the tip of the electrode 0.5 mm below the fiber. The coordinates for the optrode implant into the mPFC were the same as those described in the drive implant section.
Six weeks after the viral injection, mice were food restricted to maintain 85% of the pre-restriction weight and habituated to the recording procedures in home cage for six days. Food was provided at 7 pm so optically evoked field excitatory postsynaptic potential (fEPSP) recordings were not interfered by noise from chewing food. Neuralynx was used to amplify, band-pass filter (1–1000 Hz) and digitize fEPSPs collected at 32 kHz, as described in Neural data acquisition. Blue light test pulses (473 nm, 500 μs pulses at 0.033 Hz, OEM laser) were given to evoke 40% of maximum fEPSP amplitude. A pulse stimulator (A.M.P.I. Master8) was used to control laser.
To assess the impact of novelty exposure on vHPC-mPFC synaptic transmission (Fig. 3c & d), a stable baseline was established for 30 min in home cage. Then, LTP was induced by 10 trains of 20 Hz burst stimulation, each contained 300, 500 μs pulses at 20 Hz, with 45 s intertrain intervals41 (illustrated in Fig. 3e). One hour after the first stimulation, mice were exposed to either the novel or familiar arena for 10 minutes and then returned to home cage. The second 20 Hz burst stimulation was delivered 1 hour later, and fEPSP recording continued for 2 hours afterwards. The initial slope of the evoked fEPSPs was averaged across 5 minutes.
To block the effect of novelty by inducing LTP (Fig. 3e), separate groups of mice were injected with the AAV5-CaMKIIα-hChR2(H134R)-EYFP or the AAV5-CaMKIIα-EYFP (UNC Viral Vector Core) into the vHPC. Optic fibers were bilaterally implanted into the mPFC (1.8 mm anterior to, 0.3 mm lateral to, 1.6 mm below bregma). Six weeks after the viral injection, mice underwent behavioral procedures as described in Behavior. The 10 trains of 20 Hz burst stimulation was delivered immediately after novelty exposure to reverse novelty-induced vHPC-mPFC synaptic depression.
D1 antagonist experiment.
SCH23390 (100 nl, 1 mM) or vehicle (saline, 100 nl) was loaded into a 10 μL Hamilton syringe and delivered bilaterally to the vHPC at 50 nl /min using a Harvard Apparatus Pump II Dual Syringe micropump. Injection cannulae remained in place for 5 minutes to allow the injected fluid to diffuse. Twenty-minutes later, mice were exposed to the novel circular arena (Fig. 4a). Compared with vehicle treatment, treatment with SCH 20 minutes before arena exposure did not affect behavior in the novel arena (speed, SCH: 11.5 ± 1.3 cm/s, Veh: 11.7 ± 0.5 cm/s, t12 = 0.1, P = 0.9; path length, SCH: 69.7 ± 7.6 m, Veh: 70.8 ± 2.9 m, t12 = 0.1, P = 0.9; % center time, SCH: 14.7 ± 2.4 %, Veh: 14.3 ± 3.4 %, t12 = 0.1, P = 0.9). Notably, injecting 3.1 mM of SCH into the dHPC blocks novelty-enhanced memory consolidation31, but injecting such a high concentration into the vHPC caused severe sedation or bradykinesia for several hours. Mice were also habituated to the cannulation procedures for 5 days before the day of infusion to minimize potential novelty of the procedures.
D1 agonist experiment.
To measure the effect of D1R activation on vHPC-mPFC synaptic transmission, experiments were prepared as described in Optical stimulation of vHPC terminals in the mPFC. A tungsten wire electrode (76 μm diameter) was implanted into the mPFC. Saline (0.3 ml) was injected subcutaneously after establishing a stable baseline for 20 min in home cage. One hour later, the D1 agonist Dihydrexidine was subcutaneously delivered at 10 μg/g (in 0.3 ml saline), and recordings continued for another 90 minutes. The initial slope of the evoked fEPSPs was averaged across 5 minutes.
To test whether D1R activation mimics the effects of novelty on learning, a separate cohort of mice underwent Free Choice sessions as described in Behavior. On the day of Flexible Choice training, mice were subcutaneously injected with Dihydrexidine (1 μg/g in 0.3 ml saline) or saline (0.3 ml) 70 minutes before the onset of training. This time window was chosen because Flexible Choice training was followed 70 minutes after the onset of novelty exposure (see Behavior). Compared with vehicle treatment, Dihydrexidine treatment did not affect behavior in the familiar arena (n = 5 for each group; speed, Dihydrexidine: 9.6 ± 0.4 cm/s, Veh: 10 ± 0.5 cm/s, t8 = 0.6, P = 0.6; path length, Dihydrexidine: 58 ± 2.4 m, Veh: 60.3 ± 3.1 m, t8 = 0.6, P = 0.6; % center time, Dihydrexidine: 22.6 ± 3 %, Veh: 19.5 ± 7.5 %, t8 = 0.4, P = 0.7; % center path length, Dihydrexidine: 30.7 ± 3.3 %, Veh: 22.6 ± 7 %, t8 = 1, P = 0.3).
Optical inhibition of tagged vHPC neurons.
The Cal-Light viruses AAV1-hSYN-TM-CaM-TEV-N-AsLOV2-TEVseq-tTA, AAV1-hSYN-M13-TEV-C-P2A-tdTomato, and AAV1-TRE-eGFP (or AAV1-TRE-eNpHR-eYFP) were purchased from Vigene Biosciences Inc. (Rockville, MD 20850) and pre-mixed in 1:1:2 ratio29. With the Cal-Light system, elevated calcium levels in active cells allow binding of calmodulin to M13, thereby activating TEV protease. In the presence of blue light, TEV protease recognizes the TEV-sequence and cleaves tetracycline transactivator (tTA), which induces the expression of a reporter. Thus the reporter is expressed in those cells that are active during the period of illumination with blue light29. The cocktail of Cal-Light viruses was injected into 12 sites/ hemisphere in the vHPC. The viral injection procedures are described in Optical stimulation of vHPC terminals in the mPFC. Once the viral injection was done, optical fibers (Thorlabs, 200 μm diameter, 0.22 NA) were implanted bilaterally to the vHPC 500 μm above the CA1/ subiculum area (angled by 10 degrees, 3.2 mm posterior to, 3.88 mm lateral to, 3.5 mm below bregma) and held by dental cement.
Four weeks later, blue light (473 nm, 10 mW at the optic fiber tip) was bilaterally delivered (2-second ON/ 28-second OFF) to tag vHPC neurons. Among novelty-tagged neurons, 92.1 % of cells co-express D1Rs. Green light (532 nm, 10 mW at the optic fiber tip) was bilaterally delivered (2-second ON/ 28-second OFF) to inhibit tagged vHPC neurons during the first 10 min of the 1-hour home cage interval. Importantly, the induced gene expression does not immediately terminate when we stop delivering blue light. tTA, which becomes available as a consequence of blue light delivery and elevated calcium levels, continues to induce gene expression until it is depleted. Because we delivered blue light during 10-min novelty exposure and green light for 10 minutes afterwards for behavior (Fig. 4g), we silenced cells that started expressing eNpHR for 10–20 minutes. This timeframe is consistent with tetracycline-controlled systems, which can induce gene expression at half maximum levels as early as 20 minutes42–44. This time window also matched that of immunostaining shown in Extended Fig. 8a (also see Optical labeling of active cells for immunostaining). Mice were habituated to the optical procedures for 5 days prior to the experiment to minimize potential novelty of the procedures.
Learning curve.
A logistic regression model and a state-space model45 were independently used to examine mouse behavior during Flexible Choice training. To fit the behavior to the logistic regression model, the MATLAB (MathWorks) function glmft was used to calculated logistic regression coefficient estimates. These estimates were then used as inputs for the function glmval to obtain predicted performance levels across trials. Because mice exhibited arm bias (Fig. 1c & e), mice performance could be falsely counted as correct when the goal arm was the biased arm. To account for this potential error, logistic regression coefficients were weighted based on the probability (P) of visiting the biased arm as measured during the last day of Free Choice session. When P > 0.7, correct observations for the biased arm were weighted by 1 – P. When there was no strong bias (P < 0.7), all correct observations were weighted by 1 – P. This weighting procedure was critical because mice kept their arm bias throughout training (Fig. 1c & e). To estimate at which trial mice learned the rule governing successful Flexible Choice performance, the inflection point of the learning curve was calculated. At the inflection point, the curvature of the learning curve changes its direction, which reflects that learning has occurred. The inflection points of 5 mice (4 mice in the familiar and 1 mouse in the novel group, Fig. 1f) were undetermined because the overall slopes of their learning curves were negative, indicating that learning had not occurred. The learning trial of one mouse in the ChR group in Figure 3e was undetermined with the same reason. The state-space model defines the probability of a correct response as a function of the unobservable learning state process45. The probability of a correct response for each trial was calculated using the MATLAB script provided by Smith et al. 200445. This model does not explicitly account for the arm bias.
Neural data acquisition.
For the cohorts of mice from which mPFC single-unit data were obtained, neurophysiological recordings were performed while mice were exploring in the circular arena and undergoing Flexible Choice training. For the other cohort of mice from which vHPC single-unit data were obtained, recordings were conducted during the last day of Free Choice session, in addition to arena exploration and Flexible Choice training. Neurophysiological recordings were not performed for the social novelty, arousal (Extended Fig. 1), Cal-Light experiments (Fig. 4g & h, Extended Fig. 8g), behavioral experiments following optical stimulation (Fig. 3e) or D1R agonist treatment (Extended Fig. 6b), and during the Free Choice session immediately after Flexible Choice training (Fig. 1h). A Digital Lynx system (Neuralynx, Bozeman, MT) was used to amplify, band-pass filter (1–1000 Hz for LFPs, and 600–6000 Hz for spikes) and digitize the electrode recordings. LFPs and spikes were collected at 2 kHz and 32 kHz, respectively. Klustakwik (Ken Harris) was used to initially cluster single units based on the first two principal components (peak and energy) from each channel. Clusters were then manually accepted, merged, or eliminated based on visual inspection of waveform appearance, inter-spike interval distribution, isolation distance, and L-ratio. Only single units having more than 50 spikes over the whole recording session were used for data analyses. The total number of mPFC single units used for analyses for each recording session was as following. Circular arena: 113 (familiar), 110 (novel), 31(SCH), 69 (vehicle); 1-hour after arena exposure: 8 (familiar), 19 (control), 29 (novel), 2(SCH), 4 (vehicle); Flexible Choice training: 43 (familiar), 62 (control), 66 (novel), 18 (SCH), 36 (vehicle). Because neither the familiar nor control group was exposed to the novel arena and both groups performed at similar levels during Flexible Choice training, single units from these groups were combined. For the SCH and vehicle groups, single-unit data were not analyzed 1 hour after arena exposure as there were too few units. The total number of vHPC single units used for analyses for each recording session was as following. Circular arena: 26 (familiar), 29 (novel); Free Choice/Flexible Choice session: 22 (familiar), 30 (novel). Ventral HPC single-unit data were not analyzed 1 hour after arena exposure as there were too few units. We also attempted to classify mPFC and vHPC cells into putative cell types (e.g., excitatory vs. inhibitory) using waveform features, but they did not separate into clear groups.
To account for the influence of animal movement20, recordings collected during circular arena exposure were analyzed when mice were moving (6–30 cm/s); these ranges were chosen based on the observed bimodal distribution of speeds during the exposure. Mice moved at a comparable speed in the novel and familiar arenas, as previously reported46 (Novel: 13.8 ± 0.5 cm/s, Familiar: 13 ± 0.5 cm/s, t35 = 1.1, P = 0.3). To assess neuronal activity 1 hour after novelty exposure, we analyzed recordings collected from mice running in the center arm for the first time in Flexible Choice training, which started 1 hour after arena exposure. This first center-arm-run is conceptually similar to the Free Choice session as it occurs before the first task-specific cue (encounter with the arm door that guided mice to the sample goal arm).
Neural data analysis.
For the Free Choice and Flexible Choice training data, analyses were conducted when mice were running in the center arm, before turning to the chosen arm to avoid any signals related to reward consumption. All data analyses were conducted using custom-written scripts in MATLAB. To account for impedance differences across electrodes, raw LFP data were normalized to the root mean square of the voltage signal over the whole recording session. To calculate power, the wavelet method (the MATLAB wavelet toolbox) was used. To analyze phase-locking, the phase of the LFP was calculated using a Hilbert transform, and spikes were assigned to corresponding phases. To avoid bias from variable spike numbers, we calculated pairwise phase consistency (PPC), which computes the mean of the cosine of the absolute angular distance for all given pairs of spike phases47.
Mutual Information (MI).
To determine whether mPFC neurons encode arm choice based on a Free Choice or Flexible Choice strategy, the amount of information shared by mPFC spikes and arm choice (biased vs. non-biased arm for arm bias MI, or reward vs. non-reward arm for rewarded arm MI) was calculated48. Spike data (variable X) were assigned into 100 ms bins. The arm choice for each trial (variable Y) was transformed into binary vectors. The amount of information (entropy) for variable X (or Y) was calculated using the formula below: H is entropy, p is the probability of observing the ith value of the bin series data x, and n is the number of bins. Joint entropy, which is the total entropy of a pair of variables X and Y, was calculated as below. Variable Y has corresponding counting indices j and m. Finally, MI between spikes (X) and arm choice (Y) was calculated by the following formula. Because MI is sensitive to arbitrary influences of the number of MI(X,Y) = H(X) + H(Y) – (X,Y) spikes (X) and recorded neurons are different between the novel and familiar group, comparing MI values between the two groups is not desirable. In each group, mPFC neurons did not show firing rate differences between the early and late phase of Flexible Choice training (Familiar: P = 0.57, Novel: P = 0.91). MI represents the total amount of information and does not contain information about directionality. Rewarded arm (or arm bias) MI is total information about both reward and non-reward (or biased and non-biased) arm choice. For example, higher rewarded arm MI than arm bias MI does not mean that mPFC neurons encode more information about reward arm than biased arm, per se. Also, switching indices between biased- and non-biased arm (or reward- and non-reward arm) does not change the entropy for arm choice (H(X)). For each group, we calculated rewarded arm and arm bias MI for each mPFC neuron before and after the learning point and presented differences for each MI to demonstrate learning-dependent changes in each MI for each mPFC neuron.
To define cells switching information content from arm bias MI to rewarded arm MI, bootstrapping was used (alpha = 0.05). All cells from all groups were pooled, and MI values for arm bias or rewarded arm were separately treated for bootstrapping. Specifically, eighty MI values from each category were randomly picked from the pooled data and averaged. This procedure was repeated for 10,000 times to make a distribution of the sampled means. A significant increase was defined when MI values were bigger than the upper 2.5% cut-off value of the sampled mean distribution. A significant decrease was defined when MI values were smaller than the lower 2.5% cut-off value of the sampled mean distribution. Then, the switcher cells were defined when they showed significant decreases in arm bias MI as well as significant increases in rewarded arm MI. The rest of the cells were defined as non-switchers.
Machine Learning.
The MATLAB machine learning toolbox was used. Ventral hippocampal spike data were assigned into 100 ms bins. The arm choice for each trial was transformed into binary vectors. To train machine learning classifier models, spike and arm choice data from all groups of mice were obtained from the last day of Free Choice session. Among all classifier models in the toolbox, the weighted k-nearest neighbors (KNN) model gave the best classification results (> 95% prediction accuracy, and the area under the receiver operating characteristic curve was 0.99, Extended Fig. 4). To avoid over representation of trials that mice chose their biased arm, the equal numbers of trials of either biased- or non-biased arm choice were randomly selected to train the model. This procedure was repeated 10 times to generate 10 independent models. Then vHPC spike data obtained from Flexible Choice training were fed into the trained models to predict Flexible Choice behavior. If spike firing patterns from Free Choice is well maintained through Flexible Choice training, the model should predict Flexible Choice behavior well. For control analyses, vHPC spike data obtained from Flexible Choice training were randomly shuffled and fed into the trained models.
Multi-unit activity (MUA).
The amplitude of LFP activity in high gamma or epsilon band (> 100 Hz) represents MUA and shows modulation by theta oscillations49–51. To confirm this, we gained sample LFP and MUA recordings from the vHPC when mice were exploring in a familiar box (a kind gift from Dr. Nancy Padilla-Coreano at Salk Institute). LFP data were bandpass-filtered at 200–300 Hz using Butterworth filter, and then the square of the filtered data was z-scored. Peaks of the z-scored data above 2 standard deviation were considered as MUA spikes. We found that these peaks well-correlated with actual MUA spikes (r > 0.9, P < 0.0001) and that the amplitude of the z-scored data also well-correlated with the actual MUA firing rate (r = 0.7, P < 0.0001). Thus, epsilon power well-represents MUA activity in the vHPC.
MUA-evoked mPFC spike firing.
Because vHPC spike activity leads mPFC spike firing by 5–25 ms24, mPFC single-unit firing rate was calculated after each MUA spike event within this window and averaged. MUA spikes over 50 were used for analyses.
Ex vivo electrophysiology.
Mice were injected with the Cal-Light viruses into the vHPC. Four weeks later, blue light was delivered during novelty exposure to tag novelty-responsive vHPC neurons as described in Optical inhibition of tagged vHPC neurons. Then, the mice were cervically dislocated, and brains were quickly removed and chilled in ice-cold oxygenated artificial cerebrospinal fluid (ACSF) consisting of 126 mM NaCl, 2.5 mM KCl, 2 mM MgCl2, 1.25 mM NaH2PO4, 2 mM CaCl2, 26.2 mM NaHCO3, and 10 mM D-glucose, pH 7.45, 300–310 mOsm. Several 300 μm coronal sections spanning the rostral-caudal axis of the vHPC were made in ice-cold ACSF using a vibratome. Slices were immediately transferred to oxygenated ACSF at 32°C for 30 min and then kept at room temperature. Electrodes were pulled from 1.5 mm borosilicate glass pipettes at a typical resistance of 3–6 MΩ and filled with internal solution consisting of 130 mM K-gluconate, 5 mM NaCl, 10 mM HEPES, 0.5 mM EGTA, 2 mM MgATP, 0.3 mM NaGTP, pH 7.3, 280 mOsm. Recordings were made using a MultiClamp 700B amplifier, a Digidata 1440A acquisition system, Clampex 10, and pClamp 10 (all from Molecular Devices). To select eNpHR-eYFP positive neurons labeled by Cal-Light, neurons expressing both tdTomato (expression marker for Cal-Light viral transfection) and eYFP were identified (Extended Fig. 8d). In whole-cell current-clamp mode, membrane potential was maintained at −65 mV. Step currents (500 ms) were injected from 0 pA to 200 pA, and the number of spikes was quantified with and without 550 nm LED (pE-4000, CoolLED). Considering all experimental procedures including the incubation period, recordings were made at least 1 hour after the termination of Cal-Light labeling.
Optical labeling of active cells for immunostaining.
Mice were allowed to recover for 4 weeks after the injection of the Cal-Light viruses. Mice were habituated to optical procedures for 3 days to avoid potential novelty effects. To label vHPC cells active during exploration in the circular arena (Extended Fig. 8a–c), blue light was bilaterally delivered (2-second ON/ 28-second OFF) through optic fibers implanted in the vHPC during the 10-minute arena exposure. Following the IACUC protocol, it took approximately 10 minutes to fully anesthetize the mice, and brains were perfused about 10 minutes after the termination of Cal-Light labeling.
Viral tracing of VTA projections to the hippocampus.
The AAV2-EF1α-mCherry (UNC Viral Vector Core) was injected into 2 sites/ hemisphere in the VTA (posterior 3.1 and 3.4 mm, with sites at lateral/ ventral: 0.5/ 4.3 mm, with respect to bregma). A glass micropipette (20 – 40 μm diameter) was used to inject 250 nl/ site at a rate of 50 nl/ min. Six weeks later, brains were collected as described in Histology for Immunostaining.
Viral tracing of vHPC projections to the mPFC.
To examine D1R-expressing vHPC neurons, Drd1a-CRE (FK150Gsat/Mmcd) mice were used. The AAV5-EF1α-DIO-eYFP (UNC Viral Vector Core) was injected into the vHPC as described in Optical stimulation of vHPC terminals in the mPFC. Twelve weeks later, brains were collected as described in Histology for Immunostaining.
To examine vHPC neurons tagged during novel or familiar exposure, the Cal-Light technique was used. Brains were collected 4 weeks after labeling.
Immunostaining.
Mice were transcardially perfused with PBS, and coronal brain sections (35 μm) were made as described in Histology. Brain sections were blocked for 1 hour in PBS solution containing 10% normal donkey serum (Jackson Immunoresearch) and 1% Triton-X. To evaluate Cal-Light virus expression levels, sections were incubated overnight at 4°C with primary antibodies rabbit DsRed (1:1,500; Takara, #632496) and chicken GFP (1:500; Abcam, ab13970) in PBS solution containing 10% normal donkey serum and 1% Triton-X. After washing with PBS for 3 times, 10 minutes each, sections were incubated for 1 hour with secondary antibodies chicken cy2 (1:500; Jackson Immunoresearch) and rabbit cy3 (1:1000, Jackson Immunoresearch) in PBS solution containing 10% normal donkey serum and 1% Triton-X. Sections were then washed with PBS for 3 times, 10-minutes each, and mounted on glass slides with Fluoromount-G mounting medium (Southern Biotech, Cat. #: 0100-01 or 0100-20). To detect mCherry or TH expression, primary antibodies rabbit DsRed (1:1,500; Takara, #632496) or sheep TH (1:1000; Abcam, ab113), and secondary antibodies rabbit cy3 (1:1000, Jackson Immunoresearch) or sheep DyLight 405 (1:1000; Jackson Immunoresearch) were used, respectively. To probe for D1-receptors, primary antibody goat D1-receptor (1:200; Frontier, af1000), and secondary antibody goat DyLight 405 (1:500; Jackson Immunoresearch) or goat cy3 (1:500, Jackson Immunoresearch) were used. Imaging was conducted on a Leica confocal microscope (TCS SP8), and ImageJ was used to quantify and assess the co-localization of the fluorescence of each cell.
Statistics and reproducibility.
Graphpad Prism 8 was used for statistical analysis. All statistical tests were two-tailed. Post-hoc tests were performed when applicable. Differences were considered statistically significant when P < 0.05. Immunohistochemistry was repeated at least two times.
Extended Data
Extended Figure 1 |. Spatial and social novelty, but not general arousal, enhance learning.

After 3 days of Free Choice sessions, mice were exposed to the novel or familiar arena (shown in Fig. 1f), a novel juvenile male mouse (n = 7), or arousal handling (n = 7) 1 hour before Flexible Choice training. Mice exposed to the novel juvenile mouse performed similarly to the mice exposed to the novel arena (Two-way RM ANOVA, F(1,22) = 0.03, P = 0.9). Conversely, mice that underwent arousal handling showed comparable performance levels to the mice exposed to the familiar arena (Two-way RM ANOVA, F(1,25) = 0.4, P = 0.5). The average inflection points (learning trial) were 21 (Spatial novelty), 19 (Social novelty), 38 (Familiar), and 39 (Arousal) (Kruskal-Wallis test, P = 0.002; Familiar vs. Arousal: P > 0.9, Spatial novelty vs. Familiar: P = 0.03, Social novelty vs. Familiar: P = 0.03). Insets, learning trial of each mouse. n.s. not significant. * P < 0.05. *** P < 0.0005. Data are represented as mean ± SEM.
Extended Figure 2 |. Novelty induces prolonged increases in theta power in the vHPC, but not the dHPC or mPFC.

a, LFP power was measured during and 1 hour after arena exposure, at the onset of Flexible Choice training. b, The novelty-exposed group displayed higher vHPC theta power 1 hour after arena exposure compared with the other groups (Kruskal-Wallis test, P = 0.0007; Novel vs. Familiar: P = 0.001, Novel vs. Control: P = 0.008). c, Theta power in the dHPC was comparable across all groups during (Mann-Whitney test, P = 0.1) and 1 hour after arena exposure (Kruskal-Wallis test, P = 0.4). d, Novelty exposure increased mPFC theta power (Mann-Whitney test, P = 0.002), but this increase was unseen at the onset of Flexible Choice training (Kruskal-Wallis test, P = 0.4). e, A separate cohort of mice explored a T-shaped arena for two consecutive days. f, Theta power in the vHPC decreased in day 2 compared with that of day 1 (Wilcoxon signed-rank test, P = 0.04). g & h, Theta power in the dHPC or mPFC was comparable between day 1 and day 2 (Wilcoxon signed-rank test, g; P = 0.8, h; P = 0.3). Insets, average theta power of each mouse. n.s. not significant. * P < 0.05. ** P < 0.005. Data are represented as mean ± SEM.
Extended Figure 3 |. Novelty-induced connectivity weakening permits subsequent learning-associated connectivity strengthening in the vHPC-mPFC, but not dHPC-mPFC, circuit.

a, Left, rose plots illustrating the phase-locking of example mPFC single units to vHPC theta oscillations. The novelty-exposed group showed lower phase-locking during arena exposure compared with the familiar-exposed group (novel: 110, familiar: 113 cells; Mann-Whitney test, P = 0.04). b, Measuring vHPC MUA-evoked mPFC spike firing. c, The novelty-exposed group exhibited lower evoked firing during (novel: 110, familiar: 113 cells; P = 0.02) as well as 1 hour after arena exposure (novel: 12, familiar: 24 cells; P = 0.01). Mann-Whitney test d, In the late phase of Flexible Choice training, evoked firing increased in the novelty-exposed group (66 cells; P = 0.03), but decreased in the familiar-exposed group (97 cells; P = 0.01). Wilcoxon signed-rank test. e, Rose plots illustrate the phase-locking of example mPFC single units to dHPC theta oscillations. The novelty- and familiar-exposed groups showed comparable phase-locking levels during (novel: 110, familiar: 107 cells; P = 0.3) as well as 1 hour after arena exposure (novel: 29, familiar: 25 cells; P = 0.07). Mann-Whitney test. f, Both the novelty- and familiar-exposed groups exhibited increased phase-locking in the late phase of Flexible Choice training (Wilcoxon signed-rank test, novel: 66 cells, P = 0.0002, familiar: 103 cells, P = 0.04). Cumulative distribution shows all mPFC single unit values. n.s. not significant. * P < 0.05. ** P < 0.005. *** P < 0.0005. Data are represented as mean ± SEM for a – d, and median with 95% confidence interval for e & f.
Extended Figure 4 |. Novelty disrupts vHPC encoding of Free Choice strategy and permits the encoding of Flexible Choice strategy.

a, Training machine learning classifier models with Free Choice data (vHPC unit activity and arm bias) successfully classified differences in vHPC unit activity patterns between biased- and non-biased arm visits (10 models, 95.8% ± 0.3). b, The machine learning classifier models trained with Free Choice arm bias data (a) were used to decode Flexible Choice vHPC spiking data. c, For the first half of the Flexible Choice training, the model predicted biased arm choice of the familiar-exposed group, but not the novelty-exposed group (10 models; Two-way RM ANOVA test, F(1,18) = 25.1, P < 0.0001). d, Once the novelty-exposed group had learned the Flexible Choice task rule in later trials, the models predicted getting the reward for the novelty-exposed group, but not the familiar-exposed group (10 models; Two-way RM ANOVA test, F(1,18) = 5.7, P = 0.02). Insets, model predictions with shuffled Flexible Choice vHPC spiking data. * P < 0.05. ** P < 0.005. *** P < 0.0005. Data are represented as mean ± SEM.
Extended Figure 5 |. VTA inputs to the HPC.

Top, AAV-mCherry was injected into the VTA to visualize VTA-to-HPC projections. Bottom, VTA terminals in vHPC CA1 (a), CA3 (b), and DG (c). VTA terminals in dHPC CA1 (d), CA3 (e), and DG (f). g, The expression of mCherry in the VTA. h, VTA dopaminergic neurons expressing tyrosine hydroxylase (TH). i, Merged image of g and h. Blue: DAPI. DG: dentate gyrus, Or: oriens, Py: pyramidal, Rad: radiatum, LMol: lacunosum moleculare layer. Scale bars, 50 μm. Maximum-intensity projection images.
Extended Figure 6 |. D1R activation mimics the impact of novelty on vHPC-mPFC synaptic transmission and learning.
a, Optical test pulses were delivered as in Figure 3c – e. Systemic administration of the D1R agonist Dihydrexidine induced vHPC-mPFC synaptic depression compared with the vehicle condition (n = 5 mice; One-way RM ANOVA test, F(1.6,6.3) = 52.2, P = 0.0002; baseline vs. vehicle: P = 0.7, baseline vs. Dihydrexidine: P = 0.003, vehicle vs. Dihydrexidine: P = 0.0009). Right top, example average fEPSP traces. Right bottom, average fEPSPs. b, Dihydrexidine treatment enhanced learning relative to vehicle treatment (n = 5 for the vehicle group, n = 6 for the Dihydrexidine group. Two-way RM ANOVA test, F(1,9) = 8.7, P = 0.02). The average inflection points (learning trial) were 15 (Dihydrexidine), and 46 (vehicle) (Mann-Whitney test, P = 0.009). Insets, learning trial of each mouse. The learning trial of one mouse in the vehicle group was undetermined because the overall slope of its learning curve was negative, indicating that learning had not occurred. * P < 0.05. ** P < 0.005. *** P < 0.0005. Data are represented as mean ± SEM.
Extended Figure 7 |. Blocking D1-receptors in the vHPC abolishes the impacts of novelty on hippocampal-prefrontal circuitry.

a, SCH infusion impaired novelty-induced vHPC theta power 1 hour after novelty exposure (7 mice each; Mann-Whitney test, P = 0.02). b, During novelty exposure, the SCH group exhibited higher vHPC MUA-evoked mPFC spike firing (SCH: 31, vehicle: 69 cells; Mann-Whitney test, P = 0.04). c, In late training, mPFC unit phase-locking to vHPC theta was not significantly changed in the SCH group (18 cells; P = 0.1), while increasing in the vehicle group (36 cells; P = 0.004). Wilcoxon signed-rank test. d, In late training, evoked mPFC spike firing was not significantly changed in the SCH group (18 cells; P = 0.2), while increasing in the vehicle group (36 cells; P = 0.01). Wilcoxon signed-rank test. e, Mice infused with either vehicle or SCH into the vHPC displayed similar dHPC theta power during and 1 hour after novel arena exploration (Mann-Whitney test, P = 0.3 and P = 0.1, respectively; 7 mice each). f, SCH infusion impaired novelty-induced mPFC theta power during novel arena exposure (P = 0.04), but did not have an effect 1 hour later (P = 0.2). Mann-Whitney test.7 mice each. g & h, Phase-locking of mPFC single units to dHPC theta oscillations. g, Phase-locking was not significantly different between the vehicle and SCH groups during novel arena exploration (SCH: 31, vehicle: 69 cells; Mann-Whitney test, P = 0.6). h, Phase-locking remained stable during training in both groups (SCH: 31, vehicle: 69 cells; Wilcoxon signed-rank test, SCH: P = 0.6, Vehicle: P = 0.8). Cumulative distribution shows all mPFC unit values. Insets, individual average theta power. n.s. not significant. * P < 0.05. ** P < 0.005. Data are represented as mean ± SEM (a – f) or median with a 95% confidence interval (g & h).
Extended Figure 8 |. The Cal-Light technique to tag and inhibit novelty-responsive vHPC cells.

a, Labeling active cells in vHPC CA1 area using the Cal-Light system. Scale bars, 50 μm. b, Cumulative distribution of the green:red ratio of each cell. (Light + Familiar: 1014 cells/2 mice, No light + Novel: 920 cells/2 mice, Light + Novel: 975 cells/2 mice). Since eGFP expression is induced in the virus-infected cells that express the red fluorophore tdTomato, the green:red ratio for each cell was measured. c, Relative to the other conditions, vHPC cells in the Light + Novel condition displayed higher green:red ratio (One-way ANOVA, F(2,2906) = 171.9, P < 0.0001; Light + Novel vs. No light + Novel: P < 0.0001, Light + Novel vs. Light + Familiar: P < 0.0001). d, Green light inhibited spiking of eNpHR-expressing novelty-tagged cells (Two-way RM ANOVA, F(1,12) = 10.2, P = 0.008, n=7). Inset, vHPC cells expressing eNpHR-eGFP reporter. e, The mPFC projection of vHPC cells infected with the Cal-Light viruses. Maximum-intensity projection images. Scale bars, 10 μm. f, The projection of vHPC cells expressing D1Rs to the mPFC. Left. Cre-dependent eYFP expression in vHPC cells of Drd1-cre mice. Middle. Co-localization of eYFP (green) and D1Rs (red) in the vHPC. Right. vHPC terminals (green) in the mPFC. Blue: DAPI. Scale bars, 20 (middle), 500 μm (right). g, Inhibiting familiar-responsive vHPC cells did not affect Flexible Choice training performance (n = 5 for each group, Two-way RM ANOVA test, F(1,8) = 0.2, P = 0.7). Insets, learning trial of each mouse. The average learning trials were 40 (eGFP) and 36 (eNpHR) (Mann-Whitney test, P = 0.8). The learning trials of two mice in the eGFP group were undetermined because the overall slopes of their learning curves were negative, indicating that learning had not occurred. n.s. not significant. * P < 0.05. *** P < 0.0005. Data are represented as mean ± SEM.
Extended Figure 9 |. A model illustrating the effects of novelty on vHPC-mPFC circuitry and information encoding.

The vHPC-mPFC circuit encodes a strategy to get the reward after Free Choice sessions. This circuit encoding of Free Choice strategy remains stable in familiar conditions and conflicts with learning on Flexible Choice training. By contrast, novelty exposure disrupts vHPC activity patterns encoding Free Choice strategy and weakens existing vHPC-mPFC connectivity, reducing adherence to the Free Choice strategy. During Flexible Choice training, the vHPC develops new task-driven activity patterns and vHPC-mPFC functional connectivity undergoes learning-dependent strengthening. The vHPC then transmits newly encoded task-specific information to the mPFC, updating mPFC encoding with new task-relevant information. Hence, novelty exposure enhances new learning by resetting the vHPC-mPFC circuit.
Extended Figure 10 |. Novel arena is not anxiogenic.

To avoid anxiogenic effects of the novel arena exposure, experiments were performed in the dark. Top, example behavior trajectories in the novel and familiar arenas. a, Total pathlength was comparable between the novel and familiar groups (t-test, t(35) = 1.1, P = 0.3). b & c, Percent pathlength (b; t-test, t(35) = 0.3, P = 0.7), or time spent in the center (c; t-test, t(35) = 0.6, P = 0.6) was similar between the two groups. Novel: 17, Familiar: 20 mice. Data are represented as mean ± SEM.
Acknowledgements
This work was supported by grants from the NIMH (R01 MH096274 to J.A. Gogos, and T32 MH018870-29 to A.I.A., R21 MH117454 to C.K., and K08 MH109735 to A.Z.H.). A.I.A was also supported by the Leon Levy Foundation. A.Z.H. was supported by the Hope for Depression Research Foundation and BBRF Young Investigator Award as well. J.A. Gordon is supported by the National Institutes of Health Intramural Research Program. We thank Dr. Nancy Padilla-Coreano (Salk Institute) for providing sample multiunit and LFP recordings. We also thank Dr. Rene Hen, Dr. Attila Losonczy, and Dr. Steven Siegelbaum (Columbia University) for their helpful suggestions, and Dr. Adam Ciarleglio (Clinical Biostatistics, Columbia University) for advice about logistic regression models of learning curves.
Footnotes
Data availability
All data are available from the corresponding authors upon reasonable request.
Code availability
All custom codes are available from the corresponding authors upon reasonable request.
Competing Financial Interests
The authors declare no competing financial interests.
Reference
- 1.Waltz JA The neural underpinnings of cognitive flexibility and their disruption in psychotic illness. Neuroscience 345, 203–217 (2017). [DOI] [PMC free article] [PubMed] [Google Scholar]
- 2.Yamaguchi S Rapid Prefrontal-Hippocampal Habituation to Novel Events. J. Neurosci 24, 5356–5363 (2004). [DOI] [PMC free article] [PubMed] [Google Scholar]
- 3.Benchenane K et al. Coherent Theta Oscillations and Reorganization of Spike Timing in the Hippocampal- Prefrontal Network upon Learning. Neuron 66, 921–936 (2010). [DOI] [PubMed] [Google Scholar]
- 4.Binder S et al. Monosynaptic Hippocampal-Prefrontal Projections Contribute to Spatial Memory Consolidation in Mice. J. Neurosci 39, 6978–6991 (2019). [DOI] [PMC free article] [PubMed] [Google Scholar]
- 5.Mukai J et al. Molecular Substrates of Altered Axonal Growth and Brain Connectivity in a Mouse Model of Schizophrenia. Neuron 86, 680–695 (2015). [DOI] [PMC free article] [PubMed] [Google Scholar]
- 6.Shah D et al. Spatial reversal learning defect coincides with hypersynchronous telencephalic BOLD functional connectivity in APPNL-F/NL-Fknock-in mice. Sci. Rep 8, 1–11 (2018). [DOI] [PMC free article] [PubMed] [Google Scholar]
- 7.Latif-Hernandez A et al. Quinolinic acid injection in mouse medial prefrontal cortex affects reversal learning abilities, cortical connectivity and hippocampal synaptic plasticity. Sci. Rep 6, 1–14 (2016). [DOI] [PMC free article] [PubMed] [Google Scholar]
- 8.Blot K et al. Modulation of hippocampus-prefrontal cortex synaptic transmission and disruption of executive cognitive functions by MK-801. Cereb. Cortex 25, 1348–1361 (2015). [DOI] [PubMed] [Google Scholar]
- 9.Oswal A et al. Deep brain stimulation modulates synchrony within spatially and spectrally distinct resting state networks in Parkinson’s disease. Brain 139, 1482–1496 (2016). [DOI] [PMC free article] [PubMed] [Google Scholar]
- 10.Krause MR et al. Transcranial Direct Current Stimulation Facilitates Associative Learning and Alters Functional Connectivity in the Primate Brain. Curr. Biol 27, 3086–3096.e3 (2017). [DOI] [PubMed] [Google Scholar]
- 11.Kim J-I et al. PI3Kγ is required for NMDA receptor-dependent long-term depression and behavioral flexibility. Nat. Neurosci 14, 1447–54 (2011). [DOI] [PubMed] [Google Scholar]
- 12.Kitamura T et al. Adult Neurogenesis Modulates the Hippocampus-Dependent Period of Associative Fear Memory. Cell 139, 814–827 (2009). [DOI] [PubMed] [Google Scholar]
- 13.Epp JR, Mera RS, Köhler S, Josselyn SA & Frankland PW Neurogenesis-mediated forgetting minimizes proactive interference. Nat. Commun 7, 5–12 (2016). [DOI] [PMC free article] [PubMed] [Google Scholar]
- 14.Alam MJ et al. Adult neurogenesis conserves hippocampal memory capacity. J. Neurosci 38, 6854–6863 (2018). [DOI] [PMC free article] [PubMed] [Google Scholar]
- 15.Abraham WC & Bear MF Metaplasticity : plasticity of synaptic. Trends Neurosci 19, 126–130 (1996). [DOI] [PubMed] [Google Scholar]
- 16.O’Dell TJ & Kandel ER Low-frequency stimulation erases LTP through an NMDA receptor-mediated activation of protein phosphatases. Learn. Mem 1, 129–139 (1994). [PubMed] [Google Scholar]
- 17.Dietz B & Manahan-Vaughan D Hippocampal long-term depression is facilitated by the acquisition and updating of memory of spatial auditory content and requires mGlu5 activation. Neuropharmacology 115, 30–41 (2017). [DOI] [PubMed] [Google Scholar]
- 18.Manahan-Vaughan D & Braunewell KH Novelty acquisition is associated with induction of hippocampal long-term depression. Proc. Natl. Acad. Sci. U. S. A 96, 8739–44 (1999). [DOI] [PMC free article] [PubMed] [Google Scholar]
- 19.Moncada D & Viola H Induction of long-term memory by exposure to novelty requires protein synthesis: evidence for a behavioral tagging. J. Neurosci 27, 7476–81 (2007). [DOI] [PMC free article] [PubMed] [Google Scholar]
- 20.Buzsáki G, Anastassiou CA & Koch C The origin of extracellular fields and currents-EEG, ECoG, LFP and spikes. Nat. Rev. Neurosci 13, 407–420 (2012). [DOI] [PMC free article] [PubMed] [Google Scholar]
- 21.de Bruin JPC, Sànchez-Santed F, Heinsbroek RPW, Donker A & Postmes P A behavioural analysis of rats with damage to the medial prefrontal cortex using the morris water maze: evidence for behavioural flexibility, but not for impaired spatial navigation. Brain Res. 652, 323–333 (1994). [DOI] [PubMed] [Google Scholar]
- 22.Hyman JM, Wyble BP, Goyal V, Rossi CA & Hasselmo ME Stimulation in Hippocampal Region CA1 in Behaving Rats Yields Long-Term Potentiation when Delivered to the Peak of Theta and Long-Term Depression when Delivered to the Trough. J. Neurosci 23, 11725–11731 (2003). [DOI] [PMC free article] [PubMed] [Google Scholar]
- 23.Lowet E, Roberts MJ, Bonizzi P, Karel J & De Weerd P Quantifying neural oscillatory synchronization: A comparison between spectral coherence and phase-locking value approaches. PLoS One 11, (2016). [DOI] [PMC free article] [PubMed] [Google Scholar]
- 24.Spellman T et al. Hippocampal-prefrontal input supports spatial encoding in working memory. Nature 522, 309–14 (2015). [DOI] [PMC free article] [PubMed] [Google Scholar]
- 25.Otmakhova N, Duzel E, Deutch AY & Lisman J The Hippocampal-VTA Loop: The Role of Novelty and Motivation in Controlling the Entry of Information into Long-Term Memory. in Intrinsically Motivated Learning in Natural and Artificial Systems 9783642323, 235–254 (Springer; Berlin Heidelberg, 2013). [Google Scholar]
- 26.Lemon N & Manahan-Vaughan D Dopamine D1/D5 Receptors Gate the Acquisition of Novel Information through Hippocampal Long-Term Potentiation and Long-Term Depression. J. Neurosci 26, 7723–7729 (2006). [DOI] [PMC free article] [PubMed] [Google Scholar]
- 27.Chen Z et al. Roles of dopamine receptors in long-term depression: enhancement via D1 receptors and inhibition via D2 receptors. Receptors Channels 4, 1–8 (1996). [PubMed] [Google Scholar]
- 28.Hansen N & Manahan-Vaughan D Dopamine D1/D5 receptors mediate informational saliency that promotes persistent hippocampal long-term plasticity. Cereb. Cortex 24, 845–858 (2014). [DOI] [PMC free article] [PubMed] [Google Scholar]
- 29.Lee D, Hyun JH, Jung K, Hannan P & Kwon HB A calcium- A nd light-gated switch to induce gene expression in activated neurons. Nat. Biotechnol 35, 858–863 (2017). [DOI] [PubMed] [Google Scholar]
- 30.Kamondi A, Acsády L, Wang XJ & Buzsáki G Theta oscillations in somata and dendrites of hippocampal pyramidal cells in vivo: activity-dependent phase-precession of action potentials. Hippocampus 8, 244–61 (1998). [DOI] [PubMed] [Google Scholar]
- 31.Takeuchi T et al. Locus coeruleus and dopaminergic consolidation of everyday memory. Nature 537, 357–362 (2016). [DOI] [PMC free article] [PubMed] [Google Scholar]
- 32.Schmidt B et al. Dissociation between dorsal and ventral hippocampal theta oscillations during decision-making. J. Neurosci 33, 6212–6224 (2013). [DOI] [PMC free article] [PubMed] [Google Scholar]
- 33.Tran AH et al. Dopamine D1 Receptor Modulates Hippocampal Representation Plasticity to Spatial Novelty. J. Neurosci 28, 13390–13400 (2008). [DOI] [PMC free article] [PubMed] [Google Scholar]
- 34.Fredes F et al. Ventro-dorsal Hippocampal Pathway Gates Novelty-Induced Contextual Memory Formation. Curr. Biol 1–14 (2020). doi: 10.1016/j.cub.2020.09.074 [DOI] [PMC free article] [PubMed] [Google Scholar]
- 35.Li M, Long C & Yang L Hippocampal-prefrontal circuit and disrupted functional connectivity in psychiatric and neurodegenerative disorders. Biomed Res. Int 2015, (2015). [DOI] [PMC free article] [PubMed] [Google Scholar]
- 36.Laubach M, Amarante LM, Swanson K & White SR What, if anything, is rodent prefrontal cortex? eNeuro 5, (2018). [DOI] [PMC free article] [PubMed] [Google Scholar]
- 37.Abbas AI et al. Somatostatin Interneurons Facilitate Hippocampal-Prefrontal Synchrony and Prefrontal Spatial Encoding. Neuron 100, 926–939.e3 (2018). [DOI] [PMC free article] [PubMed] [Google Scholar]
- 38.Adhikari A, Topiwala MA & Gordon JA Synchronized Activity between the Ventral Hippocampus and the Medial Prefrontal Cortex during Anxiety. Neuron 65, 257–269 (2010). [DOI] [PMC free article] [PubMed] [Google Scholar]
- 39.Ballarini F, Moncada D, Martinez MC, Alen N & Viola H Behavioral tagging is a general mechanism of long-term memory formation. Proc. Natl. Acad. Sci. U. S. A 106, 14599–604 (2009). [DOI] [PMC free article] [PubMed] [Google Scholar]
- 40.Vecsey CGCG et al. Daily acclimation handling does not affect hippocampal long-term potentiation or cause chronic sleep deprivation in mice. Sleep 36, 601–7 (2013). [DOI] [PMC free article] [PubMed] [Google Scholar]
- 41.Oishi N et al. Artificial association of memory events by optogenetic stimulation of hippocampal CA3 cell ensembles. Mol. Brain 12, 1–10 (2019). [DOI] [PMC free article] [PubMed] [Google Scholar]
- 42.Stebbins MJ et al. Tetracycline-inducible systems for Drosophila. Proc. Natl. Acad. Sci. U. S. A 98, 10775–10780 (2001). [DOI] [PMC free article] [PubMed] [Google Scholar]
- 43.Yamada M, Suzuki Y, Nagasaki SC, Okuno H & Imayoshi I Light Control of the Tet Gene Expression System in Mammalian Cells. Cell Rep. 25, 487–500.e6 (2018). [DOI] [PubMed] [Google Scholar]
- 44.Garí E, Piedrafita L, Aldea M & Herrero E A set of vectors with a tetracycline-regulatable promoter system for modulated gene expression in Saccharomyces cervisiae. Yeast 13, 837–848 (1997). [DOI] [PubMed] [Google Scholar]
- 45.Smith AC et al. Dynamic analysis of learning in behavioral experiments. J. Neurosci 24, 447–61 (2004). [DOI] [PMC free article] [PubMed] [Google Scholar]
- 46.Cohen JD, Bolstad M & Lee AK Experience-dependent shaping of hippocampal CA1 intracellular activity in novel and familiar environments. Elife 6, 1–27 (2017). [DOI] [PMC free article] [PubMed] [Google Scholar]
- 47.Vinck M, van Wingerden M, Womelsdorf T, Fries P & Pennartz CMA The pairwise phase consistency: A bias-free measure of rhythmic neuronal synchronization. Neuroimage 51, 112–122 (2010). [DOI] [PubMed] [Google Scholar]
- 48.Cohen MX Analyzing Neural Time Series Data: Theory and Practice. (MIT Press, 2014). [Google Scholar]
- 49.Belluscio MA, Mizuseki K, Schmidt R, Kempter R & Buzsáki G Cross-Frequency Phase{\textendash}Phase Coupling between Theta and Gamma Oscillations in the Hippocampus. J. Neurosci 32, 423–435 (2012). [DOI] [PMC free article] [PubMed] [Google Scholar]
- 50.Keller CJ, Chen C, Lado FA & Khodakhah K The limited utility of multiunit data in differentiating neuronal population activity. PLoS One 11, 1–20 (2016). [DOI] [PMC free article] [PubMed] [Google Scholar]
- 51.Scheffer-Teixeira R, Belchior H, Leao RN, Ribeiro S & Tort ABL On High-Frequency Field Oscillations (>100 Hz) and the Spectral Leakage of Spiking Activity. J. Neurosci 33, 1535–1539 (2013). [DOI] [PMC free article] [PubMed] [Google Scholar]