

Abstract
Symmetric cell division requires the even partitioning of genetic information and cytoplasmic contents between daughter cells. While the mechanisms coordinating the segregation of the genome are well known, the processes which ensure organelle segregation between daughter cells remain less well-understood1. Here, we identify multiple actin assemblies that play distinct but complementary roles in mitochondrial organization and inheritance in mitosis. First, we find a dense meshwork of subcortical actin cables assembled throughout the mitotic cytoplasm. This network scaffolds the endoplasmic reticulum and organizes three-dimensional mitochondrial positioning to ensure the equal segregation of mitochondrial mass at cytokinesis. Second, we identify a dynamic wave of actin filaments reversibly assembling on the surface of mitochondria through mitosis. Mitochondria sampled by this wave are enveloped within actin clouds that can spontaneously break symmetry to form elongated comet tails. Mitochondrial comet tails promote randomly directed bursts of movement that shuffle mitochondrial position within the mother cell to randomize inheritance of healthy and damaged mitochondria between daughter cells. Thus, parallel mechanisms mediated by the actin cytoskeleton ensure both equal and random inheritance of mitochondria in symmetrically dividing cells.
Mitochondria form morphologically complex networks that rapidly fragment upon mitotic entry2,3, decouple from microtubules4, and redistribute throughout the cytoplasm surrounding the mitotic spindle, as seen in cell lines and organotypic cultures (Extended Data Fig.1a–f). The cytoskeleton is a critical regulator of organelle positioning, so we reasoned that upon mitochondrial release from microtubules at the start of mitosis, actin filaments may take over as the dominant mitochondrial scaffold. Actin filaments drive mitochondrial segregation in budding yeast5,6, but whether comparable actin-based mechanisms exist in dividing animal cells remains controversial 4,7, due in part to the challenge of visualizing sparse subcortical actin assemblies underlying the dense, actin-rich mitotic cortex8,9 (Extended Data Fig. 2a).
Leveraging the high sensitivity of Airyscan microscopy we resolved a 3D network of actin cables radiating throughout the metaphase cytoplasm (Fig. 1a, Extended Data Fig. 2b–e). Cables were differentially oriented, forming a lattice-like mesh with a pore radius of 320 ± 160 nm, average maximum circle fitting area of 1.5 ± 0.5 μm2, and estimated cable widths close to or below the diffraction limit. (Extended Data Fig. 2f–k). Actin cables were excluded from the spindle zone but crisscross the organelle-rich cytoplasm, increasing in density in anaphase (Extended Data Fig. 2l–m).
Figure 1: A subcortical actin meshwork scaffolds mitochondria and ER in mitosis.
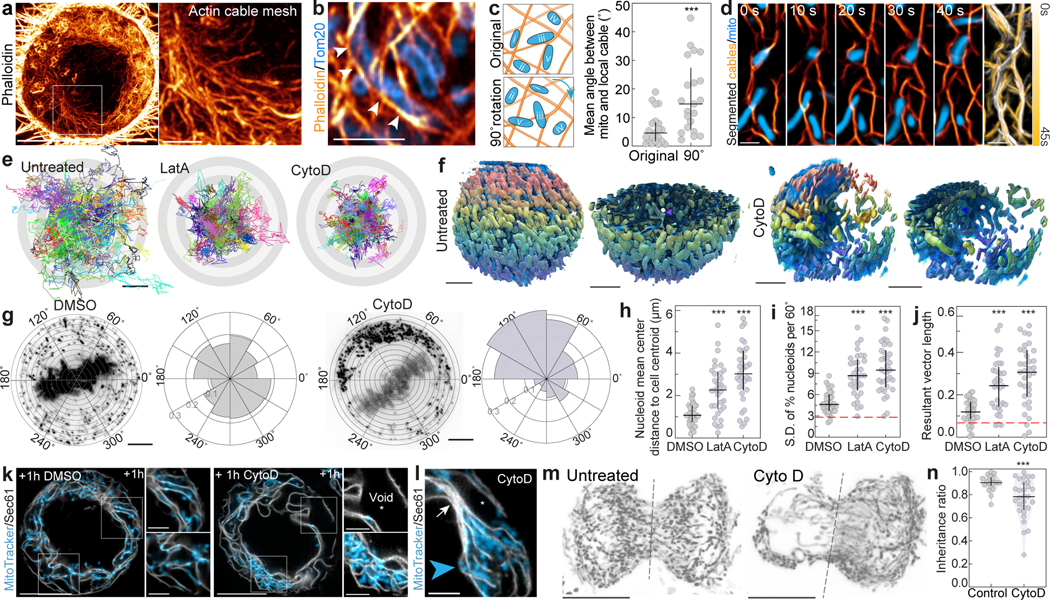
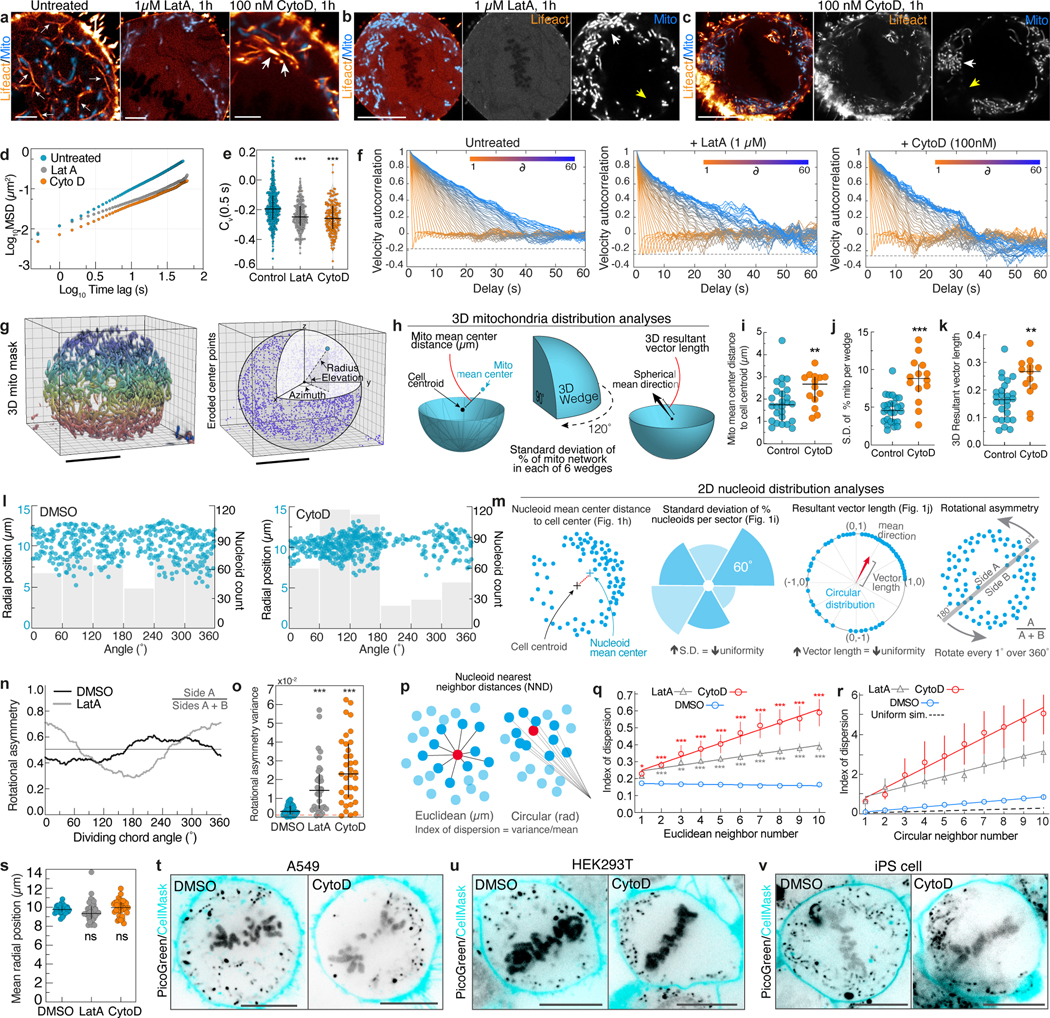
a. Gamma adjusted (0.5) maximum intensity projection of a phalloidin-labeled metaphase HeLa cell. Inset highlights the cytoplasmic actin cable meshwork. b. Tom20-labeled mitochondria align with neighboring phalloidin-stained actin cables (arrows). c. Local co-orientation of mitochondria and neighboring cables is lost upon 90° rotation of mitochondrial image. d. Time series of mitochondria and segmented cables with psuedocolored time-projection indicating cable movement. e. Origin-aligned 60 sec trajectories of 150 mitochondria from untreated, LatA-treated, or CytoD-treated metaphase cells. f. Representative renderings of mitochondria color-coded in z in untreated or CytoD-treated metaphase HeLa cells; full-cell and half-cell views also shown. g. PicoGreen staining of mtDNA nucleoids in DMSO- or CytoD-treated metaphase cells, with polar histograms indicating angular distribution. h. Distance from nucleoid mean center position to cell centroid is increased upon actin cable disruption. i-j. Standard deviation of nucleoid percentage per 60° sector (i) and mean resultant vector length of nucleoid circular distribution (j) increase upon cable disruption. Red lines indicate values from simulations of uniformly positioned nucleoids. k. ER (Halo-Sec61b) and mitochondrial networks (MitoTracker) in metaphase HeLa treated with DMSO or CytoD. Asterisk indicates expanded inter-cisternal voids. l. Metaphase cable disruption induces stacked, collapsed ER sheets (EGFP-Sec61, white arrow) and expanded inter-sheet voids (asterisks) that both exclude mitochondria (MitoTracker, blue arrowhead). m. Mitochondria (Mito-dsRed2) in untreated or CytoD-treated (100 nM) telophase HeLa cells. Dashed line indicates cleavage plane. n. Mitochondrial inheritance ratio is decreased in CytoD-treated cells. Scale bar: (a, k, m) 10 μm, (q, f) 5 μm, (a inset, b, k inset, l) 2.5 μm, (d) 1 μm, (e) 0.5 μm. Sample size: (c) 19 cells, (h-j) 36 DMSO-, 33 LatA-, 35 CytoD-treated cells, (n) 22 control, 29 CytoD-treated cells. All samples were drawn from at least three independent experiments. Statistical tests: (c) two-tailed Mann-Whitney test, ***p=0.0005, (h-j) Ordinary one-way ANOVA with Dunnett’s multiple comparisons test, ***p<0.0001, (n) two-tailed unpaired t-test, ***p=0.0008. Center values/error bars: median ± interquartile range.
We observed close associations between mitochondria and actin cables. Individual mitochondria were positioned within pores of the meshwork, co-orienting with neighboring cables, an alignment observed in all cell lines examined (Fig. 1b–c, Extended Data Fig. 2n–q). Directed translocation of mitochondria along cables was not observed; instead, the movement of both mitochondria and cables appeared diffusive with transient periods of locally correlated motility (Fig. 1d, Extended Data Fig. 2r–w, Video 1). The alignment and co-motility of mitochondria with neighboring cables suggest that brief and reversible tethering events may loosely couple mitochondria to the meshwork.
Elimination of the meshwork with Latrunculin A (LatA, 1μM/1h) or Cytochalasin D (CytoD, 100nM/1h) resulted in mitochondrial aggregation, reduced mitochondrial motility, and global mitochondrial positioning defects within the cytoplasm (Fig. 1e–f, Extended Data Fig. 3a–k). To quantify these defects, we labeled cells with the dsDNA dye PicoGreen, allowing us to localize individual mtDNA nucleoids, even in regions of highly aggregated mitochondrial membranes. Compared to the uniform angular positioning of nucleoids observed in control cells, nucleoids in CytoD- or LatA-treated cells displayed severe angular distribution defects around the spindle. (Fig. 1g–j, Extended Data Fig. 3l–s). Comparable defects in nucleoid positioning were observed in mitotic A549, HEK293T, and iPS cells treated with CytoD (Extended Data Fig. 3t–v), suggesting that actin scaffolding of mitotic mitochondrial networks is conserved among symmetrically dividing mammalian cells.
We hypothesized that the altered mitochondrial positioning and motility induced by cable loss could be a result of increased confinement of mitochondria by the ER, which closely associates with mitochondria via tethering proteins10. In metaphase, the ER adopts a loosely packed sheet-like morphology11, with mitochondria positioned in close alignment with the curvilinear edges of the ER and actin cables threaded through the cytoplasmic voids between adjacent ER cisternae (Extended Data Fig. 4a–d). Disruption of actin cables resulted in ER collapse, with compaction of ER sheets and expansion of inter-cisternal cytoplasmic voids (Fig. 1k, Extended Data Fig. 4e–q, Video 2). Mitochondria were excluded from both collapsed ER stacks and expanded voids, concentrating within pockets of the network (Fig. 1k–l, Extended Data Fig. 4r–v). Thus, we propose that the actin meshwork functions as a semirigid mechanical support that scaffolds mitochondria and associated ER membranes within the metaphase cytoplasm; loss of this scaffold induces progressive ER sheet-to-sheet compaction and resultant mitochondrial distribution defects.
We hypothesized that the irregular mitochondrial positioning we observed in metaphase cells lacking actin cables would induce the asymmetrical inheritance of mitochondrial mass between daughters. In control cells, we observed even apportionment of mitochondria at cytokinesis, while CytoD-treatment induced asymmetric mitochondrial inheritance (Fig 1. m–n). Similar defects in mitochondrial inheritance were previously observed in cells depleted of Myosin 197 (Myo19), suggesting that this mitochondrially-localized actin motor may tether mitochondria to actin cables. Myo19 depletion did not eliminate actin cables but instead induced uncoupling of mitochondria from the meshwork, as well as ER collapse similar to that induced by cable disassembly (Extended Data Fig. 5a–m). Thus, maintenance of normal metaphase ER morphology may require close associations between ER cisternae and mitochondria transiently tethered to a semi-rigid actin meshwork by Myo19.
Actin cables were observed throughout the metaphase cytoplasm, but the most striking subcortical actin feature observed in live cells were revolving “actin clusters” (Extended Data Fig. 6a–b), initially identified by Nishida and colleagues12. These mitotic actin clusters12 appear remarkably similar to interphase mitochondrial actin waves that circle the nucleus every ~15 min 13(Extended Data Fig. 6c–g). To explore whether these dynamics might be related, we tracked mitochondrial actin waves from interphase into mitosis. In all cells examined, the actin wave persisted through the G2/M transition, increasing in frequency and speed due to enhanced rates of filament assembly and disassembly on metaphase mitochondria (Fig. 2a–f, Video 3). In metaphase, ~80% of waves displayed processive unidirectional cycling, moving clockwise or counterclockwise with equal probability (Fig. 2g, Video 4). Mitochondrial actin waves continued through all stages of mitosis before stalling on mitochondria at the cleavage furrow at cytokinesis; cycling subsequently reinitiated at slower interphase rates in each daughter cell (Extended Data Fig. 6h, Video 3).
Figure 2: Mitochondrial actin clouds break symmetry to form elongated comet tails.
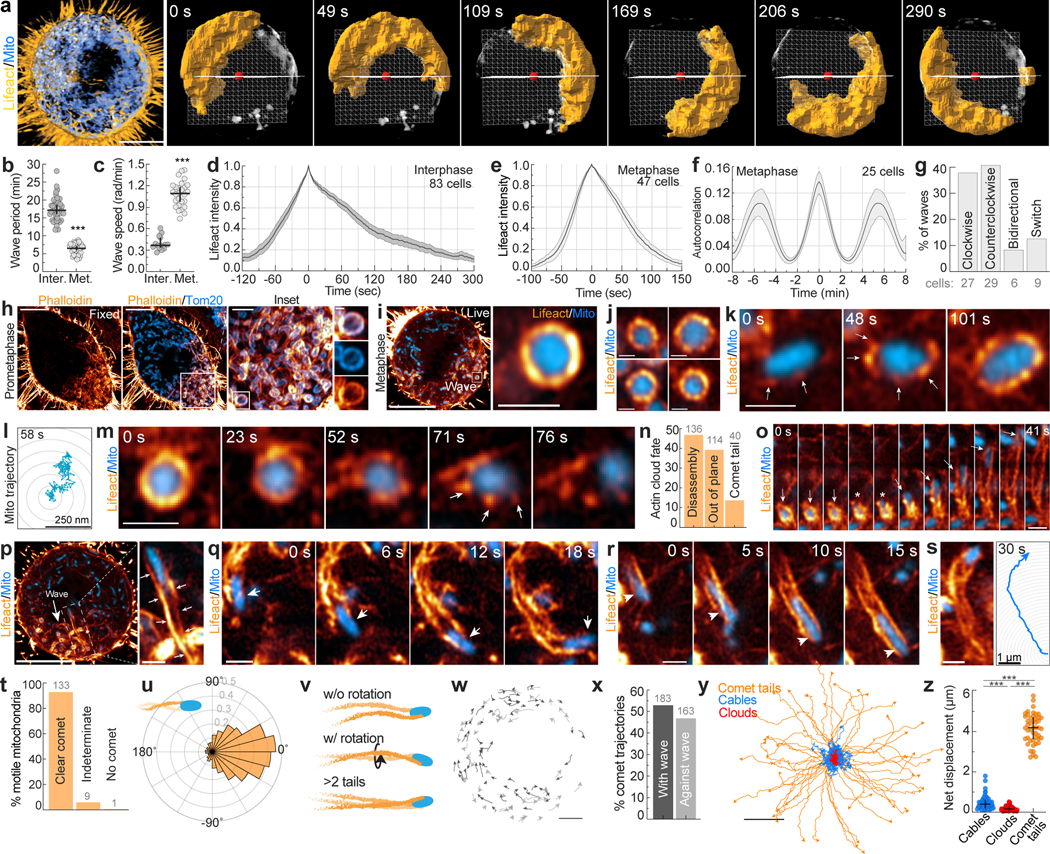
a. Lattice light-sheet rendering of Mito-dsRed2 and Lifeact-EGFP in a metaphase HeLa cells, with 3D segmentation of the mitochondrial actin wave over ~5 min. b-c. Actin wave period (b) and rotational speed (c) in interphase and metaphase. d-e. Kinetics of actin wave assembly and disassembly in interphase (d) or metaphase (e) cells. f. Autocorrelation analysis of metaphase actin waves. g. Directionality of metaphase actin waves. h. Airyscan image of a fixed, phalloidin/Tom20 stained prometaphase HeLa cell with magnified insets of actin assembly on mitochondria. i. Live, metaphase HeLa expressing Lifeact-EGFP and Mito-dsRed2 with magnified inset of a mitochondrial actin cloud. j. Representative mitochondrial actin clouds. k. Time series of actin cloud assembly on a mitochondrion. Arrows indicate actin nodes. l. Trajectory of a cloud associated mitochondrion. m. Time series of actin cloud disassembly. Arrows indicate actin nodes. n. Percentage of clouds that disassemble, move out-of-plane, or break symmetry to form a comet tail. o. Mitochondrial cloud-to-comet tail transition. Arrows: mitochondrial position, asterisks: symmetry breaking event. p. Mitochondrial actin wave with inset showing mitochondrial actin comet tail (arrows). q-r. Representative actin comet tails driving directed mitochondrial movements (arrows). s. Mitochondrial comet tail with associated trajectory over 30 sec. t. Percentage of motile mitochondria in metaphase cells with either clear, indeterminate, or absent comet tails. u. Direction change between each step of mitochondrial comet tail trajectories. v. Schematic illustrating mitochondrial comet tail morphologies observed. w. Comet tail-driven mitochondrial trajectories in metaphase HeLa. x. Percentage of comet tail-based mitochondrial trajectories oriented with or against the direction of the actin wave. y. Origin aligned trajectories of cable, cloud, and comet tail-associated mitochondria over 25 sec. z. Net displacement of mitochondria associated with each actin structure over 25 sec. Scale bar: (a, h, i, p) 10 μm, (w) 5 μm, (h inset) 2.5 μm, (y) 2 μm, (i inset,j,k,m,o, p inset, q,r,s) 1 μm, (h inset 2) 500 nm, (l) 250 nm. Sample size: (b) 41 interphase/37 metaphase cells, (v) 47 comet tails, (z) 59 cables, 47 clouds, 59 comet tails. All samples were drawn from at least three independent experiments. Error bars: (b,c,z) median ± interquartile range, (d,e,f) mean ± 95%CI. Statistical tests: (b,c) two-tailed unpaired t-test, ***p<0.0001, (z) Kruskal-Wallis test with Dunn’s multiple comparisons test, ***p<0.0001.
Close inspection of the actin wave revealed it is primarily composed of F-actin clouds surrounding individual mitochondria (Fig. 2h–j); similar actin clouds were not found on other organelles (Extended Data Fig. 6i–l). In phalloidin-labeled cells, clouds were 3-fold brighter than cables outside of the wave (Extended Data Fig. 7a–d, Video 5). Clouds were characterized by a symmetric nodal organization that develops over ~100s; mitochondria within clouds displayed restricted motility (Fig. 2k–l, Extended Data Fig. 7e–f).
We tracked the fate of 290 actin clouds and identified multiple outcomes. Cloud disassembly was most common, marked by the progressive loss of nodes and resumption of normal diffusive mitochondrial motility (Fig. 2m–n). Unexpectedly, 13% of actin clouds underwent abrupt symmetry-breaking events resulting in directed bursts of mitochondrial motility (Fig. 2n–o). In these events, we observed a gap form between adjacent nodes in the mitochondrial actin cloud that expanded over several seconds until the previously trapped organelle was actively propelled through the opening by the rapid and dramatic elongation of actin comet tails (Fig. 2p, Extended Data Fig. 7g–j, Video 6).
Mitochondrially-associated actin comet tails exhibit a contrail-like morphology, with twin tails emanating from attachment points close to the front of the organelle (Fig. 2q–r). Mitochondria were propelled at a speed proportional to the rate of comet tail extension, often displacing 5 μm or more (Fig. 2s, Video 7). Comet tails were observed in multiple mitotic cell lines and were resolvable behind 96% of directed long-range mitochondrial movements (Fig. 2t, Extended Data Fig. 7l). In contrast to vesicular actin comet tails14,15, mitochondrial comet tails promote highly linear and directed motion (Fig. 2u, Extended Data Fig. 7m–o, Video 7), more closely resembling motility induced by comet tails assembled onto intracellular pathogens such as Listeria16, Rickettsia17, and Shigella18. The elongated, contrail-like tails associated with mitotic mitochondria most closely resemble comet tails nucleated by the Rickettsia protein Sca219.
Polarized comet tails often displayed a helical geometry, consistent with mitochondrial rotation during movement (Fig. 2v). About half of mitochondria (47%) were displaced in a direction opposite of the cycling wave (Fig. 2w–x), indicating that induction of comet tail motility but not its directionality is coupled to the actin wave. Comet tails occasionally regained symmetry, forming clouds that arrested mitochondrial movement (Extended Data Fig. 7p). More frequently, comet tails propelled mitochondria out of the plane of imaging (Extended Data Fig. 7q–t). Comet tail-associated mitochondria move at speeds consistent with actin-based motility20 and persist in the absence of microtubules or Myo19 (Extended Data Fig. 7u–x). Thus, mitochondria associated with actin cables, clouds, and comet tails displayed unique motility signatures (Fig. 2y–z, Extended Data Fig. 7y–z), suggesting that distinct actin assemblies in the deep metaphase cytoplasm differentially regulate mitochondrial positioning and movement.
To elucidate the assembly mechanisms of mitochondrially-associated actin structures, we screened inhibitors of the actin cytoskeleton for effects on actin wave size (Extended Data Fig. 8a–b). Inhibitors of Rho and Rac GTPases predictably altered subcellular actin organization but did not inhibit actin assembly on mitochondria. Inhibition of ROCK or Myosin II modestly reduced wave area. In contrast, inhibition of CDC42, its effector N-WASP, or the Arp2/3 complex significantly decreased actin wave assembly. The pan-formin inhibitor SMIFH2 also impaired wave assembly, though the specificity of this inhibitor has been questioned21. To extend these observations, we performed an siRNA screen of multiple actin binding proteins (ABPs) (Extended Data Fig. 8c–f). Arp3 depletion completely eliminated actin waves, but despite the effects induced by the N-WASP inhibitor wiskostatin, we did not observe a reduction in wave size upon depletion of N-WASP, or other nucleation promoting factors (NPFs) including WAVE1, WASH1, or WHAMM, which may reflect functional redundancy among NPFs or the existence of a yet-unidentified wiskostatin-sensitive NPF on mitochondria responsible for recruiting and activating Arp2/3.
Depletion of the actin elongator VASP significantly inhibited mitochondrial actin waves. Live imaging and immunocytochemistry identified recruitment of VASP and other ABPs to mitochondrially-associated F-actin (Extended Data Fig. 8g–n). While depletion of the mitochondrially-localized actin nucleator Spire1C22 inhibited the wave, knockdown of its ER-localized interaction partner INF223 resulted instead in increased wave size, consistent with observations that this formin accelerates actin disassembly 24. Depletion of three major actin severing proteins; ADF, gelsolin, and cofilin, induced a significant increase in wave area, further suggesting that disassembly is required to maintain wave integrity.
Next, we analyzed mitochondrial distribution, motility and inheritance in cells lacking actin waves. Arp3 depletion most effectively eliminated waves, inducing the complete loss of mitochondrial comet tails without disrupting subcortical actin cables (Extended Data Fig. 9a–b). Mitochondria in Arp3-depleted cells remained aligned with local actin cables, uniformly distributed throughout the cytoplasm, and exhibited diffusive motility (Extended Data Fig. 9c–g, Video 8). Though we observed moderately reduced total mitochondrial network motility, Arp3 depletion did not induce ER collapse nor defects in mitochondrial mass inheritance (Extended Data Fig. 9h–m).
We observed that actin waves shuffle the relative positions of mitochondria within the mother cell (Extended Data Fig. 9n). As mitochondria are varied in their genome, proteome, age, and health25–27, we hypothesized that spatial randomization would ensure each daughter inherits a similar complement of mitochondria during symmetric cell divisions. To explore this, we focally damaged a region of the mitochondrial network at the start of mitosis and examined the dispersion of damaged mitochondria in the presence or absence of an actin wave. We double-labeled control or Arp3-depleted HeLa cells with the mitochondrially-targeted photosensitizer mito-KillerRed and mitochondrially-targeted photoactivatable GFP and irradiated a ~100 μm2 region to simultaneously damage and photolabel a mitochondrial subpopulation (Fig. 3a, Video 9). In control cells, we observed progressively increasing angular spread of the damaged mitochondria. In contrast, dispersion of damaged mitochondria was significantly reduced in Arp3-depleted cells or in cells treated with the Arp2/3 inhibitor CK-666 (Fig. 3a–e, Extended Data Fig. 10a–f). Reduced spread was not a by-product of mitochondrial damage and was not affected by depleting factors required for mitochondrial fusion (Extended Data Fig. 10g–n). These findings support the hypothesis that actin-based motility shuffles mitochondrial positioning during mitosis to promote the dispersion of locally damaged organelles and increase the likelihood of even inheritance by daughter cells.
Figure 3: Actin waves disperse clusters of damaged mitochondria.

a. Time series of mito-KillerRed (mito-KR) and mito-photoactivatable GFP (mito-paGFP) expressing metaphase HeLa cells treated with either NT siRNA (top) or Arp3 siRNA (bottom). Boxes identify regions irradiated with 405nm and 561nm light to simultaneously bleach mito-KR and activate mito-paGFP to focally damage and label the same organelle subpopulation. b. Representative circular density estimations of damaged mitochondria distribution over time in a NT siRNA-treated (top) or Arp3 siRNA-treated (bottom) metaphase cells. Dashed line indicates mean angular position of damaged mitochondria at 0 min. c. Rotational asymmetry plots of damaged mitochondria in NT (top) or Arp3 (bottom) siRNA-treated metaphase cells. See methods for details. d. Resultant vector length of damaged mitochondria over time in NT or Arp3 siRNA-treated HeLa cells with linear regression lines. e. Bounding area of damaged mitochondria in NT or Arp3 siRNA treated metaphase cells. f. Schematic indicating parameters used for simulation. g. (Left) Experimentally derived change in dispersion of damaged mitochondria in NT or Arp3 siRNA-treated cells between 0 and 15 min. (Right) Simulated change in dispersion of damaged mitochondria over 15 min in the presence or absence of actin waves. h-i. Cumulative density estimations of net angular displacement of damaged mitochondria over time in simulations with (h) or without (i) actin waves. j-k. Percentage of damaged and total mitochondria inherited by daughter cell B in simulations with (j) or without (k) actin waves. l-m. Timeseries of mito-KR/mito-paGFP in cells treated with NT siRNA (l) or Arp3 siRNA (m). Dashed line indicates cleavage plane, arrows indicate damaged mitochondria inherited by cell B. Scale bars: (a,l,m) 10 μm. Sample size: (d) 13 NT, 15 Arp3, (e, g) 15 NT, 15 Arp3. All samples were drawn from at least three independent experiments. Statistical tests: (d) Slopes significantly unequal, extra sum-of-squares F Test, ***p<0.0001, (g) two-tailed Mann-Whitney test, ***p<0.0001. Error bars: (g) Box=median ± IQR; whiskers=10–90%; +=mean, (j) Mean ± 95% C.I.
To further test the shuffling hypothesis, we used experimentally derived parameters to simulate actin-based mitochondrial movement in mitosis (Fig. 3j, Video 10), simulating the spreading of a focally “damaged” sub-population of mitochondria, and saw comparable dispersion in simulated and experimental datasets (Fig. 3g). Increasing the duration of mitosis, actin wave size, and comet tail velocity all increased mitochondrial mixing, suggesting that multiple parameters can be tuned to randomize mitochondrial position (Fig. 4h-i, Extended Data Fig. 10 o–q).
Finally, we used the simulation to query the effect of the actin wave on mitochondrial inheritance. Daughter cells inherited equivalent mitochondrial mass in simulations with or without the actin wave, consistent with experimental data (Fig. 3j,k, Extended Data Fig. 9l–m). However, cells with simulated waves were more likely to evenly distribute damaged mitochondria between daughters, an effect that increased over longer durations of mitosis, faster comet speeds, or larger actin waves (Fig. 3j–k, Extended Data Fig. 10 r–s). Consistent with modeling, experimental data revealed that focally damaged mitochondria were more likely to be evenly split between daughters in control as compared to Arp3-depleted cells lacking comet tail-based mitochondrial motility (Fig. 3l–m).
New developments in super-resolution imaging are providing fresh insights into longstanding questions in cell biology. We harnessed these approaches to define fundamental mechanisms in which actin dynamics control mitochondrial organization and inheritance in symmetrically dividing animal cells. We identified three distinct cytoplasmic actin assemblies with complementary roles in organizing mitochondria in mitosis. First, actin cables form a 3D meshwork that scaffolds mitochondria and the ER to maintain their uniform distribution. Next, we used advanced microscopy to identify previously observed “actin clusters” 12 as a wave of F-actin assembly/disassembly on mitochondria. Within this wave, most mitochondria are encased within actin clouds, which can spontaneously break symmetry to form polarized comet tails. Mitochondrial comet tails, analogous to those propelling intracellular bacterial pathogens, drive directed bursts of actin-based motility that shuffle mitochondrial positioning. This shuffling randomizes mitochondrial position, increasing the likelihood that each daughter receives functionally equivalent mitochondrial networks.
In asymmetrically dividing cells, functionally distinct mitochondria are unequally apportioned to influence daughter cell fate26,28. In contrast, symmetric cell division is intended to produce identical daughter cells of comparable fate, an outcome necessary for the continual regeneration of epithelia to maintain tissue homeostasis29. In this context, preventing unequal inheritance may avoid fate divergence, clonal expansion of deleterious mtDNA mutations, or metabolic heterogeneity29,30. The actin-based mixing mechanism described here represents a solution to this problem: just as a card dealer shuffles a deck of cards to guarantee each player receives a fair hand, the actin wave can shuffle mitochondria within the mother cell to guarantee each daughter cell is “dealt” a random and equitable inventory of mitochondria.
Materials and Methods
Plasmids:
pLenti-PGK.Lifeact-EGFP:W (Addgene, 51010), F-tractin-EGFP (Addgene, 58473), F-Tractin (ITPKA)-mNeonGreen (Addgene, 98883), mScarlet-I-UtrCH (Addgene, 98823), Lifeact-mScarlet-N1 (Addgene, 85054), Lifeact-mNeonGreen (Addgene, 98877), Rab7a-EGFP, SKL-EGFP, Halo-KDEL, and Halo-Sec61b (Gifts from C. Obara, Ashburn, VA), Emerald-Sec61b (Addgene, 90992), pKillerRed-dMito (Evrogen, PF964), mito-paGFP (Addgene, 23348), mito-Dendra2 (Addgene, 55796), mito-DsRed2 (gift from T. Schwarz, Boston, MA), mito-mTagBFP2 (Addgene, 105011), pLV-mitoGFP (Addgene, 44385), Emerald-FilaminA-N-9 (Addgene, 54098), Emerald-Cortactin-C-12 (Addgene, 54051), Emerald-VASP-5 (Addgene, 54296), AlphaActinin-mNeonGreen (Allele biotech).
Dyes:
MitoTracker Red CMXRos (100 nM; CST, 9082), MitoTracker Deep Red FM (100 nM; Invitrogen, M22426), TMRE (Life Technologies, T-669), SiR-Lysosome (1 μM; Cytoskeleton inc., CY-SC012), SiR-Actin (1 μM; Cytoskeleton inc., CY-SC001), PicoGreen dsDNA Reagent (1:10000; Invitrogen, P7581), Hoechst 33342 (1:1000; Invitrogen, H3570), Hoechst 34580 (1:1000; Invitrogen, H21486), Alexa Fluor 488 Phalloidin (1:40; Invitrogen, A12379), Alexa Fluor 555 Phalloidin (1:40; Invitrogen, A34055), Alexa Fluor 568 Phalloidin (1:40; Invitrogen, A12380), CellMask Orange (1:2000; Invitrogen, C10045), JF635-HaloLigand (100 nM; gift from L. Lavis, Ashburn, VA).
Antibodies:
1° antibodies: anti-alpha-tubulin clone DM1A (Sigma, T6199), anti-Tomm20 (Abcam, ab78547), anti-Tomm20 F-10 (SantaCruz, sc-17764), anti-HSP60 LK1 (SantaCruz, sc-59567), anti-Filamin 1 E-3 (SantaCruz, sc17749), Anti-Arp3 (Proteintech, 13822-1-AP), anti-Cofilin E-8 (SantaCruz, sc-376476), Anti-Gelsolin GS-2C4 (Abcam, ab11081), anti-ADF (Abcam, ab186754), anti-Cortactin 4F11 (Millipore, 05–180), Anti-pericentrin (Biolegend, 923701), Anti-INF2-CAAX and pan-INF2 (gifts from H.Higgs), Anti-N-WASP (CST, 4848T), Anti-VASP (CST, 3112), anti-WASHC1 (Atlas, HPA002689), Anti-WAVE1 (SantaCruz, sc-271507), Anti-WHAMM (Abcam, ab122572), Anti-Myosin19 (Abcam, ab174286), Anti-MyoVa (SantaCruz, sc-365986). 2° antibodies: Goat-anti-rabbit Alexa Fluor 555 (Invitrogen, A-21429), donkey-anti-rabbit AlexaFluor 594 (Invitrogen, R37119), Donkey-anti-Rabbit Alexa Fluor 647 (Invitrogen, R37119), Goat anti-Mouse Alexa Fluor 488 (Invitrogen, A-11001), Goat-anti-mouse Alexa Fluor 594 (Invitrogen, A11032), Goat-anti-mouse, Alexa Fluor 647 (Invitrogen, A32728), IRDye 800CW Donkey anti-rabbit (Licor, 926–32213), and IRDye 800CW Donkey anti-mouse (Licor, 926–32212).
siRNA:
ON-TARGETplus Non-targeting siRNA #1 (Dharmacon, D-001810-01-20), Myosin 19 (SantaCruz, sc93640), MyoVa (SantaCruz, sc-35995), INF2-CAAX (Dharmacon, ACAAAGAAACUGUGUGUGAUU), INF2 (Santa Cruz, sc-92159), N-WASP (Dharmacon: #1 AAGAAAAGAAGAAGGGAAAUU, #2 CAACUUAAAGACAGAGAAAUU), VASP (SantaCruz, sc- 29516), WASHC1 (Dharmacon, J-190043-(01-04)-0002), WAVE1 (SantaCruz, sc-29516), WHAMM (Dharmacon, L-022415-01), Arp3 (Santa Cruz, sc-29739), Cofilin 1 (CST, 6267S), ADF (SantaCruz, sc- 43200), Gelsolin (SantaCruz, sc-37330), Spire1C (Dharmacon, CCUAGGAUAACCAGUGUAUUU), MFN1 (Santa Cruz, sc-43927), MFN2 (Santa Cruz, sc-43928).
Cell culture
HeLa-M (A.Peden, Cambridge, UK), HaCaT (ATCC), COS-7 (ATCC), ARPE19 (ATCC), HEK293T (ATCC), PTK2 (ATCC), U2OS (ATCC), RPE1 (Janelia Cell Biology Core, Ashburn, VA), MDA-MB-231 (D. Matus, Stonybrook, NY), and A549 (O. Quintero, Richmond, VA) cells were cultured in DMEM with 4.5g/L glucose (Corning, 10-017-CM), 2mM GlutaMAX (Gibco, 35050061), and 10% FBS. HeLa-M and HEK293T were authenticated by STR profiling and tested negative for mycoplasma. 24–48 prior to imaging, cells were seeded on 35mm glass bottom dishes with #1.5 cover glass (MatTek, P35G-1.5-C-C). The human WTC11 iPSC line was a kind gift from Dr. Michael Ward at NIH31. iPSCs were kept on hESC-qualified Matrigel (Corning) and fed daily with Essential 8 medium (Thermo Fisher). The day before transfection, iPSCs were dissociated into single cells with Accutase (STEMCELL Technologies) and plated on imaging dishes (Mattek) at 0.3 ×10⁶ cells per dish in Essential 8 medium containing the ROCK inhibitor Y-27632 (10 μM, Tocris). The next day, medium was exchanged to Essential 8 without ROCK inhibitor.
Embryonic day 18 (E18) rat hippocampal neurons were obtained from the Neuron Culture Service Center at the University of Pennsylvania and plated at a density of 333 neurons per mm on poly-L-lysine-coated (GIBCO) 35 mm glass-bottom dishes (P35G-1.5-20-C; MatTek) and grown in Neurobasal (GIBCO) supplemented with 2% B-27 (GIBCO), 58 mM glucose (Sigma), 2 mM GlutaMAX (GIBCO), 100 U/mL penicillin and 100 mg/mL streptomycin (Sigma). Cells were maintained at 37°C in a 5% CO2 water jacketed incubator.
NHEKs were isolated from discarded, de-identified neonatal human foreskin by a 12h incubation at 4C in 2.4 U/ml dispase II32. The underlying dermis was removed, followed by incubation in 0.25% Trypsin at 37°C for 10m before neutralization in 1ml fetal bovine serum. Cells were dissociated by mechanical scraping, and the resulting cell suspension was passed through a 40 μm strainer. Cell were then centrifuged at 200g for 5m and resuspended in 5 ml M154 (Invitrogen) with 0.07mM calcium.
Organotypic raft cultures
Epidermal differentiation can be modeled using organotypic “raft” cultures. In short, J2 3T3 fibroblasts were embedded within a matrix of type 1 collagen to form a solid raft in the upper chamber of a transwell dish. A confluent monolayer of NHEKs was then seeded on top of the raft. NHEKs monolayers were grown at an air-liquid interface by adding liquid medium to the bottom chamber of the transwell dish. In this system, the NHEKs stratify within seven days to form the normal histological layers of the epidermis, including fully cornified cells2. Coupling organotypic cultures with stable retroviral expression of mito-DsRed2 allowed us to examine the dynamics of mitochondria in metaphase NHEKs within a live, three-dimensional and physiologic context (Extended Data Fig. 1e).
Drug treatments
CK-666 (200μM, 1h; Sigma, SML0006), Latrunculin A (1 μM, 0–2h; Sigma, L5163), Cytochalasin D (100nM, 1–2h; Sigma, C2618), DMSO (1h; Sigma, D2650), Nocodazole (10/25 μM; Sigma, M1404). EHT1864 (20μM, 1h; Tocris), Rhosin hydrochloride (100μM, 1h; Tocris), C3 Transferase (2μg/mL, 3h; Cytoskeleton), Y27632 (10μM, 1h; Sigma), Blebbistatin (85μM, 1h; Sigma), ML141 (25μM, 1h; Millipore Sigma), Wiskostatin (10μM, 1h; TOCRIS), SMIFH2 (25 mM, 1h; Sigma), U0126 (20 μM, 1hr; 19–147, EMD Millipore), Erlotinib (1μg/ml, 1hr; SML2156, Sigma), DMSO (1h; Sigma).
Transient transfection
For transient transfection of HeLa-M, COS-7, HEK293T, A549, and HaCaTs, plasmid DNA was complexed with FuGENE 6 (Promega, E269A) at a 1:3 ratio in 100μL Opti-MEM (Gibco, 31985–070). After a 10 min incubation, the transfection solution was added to cells, which were imaged 18–36h later. siRNA transfection was performed using 40 nM siRNA complexed with Lipofectamine RNAiMAX in Opti-MEM (ThermoFisher). Cells were imaged ~48h post-transfection. For transfection of iPSCs, 2μg plasmid DNA was incubated with 10 μL Lipofectamine Stem (Thermo Fisher) and 200μL OptiMEM for 10m and added dropwise to the dish. Cells were imaged 24h after transfection. Neurons were transfected at two days in vitro (DIV2) with 1μg total DNA (0.5 μg Mito-dsRed2, 0.5 μg Lifeact-EGFP) and 1ul Lipofectamine 2000 (Invitrogen) for 30 min and imaged 16h later.
Stable cell generation
Lentivirus was generated by transient transfection of HEK293T cells seeded in 10cm cell culture plates with psPAX2 (Addgene), VSV-G (Addgene), and Transfer plasmid. At 48–72h post-transfection, the supernatant was harvested, cellular debris was removed by low speed centrifugation, and the viral supernatant was added to cells. Cells were incubated with virus for 4–24h before two complete media changes. Alternatively, Phoenix 293 cells (courtesy of Prof. Garry Nolan, Stanford Univ.) were used to produce replication-deficient amphotropic retrovirus. The pLZRS retroviral packaging vector encoding fluorophore-tagged proteins within the multi-cloning site was used to transfect sub-confluent Phoenix cells grown in DMEM with 10% heat-inactivated FBS (DMEM/hiFBS) in a 60 mm plate. Transfection was carried out using 4 μg of pLZRS DNA combined with 12 μl of FuGene-6 transfection reagent in 800 μl Opti-MEM, which was added to the cells for 18h at 37 °C. Phoenix cells were then passaged in DMEM/hiFBS containing 1 μg/ml puromycin to select for those harboring the pLZRS construct. After 48h, puromycin was removed and replaced with fresh DMEM/hiFBS for 24h at 32°C. The supernatant containing retrovirus was harvested, centrifuged at 200×g for 5 min to remove any Phoenix cells, then aliquots were snap-frozen in liquid nitrogen for long-term storage. Thawed retroviral supernatants with 4 μg/ml polybrene added were used to replace the medium on sub-confluent mammalian cells in 10 cm culture plates at 37 °C for 1–24h depending on the cell type. After the transduction, the viral supernatant was removed, and mammalian cells were washed with PBS, then cultured and passaged in their normal medium. One week after viral transduction, fluorescence activated cell sorting (FACS) was used to isolate single, low-to-middle expressing clones. Monoclonal HeLa-M colonies expressing Lifeact-Scarlet, Lifeact-EGFP, and Lifeact-EGFP with mito-dsRed2.
Western blots
Cells were pelleted and lysed in RIPA buffer [50mM Tris-HCl pH 7.4, 150mM NaCl, 1% Triton-X100, 0.5% deoxycholate, 0.1% SDS] supplemented with protease inhibitors for 30 minutes on ice. After lysis, samples were centrifuged at 17,000xg at 4°C for 10 minutes and the supernatant was collected. Total protein in the lysates was determined by BCA assay (ThermoFisher Scientific). Samples were subjected to SDS-PAGE and then transferred onto FL PVDF membrane.
Membranes were probed with the following primary antibodies: INF2-CAAX & pan-INF2 (gifts from Henry Higgs, 1:1000 both), N-WASP (Cell Signaling Technology, 4848T, 1:1000), VASP (Cell Signaling Technology, 3112, 1:1000), WASHC1 (Atlas, HPA002689, 1:1000), WAVE1 (Santa Cruz Biotechnology, sc-271507, 1:200), WHAMM (abcam, ab122572, 1:250), Arp3 (Proteintech, 13822-1-AP, 1:1000), ADF (Abcam, ab186754, 1:1000), Cofilin (Santa Cruz Biotechnology, sc-376476, 1:1000), Gelsolin (Abcam, ab11081, 1:1000), Myo19 (Abcam, ab174286, 1:2000), MyoVa (Santa Cruz, sc-365986, 1:500). Then, blots were visualized with fluorescent secondary antibodies (Li-Cor) on an Odyssey CLx imaging system.
Blots were analyzed with Image Studio. In place of blotting for a loading control, we used a quantitative fluorescent total protein stain (LI-COR Biosciences). For each lane the background was subtracted and pixel intensity values were summed. Comparison of these sums allowed for determination of relative amounts of protein loaded in each gel well. Normalization factors were applied to measurements on immunoblots in calculating percent knock-down and are shown in representative images as “relative total protein.” Percent knock-down calculations reflect the results of at least three independent experiments.
Live imaging
For the majority of live-imaging experiments, cells were imaged in their culture media (complete DMEM) at 37 °C and 5% CO2. A subset of short term (< 30 min) spinning-disk movies were acquired at 37 °C and ambient CO2. Overnight spinning disk time-lapse experiments as well as all experiments on the LLS microscope were performed in L-15 (Gibco, 11415–064) supplemented with 10% FBS, 100U/ml penicillin and 100mg/mL streptomycin (Sigma). Hippocampal neurons were imaged in Hibernate E (Brain bits). Live imaging experiments were performed on two spinning disk confocal microscopes (SDCM #1: Perkin Elmer UltraVIEW VOX, SDCM#2 Yokogawa CSU-X1), a Zeiss LSM 880 with Airyscan (Zeiss), a VT iSIM (Biovision), a custom grazing-incidence structured illumination microscope (GI-SIM; Lippincott-Schwartz lab), a Leica SP8 Falcon with STED, or a custom Lattice Light Sheet (Janelia AIC).
Immunocytochemistry
Cells cultured on 35mm glass-bottom dishes were fixed in fresh 4% PFA (Electron Microscopy Services, 15710-S) or 4%PFA + 0.2% GA (Electron Microscopy Services, 160000) for 10 min and subsequently washed 3x in PBS. Fixed cells were then permeabilized in 0.2% Triton-X100 for 5 min (if staining membrane proteins) or 0.5% Triton-X100 in PBS for 10 min (if staining cytoskeleton alone), before blocking in 3% BSA in PBS for 10 min at room temperature. For Fig. 1a, cells were pre-extracted with 0.25% (v/v) Triton X-100 and 0.3% glutaraldehyde (v/v) in cytoskeleton buffer for 90 seconds before a 10 min fixation in 2% glutaraldehyde in cytoskeleton buffer33 Glutaraldehyde-induced autofluorescence was quenched by 5 min incubation in freshly prepared 0.1% (w/v) sodium borohydride (Sigma, 452882), followed by a 30 min incubation in PBS with 3% w/v BSA and 0.5% w/ Triton-X100. For tracking experiments on fixed mitochondria (Extended Data Fig. 7z) cells were fixed in 2% glutaraldehyde in cytoskeleton buffer for 10 min, washed 2x in PBS and imaged immediately. Cells were incubated with primary antibodies (1:50–1:500) for 1–3h at room temperature or overnight at 4 °C in PBS with 3% BSA. After primary antibody incubation, cells were washed several times in PBS and incubated with Alexa Fluor secondary antibodies (1:200–1:1000) for 1h. Immediately prior to imaging, cells were incubated with 1:40 Alexa Fluor-labeled Phalloidin for 45 min. Fixed cells were imaged in PBS.
Expansion microscopy
Expansion microscopy (Extended Data Fig 1f) was performed using an adapted protocol from Chozinski et al., 201634. After immunocytochemistry was performed as described above, fixed and stained cells in 35mm MatTek dishes were incubated with 200μL of 0.25% (v/v) glutaraldehyde in PBS for 10 minutes. Cells were then washed 3X in 1X PBS and incubated in 200 μL Monomer solution (1x PBS, 2M NaCl, 2.5% (w/w) acrylamide, 0.15% (w/w/) N,N’-methylenebisacrylamide, 8.6% (w/w) sodium acrylate) for 1 minute. Monomer solution was removed and replaced with 50μL of gelation solution (1.06x Monomer solution, 0.2% (w/w) TEMED, 0.2 % (w/w) APS) and wells were enclosed by coverslips for 30 min. Gels were then incubated with digestion buffer for 30 min before expansion in 50 mL DI water (5X). 4× expanded gels were images on the iSIM using 60X/1.2NA water objective.
Camera-based systems:
Spinning disk confocal microscopy:
Spinning-disk confocal microscopy (SDCM) was performed on one of two systems. SDCM #1 was a Nikon Eclipse Ti inverted scope equipped with PerkinElmer UltraVIEW VOX confocal system (Perkin Elmer) and an EM-CCD camera (Hamamatsu) housed within a 37°C environment chamber. Cells were excited with 405nm, 488nm, 561nm, and 640nm laser lines, and emission was collected using either a 100X/1.49NA apochromat TIRF objective (Nikon) or 60X/1.4NA plan apochromat oil immersion objective (Nikon) with standard emission filter sets. Images were acquired with Volocity acquisition software (Perkin Elmer). Z-stacks were acquired using a piezo motor and step sizes of either 100 nm or 150 nm, requiring ~200–300 steps to fully sample rounded, metaphase cells. 3D image stacks were deconvolved with Huygens Professional v. 19.04 (Scientific Volume Imaging) with the CMLE algorithm and signal-to-noise ratio between 20 and 30, maximum of 40 iterations, and stopping criterion of 0.01. SDCM #2 was a NikonTiE inverted microscope equipped with a spinning-disk scan head (Yokogawa, CSU-X1) and an EM-CCD camera (iXon Ultra 897). Imaging was performed with standard laser-lines with fluorescence emission collected by a 100X/1.49NA apochromat TIRF objective (Nikon). Images were acquired with NIS-Elements AR v4.40.00 (Nikon). Cells were incubated within a Tokai Hit stage top incubator at 37 °C and 5% CO2.
Instant structured illumination microscopy (iSIM)
iSIM images were acquired on a Visitech VT iSIM mounted on an Olympus IX71 inverted microscope with a LCI Chamlide stagetop incubation system (37 °C, 5% CO2) housed within the University of Pennsylvania’s Cell and Developmental Biology (CDB) imaging core. Samples were excited with 488 nm, 561 nm, and 640 nm laser lines and images were collected with a Hamamatsu ORCA Flash 4.0 sCMOS camera. Images were acquired with either an Olympus UPlanSAPO 60x/1.2 NA water immersion objective or a UPlanSAPO 100x/1.4 NA oil immersion. Images were acquired with Metamorph v.7.10.1.161. iSIM images were manually de-striped in imageJ using a notch filter.
Grazing incidence structured illumination microscopy
GI-SIM was performed on a custom-built microscope35 with a 100X/1.49NA objective (Olympus) in a 37 °C, 5% CO2 live imaging chamber. Samples were illuminated with 488/561nm lasers lines and emission was detected by an ORCA-Flash 4.0 sCMOS camera (Hamamatsu) with XY pixel size 0.03955 μm. Images were acquired with LabView software. SIM processing was performed using custom software. Channel alignment was performed on images of TetraSpeck Microspheres (ThermoFisher; T14792) using the descriptor-based registration (2D/3D) plugin36 in Fiji and a rigid 2D transformation model.
Lattice light-sheet microscopy
The lattice light sheet microscope (LLSM) used here is housed in the Advanced Imaging Center (AIC) at the Howard Hughes Medical Institute Janelia research campus. The system is configured and operated as previously described37. HeLa cells were seeded on 5 mm round glass coverslips and grown for 24–48h (Warner Instruments, Catalog # CS-5R). Samples were illuminated by a 2D optical lattice generated by a spatial light modulator (SLM, Fourth Dimension Displays). The sample is excited by 488 nm or 560 nm diode lasers (MPB Communications) through an excitation objective (Special Optics, 0.65 NA, 3.74-mm WD). Fluorescent emission was collected by detection objective (Nikon, CFI Apo LWD 25XW, 1.1 NA), and detected by a sCMOS camera (Hamamatsu Orca Flash 4.0 v2). Acquired data were deskewed as described37 and deconvolved using an iterative Richardson-Lucy algorithm. Point-spread functions for deconvolution were experimentally measured using 200nm tetraspeck beads adhered to 5 mm glass coverslips (Invitrogen,T7280) for each excitation wavelength.
Laser-scanning confocal microscopes
Airyscan microscopy:
Airyscan was performed on an inverted Zeiss LSM 880 equipped with an Airyscan module. Samples were excited with standard laser lines (405nm/488nm/561nm/633nm) and imaged with either a plan apochromat 63X/1.4NA DIC M27 oil objective or a 40X/1.2 NA C-apochromat water objective (Zeiss). Two-color (488nm/561nm) high-speed movies (2–4 fps) were acquired using line scanning mode with 1, 2, 4, or 8-line averaging and a 495–550nm bandpass/570nm longpass emission filter. Z-stacks were acquired using a piezo-motor and Nyquist-optimized z step sizes. Live imaging was performed at 37°C and 5% CO2. Images were acquired and processed using automatic 2D or 3D Airyscan processing in ZEN software (Zeiss).
Stimulated emission depletion (STED) microscopy:
STED was performed on an inverted TCS SP8 STED 3x (Leica) with a pulsed white light laser with tunable excitation from 470 to 670nm. Live Halo-KDEL expressing HeLa cells (Extended Data Fig. 4f) were labeled with JF635-HaloLigand (100 nM) and maintained at 37 C° and 5% CO2. Sample was excited with 633 nm light and depletion was carried out with a pulsed nanosecond 775 nm depletion laser. Images were collected with an HC PL APO 86X/1.2NA water objective (Leica). Images were acquired and processed using LAS X software (v.3.1.5.16308).
Image analysis
Depth color-coded maximum intensity projections were generated in Fiji38 using the “Colorize stack.ijm” macro (https://github.com/ndefrancesco/macro-frenzy) to pseudocolor XY stacks by slice number using the perceptually uniform “Turbo” look up table (https://ai.googleblog.com/2019/08/turbo-improved-rainbow-colormap-for.html) generated for ImageJ (https://github.com/cleterrier/ChrisLUTs). Stacks were then resliced starting at the bottom, and the “Grouped Z Project…” function was used to create 3.7 μm maximum intensity projections.
Actin cable renderings in Extended Data Fig. 1b–c were generated from automatically processed 3D Airyscan stacks (Zen Black, Zeiss). Cortical actin signal was removed in Fiji by tracing a line ~500 nm beneath the cortex in each 2D slice and using the “clear outside” function. Processed stacks were then imported into Imaris 9.5.0 (BitPlane) and rendered using either a shadow projection, with light sources positioned to backlight the cables (Extended Data Fig. 1b), or a blend projection (Extended Data Fig. 1c).
Actin cable segmentation in Extended Data Fig. 1e was generated by manually tracing a 3D phalloidin-stained metaphase HeLa in Amira (ThermoFisher), exporting the results to ImageJ (NIH), and applying a depth coded MIP. Cables (Fig 1d, Extended Data Fig. 1s) were segmented using a ridge detector39 from the Ridge detection plugin (10.5281/zenodo.594213) in Fiji with sigma values between 1–8 depending on signal-to-noise, minimum line length of 6 px to avoid erroneous branching, “extend line” selected, and method for overlap resolution set to “none”. Binary cables were then time averaged with a 5-frame mean filter (2 sec total), thresholded to remove erroneous detections, and filtered with a 1px gaussian blur to simulate cable widths from the real images. Cables were psuedocolored with the “glow” LUT in Fiji.
Actin cable orientation mask:
Actin cables in Extended Data Fig. 1f were segmented using a ridge detector as described above, followed by the “skeletonize” function to generate skeletons of the cable long axis. Orientation maps of the segmented cables were generated in the Fiji plugin OrientationJ40, using a cubic spline gradient with gaussian window sigma = 2 pix. 32-bit NAN background 32-bit cable skeletons were then multiplied by the orientation maps using the image calculator function to calculate the local orientation at each pixel of the cable mesh. The spectrum LUT was used to pseudocolor cables by orientation, before converting to RGB and applying a 1px gaussian blur to simulate cable width.
Cable width analysis:
Actin cable widths (Extended Data Fig. 1i) were analyzed in processed GI-SIM movies of Lifeact-EGFP in the basal cytoplasm of metaphase HeLa cells. 1px line scans were drawn orthogonally to the long axis of the cables and full width at half maximum was determined by gaussian fitting. Parallel measurements were carried out on processed GI-SIM images of 100 nm tetraspeck beads (ThermoFisher).
Actin mesh pore size analysis:
Actin mesh pore size (Extended Data Fig. 1j–k) was estimated by first segmenting actin cables using a ridge detector as described above. Binary images were then inverted, effectively segmenting the inter-cable pores, and the “distance map” function was used to calculate the distance from each pixel in the actin pore to the nearest cable. In MATLAB, the maximum eroded point of the cable pore segmentation was multiplied by the distance map to calculate the average pore radius. Note: only pores completely within the ROI were analyzed: pores center at the edges of the ROI were automatically filtered out. Maximum pore circle fit was defined as the square of the largest pore radius per cell multiplied by π.
Actin cable 2D density:
Cable density (Extended Data Fig. 1l) was calculated on 5×5 μm ROIs drawn entirely within the cytoplasm of phalloidin-stained metaphase or anaphase HeLa cells. The segmented line tool was then used to manually trace all actin cables visible in the window. The total length of the actin cables (μm) was then divided by the area of the ROI (25 μm2) to determine the cable length per unit area (μm per μm2).
Mito/Cable orientation analysis:
Mito/cable orientation (Fig 1C) was performed on ~4×4 μm square ROIs generated from 2D images of Lifeact-EGFP and mito-dsRed2 in the basal cytoplasm of metaphase HeLa cells. Mitochondria and cable long axes were manually segmented using the segmented line tool. Orientation maps of segmented cables and mitochondria were generated in OrientationJ using a cubic spline gradient (gaussian window = 2px). In MATLAB, 32-bit NaN-background mitochondria masks were multiplied by mitochondria orientation maps to calculate the local orientation of all mitochondrial pixels in the ROI. In parallel, mitochondria masks were also multiplied by actin cable orientation maps to calculate the orientation of actin cables nearest each mitochondrial pixel. As orientations are axial data, running from only −90° to 90°, all orientations were multiplied by a 2x correction factor before calculating the mean angle difference between each mitochondrial pixel and its nearest cable neighbor using the circ_dist function in the MATLAB CircStat package41. Average angular differences were then divided by 2 to back calculate relative orientation differences. As a control, the mitochondria mask was rotated 90° degrees and a new orientation map was generated. 32-bit NaN-background 90° rotated mitochondria masks were then multiplied by their own orientation map as well as the original actin cable orientation map, to calculate the relative orientation of shifted mitochondria and their new neighboring cables.
2D metaphase mtDNA nucleoid distribution analyses:
Nucleoid distribution analyses (Fig. 1h–j, Extended Data Fig. 3l–s) were performed on 2D images of metaphase HeLa cells acquired ~10–12 μm above the coverslip. In ImageJ, chromosomal PicoGreen staining was manually segmented and subtracted from the image. Next, the “Find Maxima…” process was used to identify point coordinates for each nucleoid. Finally, the polygon selection tool was used to trace the perimeter of the cell, and the xy position of the cell centroid was determined using the “Measure” command. The xy nucleoid coordinates were exported to MATLAB. Nucleoid mean center to cell centroid distance (Fig. 1h) was determined by averaging the x and y positions of all nucleoids in the cell. This value was then subtracted from the xy position of the cell centroid, and the absolute value was reported as the mean center to cell centroid distance. To carry out radial and angular nucleoid analyses, xy coordinates were converted to polar coordinates about the centroid using the cart2pol function. The standard deviation of percent nucleoids per 60° circle sector (Fig. 1i) was determined using a custom MATLAB script in which the percentage of nucleoids was calculated for each of 6×60° circle sectors. Resultant vector length (Fig. 1j) was determined using the CircStats package in MATLAB41. Nucleoid rotational asymmetry analyses (Extended Data Fig. 3 m–o) were performed using a custom MATLAB script in which the cell is bisected by a dividing chord splitting the cell into equal size semicircles: side A and side B. The dividing chord is then revolved 360° and the proportion of nucleoids on Side A (i.e. Side A / (Side A + Side B) was computed at 1° intervals from 0° to 360°. The resulting curve (shown in Extended Data Fig. 3n) is antisymmetric around 180° with a mean rotational asymmetry value of 0.5. Lower rotational asymmetry variance values indicate more uniform nucleoid positioning. Average Euclidean and circular nearest neighbor distances between each nucleoid and its ten nearest neighbors was calculated in MATLAB using pdist2, and the variance-to-mean ratio (index of dispersion) was plotted. For all nucleoid circular distribution analyses (Fig 1i,j, Extended Data Fig. 3o,r), we performed Monte Carlo simulations of nucleoids drawn from uniform circular distributions to approximate the expected output given true circular uniformity (mean values are shown as red dashed lines).
Cytokinesis Inheritance Ratio:
Analyses were performed on summed intensity projections of mito-dsRed2 expressing cytokinetic HeLa cells. The daughter cell with a smaller mitochondrial network was defined as cell A. Inheritance ratio was calculated as mitochondrial mass in Cell A divided by mass in Cell B. A value of 1 indicates equal inheritance.
3D Mitochondrial mass distribution analysis:
deconvolved spinning disk (Extended Data Figure 3g–k) or lattice light-sheet (Fig. 1f) stacks of metaphase mito-DsRed2 expressing cells were rendered and segmented in Imaris 9.4.0. The “Surfaces tool” was used with the “Shortest Distance Calculation” option selected. Surface detail was set at 0.01 μm with “Smooth” selected. Background subtraction (local contrast) was used with the diameter of largest sphere which fits into the object set to 0.5 μm. The threshold was manually adjusted to mask all mitochondrial signal, and the “Split touching objects (region growing)” option was selected with seed points diameter = 0.75 μm. Seed points were filtered based on quality to remove spurious detections or mitochondria outside of the metaphase cell. The segmentation mask was then statistics coded based on Z position (Jet colormap) and an organic texture map was applied. The mask was then superimposed on a volume rendering (blend) of the raw data for display (Fig 1f, Extended Data Fig. 3g). The cartesian coordinates of mitochondrial center points were exported from Imaris into MATLAB. There, the 3D mitochondrial mean center point was determined by averaging the x,y, and z coordinates. And the mitochondrial mean center distance to the cell centroid was reported (Extended Data Figure 3i). Cell centroids are indicated in Fig 1f as spheres, while mitochondria mean center positions are indicated by prisms. Cartesian center point coordinates were then converted to spherical coordinates about the cell centroid using the MATLAB cart2sph function. Spherical coordinates were converted from radians to degrees with azimuth range [0° 360°] and elevation range [−90° 90°]. Note: 90° elevation corresponds to the top of the cell, 0° to the equator, and −90° to the bottom of the cell (Extended Data Fig. 3g). The standard deviation of mitochondrial mass per wedge (Extended Data Figure 3j) was calculated by dividing the cell into 6 equal sized spherical wedges (3 below the equator, 3 above the equator, each 120° wide), and the percentage of points in each wedge was determined. The standard deviation of percent occupancy for each wedge was plotted. 3D resultant vector length (Extended Data Figure 3k) was performed in MATLAB using elevation and azimuth as previously described42
Inter-cisternal ER void analyses
Curvilinear ER sheet profiles in mitotic HeLa cells were segmented using the ridge detector workflow previously used to segment actin cables. Inter-cisternal ER void size and center positions were determined using the identical workflow to identify actin meshwork pore centers (Extended Data Figure 4j–q). Mean distance from void center to nearest mitochondria (Extended Data Figure 4u) was performed by binarizing mitochondria images in Fiji, generating distance maps representing the distance of all background pixels to the nearest mitochondrion, and, in MATLAB, multiplying the Euclidean distance maps of the mitochondria by binary images of the void centers.
2D Mitochondrial mass distribution analysis:
Binary segmentations of metaphase mitochondria (Mito-dsRed2) after DMSO, CytoD, NT siRNA, Myo19 siRNA (Extended Data Figure 5) or Arp3 siRNA-treatment (Extended Data Figure 9) were generated using the pixel classification workflow in ilastik43. Binaries were then imported to MATLAB and the mean xy position of the mitochondrial network was calculated and the distance between this value and the centroid of the cell (identified in Fiji based on cortical actin signal) was plotted (Extended Data Fig. 5d, 9f). Once in MATLAB, the binary mask was also converted from cartesian coordinates to polar coordinates about the cell centroid using cart2pol. The percent of mitochondrial mass in each 60° sector was calculated as was done with the nucleoids. The standard deviation of the percent mass occupancy was then plotted (Extended Data Fig. 5e, 9f).
3D segmentation of actin wave:
Segmentation of the actin wave from LLS movies (Fig. 2a) was accomplished using a custom Hydra Image Processor44 within MATLAB. Cortical actin and retraction fibers were removed using a cytoplasmic mask derived from the mitochondria channel. The remaining diffusive actin signal was segmented. Each frame was reoriented using a principle component analysis.
Actin wave dynamics:
3D time projection of a metaphase actin wave (Extended Data Figure 6b) was generated in Fiji by using the “oval selection tool” to draw a circle just inside of the metaphase cortex and using the “clear outside” function to crop out the bright cortical actin signal. A 3D projection of the cropped actin was then generated using the “3D project” function. To determine the actin wave period (Fig. 2b), three ROIs were drawn in different regions of the cytoplasm in Fiji. Plot Z-axis profile was then used to determine lifeact intensity within these ROIs. Peaks were manually identified in the Lifeact trace for each box and the mean interpeak distance was calculated and averaged for all three ROIs to calculate mean periodicity. Angular wave speed (Fig. 2c) was determined by manually tracking the centroid of the actin wave using the angle tool in Fiji. Analyses of actin wave rise/fall time (Fig. 2d–e) were performed on cells imaged at 2 seconds per frame. In Fiji, 4px line scans were drawn in cytoplasmic regions perpendicular to the plasma membrane. Plot Z-axis profile was used to generate traces of actin intensity over time. Actin intensity traces were smoothed using Sovitsky-Golay filtering in MATLAB and intensity values were linearly rescaled from 0–1. Peaks were then manually aligned in Excel (Microsoft) such that max intensity values corresponded to t=0. Aligned curves were then plotted in Prism 8 (GraphPad). The temporal autocorrelation of actin intensity (Fig. 2f, Extended Data Fig 6d) was computed according to the standard definition of the unbiased estimate of the discrete autocorrelation function, implemented in MATLAB. To mitigate time-dependent fluctuations in background intensity, the varying baseline actin signal over time was corrected using msbackadj. Next, the unbiased temporal autocorrelation function was computed using the xcorr function. The mean and 95% confidence intervals for the autocorrelation signal were computed using bootstrapped resampling with 1000 repeats. Actin wave directional bias (Extended Data Fig. 6e) was determined by tracking the position of the actin wave over 100 min (50 steps), and assigning clockwise steps values of +1, counterclockwise steps values of −1, and stationary events values of 0.
Actin wave area:
2D cross-sectional wave area (Extended Data Figure 8a,c) was manually determined using the freehand selection tool and measure area function in Fiji.
Cable/cloud phalloidin intensity:
Relative phalloidin intensity for actin clouds and cables (Extended Data Figure 7d) was calculated by averaging the mean intensity of ten line scans drawn at the cell cortex, in the actin wave (clouds), or along actin cables. Intensity values for clouds and cables were divided by intensity of the cortical phalloidin. Of note, this analysis cannot be used to directly deduce total F-actin in each structure, as phalloidin accessibility may differ between these networks.
Mitochondria Tracking:
Mitochondria trajectories were generated using a semiautomated tracking workflow in the TrackMate45 Fiji plugin. A Laplacian of Gaussian (LoG) detector was used to identify mitochondria with an estimated blob diameter of 0.4–0.6 μm, a threshold value that minimized spurious detections (typically between 30 and 70) and sub-pixel localization. Spots were further manually filtered using the add or delete spot tool. The simple linear assignment problem (LAP) tracker was then used to generate trajectories with linking max distance set to 0.5 μm, gap-closing max distance set to 0.5 μm, and gap-closing max frame gap set to 1. Tracks were filtered to remove incomplete trajectories or those that were clipped at the X or Y edges of the image. Tracking was performed on Airyscan movies acquired at 500 ms per frame over 121 steps (Fig 1) or 50 steps (Fig 3). Origin aligned tracks were randomly colored and plotted using a custom MATLAB script. Mean squared displacement (MSD) and autocorrelations were computed in MATLAB using the msdanalyzer package46. Ensemble analysis of the mean squared displacements of mitochondria was performed using Bayesian MSD model fitting using the technique of Monnier et al47. Automated tracking of glutaraldehyde-fixed mitochondria was used to estimate localization/tracking error. Discretized velocity autocorrelations (Extended Data Figure 3f) were generated as previously described48 using a custom MATLAB script courtesy of S. Weber (McGill University, Montreal).
Cumulative time projections/Displacement index:
Cumulative maximum intensity time projections of mitochondria in metaphase cells (Extended Data Figure 9h) were generated using the “Z-project” function in Fiji. Mitochondria signal was segmented using the pixel classification tool in ilastik and total mitochondrial area was calculated using the “analyze particles” function in Fiji. Percent of cell explored by mitochondria (Extended Data Figure 9i) was calculated by dividing the mitochondrial area in 5-minute cumulative projections by the total cell area. Displacement index (Extended Data Figure 9j) was calculated as described previously49 by dividing mitochondrial area in the 5 min cumulative projection by mitochondrial area in frame 1 at 0 min.
Damaged, photoactivated mitochondria dispersion analyses:
Maximum intensity projections of Mito-paGFP were thresholded in Fiji using Otsu’s method and binary masks were imported into MATLAB. A custom script was then used to convert XY positions of mitochondria pixels to polar coordinates and the circular mean of the mitochondrial position was calculated using the Circ Stats package41. Thresholded pixels were reoriented so that the angle of the circular mean was equal to 0° and all pixels were between −180° and 180° of that point. The angular distribution of mitochondrial mass at different time points (Fig 3b, Extended Data Fig. 10h,n) was then plotted in MATLAB using a kernel smoothing density estimate for circular data (Vlad Atanasiu (2020), MATLAB Central File Exchange). Rotational asymmetry analysis (Fig 3c) was performed by bisecting the cell with a dividing chord running through the mean angle of damaged mitochondria at time 0 (0°) and rotating the axis at 1° intervals over the entire circle (0°−360°) at each time point. Asymmetry was calculated as the mass of damaged mitochondria on side A divided by the total mass of damaged mitochondria in the cell (side A + side B). The progressively decreasing amplitude of the rotational asymmetry plot in NT siRNA-treated cells indicates increased dispersion and spatial uniformity of the damaged mitochondria. The mean rotational asymmetry over a half-turn of the bisecting cord (i.e. 0° - 180°) is reported in Extended Data Fig 10d. The resultant vector length (Fig. 3d) of damaged mitochondria around the spindle was calculated using the circular statistics package in MATLAB41. The bounding area of damaged mitochondria (Fig 3e) was calculated by manually circumscribing the activated paGFP in Fiji using the freehand selection tool. XY mass shift (Extended Data Figure 10e) was determined by calculating the average XY position of binarized paGFP between each frame and dividing by the time interval.
Modeling actin dynamics
All data were generated from simulations written in MATLAB. This type of stochastic simulations, where space is continuous and time is discrete, has been previously described50. In these simulations, mitochondria were simulated as a set of (x,y) coordinate pairs moving according to a random walk inside a mitotic circular cell containing a circular spindle in the center. Mitochondria cannot move outside the cell or inside the spindle. Several parameters were set at the beginning of a simulation: the radius of the circular spindle (to create an area of approximately 131.4 μm2), the radius of the cell (to create an area of approximately 551.6 μm2), the percent of the cell cytoplasm that the actin wedge occupies (approximately 96 μm2), the speed of the actin wedge (approximately 1.15 radians/sec), the number of mitochondria (92 total), the effective diffusion coefficient of mitochondria outside of the actin wedge (0.0046 μm2/sec), and the effective diffusion coefficient of mitochondria associated with an actin comet tail (0.057 μm2/sec). All these parameters were determined experimentally. The values of the diffusion coefficients were calculated to allow mitochondria to move with speeds of approximately 68 nm/sec and 237 nm/sec. Also, we simulate mitochondria photoconversion by labeling all mitochondria within a randomly selected area of the cell; exactly 25% of the cell, as performed experimentally. Photoconverted mitochondria were depicted as larger dots than non-photoconverted mitochondria.
Every run of the for loop is equivalent to 2 seconds, during which mitochondria move according to numbers sampled from the standard normal distribution scaled by the square root of 2*D*Δt where D is the effective 1D diffusion coefficient, and Δt is 2 seconds. Mitochondria were forced to stay inside the cell but outside the spindle by resampling an angle from 0 to 2π if a particular step would make them enter these forbidden regions. All mitochondria outside of the wedge move with a speed of 68 nm/sec. If a mitochondrion is inside a wedge, it has a 10% chance of growing a comet tail, at which point it will move with a speed of 237 nm/sec and be perfectly persistent. The other 90% of mitochondria inside the wedge become immobile. Mitochondria retain an actin comet tail for 14 seconds only, i.e. 7 steps of the for loop. After this time, the mitochondrion will become immobile if it is still inside the wedge, and another mitochondrion inside the wedge will grow an actin comet tail. We ran simulations for a total of 15 minutes (450 steps) and 30 minutes (900 steps). At the end of a simulation, Δθ, i.e. the radial displacement of a particular mitochondrion, was calculated for each photoconverted mitochondrion.
Cartoon schematic in Extended Data Figure 4v was generated using BioRender.
Statistics and Reproducibility:
Statistical analysis and graphing were carried out using Prism 8.0 or MATLAB. Normality testing (D’Agostino-Pearson) was performed to determine whether to use parametric or non-parametric statistical tests. For the comparison of two data sets, normally distributed data were analyzed by two-tailed unpaired Student’s t-test, while non-normally distributed data were analyzed by two-tailed Mann-Whitney test. To compare more than two normally distributed datasets, we used ordinary one-way ANOVA with either Dunnett’s multiple comparisons (to compare the mean of each column with a control column) or Tukey’s multiple comparisons test (to compare the mean of each column with every other column). To compare more than two non-normally distributed datasets, we used the Kruskal-Wallis test with two-sided Dunn’s multiple comparison test.
All statistical analyses were performed on samples drawn from at least 3 independent experiments. All representative micrographs were selected from data sets from at least 3 independent experiments.
Extended Data
Extended Data Figure 1. Mitochondrial networks are uniformly distributed throughout the cytoplasm surrounding the mitotic spindle.
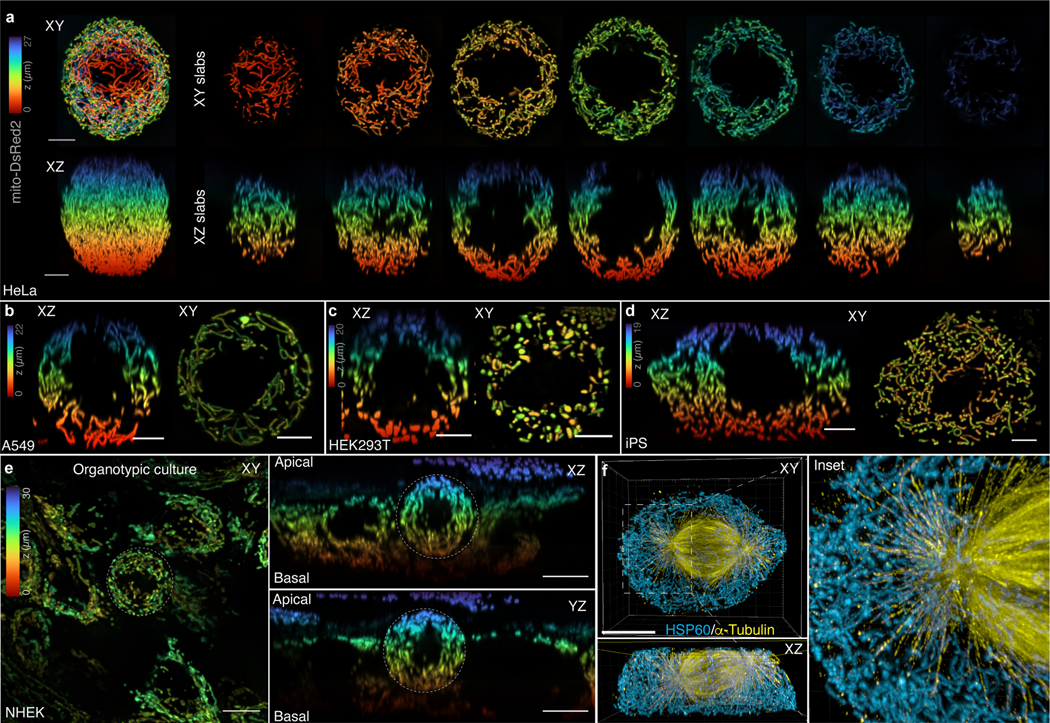
a. Z-coded XY and XZ maximum intensity projections of ~4 μm slabs through a live, metaphase HeLa expressing Mito-dsRed2. Mitochondria are excluded from the spindle region and are uniformly distributed above, below, and around the spindle. b-d. Z-coded XY and XZ maximum intensity projections of ~4 μm sections through the center of (b) A549, (c) HEK293T, and (d) iPS cells expressing Mito-dsRed2. Scale bars = 5 μm. e. Z-coded XY (left) and XZ (right) maximum intensity projections of ~ 4μm sections through the center of a live, organotypic culture of normal human epidermal keratinocytes (NHEK) expressing Mito-dsRed2. f. 4× expanded iSIM rendering of mitochondria (anti-HSP60) and microtubules (anti-α-tubulin) in a prometaphase HeLa. Mitochondria are entirely excluded from the spindle and show limited overlap with astral microtubules. Scale bars 40 μm (f), 10 μm (e), 5 μm (a-d).
Extended Data Figure 2. A 3D meshwork of actin cables associates with mitochondrial networks in the deep metaphase cytoplasm.
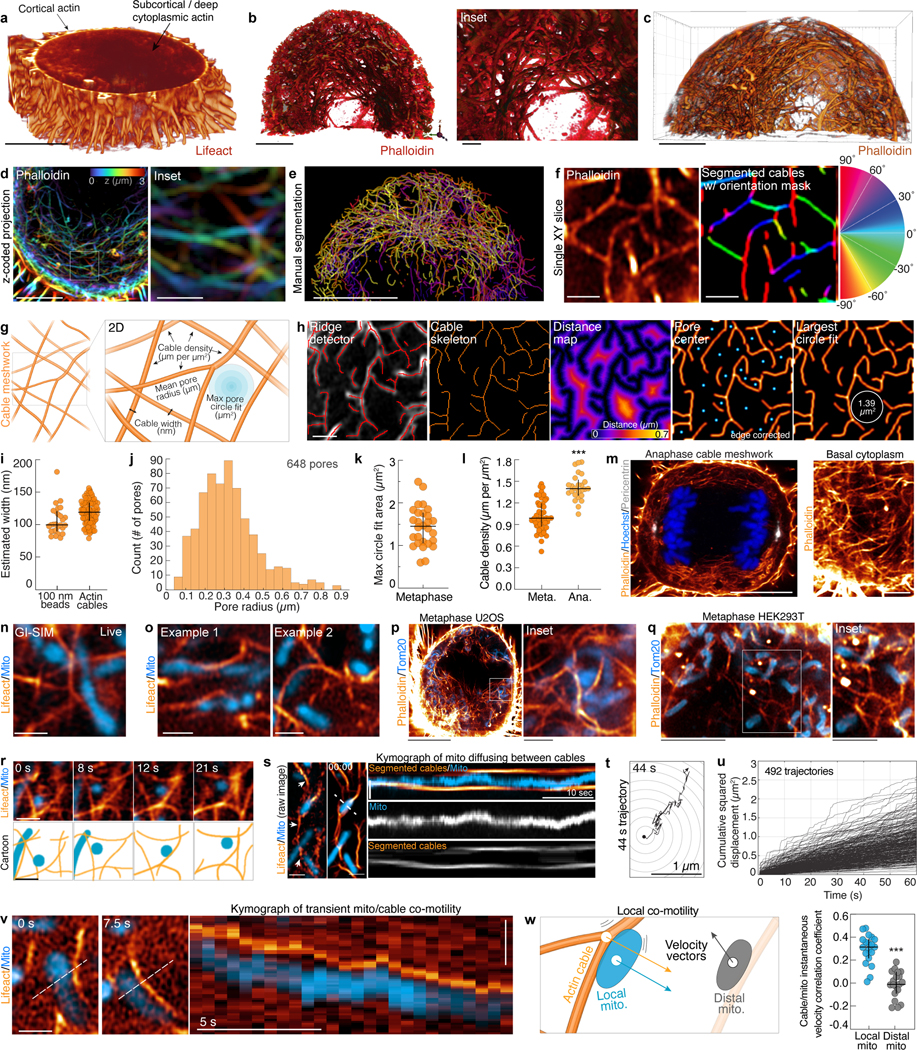
a. 3D rendering of the bottom third of a live, Lifeact-EGFP expressing metaphase HeLa imaged by spinning disk confocal microscopy. While the cortical actin signal is well resolved, lower contrast deep subcortical actin assemblies appear hazy and ill-defined. b. Shadow projection of subcortical/cytoplasmic actin in a fixed, phalloidin-AF488 stained HeLa. Inset shows 3D meshwork of actin cables. Volume was acquired by Airyscan microscopy and the brighter cortical actin signal was computationally masked and removed. c. Blend projection of actin cables (AF488-phalloidin) in a metaphase HeLa. Volume was acquired by Airyscan and processed as in (b). d. Z-coded maximum intensity projection of the actin meshwork (AF488-phalloidin) in a prometaphase HeLa with zoomed-in inset. e. Manual segmentation of actin cables in one half of a metaphase HeLa. f. Single-slice, Airyscan image of metaphase actin cables (AF488-Phalloidin). Segmented cables are pseudocolored by relative orientation (−90°– 90°). g. Cartoon schematic of actin cable meshwork indicating parameters used for analysis. h. Representative actin cable analysis workflow showing ridge detection to identify and skeletonize cables, Euclidean distance mapping to identify pore centers, and largest circle fitting technique to estimate max pore size. All analyses were performed on 2D slices in the basal metaphase cytoplasm. i. Estimated width of actin cables and 100 nm TetraSpeck beads imaged by grazing-incidence structured illumination microscopy (GI-SIM). Widths are based on full width at half maximum (FWHM) of gaussian fits of 1 px line scans through individual cables. j. Frequency distribution of actin mesh pore radii. k. Area of largest actin meshwork fitting circle. l. Actin cable density in metaphase or anaphase HeLa. m. Airyscan image of actin cables (phalloidin), DNA (Hoechst), and centrosomes (anti-pericentrin) in a central slice of an anaphase HeLa. Inset of actin cables in the basal cytoplasm is shown on the right. n. GI-SIM image of mitochondria (mito-dsRed2) co-orientation with actin cables (Lifeact-EGFP). o. Airyscan images of mitochondria associated with actin cables in live metaphase HeLa cells. p. Mitochondria (anti-Tom20) associated with actin cables (phalloidin) in a metaphase U2OS. q. Mitochondria (anti-Tom20) associated with actin cables (phalloidin) in a metaphase HEK293T. r. Airyscan montage and cartoon of a mitochondrion oscillating between actin cables in the metaphase cytoplasm. s. Raw Airyscan image of mitochondria (Mito-dsRed2) and actin cables (Lifeact-EGFP, arrows) in the deep cytoplasm of a metaphase HeLa (left). Segmented, median-time averaged image of the same region used in Fig. 1d (center). Kymograph indicating an individual mitochondrion oscillating between two neighboring actin cables. t. Representative 44 s trajectory of mitochondria within the actin cable mesh. u. Cumulative squared displacement of mitochondria diffusing within the actin cable meshwork. v. Montage and kymograph of transient mitochondrial co-motility with a local actin cable. w. Cartoon indicating co-motility between a cable and an immediately adjacent (local) mitochondrion. Instantaneous velocity correlation coefficient for actin cables with either local or distal mitochondria. Scale bars: (a, c, e, m left, p) 10 μm, (b,d,q) 5 μm, (m right, q inset) 2.5 μm, (b inset, d inset, f, h, n, o, p inset, r, s, t, v) 1 μm. Sample sizes: (i) 100 cables from 20 cells, (j-k) 28 cells, (l) 46 metaphase cells, 25 anaphase cells, (w) 19 cells. Samples were drawn from at least three independent experiments. Statistical tests: (l, w) two-tailed unpaired t-test ***p<0.0001. Center value/error bars: (i, j, k, l, w) Median ± interquartile range (IQR).
Extended Data Figure 3. Disruption of the actin cable meshwork impairs metaphase mitochondrial motility and distribution.
a. F-actin (Lifeact-EGFP) and mitochondria (Mito-dsRed2) organization in untreated, Latrunculin A-treated (LatA; 1 μM, 1h), and Cytochalasin D-treated (CytoD; 100nM, 1h) metaphase HeLa cells. Small arrows indicate actin cable network in untreated cells. Large arrows indicate aggregated actin cables in CytoD- treated cell. b. Metaphase HeLa treated with 1 μM LatA for 1h. LatA treatment eliminated subcortical actin structures (Lifeact-EGFP) with minimal effects on cell geometry. White arrowhead indicates region of clumped mitochondria (Mito-dsRed2). Yellow arrows indicate cytoplasmic regions with decreased mitochondrial density. c. Representative metaphase HeLa treated with 100 nM CytoD for 1h. CytoD treatment induced collapse of the meshwork (Lifeact-EGFP) and marked disorganization of actin cables. As with LatA treatment, CytoD treatment induced mitochondrial aggregation (Mito-dsRed2). d. Mean squared displacement (MSD) of 60 s mitochondrial trajectories in untreated, LatA-treated, or CytoD-treated metaphase cells. Log-log Scale bar. e. Velocity autocorrelation at 0.5 s delays (Cv(0.5 s)) for mitochondrial trajectories from untreated, LatA- treated, or CytoD-treated metaphase HeLa cells. f. Discretized velocity autocorrelations of 60 s mitochondrial trajectories in untreated, CytoD-treated, or LatA-treated cells. g. (left) 3D segmentation mask of mitochondria (mito-DsRed2) in a live metaphase HeLa (pseudocolored by z-position). (right) Eroded points derived from the mitochondrial mask with schematic indicating spherical coordinate system with origin at the cell centroid. h. Schematic indicating 3D mitochondrial distribution analyses. i. 3D mitochondrial mean center distance to cell centroid in untreated or CytoD-treated cells. j. Standard deviation of the percent of the mitochondrial network in each of 6 equal sized 3D wedges from control (untreated) or CytoD-treated cells. Wedges were specified by azimuthal values of 0° – 120°, 120° – 240°, and 240° – 360° in either the bottom hemisphere (i.e. elevation −90°– 0°) or the top hemisphere (i.e. elevation 0° – 90°). k. 3D resultant vector length for control (untreated) or CytoD-treated cells. l. Scatter plot of nucleoid radial (y axis) and angular (x axis) positions superimposed on histograms of nucleoid count per 60 ° from DMSO and CytoD treated cell in Fig. 1g. m. Schematic indicating 2D mtDNA nucleoid distribution analyses. n. Example rotational asymmetry traces of nucleoids in a DMSO or LatA-treated metaphase cell. Asymmetry was calculated as the ratio of nucleoids on side A to the total number of nucleoids (A+B) upon rotating the dividing chord by 1° intervals over 360°. o. variance of rotational asymmetry over 360 ° for DMSO, CytoD, or LatA-treated cells. p. Schematic indicating Euclidean and circular nearest neighbor distance analysis for nucleoids. Index of dispersion for ten nearest neighbors of all nucleoid in a cell is reported. q. Index of dispersion of Euclidean nearest neighbor distances between all nucleoids and their ten nearest neighbors in cells treated with DMSO, LatA, or CytoD. r. Index of dispersion of circular nearest neighbor distances between all nucleoids and their ten nearest neighbors in cells treated with DMSO, LatA, or CytoD. s. Mean nucleoid radial position in cells treated with DMSO, CytoD, or LatA t. Mitochondrial nucleoids (PicoGreen) and plasma membrane (Cell Mask Orange) in metaphase A549 cells treated with DMSO (left) or 100 nM CytoD (right). u. Mitochondrial nucleoids (PicoGreen) and plasma membrane (Cell Mask Orange) in metaphase HEK293T cells treated with DMSO (left) or 100 nM CytoD (right). v. Mitochondrial nucleoids (PicoGreen) and plasma membrane (Cell Mask Orange) in metaphase iPS cells treated with DMSO (left) or 100 nM CytoD (right). Scale bars: (b, c, g, t-v) 10 μm, (a) 2.5 μm. Sample sizes: (d-f) 479 control, 232 LatA-treated, and 185 CytoD-treated mitochondria trajectories, (i-k). 26 untreated, 14 CytoD treated cells, (o, q-s) 36 DMSO-treated, 33 LatA-treated, and 35 Cyto-D treated cells. Samples were drawn from at least three independent experiments. Statistical tests: (e,o) Kruskal-Wallis test with Dunn’s multiple comparisons test ***p<0.0001, (i) two-tailed Mann-Whitney test **p=0.0099, (j) two-tailed unpaired t-test ***p<0.0001, (k) two-tailed unpaired t-test ** p=0.0025, (q) two-way RM ANOVA with Dunnet’s multiple comparisons test, neighbor 1: DMSO vs. LatA, p=0.0833, DMSO vs. CytoD *p=0.0288; neighbor 2: DMSO vs. LatA ***p<0.0001, DMSO vs. CytoD ***p=0.0002; neighbor 3: DMSO vs. LatA ***p<0.0001, DMSO vs. CytoD, **p=0.0026; neighbor 4: DMSO vs. LatA ***p<0.0001, DMSO vs. CytoD ***p=0.0004; neighbor 5: DMSO vs. LatA ***p<0.0001, DMSO vs. CytoD ***p=0.0002; neighbors 6–10: DMSO vs. LatA ***p<0.0001, DMSO vs. CytoD ***p<0.0001. (s) Kruskal-Wallis test with Dunn’s multiple comparisons test, DMSO vs. LatA p=0.2294, DMSO vs. CytoD p=0.6893. Center value/error bars: (e,i-k,o,s) Median ± IQR, (q-r) Mean ± SEM.
Extended Data Figure 4. Disruption of the actin cable meshwork results in metaphase ER collapse.
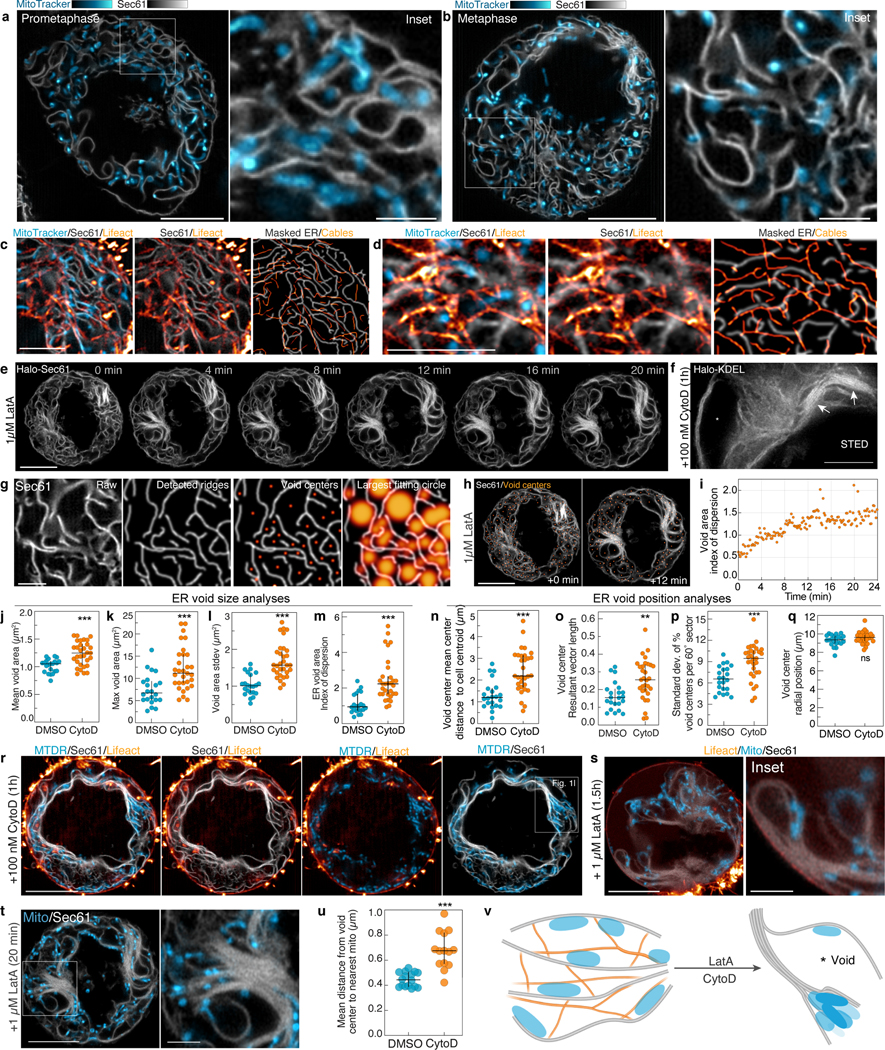
a. iSIM slice of ER (EGFP-Sec61) and mitochondria (MitoTracker DeepRed) in a prometaphase HeLa. b. iSIM slice of ER (EGFP-Sec61) and mitochondria (MitoTracker DeepRed) in a metaphase HeLa. c. iSIM image of ER (EGFP-Sec61), mitochondria (MitoTracker DeepRed), and actin (Lifeact-mScarlet) with accompanying segmented/masked images. d. Airyscan image of mito-dsRed2 (blue), Halo-Sec61 (gray), and Lifeact-EGFP (orange) in a metaphase HeLa cell with accompanying masked images of actin cables and ER profiles. e. Airyscan montage of ER cisternal collapse after addition of 1 μM LatA. f. Stimulated emission depletion (STED) image of ER (Halo-KDEL) in a metaphase HeLa treated with 100 nM CytoD for 1h. Arrows indicate tightly stacked ER sheets. Asterisk indicates expanded cytoplasmic void between ER sheets. g. Representative analysis workflow for estimating the size of voids between ER sheets. h. Timepoints at 0 and 12 minutes from panel e are shown with void center positions in orange. i. Index of dispersion (variance-to-mean ratio) of areas of cytoplasmic voids from the cell shown in e over 24 minutes. Latrunculin A (1 μM) was added at time 0. j-m. Inter-cisternal ER void size analyses in DMSO or CytoD-treated cells, including mean inter-cisternal void area (j), maximum void area (k), standard deviation of void area (l), and index-of-dispersion of void area (m). n-q. Inter-cisternal ER void center position analyses, including void mean center distance to cell centroid (n), void center resultant vector length (o), standard deviation of void center occupancy per 60° sector (p), and void center radial position (q). r. iSIM image of Lifeact-mScarlet, EGFP-Sec61, and MTDR in a metaphase HeLa treated with CytoD for 1h. Magnified inset is shown in Fig. 1l. s. Representative example of cisternal collapse and mitochondrial confinement in a metaphase HeLa treated with LatA (1μM, 1.5h). t. Airyscan image of the cell from (e) at 20 min showing both ER (Halo-Sec61) and mitochondria (mito-dsRed2). u. Mean distance from void center positions to nearest mitochondria is significantly increased in CytoD-treated cells. v. Cartoon schematic indicating close association between mitochondria (blue) and both ER sheets (gray) and actin cables (orange). Elimination of actin cables by LatA or CytoD results in ER disorganization, characterized by inter-cisternal ER void collapse and expansion, effectively displacing mitochondria from regions of the metaphase cytoplasm. Scale bars: (a,b,e,h,r,s,t) 10 μm, (c,d,f), 5 μm, (a inset, b inset, g, s inset) 2.5 μm. Sample sizes (j-q) 22 DMSO-, and 31 CytoD-treated cells. (u) 16 DMSO-treated, 14 CytoD-treated cells. Samples were drawn from at least three independent experiments. Statistical tests: (j,l,n) two-tailed unpaired t-test ***p<0.0001, (k) two-tailed unpaired t-test ***p=0.0003, (m, u) two-tailed Mann-Whitney test ***p<0.0001, (o) two-tailed unpaired t-test, **p=0.0016 (p) two-tailed unpaired t-test, ***p=0.0002 (q) two-tailed unpaired t-test, p=0.0975. Center values/error bars: (j-q,u) Median ± IQR.
Extended Data Figure 5. Myosin19 links mitochondria and associated ER membranes to the actin cable meshwork.
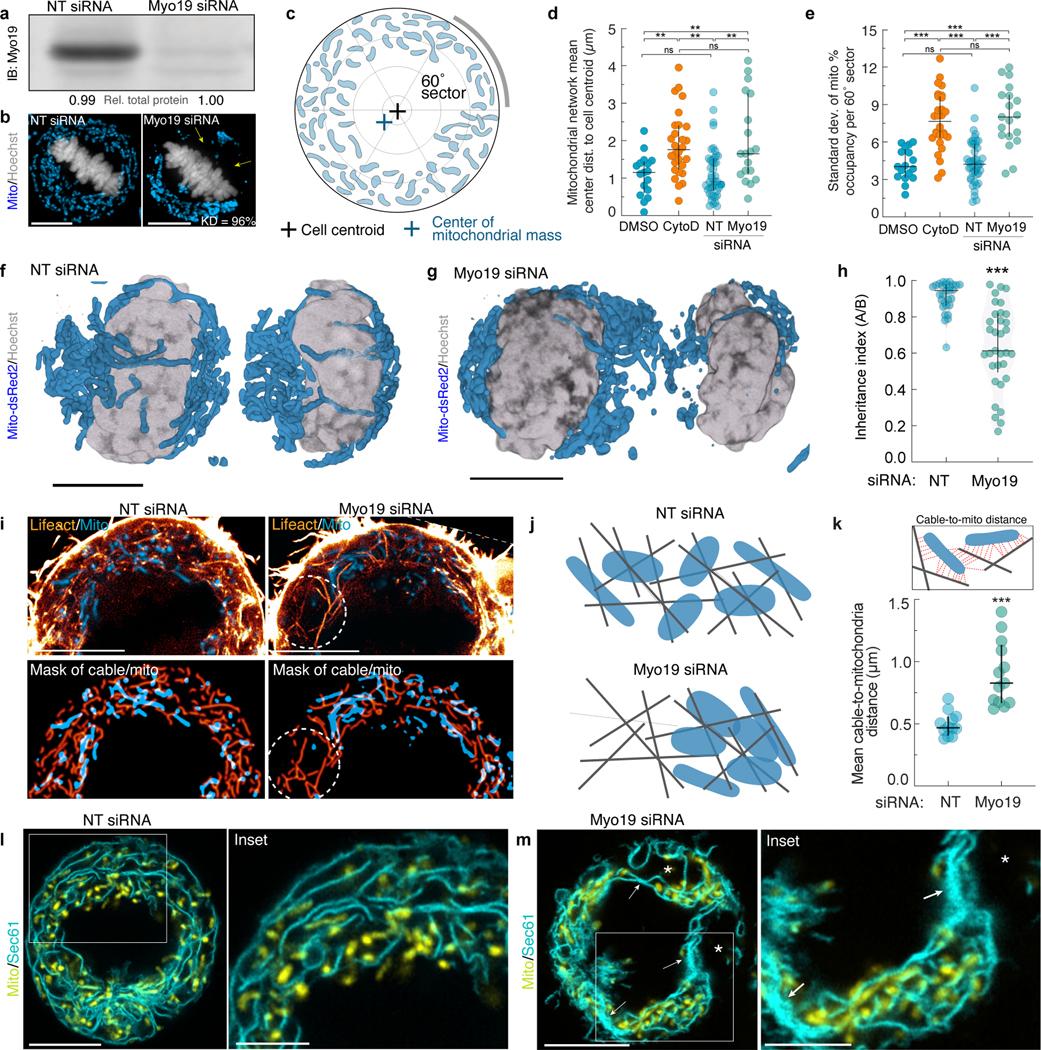
a. Immunoblot of Myo19 in HeLa cells treated with nontargeting (NT) siRNA or Myo19 siRNA (right). Relative total protein levels were used as a loading control. Knockdown efficiency = 96% based on 3 independent experiments. b. Spinning disk image of mitochondria (mito-dsRed2) and DNA (Hoechst) in fixed metaphase Hela cells treated with NT or Myo19 siRNA. Arrows indicate regions of metaphase cytoplasm devoid of mitochondria.. c. Schematic indicating parameters used for analyses in d and e, including XY center of mitochondrial mass, XY cell centroid, and 60° circle sectors. d. Center of mitochondrial mass displacement from cell centroid in metaphase HeLa cells treated with DMSO (1h), CytoD (100nM, 1h), NT siRNA (40 nM, 48h) or Myo19 siRNA (40nM, 48h). e. Standard deviation of mitochondrial mass per 60° circle sectors in metaphase HeLa cells treated with DMSO (1h), CytoD (100nM, 1h), NT siRNA (40nM, 48h), or Myo19 siRNA (40nM, 48h). f. 3D rendering of mitochondria (mito-dsRed2) and DNA (Hoechst) in cytokinetic HeLa cells treated with NT siRNA. g. 3D rendering of mitochondria (mito-dsRed2) and DNA (Hoechst) in cytokinetic HeLa cells treated with Myo19 siRNA. h. Inheritance index (A/B) of mitochondria in cytokinetic HeLa cells treated with either NT or Myo19 siRNA. Ratio is defined as mitochondrial mass in daughter cell A/daughter cell B, where A = the daughter cell with fewer mitochondria. i. Mitochondria (mito-dsRed2) and actin cables (Lifeact-EGFP) in metaphase HeLa cells treated with NT or Myo19 siRNA. Bottom row shows segmented images of mitochondria and actin cables. White circle indicates a region of the cable meshwork largely devoid of mitochondria. j. Cartoon schematic of mitochondria and actin cables in the cytoplasm of NT siRNA- or Myo19 siRNA- treated metaphase cells. k. Mean distance (μm) from actin cables to the nearest mitochondrial pixel. Median ± IQR. l-m. Airyscan images of mitochondria (Mito-dsRed2) and ER cisternae (Halo-Sec61) in metaphase HeLa cells treated with NT siRNA (l) or Myo19 siRNA (m) for 48h. Arrows indicate collapsed, compacted ER sheets. Asterisks indicate expanded, inter-sheet cytoplasmic voids. Scale bars: (b, f-g, i, l-m ) 10 μm, (l inset, m inset) 5 μm. Sample sizes: (d-e) 17 DMSO, 28 CytoD, 44 NT siRNA, and 19 Myo19 siRNA-treated cells, (h) 29 NT siRNA, 33 Myo19 siRNA-treated cells, (k) 12 NT siRNA, 13 Myo19 siRNA-treated cells. Samples were drawn from at least three independent experiments. Statistical tests: (d) Ordinary one-way ANOVA with Tukey’s multiple comparisons test, DMSO vs. CytoD **p=0.0087, CytoD vs. NT **p=0.0011, NT vs. Myo19 **p=0.0012, DMSO vs. Myo19 **p=0.006, DMSO vs. NT p=0.9962, CytoD vs. Myo19 p=0.975. (e) Ordinary one-way ANOVA with Tukey’s multiple comparisons test ****p<0.0001, DMSO vs. NT p=0.9733, CytoD vs. Myo19 p=0.913. (h) Two-tailed Mann-Whitney test ***p<0.0001. (k) Two-tailed unpaired t-test ***p<0.0001. Center values/error bars = (d,e,h,k) Median ± IQR.. Uncropped/unprocessed scan of the blots in panel a is included in the Source Data file.
Extended Data Figure 6. Mitochondrial actin waves rapidly cycle through mitotic mitochondrial networks.
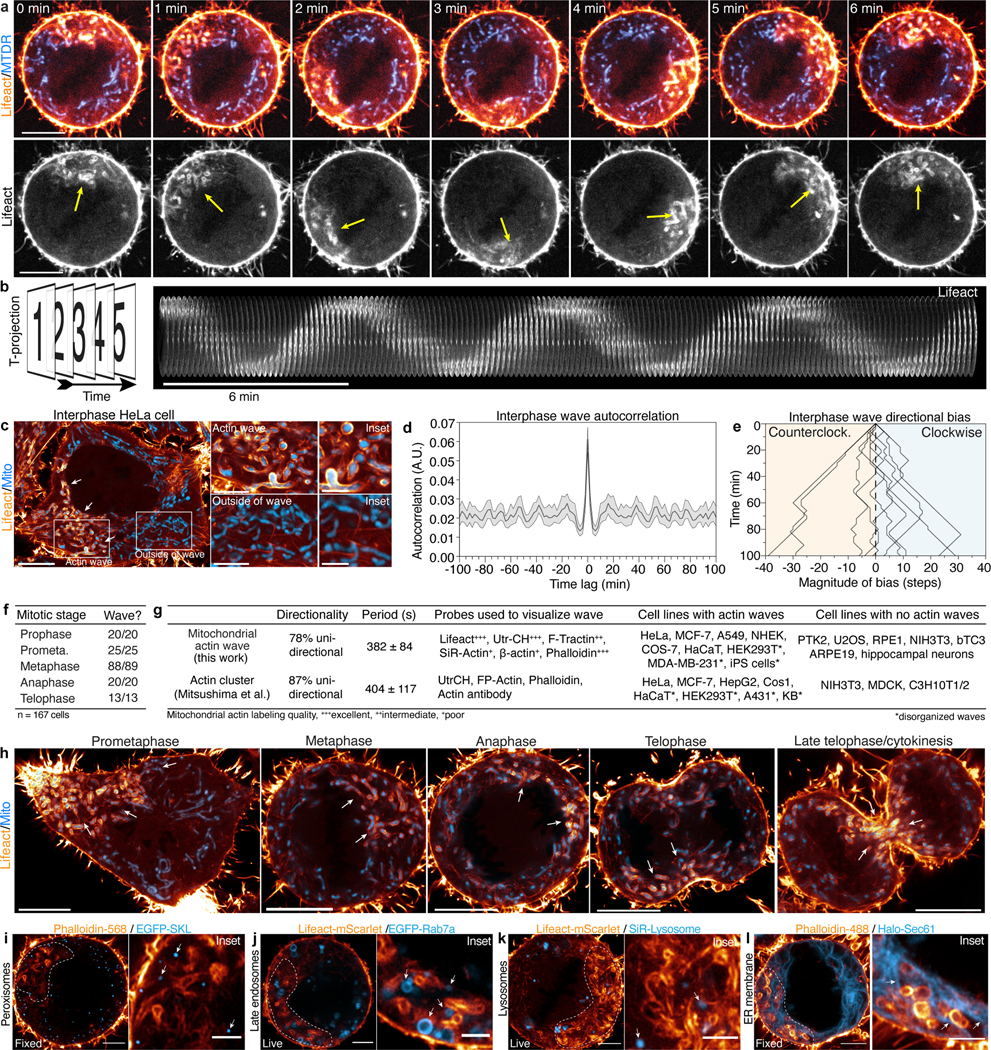
a. (top) Spinning disk confocal montage of mitochondria (MitoTrackerDeepRed, MTDR) and F-actin (Lifeact-mScarlet). (bottom) Monochrome montage of Lifeact signal with yellow arrow indicating position of the mitochondrial actin wave. Scale bar = 10 μm. b. 3D kymograph of metaphase actin wave upon subtraction of cortical actin signal. c. Interphase HeLa expressing Lifeact-EGFP and Mito-dsRed2. Insets indicate mitochondria inside or outside of the actin wave (arrows). d. Autocorrelation of interphase actin wave. Mean ± 95% CI. e. Directionality of actin waves. Negative values on the x axis indicate a net counterclockwise bias after 100 min, while positive values indicate a net clockwise bias. f. Fraction of HeLa cells in the indicated stages of mitosis with mitochondrial actin waves. g. Table comparing mitochondrial actin waves described here and previously described revolving actin clusters12. h. Representative images of F-actin (Lifeact-EGFP) and mitochondria (mito-dsRed2) in HeLa cells in different stages of mitosis. White arrows indicate position of the actin wave. i. Airyscan image of F-actin (Phalloidin) and peroxisomes (EGFP-SKL) in a fixed, metaphase HeLa cell. Dashed line indicates boundary of the actin wave. Arrows indicate peroxisomes outside of actin clouds. j. Airyscan images of F-actin (Lifeact) and late endosomes (EGFP-Rab7a) in a live, metaphase HeLa cell. Dashed line indicates boundary of the actin wave. Arrows indicate endosomes outside of actin clouds. k. Airyscan images of F-actin (Lifeact) and lysosomes (SiR-Lysosome) in a live, metaphase HeLa cell. Dashed line indicates boundary of the actin wave. Arrows indicate lysosomes outside of actin clouds. l. Airyscan images of F-actin (phalloidin) and ER (Halo-Sec61) in a fixed, metaphase HeLa cell. Dashed line indicates boundary of the actin wave. Arrows indicate ER outside of actin clouds. Scale bars: (a,c,h,i-l) 10 μm, (b center, I inset, j inset, k inset, l inset) 2.5 μm, (c right) 1 μm. Sample sizes: (d) 17 cells, (e) 10 cells, (f) 167 cells. Samples were drawn from at least three independent experiments.
Extended Data Figure 7. Mitochondria associate with actin cables, clouds, and comet tails in mitosis.
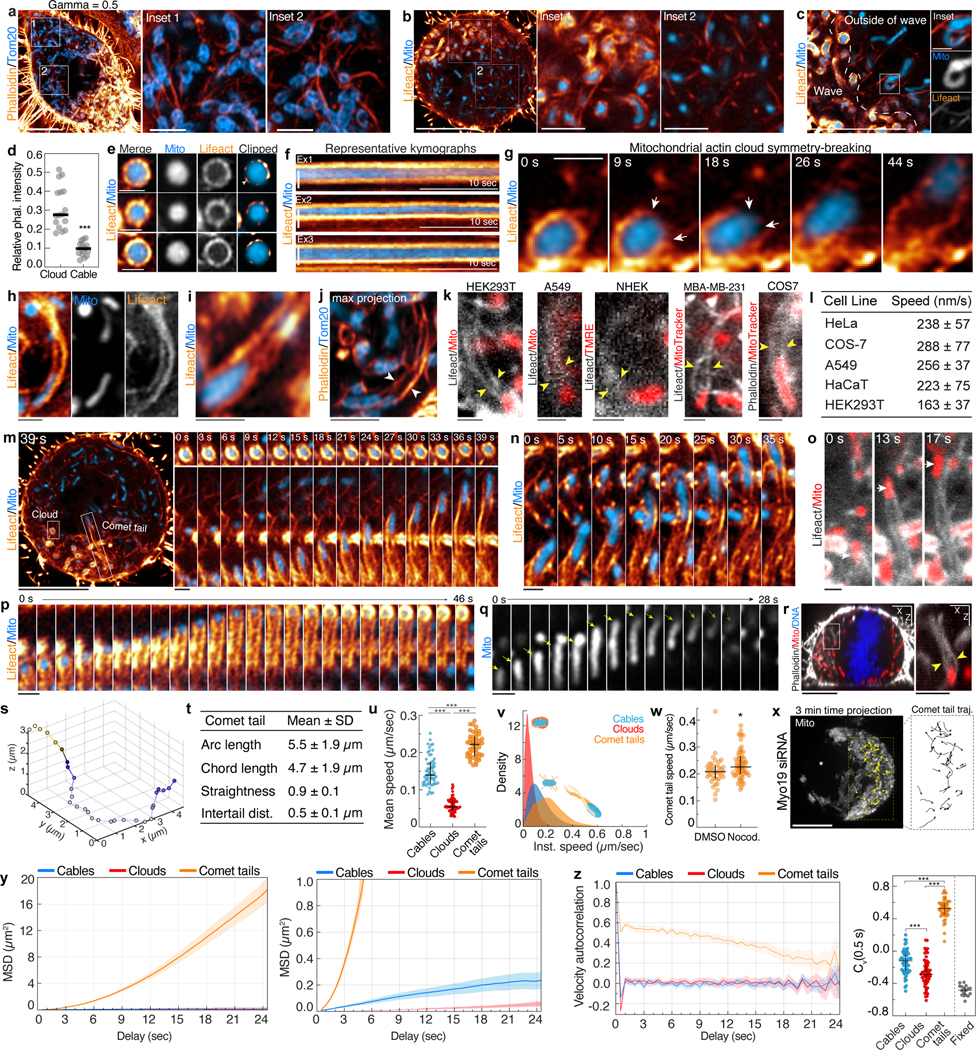
a. Gamma adjusted version of the image shown in Fig. 2h, revealing lower intensity actin cables outside of the wave. Insets show mitochondria outside of the wave associated with actin cables. b. Live metaphase HeLa cell expressing Lifeact-EGFP and mito-dsRed2 with insets indicating position of actin wave and cables. c. Airyscan image of mitochondrial actin clouds within a metaphase actin wave. White dashed line indicates wave border. Insets show mitochondria associated with cables (arrows) outside of the wave. d. Relative phalloidin intensity of actin clouds and actin cables. Values represent the ratio of clouds or cables to cortical actin signal. e. Representative Airyscan images of mitochondrial actin clouds with clipped images showing bright actin nodes on the surface of mitochondria. f. Representative kymographs indicating restricted mitochondrial motility inside of actin clouds. g. Airyscan montage of an actin cloud symmetry breaking event. Arrows indicates a gap forming between adjacent nodes in the cloud preceding mitochondrial ejection. h-i. Representative images of mitochondria associated with actin comet tails in live HeLa cells. j. Airyscan maximum intensity projection of a mitochondrial actin comet tail in a metaphase HeLa. k. Metaphase mitochondrial actin comet tails from the indicated cell types. Arrows indicate trailing comet tails. l. Speed of comet tail-based motility in the indicated cell types. m. Airyscan image of actin (Lifeact-EGFP) and mitochondria (mito-dsRed2) in a metaphase HeLa cell. Montage indicates motility of mitochondria associated with a cloud (top) or comet tail (bottom) over 39 s. n. Airyscan montage of mitochondrial comet tail extension. o. Spinning disk montage of F-actin (Lifeact-EGFP) and mitochondria (mito-dsRed2) upon comet tail assembly and extension. p. Montage of actin comet tail regaining symmetry, forming an actin cloud around the immotile mitochondrion. q. Montage of a mitochondrion (yellow arrow) undergoing comet tail motility resulting in movement out of the imaging plane. r. XZ projection of F-actin (phalloidin), mitochondria (mito-dsRed2), and DNA (Hoechst) in a fixed, metaphase HeLa cell. Inset indicates a mitochondrion associated with an actin comet tail that is oriented primarily in the axial plane. s. 3D trajectory of a comet tail propelled mitochondria from a 3D Airyscan-fast movie. Trajectory is colored by time. t. Actin comet tail parameters estimated from 3D volumes of fixed, phalloidin stained cells. u. Mean speed of mitochondria associated with the indicated actin structures over 25 sec. v. Density estimation of instantaneous speeds of cable, cloud, and comet tail associated mitochondria. w. Speed of comet tails in metaphase HeLa treated with DMSO or 25 μM Nocodazole. x. Three-minute time projection of mitochondria (mito-dsRed2) in a Myo19 siRNA-treated metaphase HeLa cell. Comet tail trajectories are shown in yellow and in the expanded inset. Asterisk indicates regions of cytoplasm unexplored by mitochondria over 3 min. y. Mean squared displacement of cable, cloud, and comet associated mitochondria. MSD plot with cropped Y axis is shown on the right to visualize the reduced cable and cloud motility. z. Velocity autocorrelations of the three types of motility. Cv(0.5 s) values are plotted for mitochondria associated with cables, clouds, comet tails, as well as mitochondria in fixed cells to estimate tracking error. Scale bars: (a,b,c,m,r,x) 10 μm, (a insets, b insets, r inset) 2.5 μm, (c inset, e, f-k, m right, n-q) 1 μm. Sample Size: (d) 16 cells, (l) 233 HeLa, 40 Cos7, 35 A549, 30 HaCaT, 74 HEK293T, (u-v) 59 cables, 59 clouds, 47 comets, (w) 38 DMSO, 61 Nocodazole-treated cells. (y-z) 57 cables, 47 comets, 59 clouds. Samples were drawn from at least three independent experiments. Statistics: (d) two-tailed unpaired t-test ***p<0.0001, (u) Kruskal-Wallis test with Dunn’s multiple comparisons test ***p<0.0001, (w) two-tailed Mann-Whitney test *p=0.011, (z) ordinary one-way ANOVA with Tukey’s multiple comparisons test ***p<0.0001. Center values/error bars: (d) median, (l, t) mean ± SD, (u, w, z right) median ± IQR, (y, z left) mean ± 95% CI.
Extended Data Figure 8. Mitochondrial actin waves are maintained by multiple actin assembly and disassembly factors.
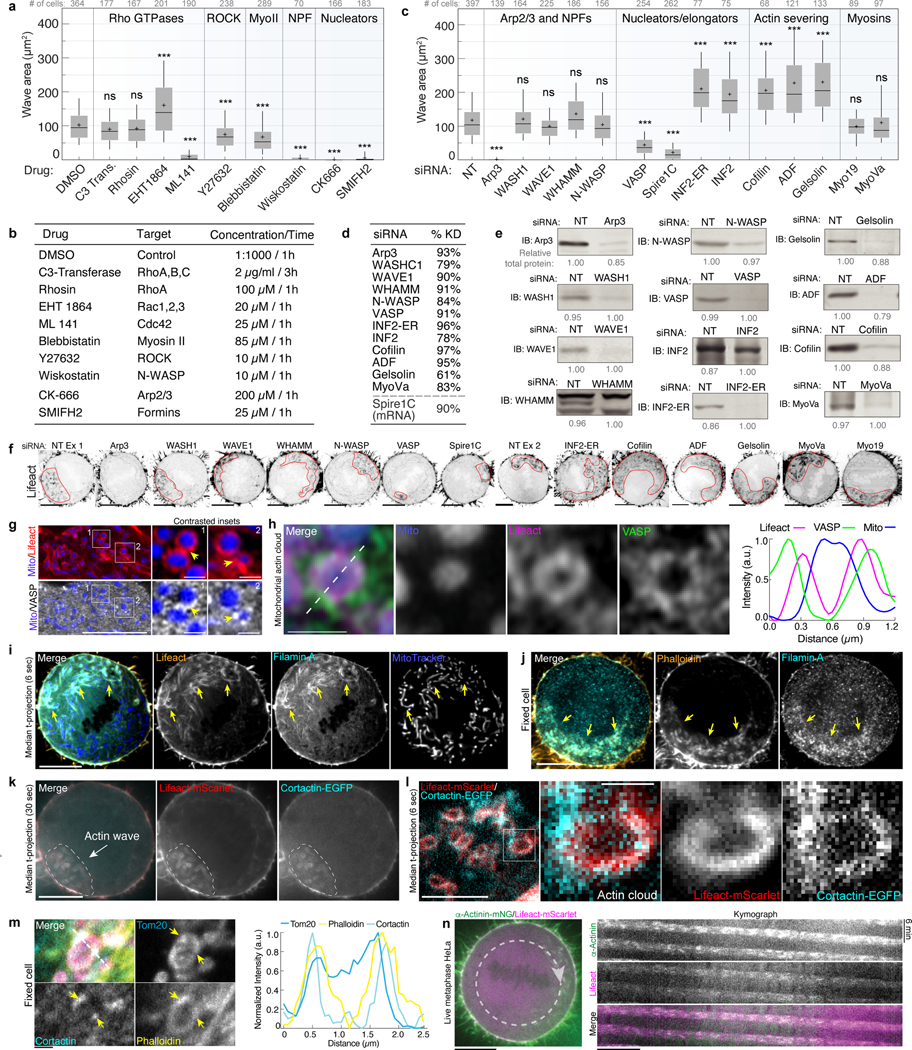
a. Mitochondrial actin wave area in cells treated with indicated inhibitors. b. Table indicating the drugs used a, as well as their major targets and concentrations/incubation times used. c. Mitochondrial actin wave area in cells treated with indicated siRNA for 48h. d. Knockdown efficiency of siRNAs used in c. Values indicate averages of at least 3 independents experiments. e. Representative western blots indicating knockdown efficiency of siRNAs in c. Full blots are shown in Supplementary Figure 1. Relative total protein levels are indicated below each blot. f. Representative single plane images of actin waves (Lifeact-EGFP) in metaphase HeLa cells treated with the indicated siRNAs. Dashed red line indicates wave boundaries. g. Airyscan single plane image of a HeLa cell expressing EGFP-VASP (white), Lifeact-mScarlet, (red), and Mito-TagBFP2 (blue). Yellow arrows indicate position of VASP puncta on the actin cloud. h. Airyscan image of VASP association with a mitochondrion (Mito-TagBFP2) within an actin cloud (Lifeact- mScarlet). (right) Normalized fluorescence intensity of Mito, VASP, and Lifeact along the 1px linescan indicated by the dashed line. i. Metaphase Hela cells expressing Lifeact-mScarlet, Filamin A-EGFP, and MitoTracker DeepRed. j. Fixed, anaphase HeLa cell stained for Filamin A (cyan) and F-actin (phalloidin, orange). k. Spinning disk confocal median time projection (over 30 seconds) indicating Cortactin-EGFP colocalization with Lifeact-mScarlet in a metaphase actin wave. l. Median intensity time projection of Lifeact-mScarlet/Cortactin-EGFP colocalization in an actin cloud in a metaphase HeLa cell. m. Spinning disk confocal images of fixed HeLa cells stained for mitochondria (anti-Tom20), cortactin (anti-cortactin), and F-actin (Phalloidin). White arrows indicate asymmetric, punctate localization of cortactin around actin positive mitochondria. (right) Normalized fluorescence intensity of f-actin (phalloidin), Tom20, and Cortactin along the 1px wide line scan. n. Colocalization of Alpha Actinin (Alpha Actinin-mNeonGreen) and F-actin (LifeAct-mScarlet) in a metaphase HeLa cell. (right) Kymograph of LifeAct and alpha-actinin generated from indicated line scan (dashed line). Scale bars: (f, i, j-k, n) 10 μm, (g, l) 5 μm, (g inset, e, l inset, m) 1 μm. Sample sizes: (a, c) Number of cells per condition is indicated above each boxplot. Samples are drawn from at least 3 independent experiments. Statistical tests: (a) Kruskal-Wallis test with Dunn’s multiple comparisons test ***p<0.0001, DMSO vs. C3 Transferase p=0.7515, DMSO vs. Rhosin p<0.9999, (b) Kruskal-Wallis test with Dunn’s multiple comparisons test ***p<0.0001, NT vs. WASH1 p>0.9999, NT vs. WAVE1 p=0.6079, NT vs. WHAMM p=0.0766, NT vs. N-WASP p>0.9999, NT vs. Myo19 p>0.9999, NT vs. MyoVa p>0.9999. Center values/error bars: Box = Median ± IQR, whiskers indicate 10–90% values, plus-sign indicates mean. Uncropped/unprocessed scans of the blots are included in the Source Data file.
Extended Data Figure 9. Arp3 depletion eliminates actin comet tail-based mitochondrial motility but does not impair mitochondrial positioning or equal inheritance.

a. Frequency of mitochondrial comet tail-based motility over 1 min in metaphase Hela cells treated with NT or Arp3 siRNA. Median ± IQR. n = 11 NT siRNA-treated cells, 11 Arp3 siRNA treated cells from at least three independent experiments. b. (Left) 3 frame median intensity time projection of actin cables (Lifeact-EGFP) and mitochondria (mito- dsRed2) in an Arp3 depleted metaphase HeLa cell. (Right) Time-coded maximum intensity projection of segmented actin cables over 178 seconds. c. Airyscan image of mitochondria (mito-dsRed2) associated with actin cables (Lifeact-EGFP) in an Arp3 siRNA treated metaphase HeLa cell. Kymographs shows mitochondria/cable motility over ~ 2 min. d. Single plane airyscan image of mitochondria (mito-dsRed2) in an NT siRNA-treated (left) or Arp3 siRNA- treated (right) metaphase HeLa. e. Center of mitochondrial mass displacement from cell centroid in cells treated with NT or Arp3 siRNA. Note: the NT data is reproduced from Extended data figure 5e. n = 44 NT, 38 Arp3 from at least three independent experiments. f. Standard deviation of mitochondrial percent occupancy per 60° sector in cells treated with NT or Arp3 siRNA. N. g. Origin aligned trajectories for 150 mitochondria over 60 seconds. Control trajectories were taken from outside of the actin wave in untreated cells. Arp3 siRNA trajectories are taken from random positions in the cell. h. Single plane cumulative maximum intensity projections of mitochondria (mito-dsRed2) in NT or Arp3 siRNA treated metaphase HeLa cells.. i. Percentage of cell area covered by mitochondria per min in NT or Arp3 siRNA treated metaphase HeLa cells. j. Displacement index of mitochondria in NT or Arp3 siRNA treated HeLa cells. Displacement index is calculated by dividing mito-dsRed2 area in 5 min maximum intensity time projections by the area of mito- dsRed2 in the first frame. k. Mitochondria (mito-dsRed2) and ER (Halo-Sec61) in an Arp3 siRNA treated HeLa cell. l. Equal mitochondrial inheritance in an Arp3 siRNA treated HeLa cell undergoing cytokinesis. Dashed line indicates division plane. m. Inheritance ratio (A/B) of metaphase HeLa cells treated with NT or Arp3 siRNA. Note: NT siRNA data is reproduced from Extended data figure 5. Ratio is defined as mitochondrial mass in daughter cell A/daughter cell B, where A = the daughter cell with fewer mitochondria. n. Change in distance between pairs of neighboring mitochondria after 5 min in a NT or Arp3 siRNA-treated metaphase HeLa cell. Scale bars: (h, k, l) 10 μm, (d) 5 μm, (c, k inset) 2.5 μm, (b) 1 μm, (g) 500nm. Sample sizes: (e) The NT data is reproduced from Extended Data Fig 5e. 44 NT, 38 Arp3 siRNA-treated cells from at least three independent experiments. (f) The NT data is reproduced from figure S5E. 44 NT, 38 Arp3 siRNA-treated cells from at least three independent experiments (i-j) 38 NT, 33 Arp3 siRNA-treated cells (m) 29 NT siRNA, 14 Arp3 siRNA treated cells. (n) Change in neighbor distance was calculated on one NT siRNA and one Arp3 siRNA treated cell. Statistical tests: (i-j) two-tailed unpaired t-test, ***p<0.0001. Center values/error bars: (a,e,f,I,j,m) median ± interquartile range.
Extended Data Figure 10. Actin waves shuffle mitochondrial position before cytokinesis.
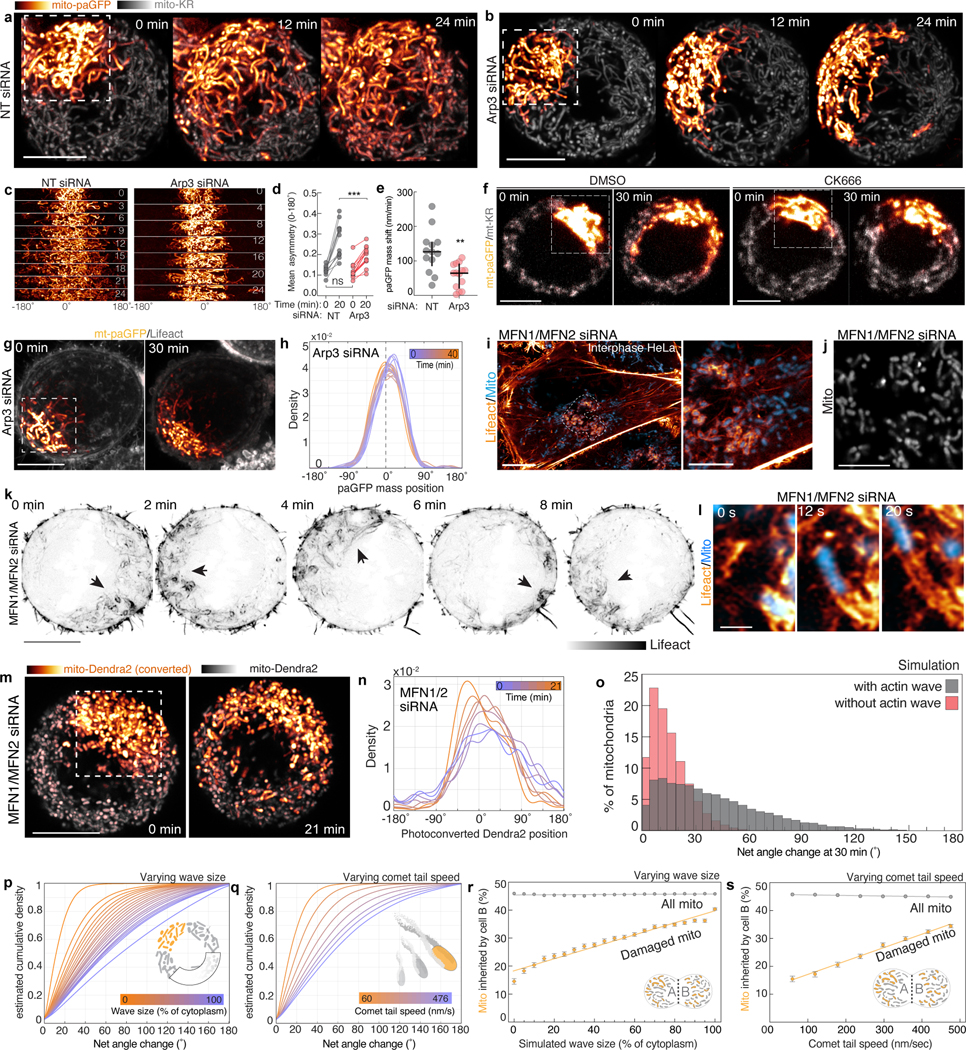
a-b. Airyscan maximum intensity projections of (a) NT siRNA- or (b) Arp3 siRNA-treated metaphase HeLa cell expressing mito-paGFP and mito-KR. White box indicates region irradiated with 405nm and 561nm light to simultaneously bleach Mito-KR and activate Mito-paGFP. c. Computationally straightened montage of mito-paGFP dispersion in NT or Arp3 siRNA-treated cells d. Mean rotational asymmetry of damaged mitochondria in NT or Arp3 siRNA-treated cells at 0 and 20 min after photoactivation. e. Displacement of damaged, mito-paGFP-labeled mitochondria center of mass per min in NT or Arp3 siRNA treated cells. f. Spinning disk maximum intensity projection of mito-paGFP and mito-KR in metaphase HeLa cells treated with DMSO (left) or CK-666 (right). White boxes indicate regions irradiated with 405nm and 561nm light to simultaneously bleach Mito-KR and activate Mito-paGFP. g. Airyscan maximum intensity projection of an Arp3 siRNA treated metaphase HeLa cell expressing Mito-paGFP and Lifeact-mScarlet. White box indicates region irradiated with 405nm light to activate Mito-paGFP. h. Circular kernel density estimate of Mito-paGFP position over 40 minutes. Dashed line indicates midpoint of the photoactivation region at time 0. i. Airyscan image of MFN1/MFN2 siRNA treated interphase HeLa cell expressing Lifeact-EGFP (orange) and mito-dsRed2 (blue). Dashed line indicates position of the actin wave. Inset shows actin positive mitochondria within the wave. j. Airyscan image of fragmented, morphologically simple mitochondria in interphase HeLa cells treated with MFN1/MFN2 siRNA. k. Metaphase actin wave (black arrow) persist upon simultaneous depletion of the mitochondrial fusion factors MFN1/MFN2. l. Representative example of actin comet tail based mitochondrial movements in a metaphase MFN1/MFN2 siRNA treated HeLa. m. Airyscan maximum intensity projections of a MFN1/MFN2 siRNA treated metaphase HeLa cell expressing Mito-Dendra2. White box indicates region irradiated with 405nm light to photoconvert the Dendra2. Over 21 min the photoactivated mitochondria are dispersed through the cell. n. Circular kernel density estimates of Mito-Dendra2 distribution over 21 minutes, indicating increased dispersion of the photoconverted mitochondria over time. o. Histogram indicating simulated damaged mitochondrial dispersion over 30 minutes. Gray boxes indicate net mitochondrial angle change in simulations with actin waves, red boxes indicate net angle change in simulations without waves. p. Estimated cumulative density of damaged mitochondria angle change over 30 minutes in simulations with different sized actin waves. q. Estimated cumulative density of damaged mitochondria angle change over 30 minutes in simulations with different speed actin comet tails. r-s. Percentage of damaged (orange) and total (gray) mitochondria inherited by daughter cell B over 30 minutes in simulations with variable wave sizes or actin comet tail speed. Mean ± 95% CI. Scale bars: (a,b,f,g,i,m) 10 μm, (i inset, j) 5 μm, (l) 1 μm. Sample sizes: (d-e) 13 NT siRNA, 14 Arp3 siRNA treated cells. Samples are drawn from at least 3 independent experiments. Statistical tests: (d) Two-way RM ANOVA with Sidak’s multiple comparisons test. NT vs. Arp3 at 0 min, p=0.9927, NT vs. Arp3 at 20 min, ***p=0.0006. (e) Two-tailed unpaired t-test, **p=0.0013. Central values/error bars: (e) median ± interquartile range.
Supplementary Material
Acknowledgements:
The authors gratefully acknowledge the technical contributions of Mariko Tokito, Andrea Stout and the UPenn CDB microscopy core, Florin Tuluc and the CHOP Flow Cytometry core, Stephanie Weber for MATLAB code, Omar Quintero and David Matus for cell lines, and Heejun Choi and Blair Rossetti for advice on analyses. We thank Michael Ostap, Fred Cross, Chantell Evans, Sydney Cason, Yvette Wong, and Olivia Harding for critical feedback. This work was funded by support from NIH R35 GM126950 and RM1 GM136511 to E.L.F.H., NIH F31 GM123644 and CHOP MitoRAG Pilot Grant to A.S.M., NIH R37 AI036929 and HHMI investigator support to J.A.T, and HHMI Gilliam Fellowship to F.E.O. C.L.S. was supported by grants from NIAMS/NIH (K08 AR075846), the Dermatology Foundation, and the National Psoriasis Foundation. NHEKs were supplied by Penn SBDRC Core B supported by NIAMS/NIH (P30 AR069589). J.J.N was supported by F30NS092227 and the UPenn NGG Hearst Fellowship. The Advanced Imaging Center at the Janelia Research Campus is a jointly-funded venture of the Gordon and Betty Moore Foundation and the Howard Hughes Medical Institute.
Footnotes
Competing interests: Authors declare no competing interests.
Data availability: Source data for Figs. 1–3 and Extended Data Fig. 1–10, including data points, statistical test summaries, and P values are included in the Source Data file.
Code availability: MATLAB code used for analyzing 3D mitochondrial distribution, 2D nucleoid distribution, ER void size/distribution, mitochondrial motility, and damaged mitochondria circular spread is available at https://github.com/andmoo91/CircularAnalyses_MatLab
References
- 1.Carlton JG, Jones H & Eggert US Membrane and organelle dynamics during cell division. Nat Rev Mol Cell Bio 21, 151–166 (2020). [DOI] [PubMed] [Google Scholar]
- 2.Taguchi N, Ishihara N, Jofuku A, Oka T & Mihara K. Mitotic Phosphorylation of Dynamin-related GTPase Drp1 Participates in Mitochondrial Fission. Journal of Biological Chemistry 282, 11521–11529 (2007). [DOI] [PubMed] [Google Scholar]
- 3.Kashatus DF et al. RALA and RALBP1 regulate mitochondrial fission at mitosis. Nature Cell Biology 13, 1108 (2011). [DOI] [PMC free article] [PubMed] [Google Scholar]
- 4.Chung J, Steen J & Schwarz T. Phosphorylation-Induced Motor Shedding Is Required at Mitosis for Proper Distribution and Passive Inheritance of Mitochondria. Cell Reports 16, 2142–2155 (2016). [DOI] [PMC free article] [PubMed] [Google Scholar]
- 5.Altmann K, Frank M, Neumann D, Jakobs S & Westermann B. The class V myosin motor protein, Myo2, plays a major role in mitochondrial motility in Saccharomyces cerevisiae. The Journal of cell biology 181, 119–30 (2008). [DOI] [PMC free article] [PubMed] [Google Scholar]
- 6.Simon V, Swayne T & Pon L. Actin-dependent mitochondrial motility in mitotic yeast and cell-free systems: identification of a motor activity on the mitochondrial surface. J Cell Biology 130, 345–354 (1995). [DOI] [PMC free article] [PubMed] [Google Scholar]
- 7.Rohn JL et al. Myo19 Ensures Symmetric Partitioning of Mitochondria and Coupling of Mitochondrial Segregation to Cell Division. Current Biology 24, 2598–2605 (2014). [DOI] [PMC free article] [PubMed] [Google Scholar]
- 8.Field CM & Lénárt P. Bulk Cytoplasmic Actin and Its Functions in Meiosis and Mitosis. Current Biology 21, R825–R830 (2011). [DOI] [PubMed] [Google Scholar]
- 9.Kita AM et al. Spindle-F-actin interactions in mitotic spindles in an intact vertebrate epithelium. Molecular biology of the cell 30, 1645–1654 (2019). [DOI] [PMC free article] [PubMed] [Google Scholar]
- 10.Salvador-Gallego R, Hoyer MJ & Voeltz GK SnapShot: Functions of Endoplasmic Reticulum Membrane Contact Sites. Cell 171, 1224–1224.e1 (2017). [DOI] [PubMed] [Google Scholar]
- 11.Lu L, Ladinsky MS & Kirchhausen T. Cisternal organization of the endoplasmic reticulum during mitosis. Molecular biology of the cell 20, 3471–80 (2009). [DOI] [PMC free article] [PubMed] [Google Scholar]
- 12.Mitsushima M et al. Revolving movement of a dynamic cluster of actin filaments during mitosis. The Journal of cell biology 191, 453–62 (2010). [DOI] [PMC free article] [PubMed] [Google Scholar]
- 13.Moore AS, Wong YC, Simpson CL & Holzbaur EL Dynamic actin cycling through mitochondrial subpopulations locally regulates the fission-fusion balance within mitochondrial networks. Nature communications 7, 12886 (2016). [DOI] [PMC free article] [PubMed] [Google Scholar]
- 14.Taunton J et al. Actin-dependent propulsion of endosomes and lysosomes by recruitment of N-WASP. The Journal of cell biology 148, 519–30 (2000). [DOI] [PMC free article] [PubMed] [Google Scholar]
- 15.Kast DJ, Zajac AL, Holzbaur EL, Ostap EM & Dominguez R. WHAMM Directs the Arp2/3 Complex to the ER for Autophagosome Biogenesis through an Actin Comet Tail Mechanism. Current biology : CB 25, 1791–7 (2015). [DOI] [PMC free article] [PubMed] [Google Scholar]
- 16.Tilney L & Portnoy D. Actin filaments and the growth, movement, and spread of the intracellular bacterial parasite, Listeria monocytogenes. The Journal of Cell Biology 109, 1597–1608 (1989). [DOI] [PMC free article] [PubMed] [Google Scholar]
- 17.Heinzen R, Hayes S, Peacock M & Hackstadt T. Directional actin polymerization associated with spotted fever group Rickettsia infection of Vero cells. Infect Immun 61, 1926–35 (1993). [DOI] [PMC free article] [PubMed] [Google Scholar]
- 18.Bernardini M, Mounier J, d’Hauteville H, Coquis-Rondon M & Sansonetti P. Identification of icsA, a plasmid locus of Shigella flexneri that governs bacterial intra- and intercellular spread through interaction with F-actin. Proc National Acad Sci 86, 3867–3871 (1989). [DOI] [PMC free article] [PubMed] [Google Scholar]
- 19.Haglund CM, Choe JE, Skau CT, Kovar DR & Welch MD Rickettsia Sca2 is a bacterial formin-like mediator of actin-based motility. Nature cell biology 12, 1057–63 (2010). [DOI] [PMC free article] [PubMed] [Google Scholar]
- 20.Theriot J, Mitchison T, Tilney L & Portnoy D. The rate of actin-based motility of intracellular Listeria monocytogenes equals the rate of actin polymerization. Nature 357, 257–60 (1992). [DOI] [PubMed] [Google Scholar]
- 21.Nishimura Y et al. The Formin Inhibitor, SMIFH2, Inhibits Members of the Myosin Superfamily. Biorxiv 2020.08.30.274613 (2020) doi: 10.1101/2020.08.30.274613. [DOI] [PMC free article] [PubMed] [Google Scholar]
- 22.Manor U, Bartholomew S, Golani G & Christenson E A mitochondria-anchored isoform of the actin-nucleating spire protein regulates mitochondrial division. (2015). [DOI] [PMC free article] [PubMed] [Google Scholar]
- 23.Korobova F, Ramabhadran V & Higgs HN An Actin-Dependent Step in Mitochondrial Fission Mediated by the ER-Associated Formin INF2. Science 339, 464–467 (2013). [DOI] [PMC free article] [PubMed] [Google Scholar]
- 24.Chhabra E & Higgs HN INF2 Is a WASP Homology 2 Motif-containing Formin That Severs Actin Filaments and Accelerates Both Polymerization and Depolymerization. J Biol Chem 281, 26754–26767 (2006). [DOI] [PubMed] [Google Scholar]
- 25.Vincent AE et al. Sub-cellular origin of mtDNA deletions in human skeletal muscle. Ann Neurol 84, 289–301 (2018). [DOI] [PMC free article] [PubMed] [Google Scholar]
- 26.Katajisto P et al. Asymmetric apportioning of aged mitochondria between daughter cells is required for stemness. Science 348, 340–343 (2015). [DOI] [PMC free article] [PubMed] [Google Scholar]
- 27.Aryaman J, Hoitzing H, Burgstaller JP, Johnston IG & Jones NS Mitochondrial heterogeneity, metabolic scaling and cell death. Bioessays 39, 1700001 (2017). [DOI] [PubMed] [Google Scholar]
- 28.McFaline-Figueroa J et al. Mitochondrial quality control during inheritance is associated with lifespan and mother-daughter age asymmetry in budding yeast. Aging Cell 10, 885–95 (2011). [DOI] [PMC free article] [PubMed] [Google Scholar]
- 29.Rué P & Arias A. Cell dynamics and gene expression control in tissue homeostasis and development. Mol Syst Biol 11, 792 (2015). [DOI] [PMC free article] [PubMed] [Google Scholar]
Additional references:
- 30.Stewart JB & Chinnery PF Extreme heterogeneity of human mitochondrial DNA from organelles to populations. Nat Rev Genet 1–13 (2020) doi: 10.1038/s41576-020-00284-x. [DOI] [PubMed] [Google Scholar]
- 31.Fernandopulle MS et al. Transcription Factor-Mediated Differentiation of Human iPSCs into Neurons. Curr Protoc Cell Biology 79, e51 (2018). [DOI] [PMC free article] [PubMed] [Google Scholar]
- 32.Simpson CL, Kojima S & Getsios S. RNA interference in keratinocytes and an organotypic model of human epidermis. Methods in molecular biology (Clifton, N.J.) 585, 127–46 (2010). [DOI] [PubMed] [Google Scholar]
- 33.Xu K, Zhong G & Zhuang X. Actin, spectrin, and associated proteins form a periodic cytoskeletal structure in axons. Sci New York N Y 339, 452–6 (2012). [DOI] [PMC free article] [PubMed] [Google Scholar]
- 34.Chozinski TJ et al. Expansion microscopy with conventional antibodies and fluorescent proteins. Nature Methods 13, 485–488 (2016). [DOI] [PMC free article] [PubMed] [Google Scholar]
- 35.Guo Y et al. Visualizing Intracellular Organelle and Cytoskeletal Interactions at Nanoscale Resolution on Millisecond Timescales. Cell 175, 1430–1442.e17 (2018). [DOI] [PubMed] [Google Scholar]
- 36.Preibisch S, Saalfeld S, Schindelin J & Tomancak P. Software for bead-based registration of selective plane illumination microscopy data. Nat Methods 7, 418–419 (2010). [DOI] [PubMed] [Google Scholar]
- 37.Chen B-C et al. Lattice light-sheet microscopy: imaging molecules to embryos at high spatiotemporal resolution. Sci New York N Y 346, 1257998 (2014). [DOI] [PMC free article] [PubMed] [Google Scholar]
- 38.Schindelin J et al. Fiji: an open-source platform for biological-image analysis. Nature methods 9, 676–82 (2012). [DOI] [PMC free article] [PubMed] [Google Scholar]
- 39.Steger C. An unbiased detector of curvilinear structures. Ieee T Pattern Anal 20, 113–125 (1998). [Google Scholar]
- 40.Püspöki Z, Storath M, Sage D & Unser M. Focus on Bio-Image Informatics. Adv Anat Embryology Cell Biology 219, 69–93 (2016). [DOI] [PubMed] [Google Scholar]
- 41.Berens P. CircStat : A MATLAB Toolbox for Circular Statistics. J Stat Softw 31, (2009). [Google Scholar]
- 42.Upton G & Mardia K. Statistics of Directional Data. J Royal Statistical Soc Ser Gen 136, 262–263 (1973). [Google Scholar]
- 43.Berg S et al. ilastik: interactive machine learning for (bio)image analysis. Nat Methods 16, 1226–1232 (2019). [DOI] [PubMed] [Google Scholar]
- 44.Wait E, Winter M & Cohen AR Hydra Image Processor: 5-D GPU Image Analysis Library with MATLAB and Python Wrappers. Bioinformatics (2019) doi: 10.1093/bioinformatics/btz523. [DOI] [PMC free article] [PubMed] [Google Scholar]
- 45.Tinevez J-Y et al. TrackMate: An open and extensible platform for single-particle tracking. Methods San Diego Calif 115, 80–90 (2016). [DOI] [PubMed] [Google Scholar]
- 46.Tarantino N et al. TNF and IL-1 exhibit distinct ubiquitin requirements for inducing NEMO-IKK supramolecular structures. J Cell Biology 204, 231–45 (2014). [DOI] [PMC free article] [PubMed] [Google Scholar]
- 47.Monnier N et al. Bayesian Approach to MSD-Based Analysis of Particle Motion in Live Cells. Biophys J 103, 616–626 (2012). [DOI] [PMC free article] [PubMed] [Google Scholar]
- 48.Weber SC, Thompson MA, Moerner WE, Spakowitz AJ & Theriot JA Analytical Tools To Distinguish the Effects of Localization Error, Confinement, and Medium Elasticity on the Velocity Autocorrelation Function. Biophys J 102, 2443–2450 (2012). [DOI] [PMC free article] [PubMed] [Google Scholar]
- 49.Quintero OA et al. Human Myo19 is a novel myosin that associates with mitochondria. Current biology : CB 19, 2008–13 (2009). [DOI] [PMC free article] [PubMed] [Google Scholar]
- 50.Ortega FE, Koslover EF & Theriot JA Listeria monocytogenes cell-to-cell spread in epithelia is heterogeneous and dominated by rare pioneer bacteria. Elife 8, e40032 (2019). [DOI] [PMC free article] [PubMed] [Google Scholar]
Associated Data
This section collects any data citations, data availability statements, or supplementary materials included in this article.