

Abstract
Paraoxonase 1 (PON1) is known for preventing atherosclerosis through lipid-modifying features, antioxidant activity, anti-inflammatory, anti-apoptosis, anti-thrombosis, and anti-adhesion properties. Uremic patients requiring haemodialysis (HD) are especially prone to atherosclerosis and its complications. We analysed the PON1 gene (PON1) polymorphisms and serum PON1 (paraoxonase) activity concerning dyslipidaemia and related cardiovascular diseases and mortality to show how they associate under uremic conditions modified by maintenance HD treatment. The rs662 AA + AG (OR 1.76, 95%CI 1.10–2.80, P = 0.018), rs854560 TT (OR 1.48, 95%CI 1.04–2.11, P = 0.031), and rs854560 AT + TT (OR 1.28, 95%CI 1.01–1.63, P = 0.040) contributed to the prevalence of atherogenic dyslipidaemia diagnosed by the triglyceride (TG)/HDL-cholesterol ratio ≥ 3.8. The normalized serum PON1 activity positively correlated with atherogenic dyslipidaemia (ẞ 0.67 ± 0.25, P = 0.008). The PON1 rs854560 allele T was involved in the higher prevalence of ischemic cerebral stroke (OR 1.38, 1.02–1.85, P = 0.034). The PON1 rs705379 TT genotype contributed to cardiovascular (HR 1.27, 95% CI 1.03–1.57, P = 0.025) and cardiac (HR 1.34, 95% CI 1.05–1.71, P = 0.018) mortality. All P-values were obtained in multiple regression analyses, including clinical variables. Multifaceted associations of PON1 with dyslipidaemia, ischemic cerebral stroke, and cardiovascular mortality in HD patients provide arguments for the consideration of PON1 and its protein product as therapeutic targets in the prevention of atherosclerosis and its complications in uremic patients.
Subject terms: Genetics, Biomarkers, Cardiology, Diseases, Medical research, Nephrology
Introduction
Paraoxonase 1 (PON1) is calcium-dependent aryldialkylphosphatase, a 354–355 amino acid glycoprotein, 43–45 kDa1. PON1 prevents atherosclerosis through its antioxidant activity, anti-inflammatory action, anti-apoptosis, anti-thrombosis, anti-adhesion, and lipid-modifying properties2–4. PON1 stimulates cholesterol efflux, metabolizes oxidized phospholipids in high-density lipoprotein (HDL) and low-density lipoprotein (LDL), prevents lipid-peroxide accumulation on HDL and LDL, and preserves the anti-oxidative HDL function3,4. Decreased PON1 activity contributes to elevated plasma levels of homocysteine and homocysteine-thiolactone. The latter can damage proteins by homocysteinylation and involve vascular damage pathology5,6.
Uremic patients requiring haemodialysis (HD) are especially prone to atherosclerosis and its complications. Generally, serum PON1 activity7–10 and serum PON1 concentrations11–13 are decreased in predialysis and dialysis (both HD and peritoneal dialysis) subjects compared to healthy controls. Standardized PON1 activity (the PON1/HDL-cholesterol ratio) may be similar in HD patients and healthy subjects13. HD individuals with PON1 concentration below-median showed shorter survival than patients with PON1 concentration equal to or exceeding a median14. Therefore, decreased PON1 activity plays an essential role in dyslipidaemia and worse dialysis patients' outcomes. Kidney transplantation can restore PON1 activity, at least partially8,9,15, which indicates that factors influencing serum PON1 activity are abolished or ameliorated by recovered renal function.
The human PON1 gene (PON1) lies on chromosome 7q21.31. PON1 promoter region displays several transcription start sites and regulatory elements16. The PON1 protein's structural portion is encoded by nine exons that form the primary transcript using typical splice donor and acceptor sites17. The PON1 single nucleotide variant (SNV) designated as rs622 (c.575A>G) is a missense transition resulting in the replacement of glutamine by arginine at amino acid position 192 (p.Gln192Arg). It is well recognized that compared with the unaltered condition, this nucleotide change is associated with increased activities of serum paraoxonase18 and chlorpyrifos oxonase19, while decreased activities of sarinase and somanase18. An impact of PON1 rs622 polymorphism on arylesterase activity, measured by phenylacetate hydrolysis, was described as approximately the same for AA and GG genotypes20,21 or lower for the PON1 rs622 AA than GG genotype22. Another PON1 missense variant, rs854560 (c.163A>T), leads to leucine-to-methionine substitution at position 55 of the encoded polypeptide (p.Leu55Met)1. The altered (c.163 T) PON1 transcript is less stable than the wild-type transcript, leading to lower amounts of variant mRNA and lower PON1 concentration and activity23,24. By contrast, nucleotide variants located in the PON1 5′-regulatory region, including the most commonly studied SNVs [rs854572 (− 909G/C), rs705381 (− 162A/G), and rs705379 (− 108C/T)], seem to increase PON1 expression level and concentration in serum. The − 108 polymorphism is present within a potential factor binding site for Sp1, common in TATA-less genes such as PON125.
We aimed to focus on PON1 rs705379, rs854560, and rs662 SNVs, as well as serum PON1 activity being assessed by catalytic efficiency for paraoxon hydrolysis (paraoxonase activity), concerning dyslipidaemia and atherosclerosis-related cardiovascular complications (coronary heart disease—CHD, type 1 myocardial infarction—MI, ischemic cerebral stroke—ICS) and mortality to show how they associate under uremic conditions modified by maintenance HD treatment. Numerous variables, previously examined as possible influencing PON1 transcription16,26–29 and parameters correlating with serum PON1 concentration or activity30–34, were searched in our patients. Additionally, we included in analysis parameters characterizing calcium-phosphate metabolism of HD subjects as human serum PON1 requires the presence of calcium for enzymatic activity35, as well as places of settlement that may differ in air pollution with acrolein36, a PON1 inactivator37. Exploring dyslipidaemia, atherosclerotic diseases, and cardiovascular mortality, possibly positively influenced by favourable PON1 SNVs and optimal serum PON1 activity, we aimed to comment on PON1 and PON1 usefulness as future therapeutic targets in the management of HD patients.
Results
Patent characteristics
Table 1 presents the patients’ data. In the group tested for serum PON1 activity, there were no individuals taking nandrolone decanoate or hormonal contraceptives. Three subjects supplemented zinc (zinc gluconate, 10 mg/day). All patients were receiving calcium-containing drugs as phosphate-binding medicines. Patients who required erythropoietin-stimulating agent (ESA) medication used epoetin beta.
Table 1.
Characteristics of HD patients.
| Variables tested in both groups | Patients genotyped for PON1 SNVs (n = 1407) | Patients tested for PON1 activity (n = 93) | P-valuea | Variables tested in one group | Patients tested for PON1 activity (n = 93) |
|---|---|---|---|---|---|
| Clinical data | Clinical and laboratory data | ||||
| Male sex (n, %) | 782 (55.6%) | 55 (59.1%) | 0.520 | Living in the rural area (n, %) | 27 (29.0) |
| Age (years) | 67.0 (11.9–96.1) | 66.7 (18.3–86.2) | 0.231 | LF-HD (n, %) | 78 (83.9%) |
| RRT duration (years) | 5.8 (0.01–34.0) | 3.9 (0.2–22.3) | 0.00003 | Mean arterial pressure (mmHg) | 113.3 (60–166.7) |
| Diabetic nephropathy (n, %) | 405 (28.8%) | 19 (20.4%) | 0.096 | Cigarette smoking (n, %) | 9 (9.7%) |
| Coronary heart disease (n, %) | 542 (38.5% of 1406) | 25 (26.9%) | 0.027 | Urine output (mL/day) | 600 (0–2100) |
| Myocardial infarction (n, %) | 299 (21.3% of 1406) | 15 (16.1%) | 0.292 | Treatment with antihypertensive drugs (n, %) | 43 (46.2%) |
| Ischemic cerebral stroke (n, %) | 256 (19.2%) of 1335 | 9 (9.7) | 0.026 | Treatment with phosphate binding agents (n, %) | 79 (84.9%) |
| Dry body mass (kg), n = 1235 | 71.5 (31.0–196.0) | 81.0 (44.4–144.0) | 0.000001 | Treatment with vitamin D or vitamin D analogs (n, %) | 7 (7.5%) |
| Body mass index (kg/m2)b | 25.5 (14.3–59.2) n = 1230 | 26.7 (17.8–51.0) | 0.010 | Parathyroidectomy (n, %) | 1 (1.1%) |
|
Lipid-modifying treatment (n, %) statins (n, %) fibrates (n, %) statins and fibrates (n, %) ezetimibe (n, %) statins + ezetimibe (n, %) |
582 (44.3% of 1314) 533 (91.6% of 582) 36 (6.2% of 582) 10 (1.7% of 582) 1 (0.2% of 582) 2 (0.3% of 582) |
24 (25.8% of 93) 23 (95.8% of 24) 1 (4.2% of 24) 0 0 0 |
0.0002 0.712 1.000 1.000 1.000 1.000 |
Treatment with ESA (n, %) | 66 (71.0) |
| ESA dose (µg/kg/week) | 90 (0–530) | ||||
| Type of dyslipidaemia by K/DOQI | Hemoglobin (g/dL) | 11.4 ± 1.3 | |||
| Hyper-LDL-cholesterolemic (n, %) | 388 of 1264 (30.7% ) | 39 of 93 (41.9%) | 0.028 | Treatment with cinacalcet (n, %) | 6 (6.5%) |
| Hyper-TG/hyper-non-HDL-cholesterolemic (n, %) | 79 of 1264 (6.2% ) | 5 of 93 (5.4%) | 1.000 | Vitamin C supplementation (n, %) | 2 (2.2%) |
| Mixed (n, %) | 186 of 1264 (14.7% ) | 14 of 93 (15.1%) | 0.545 | Zinc supplementation (n, %) | 3 (3.2%) |
| Non-dyslipidemic (n, %) | 610 of 1264 (48.3% ) | 35 of 93 (37.6%) | 0.053 | Green tea intake (n, %) | 4 (4.3%) |
| Atherogenic dyslipidaemia (n, %) | 459 of 1264 (36.3% ) | 39 of 93 (41.9%) | 0.316 | PON1 activity (U/L) | 101.0 (27.7–212.9) |
| Laboratory data | PON1/HDL-cholesterol ratio | 2.27 (0.57–7.10) | |||
| Total cholesterol (mg/dL) | 170.2 (51–626) | 183 (83–626) | 0.170 | Creatinine (mg/dL) | 5.7 (1.9–14.4) |
| HDL-cholesterol (mg/dL) | 40 (5–146.8) | 44.4 ± 11.7 | 0.044 | Urea (mg/dL) | 106 (41–270) |
| LDL-cholesterol (mg/dL) | 95.9 (13.3–512) | 104 (35–512) | 0.012 | C-reactive protein (mg/L) | 4.3 (0.3–79.3) |
| TG (mg/dL) | 146.4 (29.8–1363) | 157 (65–460) | 0.291 | Albumin (mg/dL) | 4.1 (2.6–4.7) |
| Non-HDL-cholesterol (mg/dL) | 128 (8–593) | 135 (41–593) | 0.346 | Total calcium (mg/dL) | 8.8 (6.8–12.5) |
| LDL/HDL cholesterol ratio | 2.38 (0.21–15.52) | 2.35 (0.680–15.52) | 0.699 | Phosphorus (mg/dL) | 4.85 (2.32–10.52) |
| HDL/TC ratio | 0.249 (0.045–0.906) | 0.250 (0.053–0.530) | 0.430 | Total ALP (IU/L) | 93 (24–321) |
| TG/HDL-cholesterol ratio | 3.60 (0.44–49.71) | 3.42 (1.06–17.04) | 0.717 | Parathyroid hormone (pg/mL) | 280 (7.3–1783.8) |
ALP alkaline phosphatase, ESA erythropoietin-stimulating agent, HD haemodialysis, HDL high-density lipoprotein, K/DOQI Kidney Disease Outcomes Quality Initiative, LDL low-density lipoprotein, LF-HD low-flux haemodialysis, NA not available in all patients, PON1 paraoxonase 1, PON1 paraoxonase 1 gene, SNV single nucleotide variant, RRT renal replacement therapy, TG triglyceride.
aThe Kruskal–Wallis and Mann–Whitney U tests were used for comparison of continuous variables. Dichotomous variables were compared using Fisher's exact test.
bBMI was not calculated in 5 patients due to amputation of the leg(s).
Individuals of the entire group (n = 1407) and those tested for serum PON1 activity (n = 93) did not differ in the frequency of the PON1 genotypes (Supplementary Table S1). However, the latter group included subjects being shorter on renal replacement therapy (RRT), having higher body mass, the lower frequency of CHD and ICS, and more rare receiving lipid-modifying medicines (Table 1).
PON1 SNVs
We obtained polymorphic variants of PON1 in 1332 patients genotyped for PON1 rs705379, 1365—for PON1 rs854560, and 1335—for PON1 rs662. All SNVs complied with the Hardy–Weinberg equilibrium (HWE). There was a weak linkage disequilibrium (LD, r2 < 0.3) between tested SNVs (Supplementary Table S2).
Probability of obtaining significant associations
Supplementary Table S3 demonstrates the expected sample sizes and odds ratios (ORs) for the likelihood of securing significance at 80% sample power in association analyses between PON1 SNVs and tested phenotypes. ORs lower than 1.6–1.8 could provide significance at sample power below 80%.
PON1 SNVs, dyslipidaemia, and related diseases
There were no significant associations between tested PON1 SNVs and parameters of serum lipid profile. Although bearers of the PON1 rs662 low activity allele (A) showed lower serum HDL-cholesterol than the rs662 GG homozygotes (Table 2), this relationship did not persist in the multiple regression model including rs662 AA + AG vs. GG (P = 0.106), age (P = 0.721), male gender (P < 0.000001), diabetic nephropathy (P = 0.310), and lipid-modifying treatment (P = 0.005).
Table 2.
PON1 SNVs and serum lipid parameters in HD patients.
| PON1 variant | Total cholesterol (mg/dL) | P-value | HDL-cholesterol (mg/dL) | P-value | LDL-cholesterol (mg/dL) | P-value | Triglycerides (mg/dL) | P-value | Non-HDL-cholesterol(mg/dL) | P-value |
|---|---|---|---|---|---|---|---|---|---|---|
| rs662 | ||||||||||
| AA | 168.5 (71.5–626) | 40 (5–146.8) | 94 (17.4–512) | 148 (32–856) | 125 (8–593) | |||||
| AG | 172 (51–368) | 0.904a | 39 (8–103) | 0.105a | 97 (13.3–369) | 0.506a | 144 (35–1363) | 0.732a | 131 (32–329) | 0.643a |
| GG | 170.1 (84–336) | 42 (12–103) | 96.8 (33–215) | 147.4 (29.8–1105) | 127 (42.1–296) | |||||
| AA + AG vs. GG | 170 (51–626) | 0.931b | 40 (5–146.8) | 0.043b | 95 (13.3–512) | 0.660b | 146.2 (32–1363) | 0.678b | 128 (8–593) | 0.508b |
| AA vs. AG + GG | 171.5 (51–368) | 0.657b | 40 (8–103) | 0.939b | 97 (13.3–369) | 0.383b | 144 (29.8–1363) | 0.440b | 130.5 (32–329) | 0.684b |
| rs854560 | ||||||||||
| AA | 169 (65–626) | 40.2 (6–118) | 94.4 (17–512) | 144 (29.8–1105) | 127 (40–593) | |||||
| AT | 170 (51–368) | 0.808a | 40 (7–146.8) | 0.193a | 95.3 (13.3–369) | 0.645a | 144 (32–1363) | 0.461a | 128 (8–329) | 0.603a |
| TT | 172 (85–337) | 40 (5–92) | 99.7 (35–239.3) | 155 (36.3–856) | 129.5 (58–299) | |||||
| AT + TT vs. AA | 171 (51–368) | 0.805b | 40 (5–146.8) | 0.185b | 96 (13.3–369) | 0.950b | 146.4 (32–1363) | 0.583b | 128 (8–329) | 0.625b |
| TT vs. AA + AT | 172 (85–337) | 0.618b | 40 (6–146.8) | 0.112b | 95 (13.3–512) | 0.364b | 144 (29.8–1363) | 0.218b | 127.7 (8–593) | 0.324b |
| rs705379 | ||||||||||
| CC | 170.5 (75–336) | 41 (12–103) | 97 (20–223) | 142 (39–1105) | 128 (27–296) | |||||
| CT | 170 (65–626) | 0.608a | 40 (6–146.8) | 0.138a | 94.6 (17.4–512) | 0.536a | 143 (29.8–1363) | 0.275a | 128 (8–593) | 0.973a |
| TT | 167.7 (51–363) | 39 (5–92) | 94 (13.3–369) | 157 (32–856) | 125.3 (32–313) | |||||
| CT + TT vs. CC | 169.1 (51–626) | 0.635b | 40 (5–146.8) | 0.171b | 94 (13.3–512) | 0.389b | 146.7 (29.8–1363) | 0.197b | 127 (8–593) | 0.927b |
| TT vs. CT + CC | 170 (65–626) | 0.323b | 40 (6–146.8) | 0.067b | 95.8 (17.4–512) | 0.334b | 143 (29.8–1363) | 0.178b | 128 (8–593) | 0.814b |
aKruskal-Wallis test for comparison between genotypes.
bMann-Whitney U test for comparison in the specified mode of inheritance.
There were no associations between tested PON1 SNVs and dyslipidaemic patterns by the Kidney Disease Outcomes Quality Initiative (K/DOQI) criteria (Supplementary Table S4).
The triglyceride (TG)/HDL-cholesterol ratio ≥ 3.8, indicating atherogenic dyslipidaemia38, was associated with PON1 rs662 (the dominant mode) and rs854560 (the additive mode) (Table 3). The association of PON1 rs662 with atherogenic dyslipidaemia (P = 0.018) persisted in multiple regression analysis including age (P = 0.974), male gender (P = 0.641), diabetic nephropathy (P = 0.327), and lipid-modifying treatment (P = 0.002). In the model comprising the same clinical variables, PON1 rs854560 TT genotype significantly correlated with atherogenic dyslipidaemia (P = 0.031) together with lipid-modifying treatment (P = 0.015); PON1 rs854560 AT + TT was also associated with atherogenic dyslipidaemia (P = 0.040) with lipid-modifying treatment (P = 0.016) (Supplementary Table S5). PON1 rs705379 did not correlate with the frequency of the TG/HDL-cholesterol ratios ≥ 3.8 (Table 3).
Table 3.
PON1 polymorphic variants and atherogenic dyslipidaemia diagnosed by the atherogenic index ≥ 3.8.
| Genotypes | AI ≥ 3.8 n = 459, 36.3% of all |
AI < 3.8 (Reference) n = 805, 63.7% of all |
Odds ratio (95% CI), P-valuea |
|---|---|---|---|
| PON1 rs662 (575A>G) n = 1195 | |||
| AA vs. AG vs. GG | 242 (56%) vs. 164 (38%) vs. 26 (6%) | 413 (54.1%) vs. 275 (36%) vs. 75 (9.8%) | 0.143b |
| AA + AG vs. GG | 406 (94.0%) vs.26 (6.0%) | 688 (90.2%) vs.75 (9.8%) | 1.702 (1.072, 2.704) 0.023, 60.1%c |
| AA vs. AG + GG | 242 (56.0%) vs. 190 (44%) | 413 (54.1%) vs. 350 (45.9%) | 1.079 (0.851, 1.369), 0.546 |
| PON1 rs854560 (163A>T) n = 1225 | |||
| TT vs. AT vs. AA | 62 (14.1%) vs. 208 (47.3%) vs. 170 (38.6%) | 80 (10.2%) vs. 356 (45.4%%) vs. 349 (44.5%) | 0.014b |
| AT + TT vs. AA | 270 (61.4%) vs. 170 (38.6%) | 436 (55.5%) vs. 349 (44.5%) | 1.271 (1.002, 1.613) 0.054 |
| TT vs. AA + AT | 62 (14.1%) vs. 378 (85.9%) | 80 (10.2%) vs. 705 (89.8%) | 1.445 (1.014, 2.06) 0.050 |
| PON1 rs705379 (− 108C>T), n = 1196 | |||
| TT vs. CT vs. CC | 98 (23%) vs. 212 (49.6%) vs. 117 (27.4%) | 181 (23.5%) vs. 364 (47.3%) vs. 224 (29.1%) | 0.792b |
| CT + TT vs. CC | 310 (72.6%) vs. 117 (27.4%) | 545 (70.9%) vs. 224 (29.1%) | 1.089 (0.837, 1.417) 0.548 |
| TT vs. CT + CC | 98 (23%) vs. 329 (77%) | 181 (23.5%) vs. 588 (76.5%) | 0.968 (0.731, 1.281) 0.831 |
aFisher's exact test.
bCochran-Armitage test.
cSample power for this analysis.
Table 4 shows no significant associations between tested PON1 SNVs and CHD or type 1 MI. PON1 rs854560 was significantly associated with ICS (Table 5). In logistic regression, the positive association between the rs854560 T allele and ICS (OR 1.375, 95% CI 1.024–1.847, P = 0.034) was shown together with the annual increase in age (OR 1.025, 95% CI 1.014–1.036, P = 0.000006) and diabetic nephropathy (OR 1.772, 95% CI 1.315–2.388, P = 0.0002). Sex and RRT duration did not yield significance in this model.
Table 4.
PON1 polymorphic variants and prevalence of coronary heart disease and type 1 myocardial infarction in HD patients.
| Genotypes | CHD | No CHD (Reference) | Odds ratio (95% CI), P-value for no CHD as referencea | Myocardial infarction | No myocardial infarction (Reference) | Odds ratio (95% CI), P-value for no myocardial infarctionas referencea | Odds ratio (95% CI), P-value for no CHD as referencea |
|---|---|---|---|---|---|---|---|
| PON1 rs662 (575A>G) n = 1335, P for HWE = 0.05 | |||||||
| AA vs. AG vs. GG | 286 (55.6%) vs. 187 (36.4%) vs. 41 (8%) | 444 (54.1%) vs. 308 (37.5%) vs. 69 (8.4%) | 0.582b | 151 (53.7%) vs. 106 (37.7%) vs. 24 (8.5%) | 579 (54.9%) vs. 389 (36.9%) vs. 86 (8.2%) | 0.715b | 0.914b |
| AA + AG vs. GG | 473 (92%) vs. 41 (8.0%) | 752 (91.6%) vs. 69 (8.4%) | 1.059 (0.707, 1.584) 0.838 | 257 (91.5%) vs.24 (8.5%) | 968 (91.8%) vs. 86 (8.2%) | 0.951 (0.593, 1.527) 0.808 | 0.983 (0.605, 1.597) 1.000 |
| AA vs. AG + GG | 286 (55.6%) vs. 228 (44.4%) | 444 (54.1%) vs.377 (45.9%) | 1.065 (0.853, 1.329) 0.611 | 151 (53.7%) vs.130 (46.3%) | 579 (54.9%) vs. 475 (45.1%) | 0.953 (0.732, 1.241) 0.736 | 0.986 (0.752, 1.294) 0.945 |
| PON1 rs854560 (163A>T) n = 1365, P for HWE = 0.12 | |||||||
| TT vs. AT vs. AA | 60 (11.4%) vs. 246 (46.6%) vs. 222 (42%) | 99 (11.8%) vs. 377 (45%) vs. 361 (43.1%) | 0.867b | 37 (12.7%) vs. 120 (41.2%) vs. 134 (46%) | 122 (11.4%) vs. 503 (46.8%) vs. 449 (41.8%) | 0.514b | 0.659b |
| AT + TT vs. AA | 306 (58%) vs. 222 (42%) | 476 (56.9%) vs. 361 (43.1%) | 1.045 (0.839, 1.303) 0.736 | 157 (54%) vs. 134 (46%) | 625 (58.2%) vs. 449 (41.8%) | 0.842 (0.649, 1.092) 0.205 | 0.990 (0.802, 1.223) 0.957 |
| TT vs. AA + AT | 60 (11.4%) vs. 468 (88.6%) | 99 (11.8%) vs. 738 (88.2%) | 0.956 (0.68, 1.344) 0.862 | 37 (12.7%) vs. 254 (87.3%) | 122 (11.4%) vs. 952 (88.6%) | 1.137 (0.767, 1.684) 0.537 | 1.000 (0.72, 1.389) 1.000 |
| PON1 rs705379 (− 108C>T), n = 1332, P for HWE = 0.25 | |||||||
| TT vs. CT vs. CC | 126 (24.7%) vs. 235 (46.1%) vs. 149 (29.2%) | 182 (22.1%) vs. 408 (49.6%) vs. 232 (28.2%) | 0.151b | 74 (26.6%) vs. 115 (41.4%) vs. 89 (32%) | 234 (22.2%) vs. 528 (50.1%) vs. 292 (27.7%) | 0.982b | 0.891 b |
| CT + TT vs. CC | 361 (70.8%) vs. 149 (29.2%) | 590 (71.8%) vs. 232 (28.2%) | 0.953 (0.746, 1.216) 0.708 | 189 (68.0%) vs. 89 (32.0%) | 762 (72.3%) vs. 292 (27.7%) | 0.814 (0.611, 1.083) 0.157 | 0.928 (0.735, 1.173) 0.049 |
| TT vs. CT + CC | 126 (24.7%) vs. 384 (75.3%) | 182 (22.1%) vs. 640 (77.9%) | 1.154 (0.89, 1.496) 0.285 | 74 (26.6%) vs. 204 (73.4%) | 234 (22.2%) vs. 820 (77.8%) | 1.271 (0.939, 1.721) 0.129 | 1.150 (0.897, 1.474) 0.276 |
CHD coronary heart disease, HD haemodialysis, PON1—paraoxonase 1 gene.
aFisher's exact test.
bCochran-Armitage test.
Table 5.
PON1 polymorphic variants and the cerebral stroke prevalence in HD patients.
| Genotypes | Cerebral stroke | No cerebral stroke (Reference) | Odds ratio (95% CI), P-valuea |
|---|---|---|---|
| PON1 rs662 (575A > G) | |||
| AA vs. AG vs. GG | 139 (57.4%) vs. 90 (37.2%) vs. 13 (5.4%) | 556 (54.2%) vs. 381 (37.2%) vs. 88 (8.6%) | 0.161b |
| AA + AG vs. GG | 229 (94.6%) vs. 13 (5.4%) | 937 (91.4%) vs. 88 (8.6%) | 1.654 (0.908, 3.015) 0.113 |
| AA vs. AG + GG | 139 (57.4%) vs 103 (42.6%) | 556 (54.2%) vs. 469 (45.8%) | 1.138 (0.858, 1.511) 0.390 |
| PON1 rs854560 (163A>T) | |||
| TT vs. AT vs. AA | 38 (15.4%) vs. 123 (49.8%) vs. 86 (34.8%) | 118 (11.3%) vs. 473 (45.2%) vs. 456 (43.6%) | 0.005b |
| AT + TT vs. AA | 161 (65.2%) vs. 86 (34.8%) | 591 (56.4%) vs. 456 (43.6%) | 1.444 (1.082, 1.928) 0.012, 69.9%c |
| TT vs. AA + AT | 38 (15.4%) vs. 209 (84.6%) | 118 (11.3%) vs. 929 (88.7%) | 1.431 (0.964, 2.125) 0.082 |
| PON1 rs705379 (− 108C>T) | |||
| TT vs. CT vs. CC | 63 (26.4%) vs. 106 (44.4%) vs. 70 (29.3%) | 239 (23.3%) vs. 503 (49%) vs. 284 (27.7%) | 0.778b |
| CT + TT vs. CC | 169 (70.7%) vs. 70 (29.3%) | 742 (72.3%) vs. 284 (27.7%) | 0.924 (0.678, 1.260) 0.632 |
| TT vs. CT + CC | 63 (26.4%) vs. 176 (73.6%) | 239 (23.3%) vs. 787 (76.7%) | 1.179 (0.854, 1.627) 0.313 |
HD haemodialysis, PON1 paraoxonase 1 gene.
aFisher's exact test.
bCochran-Armitage test.
cSample power for this analysis.
Serum PON1 and patient data
In unadjusted analyses, the lower serum PON1 activity, the higher frequency of mixed dyslipidaemia by K/DOQI guidelines39, and the higher serum TG levels (Table 6). The PON1/HDL-cholesterol ratio correlated positively with male sex, cigarette smoking, presence of atherogenic dyslipidaemia, and values of the TG/HDL-cholesterol ratio (Table 7).
Table 6.
Correlates of serum PON1 activity (U/L) in HD patients (n = 93).
| Parameter | Unadjusted percent change in PON1activity | Adjusted percent change in PON1activitya | ||
|---|---|---|---|---|
| βb ± SE | P-value | β ± SE | P-value | |
| Clinical data | ||||
| Male sex | 6.6 ± 7.4 | 0.375 | 4.7 ± 7.4 | 0.527 |
| Age (per 10 years) | 1.7 ± 2.5 | 0.490 | − 0.99 ± 2.93 | 0.737 |
| Living in the rural area | 10.0 ± 7.8 | 0.215 | 9.6 ± 8 | 0.233 |
| RRT duration (per 1 year) | 0.2 ± 0.8 | 0.829 | − 0.29 ± 0.89 | 0.743 |
| LF-HD | − 7.9 ± 9.9 | 0.428 | − 5 ± 10.1 | 0.623 |
| Diabetic nephropathy | 4.4 ± 9.0 | 0.628 | 1.5 ± 8.9 | 0.869 |
| Coronary heart disease | − 0.2 ± 8.2 | 0.983 | − 4.7 ± 8.2 | 0.572 |
| Myocardial infarction | − 1.7 ± 9.9 | 0.866 | − 1.8 ± 9.9 | 0.856 |
| Ischemic cerebral stroke | 20.5 ± 12.2 | 0.096 | 16 ± 12.4 | 0.201 |
| Mean arterial pressure (per 10 mmHg) | 0.72 ± 2.89 | 0.804 | 1.7 ± 3.0 | 0.571 |
| Dry body mass (per 10 kg) | − 1.0 ± 2.3 | 0.659 | − 1.6 ± 2.5 | 0.510 |
| Body mass index (per 5 kg/m2) | 0.2 ± 3.9 | 0.963 | − 0.7 ± 4.0 | 0.851 |
| Cigarette smoking | 21.1 ± 12.2 | 0.086 | 24.4 ± 12.4 | 0.052 |
| Urine output (per 300 mL/day) | − 1.2 ± 2.1 | 0.552 | − 2.0 ± 2.0 | 0.339 |
| Lipid-modifying treatment | 7.5 ± 8.3 | 0.371 | 6.0 ± 8.2 | 0.467 |
| - treatment with statins | 7.3 ± 8.4 | 0.389 | 6.6 ± 8.3 | 0.429 |
| Treatment with antihypertensive drugs | 8.0 ± 7.3 | 0.276 | 12.5 ± 7.3 | 0.093 |
| Treatment with phosphate binding agents | 4.7 ± 10.2 | 0.648 | 6.2 ± 10.1 | 0.540 |
| Treatment with calcium-based phosphate binders | 4.7 ± 10.2 | 0.648 | 6.2 ± 10.1 | 0.540 |
| Treatment with vitamin D (alfacalcidol–2 cases) or vitamin D analogs (paricalcitol—5 cases) | − 5.0 ± 13.8 | 0.716 | − 7.9 ± 14.3 | 0.583 |
| Treatment with ESA | 5.0 ± 8.0 | 0.532 | 6.7 ± 7.9 | 0.401 |
| ESA dose (per 1 µg/kg/week) | 0.036 ± 0.029 | 0.217 | 0.041 ± 0.028 | 0.150 |
| Treatment with cinacalcet | − 5.3 ± 14.9 | 0.721 | 0.1 ± 14.7 | 0.995 |
| Vitamin C supplementation | 7.6 ± 25.2 | 0.763 | 6.3 ± 24.6 | 0.799 |
| Zinc supplementation | 27.1 ± 20.5 | 0.189 | 29.8 ± 20.7 | 0.155 |
| Green tea intake | − 0.1 ± 18.0 | 0.997 | 3.2 ± 17.9 | 0.858 |
| Type of dyslipidaemia by K/DOQI | ||||
| Hyper-LDL-cholesterolemic | 7.25 ± 7.36 | 0.328 | 5.4 ± 7.3 | 0.467 |
| Hyper-TG/hyper-non-HDL-cholesterolemic | 6.48 ± 16.18 | 0.690 | 9.3 ± 16.6 | 0.577 |
| Mixed | − 21.4 ± 10.0 | 0.035 | − 16.4 ± 10.1 | 0.109 |
| Non-dyslipidemic | 2.72 ± 7.53 | 0.719 | 1.3 ± 7.5 | 0.861 |
| Atherogenic dyslipidaemia | − 5.25 ± 7.38 | 0.479 | − 7.5 ± 7.5 | 0.323 |
| Laboratory data | ||||
| Total cholesterol (per 10 mg/dL) | − 1.0 ± 0.6 | 0.066 | − 0.77 ± 0.56 | 0.170 |
| HDL cholesterol (per 10 mg/dL) | − 3.9 ± 3.1 | 0.218 | − 1.7 ± 3.4 | 0.610 |
| LDL cholesterol (per 10 mg/dL) | 0.31 ± 0.63 | 0.625 | − 0.20 ± 0.62 | 0.752 |
| TG (per 10 mg/dL) | − 1.06 ± 0.49 | 0.034 | − 0.94 ± 0.48 | 0.056 |
| Non-HDL-cholesterol (per 10 mg/dL) | − 0.91 ± 0.56 | 0.108 | − 0.71 ± 0.55 | 0.204 |
| LDL/HDL cholesterol (per 1.0) | 0.79 ± 1.79 | 0.658 | 0.67 ± 1.81 | 0.712 |
| HDL/TC (per 5%) | 41.0 ± 42.1 | 0.332 | 46.4 ± 42 | 0.272 |
| TG/HDL-cholesterol (per 1.0) | − 1.5 ± 1.4 | 0.288 | − 1.8 ± 1.4 | 0.206 |
| Creatinine (per 1 mg/dL) | − 0.66 ± 1.57 | 0.674 | − 1.2 ± 2.0 | 0.551 |
| Urea (per 10 mg/dL) | − 0.35 ± 0.99 | 0.723 | 0.53 ± 1.10 | 0.628 |
| C-reactive protein (per 1 mg/L) | − 0.25 ± 0.28 | 0.370 | − 0.40 ± 0.28 | 0.150 |
| Albumin (per 1 g/dL) | 5.3 ± 10.4 | 0.609 | 3.1 ± 10.4 | 0.767 |
| Total calcium (per 1 mg/dL) | − 1.2 ± 4.1 | 0.774 | − 1.1 ± 4.1 | 0.783 |
| Phosphorus (per 1 mg/dL) | − 3.9 ± 2.0 | 0.060 | − 4.0 ± 2.0 | 0.054 |
| Total ALP (per 100 IU/L) | 6.6 ± 6.3 | 0.295 | 5.5 ± 6.5 | 0.394 |
| Parathyroid hormone (per 1000 pg/mL) | 2.0 ± 8.2 | 0.807 | 1.9 ± 8.6 | 0.830 |
| Haemoglobin (per 1 g/dL) | 1.7 ± 2.9 | 0.546 | 1.4 ± 2.8 | 0.628 |
ALP alkaline phosphatase, ESA erythropoietin-stimulating agent, HD haemodialysis, HDL high-density lipoprotein, LDL low density lipoprotein, LF-HD low-flux haemodialysis, PON1 paraoxonase 1 gene, RRT renal replacement therapy, TG triglycerides.
aGender, cigarette smoking, urine output, living in a rural area, and serum phosphorus were used for adjustment in the multiple regression analysis.
bβ coefficient can be interpreted as the percent change expected in serum PON1activity for each unit change in the tested variable.
Table 7.
Correlates of the normalized serum PON1 activity (PON1/HDL-cholesterol ratio).
| Parameter | Unadjusted percent change in PON1/HDL-cholesterol ratio | Adjusted percent change in PON1/HDL-cholesterol ratio | ||
|---|---|---|---|---|
| β b ± SE | P value | β ± SE | P value | |
| Clinical data | ||||
| Male sex | 0.56 ± 0.25 | 0.029 | 0.51 ± 0.24 | 0.037 |
| Age (per 10 years) | 0.050 ± 0.087 | 0.598 | − 0.006 ± 0.097 | 0.955 |
| Living in the rural area (n, %) | 0.53 ± 0.27 | 0.056 | 0.55 ± 0.26 | 0.039 |
| RRT duration (per 1 year) | 0.031 ± 0.027 | 0.264 | 0 ± 0.029 | 0.999 |
| LF-HD | − 0.38 ± 0.34 | 0.268 | − 0.19 ± 0.33 | 0.577 |
| Diabetic nephropathy | 0.43 ± 0.31 | 0.170 | 0.33 ± 0.29 | 0.258 |
| Coronary heart disease | 0.26 ± 0.28 | 0.363 | 0.06 ± 0.27 | 0.828 |
| Myocardial infarction | − 0.43 ± 0.34 | 0.212 | − 0.4 ± 0.32 | 0.216 |
| Ischemic cerebral stroke | 0.21 ± 0.43 | 0.618 | − 0.08 ± 0.41 | 0.843 |
| Mean arterial pressure (per 10 mmHg) | − 0.035 ± 0.100 | 0.730 | − 0.001 ± 0.101 | 0.989 |
| Dry body mass (per 10 kg) | 0.065 ± 0.081 | 0.423 | 0.031 ± 0.082 | 0.706 |
| Body mass index (per 5 kg/m2) | 0.13 ± 0.14 | 0.346 | 0.088 ± 0.131 | 0.501 |
| Cigarette smoking | 0.86 ± 0.42 | 0.043 | 0.93 ± 0.41 | 0.024 |
| Urine output (per 300 mL/day) | − 0.12 ± 0.07 | 0.098 | − 0.14 ± 0.07 | 0.046 |
|
Lipid-modifying treatment - treatment with statins |
− 0.005 ± 0.288 0.027 ± 0.292 |
0.987 0.928 |
− 0.04 ± 0.27 0.024 ± 0.276 |
0.878 0.931 |
| Treatment with antihypertensive drugs | 0.11 ± 0.25 | 0.659 | 0.27 ± 0.24 | 0.280 |
| Treatment with phosphate binding agents | 0.04 ± 0.35 | 0.905 | 0.05 ± 0.34 | 0.876 |
| Treatment with vitamin D (alfacalcidol—2 cases) or vitamin D analogues (paricalcitol—5 cases) | − 0.42 ± 0.48 | 0.383 | − 0.71 ± 0.47 | 0.129 |
| Treatment with ESA | − 0.04 ± 0.28 | 0.878 | 0.05 ± 0.26 | 0.860 |
| ESA dose (per 1 µg/kg/week) | − 0.0004 ± 0.0010 | 0.695 | − 0.0001 ± 0.0010 | 0.894 |
| Treatment with cinacalcet | − 0.65 ± 0.51 | 0.203 | − 0.40 ± 0.48 | 0.409 |
| Vitamin C supplementation | − 0.61 ± 0.87 | 0.483 | − 0.67 ± 0.81 | 0.408 |
| Zinc supplementation | 1.18 ± 0.70 | 0.098 | 1.5 ± 0.67 | 0.029 |
| Green tea intake | 0.04 ± 0.62 | 0.943 | 0.11 ± 0.59 | 0.855 |
| Type of dyslipidaemia by K/DOQI | ||||
| Hyper-LDL-cholesterolemic | 0.08 ± 0.26 | 0.741 | 0.04 ± 0.24 | 0.882 |
| Hyper-TG/hyper-non-HDL-cholesterolemic | − 0.05 ± 0.56 | 0.927 | − 0.29 ± 0.55 | 0.604 |
| Mixed | 0.28 ± 0.35 | 0.430 | − 0.1 ± 0.34 | 0.779 |
| Non-dyslipidemic | 0.08 ± 0.26 | 0.773 | 0.07 ± 0.25 | 0.774 |
|
Atherogenic dyslipidaemia TG/HDL-cholesterol (per 1.0) |
0.67 ± 0.25 0.12 ± 0.05 |
0.008 0.018 |
0.54 ± 0.24 0.093 ± 0.047 |
0.028 0.049 |
| Laboratory datac | ||||
| Total cholesterol (per 10 mg/dL) | − 0.033 ± 0.019 | 0.091 | − 0.019 ± 0.019 | 0.298 |
| LDL cholesterol (per 10 mg/dL) | 0.014 ± 0.022 | 0.525 | 0.016 ± 0.021 | 0.432 |
| TG (per 10 mg/dL) | − 0.012 ± 0.017 | 0.500 | − 0.009 ± 0.016 | 0.591 |
| Non-HDL-cholesterol (per 10 mg/dL) | 0.011 ± 0.020 | 0.560 | − 0.003 ± 0.018 | 0.887 |
| Creatinine (per 1 mg/dL) | 0.056 ± 0.051 | 0.279 | 0.000 ± 0.061 | 1.000 |
| Urea (per 10 mg/dL) | − 0.001 ± 0.034 | 0.976 | 0.005 ± 0.036 | 0.894 |
| C-reactive protein (per 1 mg/L) | − 0.0065 ± 0.0097 | 0.502 | − 0.011 ± 0.009 | 0.222 |
| Albumin (per 1 mg/dL) | 0.31 ± 0.36 | 0.390 | 0.08 ± 0.34 | 0.807 |
| Total calcium (per 1 mg/dL) | 0.03 ± 0.14 | 0.839 | − 0.02 ± 0.14 | 0.901 |
| Phosphorus (per 1 mg/dL) | − 0.078 ± 0.071 | 0.275 | − 0.083 ± 0.068 | 0.225 |
| Total ALP (per 100 IU/L) | 0.25 ± 0.23 | 0.267 | 0.18 ± 0.22 | 0.411 |
| Parathyroid hormone (per 1000 pg/mL) | 0.21 ± 0.28 | 0.465 | 0.17 ± 0.28 | 0.541 |
| Hemoglobin (per 1 g/dL) | 0.079 ± 0.099 | 0.424 | 0.057 ± 0.093 | 0.541 |
ALP alkaline phosphatase, ESA erythropoietin-stimulating agent, HD haemodialysis, HDL high-density lipoprotein, LDL—low-density lipoprotein, LF-HD low-flux haemodialysis, PON1 paraoxonase 1 gene, RRT renal replacement therapy, TG triglycerides.
aGender, cigarette smoking, urine output, living in a rural area, and serum phosphorus were used for adjustment in the multiple regression analysis.
bβ coefficient can be interpreted as the percent change expected in serum PON1activity for each unit change in the tested variable.
cHDL-cholesterol and lipid indices calculated using HDL-cholesterol were not included in this analysis due to mathematical coupling.
After adjustment for gender, cigarette smoking, urine output, living in a rural area, and serum phosphorus, significance persisted between normalized serum PON1activity and male sex, cigarette smoking, and atherogenic dyslipidaemia (and the TG/HDL-cholesterol ratio), as well as appeared for living in rural areas, urine output, and zinc supplementation.
Survival analyses
Eight hundred four patients died during their RRT period lasting 0.01–34.0 years (Table 1). Cardiovascular mortality was a cause of death in 485 patients (354 subjects died from cardiac reasons, 131—from vascular diseases).
If cardiovascular survival probability was compared between genotypes of PON1 rs705379 (TT vs. CT vs. CC), the log-rank test revealed a significant difference (P = 0.025). Homozygotes TT of PON1 rs705379 revealed lower cardiovascular survival than the C allele bearers (Fig. 1a). A significance was shown for cardiac deaths in the recessive mode of inheritance (Fig. 1b) and mortality from CHD and its complications between the TT and CC genotypes (Fig. 1c) but not for vascular deaths, also if deaths from ICS were analysed separately (n = 98). These significances yielded P < 0.05 in the Cox proportional hazards models including age, gender, diabetic nephropathy, and rs705379 TT vs. CC + CT (HR 1.269, 95% CI 1.030–1.565, P = 0.025 for cardiovascular mortality; HR 1.343, 95% CI 1.053–1.713, P = 0.018 for cardiac mortality). Significantly associated with cardiovascular and cardiac mortalities were also age (HR 1.013, 95% CI 1.006–1.021, P = 0.006 for cardiovascular; HR 1.014, 95% CI 1.004–1.023, P = 0.004 for cardiac mortality) and diabetic nephropathy (HR 1.366, 95% CI 1.134–1.645, P = 0.001 for cardiovascular; HR 1.278, 95% CI 1.028–1.589, P = 0.027 for cardiac). In the Cox proportional hazards model, the difference between the PON1 rs705379 TT and CC genotypes concerning mortality from CHD and its complications was connected only with the TT homozygosity (HR 1.549, 95% CI 1.064–2.255, P = 0.023).
Figure 1.

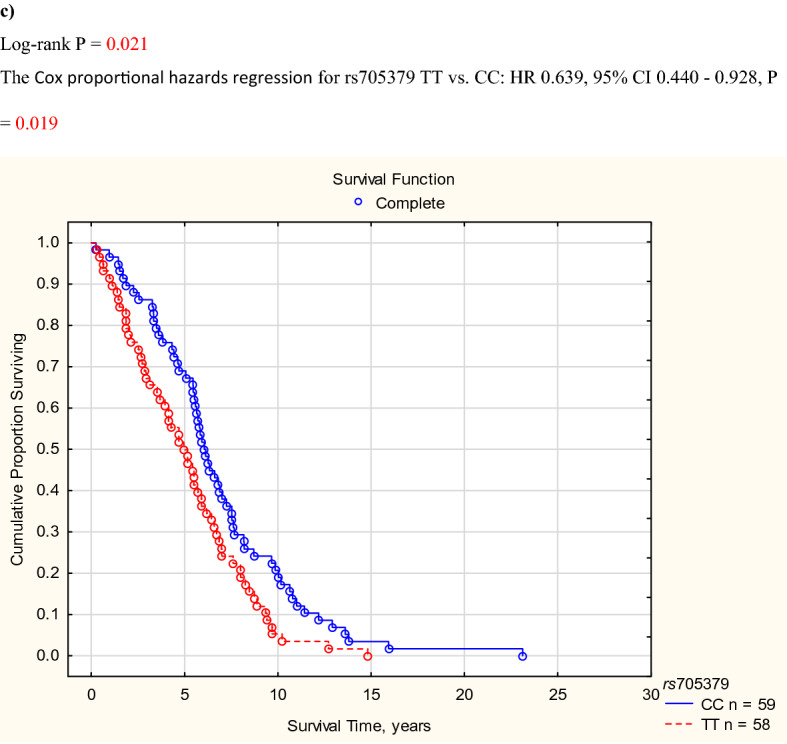
PON1 rs705379 and cumulative proportion surviving for cardiovascular diseases in HD patients. (a) All cardiovascular diseases. (b) Cardiac diseases. (c) Coronary heart disease and its complications. (a) Log-rank P = 0.033. The Cox proportional hazards regression for rs705379 TT vs. CC + CT: HR 0.784, 95% CI 0.636–0.966, P = 0.022. (b) Log-rank P = 0.035. The Cox proportional hazards regression for rs705379 TT vs. CC + CT: HR 0.755, 95% CI 0.592–0.962, P = 0.023. (c) Log-rank P = 0.021. The Cox proportional hazards regression for rs705379 TT vs. CC: HR 0.639, 95% CI 0.440—0.928, P = 0.019.
There were no associations between rs662 and rs854560 and cardiovascular, cardiac, and vascular mortality in HD patients.
Discussion
HD patients are burdened with dyslipidaemia, CHD, MI, and ICS more frequently than the general population40–42. This study shows several correlations between PON1 genetic polymorphisms (missense variants rs662 and rs854560, and promoter variant rs705379) and circulating functional protein PON1 concerning atherosclerotic phenotypes. Only associations, which remained significant among crucial demographic and clinical variables, were considered as having a meaningful contribution to dyslipidaemia and atherosclerotic complications.
The involvement of PON1 SNVs in dyslipidaemia, cardiovascular diseases, and mortality of the examined HD subjects may be summarized as follows: Low activity alleles of PON1 rs662 (A) and rs854560 (T) contribute to the higher prevalence of atherogenic dyslipidaemia diagnosed by the TG/HDL-cholesterol ratio ≥ 3.8 but are not related to untransformed parameters of serum lipid profile and dyslipidemic patterns established by K/DOQI for kidney disease patients39. The PON1 rs854560 T allele is involved in the higher prevalence of ICS. The PON1 rs705379 genotype composed of low activity alleles (TT) contributes to cardiovascular mortality, cardiac deaths, and CHD mortality and its complications. The protein product of PON1 is paraoxonase. Normalized serum PON1 (paraoxonase) activity positively associates with atherogenic dyslipidaemia. All mentioned above findings are consistent, although not all previously found associations (with CHD, MI) were revealed in HD patients at a statistically significant level.
Associations between PON1 SNVs and serum lipid parameters or dyslipidaemic profiles were evaluated among possible confounding variables like age, gender, diabetic nephropathy, and lipid-modifying treatment. It was shown that simvastatin increased the PON1 promoter's activity in a dose-dependent manner in expression cassettes transfected into HepG2 cells29. In HuH7 cells, statins (pravastatin, simvastatin, fluvastatin) downregulated the PON1 promoter by 30–50% in a dose-dependent manner. In contrast, the PON-1 secreted enzymatic activity and mRNA levels were increased by the active form of fenofibrate, fenofibric acid, approximately 70%16. In HD patients, statin treatment was independently positively related to PON1 concentration12. However, in another study on HD subjects, there were no significant differences in PON1 activity that could be related to statins43. In our study, the results of associations between PON1 SNVs and atherogenic dyslipidaemia seem to be not influenced by lipid-modifying therapy. Still, the correlation between rs662 and serum HDL-cholesterol became not significant in the model, including lipid-modifying treatment.
Studies on non-uremic subjects are showing higher CHD risk associated with the PON1 rs662 A (Q192) and the PON1 rs854560 T (M55) alleles, which correspond with the low activity PON1 isoform44,45. On the other hand, the PON1 rs662 G (192R) and the PON1 rs854560 A (L55) alleles, which are related to the high activity PON1 isoform, were also found to be associated with atherogenic serum lipid profile46 and common in atherosclerotic diseases (CHD, ICS) in the general population47,48. The PON1 rs662 G (192R) and the PON1 rs854560 A (L55) variants were suspected to be associated with CHD, particularly in diabetes mellitus, cigarette smoking, and older age24,49–51. There are also studies not indicating the association between the PON1 rs662 and CHD52. In the examined HD patients, among three PON1 SNVs (rs705379, rs854560, rs662), being in a weak LD, none showed a significant relationship with CHD or type 1 MI. In studies by Garin et al.24 and Imai et al.47 on non-uremic patients, which documented the associations of rs854560 and rs662 with CHD, respectively, criteria for the CHD diagnosis were much more spectacular than in our study: transmural MI or positive coronary angiogram24 or over 50% narrowing in at least one major coronary artery47. The analysis of HD cases with CHD diagnosed by such criteria could provide different results than currently presented.
In Polish HD patients, we revealed the association only between PON1 rs854560 and ICS in the dominant mode of inheritance. In the Han Chinese population without evident kidney diseases, rs705379 was significantly associated with ICS, also in the dominant way of inheritance53.
PON1 rs662 and PON1 rs854560 SNVs were associated with serum PON1 activity in HD patients in the previous studies. In Portuguese (n = 183)43 and Hungarian (n = 20)54 HD patients, the highest PON1 activity was shown in the PON1 rs662 GG homozygotes, the lowest—in the AA homozygotes. Concerning PON1 rs854560 in HD patients, Portuguese AA homozygotes showed the highest PON1 activity, whereas TT homozygotes—the lowest43. Japanese HD patients14, like Polish HD subjects in this study, did not differ in PON1 activity concerning PON1 rs854560 polymorphisms. To our knowledge, PON1 − 108C>T (rs705379) polymorphism was not examined in HD patients, but in healthy Japanese subjects, there was a decrease in PON1 activity for − 108T individuals when compared to those with the − 108C polymorphism16. Therefore, our study did not reveal significant differences in serum PON1 activity and the PON1/HDL-cholesterol ratio concerning PON1 SNVs previously associated with lower serum activity of anti-atherogenic PON11,43,54. However, the low-expression alleles/genotypes of these SNVs corresponded with atherogenic dyslipidaemia (rs662, rs854560), ICS (rs854560), or cardiovascular mortality (rs705379). It places them among unfavourable genetic inheritance.
Serum PON1 activity in the examined HD patients (median 101.0 U/L, range 27.7–212.9 U/L) places within the broad range of values observed in HD groups by other authors (58.0 ± 36.7 U/L8–258.3 ± 42.51 U/L on NaCl-stimulation55). Gugliucci et al. showed the closest to ours (101.1 ± 41.1 U/L) in non-diabetic HD subjects56. PON1 activity was not associated with diabetes (diabetic nephropathy) in the examined HD patients, HD subjects studied by Varga et al.57, and Itahara et al.58. In another study, non-diabetic HD subjects showed higher PON1 activity than type 2 diabetics59.
Only the univariate analyses indicated inverse correlations between serum PON1 activity and mixed dyslipidaemia by K/DOQI and serum TG concentration. In HD patients, serum PON1 (concentration or activity) was already associated with serum lipids, mainly HDL-cholesterol and HDL subclasses60,61. HD patients showing CHD had lower PON1 activity than subjects without CHD62. In HD men but not in HD women, PON1 concentrations were lower in CHD subjects than in those without CHD, although serum PON1 concentration was not gender-dependent13. The normalized serum PON1 activity in healthy men was the highest in subjects with the lowest HDL-cholesterol values63. In our study, the PON1/HDL-cholesterol ratio positively correlated with the male gender. However, serum PON1 activities were similar in subjects with and without studied cardiovascular diseases, independently on gender (Supplementary Table S6). Although our results indicate that serum PON1 activity attenuates atherogenic serum lipid patterns, circulating PON1 was not associated with already developed comorbidities related to atherosclerosis (CHD, MI, ICS).
Numerous factors influencing serum PON1 activity may mask its association with the genetic background or clinical and laboratory phenotypes. Erythropoietin, widely used in HD subjects, was shown to elevate PON1 activity in predialysis patients31. In HD patients, zinc supplementation32 or decaffeinated green tea extract (catechins)33 increased the activity of PON. Nandrolone decanoate decreased PON activity in HD patients34. Acrolein, both air pollution and cigarette smoke component36, inactivates PON137. The acrolein levels are usually low in outside air (0.20 ppb in urban air and 0.12 ppb in rural air). However, in large cities, acrolein pollution reaches 5.6 ppb.36. Thus, places of settlement (city, village), different in air pollution, may influence PON1. Age13,58, dialysis duration30,58,64, serum urea and creatinine30,58, vitamin C administration33,65, and body mass index57,66 yielded ambiguous results concerning their influence on PON1 activity. Lipid-modifying treatment12,16,29, advanced glycated end-products61, and C-reactive protein (CRP) level66 are also mentioned among possible modifiers of PON1 activity. An impact of secondary hyperparathyroidism on PON1 is also possible. Paraoxonases have two binding-calcium sites. One of two calcium atoms and a phosphate ion lie at the bottom of the PON1active-site cavity67. Calcium chelators inhibit PON1 (paraoxonase) activity. Complete removal of calcium led to irreversible inactivation of PON1 activity. Human serum PON1 requires calcium for enzymatic activity, and calcium is needed for maintaining PON structural stability35.
This study checked several factors mentioned above for association with serum PON1 activity and the PON1/HDL-cholesterol ratio. In HD patients, paraoxonase concentration was not associated with gender in multiple regression analysis13. Our study did not reveal a relationship between serum PON1 activity and gender, but such an association was demonstrated for normalized PON1 activity (the PON1/HDL-cholesterol ratio). Male gender and cigarette smoking, being traditional risk factors for CHD and MI68, were positively related to the higher PON1/HDL-cholesterol ratios. Unexpectedly, village settlement also appeared to be positively associated with the higher PON1/HDL-cholesterol ratio. Maybe unhealthy rural residents (HD patients) prefer living in indoor air that contains more acrolein than outdoor air (< 0.02 to 12 ppb but can be higher if residents smoke tobacco at home)36,69. On the other hand, positive correlations of the PON1/HDL-cholesterol ratio with village settlement as well as zinc supplementation could be related to their relatively higher positive influences, if any, on PON1 activity than on serum HDL-level. Correlations between these variables need further studies. In HD patients, the higher urine output represents better residual renal function and is generally connected with healthier cardiovascular status70,71. It is well established that the decreased kidney function is associated with reduced basal and stimulated PON1 activity72. Following this finding is the inverse association of the PON1/HDL-cholesterol ratio with urine output in the examined HD patients. Calcium-phosphorus parameters, disturbed in the examined HD patients according to serum levels of calcium, phosphorus, and parathyroid hormone, did not correlate with serum PON1 at the taken method of the significance validation.
Ikeda et al.14 have found that PON1 concentration (but not paraoxonase activity or PON1 rs662 and PON1 rs854560) was involved in cardiovascular mortality in HD patients. In the examined HD patients, the PON1 rs705379 TT genotype was associated with cardiovascular mortality, specifically with cardiac deaths and mortality due to CHD and its complications. PON1 rs705379 is the main contributor to serum PON1 variation, accounting for about 13% of the disparity in arylesterase activity73. In the study by Gupta et al.74, the PON1 rs705379 CT and TT genotypes corresponded in non-diabetics with the lower PON1 activity and CHD. However, this significance did not persist in multiple regression analysis. The TT genotype was also associated with low serum PON1 activity and an increased CHD risk in type 2 diabetic patients75. In the examined HD patients, associations between rs705379 and CHD were not demonstrated and did not explain cardiac deaths. The TT genotype of PON1 rs705379 independently correlated with type 2 diabetic nephropathy as a cause of end-stage renal disease76. This study shows that the TT rs705379 genotype and type 2 diabetic nephropathy are independent predictors of cardiovascular (and cardiac) mortality in HD patients. Maybe, attenuated antioxidant, anti-inflammatory, anti-apoptosis, anti-thrombosis, and anti-adhesion properties of PON12–4 are involved in overall cardiovascular mortality, not only in deaths due to CHD and its complications.
Our study indicates that PON1 SNVs correlate with HD patients' clinical parameters (dyslipidaemia, ICS, cardiovascular mortality). These data suggest that abnormalities resulting from long-term atherosclerotic disturbances, like ICS or cardiovascular deaths, are satisfactorily associated with PON1 SNVs in HD patients. Associations of non-normalized serum PON1 activity with simultaneously shown clinical variables were limited to mixed dyslipidaemia by K/DOQI guidelines and serum TG levels in unadjusted analyses. Several studies21,77–80 have demonstrated the usefulness of the PON1 status in the evaluation of clinical PON1 associations. The PON1 status includes simultaneous determination of paraoxonase and diazoxonase activities21,77–79 or PON1 activity and concentration80. Futurę studies incorporating the PON1 status are warranted in establishing PON1 relationships in end-stage renal disease patients treated with HD.
Our study shows multifaceted associations of PON1 with dyslipidaemia, ICS, and cardiovascular mortality in HD patients providing arguments for the consideration of PON1 as a therapeutic target in the prevention of atherosclerosis and its complications in uremic patients. At present, by implementing therapeutic lifestyle changes (aerobic exercises) and niacin, at least in men with metabolic syndrome, we can increase PON1 activity and PON1 concentration81. In the future, gene therapy may be a solution retaining multifunctional PON1 capacity.
Conclusions
In HD patients, there are associations of PON1 SNVs with the prevalence of atherogenic dyslipidaemia diagnosed by the TG/HDL-cholesterol ratio ≥ 3.8 (higher for low activity alleles of rs662 and rs854560), a frequency of ICS (higher for the rs854560 low activity allele), and cardiovascular mortality, specifically with cardiac deaths, as well as mortality due to CHD and its complications (higher in PON1 rs705379 low activity homozygotes).
The normalized serum PON1 activity (the PON1/HDL-cholesterol ratio) positively associate with atherogenic dyslipidaemia, male gender, and cigarette smoking, while a negative correlation occurs with urine output.
Correlations between the PON1/HDL-cholesterol ratio, living in the rural area, and zinc supplementation need further studies.
Multifaceted associations of PON1 with dyslipidaemia, ICS, and cardiovascular mortality provide arguments for the consideration of PON1 as a therapeutic target in the prevention of atherosclerosis and its complications in uremic patients.
Patients and methods
Patients
For PON1 SNVs genotyping, we used DNA samples of HD patients, which we collected from January 2009 to June 2019. As we planned to analyse serum lipid data, probes of patients showing secondary causes of dyslipidaemia (hypothyroidism, alcohol abuse, medication with anticonvulsants, corticosteroid therapy) and cachectic conditions causing decreases in serum lipids (neoplasms, enteropathies, liver cirrhosis), were a priori excluded. In total, we included 1407 patients. In all these subjects, we recorded demographic and clinical parameters, including dates of birth, the start of RRT, and death, gender, cause of end-stage renal disease, and cause of death, as appropriate. Concerning diabetes mellitus, we included only patients with type 2 diabetes as a cause of end-stage diabetic nephropathy. Evidence for dyslipidaemia, lipid-modifying therapy, CHD, including MI, and ICS was also gathered in all patients, if possible. To be enrolled in the dyslipidaemia study, patients had to possess serum lipid data obtained when they presented stable clinical status at least six weeks before serum lipid measurement and did not have the following exclusion criteria: blood or plasma transfusion as well as more significant surgery during three months preceding blood sampling for lipids. The demographic, clinical, and laboratory data and the mode of lipid-modifying therapy were taken at the time of blood collection for lipids. The patients’ treatment was provided by nephrologists in the dialysis centres and was not influenced by the study. CHD, MI, and ICS data we gathered using the entire available period of RRT.
Data were collected and identified by patients’ names and surnames except from results obtained in two dialysis facilities where the code system existed.
From the cohort mentioned above, we enrolled patients for testing PON1 activity. Therefore, these subjects fulfilled the enrolment criteria described for the entire HD population genotyped for PON1 SNVs. Blood samples for serum PON1 activity were collected in two collaborating dialysis centres for adult patients (≥ 18 years). In one centre, low-flux dialyzers were used; in another one—high flux dialyzers were applied. Patients were dialyzed in May–June 2019, three times a week. They were randomly selected from currently available stable patients who gave written consent (n = 93).
In patients tested for serum PON1 activity, we additionally recorded a place of settlement (city, village), a history of parathyroidectomy, actual dry body mass, ESA administration, treatment with cinacalcet hydrochloride and phosphate binders, cigarette smoking, zinc supplementation, green tea intake, vitamin C and D supplementation, and nandrolone decanoate usage. Blood samples for serum PON1 activity were collected in these 93 patients together with routine laboratory parameters, which included serum concentrations of lipids, urea, creatinine, haemoglobin, CRP, total Ca, P, intact parathyroid hormone, and activity of liver enzymes.
All study subjects were Caucasians.
We diagnosed dyslipidaemia according to the K/DOQI guidelines, which were elaborated taking into account the specificity of lipid abnormalities in chronic kidney disease subjects, including HD individuals39. Patients diagnosed as dyslipidaemic by serum LDL-cholesterol ≥ 100 mg/dL, we referred to as hyper-LDL-cholesterolaemic. Those showing non-HDL-cholesterol ≥ 130 mg/dL and TG ≥ 200 mg/dL were described as hyper-TG/hyper-non-HDL-cholesterolaemic. HD subjects showing dyslipidaemia by serum LDL cholesterol ≥ 100 mg/dL and simultaneously occurring non-HDL cholesterol ≥ 130 mg/dL and TG ≥ 200 mg/dL are referred to as having mixed dyslipidaemia82. The remaining patients were diagnosed as non-dyslipidaemic by K/DOQI criteria. We used the atherogenic index (the TG/HDL-cholesterol ratio) to interpret the atherogenic pattern of dyslipidaemia. The ratio of ≥ 3.8 was considered as indicating atherogenic dyslipidaemia because this ratio was reliable for identifying atherogenic LDL phenotype B in men and women38. HD subjects with the TG/HDL-cholesterol ratio < 3.8, we described as patients without atherogenic dyslipidaemia.
CHD was diagnosed based on medical history, electrocardiograms, exercise stress tests, and, in some cases, coronary angiography or computed tomography. From CHD patients, we selected subjects who underwent MI, diagnosed using medical history, characteristic electrocardiographic abnormalities, and elevated levels of cardiac markers of cardiomyocyte damage. Patients with ST-elevation MI and non-ST-elevation MI were included in this study. Type 1 MI83 was recognized in all of them. Clinical data and computed tomography were used for the determination of ICS.
Blood sampling
Blood probes for PON1 genotyping and serum PON1 activity were taken before a midweek dialysis session when HD patients had collected blood for routine periodical laboratory testing. Monovette tubes (SARSTEDT, Nümbrecht, Germany) were used for venous blood sampling. Tubes containing the EDTA anticoagulant were applied for DNA analyses and blood morphology. If serum was needed, blood samples were drawn to Monovette tubes allowing the blood clotting (no anticoagulant). PON1 activity, cholesterols, TG, creatinine, urea, CRP, albumin, calcium, phosphorus, alkaline phosphatase (ALP), and parathyroid hormone were determined in serum.
PON1 genotyping
DNA was extracted from blood lymphocytes by the salt-out extraction method. Coded DNA samples were stored at – 75 ° C and genotyped.
PON1 SNVs designated as rs662 (Q192R, 575A>G), rs854560 (L55M, 163A>T), and rs705379 (− 108C>T) were selected for genotyping.
PON1 rs662 was genotyped using a high-resolution melting curve analysis on the Light Cycler 480 system (Roche Diagnostics, Germany). Analysis of PON1 rs854560 and rs705379 was performed using predesigned TaqMan SNV Genotyping Assay according to the manufacturer’s instructions provided by Applied Biosystems (Applied Biosystems, Foster City, CA).
Serum PON1 activity
We determined circulating PON1 activity assessing catalytic efficiency for paraoxon hydrolysis (paraoxonase activity) with the use of a commercially available kit produced by Rel Assay Diagnostics, Mega Tıp (Gaziantep, Turkey, REF: RL0031, LOT: NN19064P), also applied by other investigators in clinical studies84,85. Two reagents are used in this kit: one contains a Tris buffer and Ca ion, the second—a stabile substrate solution. According to the manufacturer, the paraoxonase assay coefficient of validation (CV%) was 4.1 for high activity sera pool, 1.7—for medium activity sera pool, and 1.5—for low activity sera pool.
Other laboratory methods
Total cholesterol, HDL-cholesterol, and TG were measured using specific enzymatic colorimetric tests, creatinine—by kinetic colorimetric method, urea—by kinetic method, CRP—by immunoturbidimetric method, albumin—by the colorimetric method with bromocresol green, calcium—by photometric method with 5-nitro-5’-methyl-BAPTA and EDTA, inorganic phosphate—by spectrophotometric analysis based on the formation of phosphomolybdate, ALP—by the spectrophotometric method with p-nitrophenyl phosphate. Reagents from Roche Diagnostics GmbH (Mannheim, Germany) were applied in all mentioned above determinations. Measurements were performed on Cobas Integra 400 (Roche Diagnostics Ltd, Rotkreuz, Switzerland).
Parathyroid hormone was measured using the chemiluminescent microparticle immunoassay with the Alinity i Intact PTH Reagent Kit produced BIOKIT, S.A. (Barcelona, Spain) for Abbott GmbH & Co. KG (Wiesbaden, Germany). Blood morphology parameters were determined by flow cytometry (Sysmex, Kobe, Japan).
All methods shown above were routinely used.
Statistical analysis
To ensure adequate power (80%) for detection of associations between tested SNVs and dyslipidaemia by K/DOQI, atherogenic dyslipidaemia, CHD, MI, or ICS, an HD patients’ risk of these diseases was taken into the calculation of the desired sample size at different ORs (Supplementary Table S7). Allele frequencies for these calculations we obtained from gnomAD Exomes, European Non-Finnish.
We tested the distribution of continuous variables by the Shapiro–Wilk test. For the presentation of non-normally distributed variables, we used a median and range (minimum–maximum). Normally distributed continuous results are shown as a mean ± standard deviation. Categorical variables are presented as a percentage of the total number.
Departure from HWE was determined by Chi-squared analysis (df = 1, P ≥ 0.05 for accordance). Modes of inheritance were created concerning alleles known as associated with low PON1 activity or concentration as the risk alleles: A for rs662, T for rs854560, and T for rs70537986. To test PON1 SNVs for associations with categorical variables (types of dyslipidaemia, CHD, type 1 MI, and ICS) in the additive genetic model, we used the Cochran-Armitage test for trends87. As this model does not indicate a type of inheritance and may appear unpowered, especially when the suitable mode is recessive88, we additionally applied the dominant and recessive modes.
The Kruskal–Wallis and Mann–Whitney U tests were used for the comparison of continuous variables. Dichotomous variables were compared using Fisher's exact test. OR with 95% confidence interval (CI) and P-values were computed to show significance in the odds of tested genotype occurrence in the case group to the odds of this occurrence in the control group. Genetic associations, yielding the P < 0.05 indicating the fifth class association by the Better Associations for Disease and GEnes (BADGE) system89, were verified in the multiple regression analysis or logistic regression, as appropriate, comprising clinical variables (age, gender, diabetic nephropathy, and lipid-modifying treatment when tested variables were associated with serum lipid profile; age, diabetic nephropathy, sex, and RRT duration if the association with ICS was determined).
The linear regression was used to determine the associations among serum PON1 activity or the PON1/HDL-cholesterol ratio and patient characteristics. The obtained results were adjusted for traits associated with PON1 activity or the PON1/HDL-cholesterol ratio at a P-value < 0.1 in unadjusted analyses. Multiple regression was used for adjustment. Due to a relatively small number of subjects tested for serum PON1 activity, we have chosen five variables (gender, cigarette smoking, urine output, living in a rural area, and serum phosphorus), which could influence a relationship between PON1 activity and the examined phenotypes. In the regression analyses, there was no normality for all included data. However, the outstanding values did not exceed the 3 sigma limit in any case, so we used this statistical approach. The results are presented as the regression coefficient (β) ± standard error (SE).
Survival analyses included patients who died between the start of their RRT and October 21, 2019. We evaluated cardiovascular mortality and separately cardiac and vascular mortalities. Among cardiac mortality, CHD deaths and CHD complications (heart failure, MI, sudden death) were analysed. We also computed deaths separately due to ICS. For survival analysis, we applied the Kaplan-Meyer method with the log-rank test. Mortality was calculated between genotypes and using modes of inheritance. In the case of significance, the Cox proportional hazards model was performed. If the latter was also significant, we applied the Cox proportional hazards model that included age, gender, and diabetic nephropathy.
The previously mentioned statistical analyses were performed using Graph-Pad InStat 3.10, 32 bit for Windows, created July 9, 2009 (GraphPad Software, Inc., San Diego, California, United States) and Statistica version 13, 2017 (TIBCO Software Inc., 3307 Hillview Avenue Palo Alto, CA 94,304 USA).
Linkage disequilibrium (LD) between tested SNVs was estimated using the Haploview 4.2 software (http://www.broad.mit.edu/mpg/haploview/).
P < 0.05 were chosen as the statistically significant to facilitate decisions which data may be relevant for further analyses. Finally, only associations that yielded P < 0.05 also among clinical variables were discussed as significant.
Ethics approval and consent to participate
All patients or their parents, as appropriate, whose DNA samples were collected and are stored in the Department of Biochemistry and Molecular Biology, Poznan University of Medical Sciences, Poznań, Poland, gave a written consent informing that all their data and DNA samples may be anonymously used in the future studies concerning uremia without additional agreements. Informed consent we obtained from all study participants tested for serum PON1 activity. The Institutional Review Board of the Poznan University of Medical Sciences, Poland, approved the research design. The study conformed to the principles set out in the WMA Declaration of Helsinki and the Department of Health and Human Services Belmont Report.
Supplementary Information
Abbreviations
- ALP
Alkaline phosphatase
- CHD
Coronary heart disease
- CI
Confidence interval
- CRP
C-reactive protein
- CV
Coefficient of validation
- ESA
Erythropoietin-stimulating agent
- HD
Haemodialysis
- HDL
High-density lipoprotein
- HWE
Hardy–Weinberg equilibrium
- ICS
Ischemic cerebral stroke
- IL
Interleukin
- K/DOQI
Kidney Disease Outcomes Quality Initiative
- LD
Linkage disequilibrium
- LDL
Low-density lipoprotein
- LF-HD
Low-flux haemodialysis
- MAF
Minor (variant) allele frequency
- MI
Myocardial infarction
- NA
Not available in all patients
- OR
Odds ratio
- PON1
Paraoxonase 1
- PON1
Paraoxonase 1 gene
- RRT
Renal replacement therapy
- TG
Triglycerides
Author contributions
A.E.G. conceived the study, designed the research, was involved in the data and blood sample collection, analysed the data, was involved in the literature search, wrote the manuscript, and was involved in the fund collection. P.A. was involved in the data collection and the literature search. E.I.-S. performed analyses of serum PON1 activity. K.O. and W.M. were included in the data collection. L.N. was involved in the data and blood sample collection. A.M. was responsible for the genotyping. W.W. statistically analysed the data. C.Ż. was included in the fund collection. P.P.J. conceived the study and was involved in the fund collection. All authors edited and approved the final version of the manuscript.
Funding
This work was supported by the Poznan University of Medical Sciences, Poznań, Poland [Grant numbers 502-01-02225363-03679, 504-01-11281910-7/108-05934, and 502-01-01124182-07474]. The funder had no role in study design, data collection, data analysis, decision to publish, or manuscript preparation.
Data availability
The datasets analysed during the current study are available from the corresponding author on reasonable request.
Competing interests
The authors declare no competing interests.
Footnotes
Publisher's note
Springer Nature remains neutral with regard to jurisdictional claims in published maps and institutional affiliations.
Supplementary Information
The online version contains supplementary material available at 10.1038/s41598-021-86231-0.
References
- 1.Ginsberg G, et al. Genetic polymorphism in paraoxonase 1 (PON1): Population distribution of PON1 activity. J. Toxicol. Environ. Health B. 2009;12:473–507. doi: 10.1080/10937400903158409. [DOI] [PubMed] [Google Scholar]
- 2.Chistiakov DA, Melnichenko AA, Orekhov AN, Bobryshev YV. Paraoxonase and atherosclerosis-related cardiovascular diseases. Biochimie. 2017;132:19–27. doi: 10.1016/j.biochi.2016.10.010. [DOI] [PubMed] [Google Scholar]
- 3.Jaouad L, et al. Age-related decrease in high-density lipoproteins antioxidant activity is due to an alteration in the PON1's free sulfhydryl groups. Atherosclerosis. 2006;185:191–200. doi: 10.1016/j.atherosclerosis.2005.06.012. [DOI] [PubMed] [Google Scholar]
- 4.Aviram M, et al. Paraoxonase inhibits high-density lipoprotein oxidation and preserves its functions. A possible peroxidative role for paraoxonase. J. Clin. Invest. 1998;101:1581–1590. doi: 10.1172/JCI1649. [DOI] [PMC free article] [PubMed] [Google Scholar]
- 5.Jakubowski H. Protein homocysteinylation: possible mechanism underlying pathological consequences of elevated homocysteine levels. FASEB J. 1999;13:2277–2283. doi: 10.1096/fasebj.13.15.2277. [DOI] [PubMed] [Google Scholar]
- 6.Jakubowski H. Calcium-dependent human serum homocysteine thiolactone hydrolase. A protective mechanism against protein N-homocysteinylation. J. Biol. Chem. 2000;275:3957–3962. doi: 10.1074/jbc.275.6.3957. [DOI] [PubMed] [Google Scholar]
- 7.Gbandjaba NY, et al. Paraoxonase activity in healthy, diabetic, and hemodialysis patients. Clin. Biochem. 2012;45:470–474. doi: 10.1016/j.clinbiochem.2012.01.005. [DOI] [PubMed] [Google Scholar]
- 8.Locsey L, et al. Relationship between serum paraoxonase and homocysteine thiolactonase activity, adipokines, and asymmetric dimethyl arginine concentrations in renal transplant patients. Transplant. Proc. 2013;45:3685–3687. doi: 10.1016/j.transproceed.2013.10.003. [DOI] [PubMed] [Google Scholar]
- 9.Dantoine TF, et al. Decrease of serum paraoxonase activity in chronic renal failure. J. Am. Soc. Nephrol. 1998;9:2082–2088. doi: 10.1681/ASN.V9112082. [DOI] [PubMed] [Google Scholar]
- 10.Rajković MG, et al. Polymorphisms of pon1 and pon2 genes in hemodialyzed patients. Clin. Biochem. 2011;44:964–968. doi: 10.1016/j.clinbiochem.2011.05.012. [DOI] [PubMed] [Google Scholar]
- 11.Miljkovic M, et al. Activity of paraoxonase 1 (PON1) on HDL2 and HDL3 subclasses in renal disease. Clin. Biochem. 2018;60:52–58. doi: 10.1016/j.clinbiochem.2018.08.006. [DOI] [PubMed] [Google Scholar]
- 12.Samouilidou E, et al. Association of lipid profile with serum PON1 concentration in patients with chronic kidney disease. Ren. Fail. 2016;38:1601–1606. doi: 10.3109/0886022X.2016.1144031. [DOI] [PubMed] [Google Scholar]
- 13.Suehiro T, et al. Serum paraoxonase (PON1) concentration in patients undergoing hemodialysis. J. Atheroscler. Thromb. 2002;9:133–138. doi: 10.5551/jat.9.133. [DOI] [PubMed] [Google Scholar]
- 14.Ikeda Y, et al. Human serum paraoxonase concentration predicts cardiovascular mortality in hemodialysis patients. Clin. Nephrol. 2007;67:358–365. doi: 10.5414/CNP67358. [DOI] [PubMed] [Google Scholar]
- 15.Kotur-Stevuljević J, et al. Hyperlipidemia, oxidative stress, and intima media thickness in children with chronic kidney disease. Pediatr. Nephrol. 2013;28:295–303. doi: 10.1007/s00467-012-2323-5. [DOI] [PubMed] [Google Scholar]
- 16.Gouédard C, Koum-Besson N, Barouki R, Morel Y. Opposite regulation of the human paraoxonase-1 gene PON-1 by fenofibrate and statins. Mol. Pharmacol. 2003;63:945–956. doi: 10.1124/mol.63.4.945. [DOI] [PubMed] [Google Scholar]
- 17.Clendenning JB, et al. Structural organization of the human PON1 gene. Genomics. 1996;35:586–589. doi: 10.1006/geno.1996.0401. [DOI] [PubMed] [Google Scholar]
- 18.Davies HG, et al. The effect of the human serum paraoxonase polymorphism is reversed with diazoxon, soman and sarin. Nat. Genet. 1996;14:334–336. doi: 10.1038/ng1196-334. [DOI] [PubMed] [Google Scholar]
- 19.Li WF, et al. Catalytic efficiency determines the in-vivo efficacy of PON1 for detoxifying organophosphorus compounds. Pharmacogenetics. 2000;10:767–779. doi: 10.1097/00008571-200012000-00002. [DOI] [PubMed] [Google Scholar]
- 20.Can Demirdöğen B, et al. Paraoxonase/arylesterase ratio, PON1 192Q/R polymorphism and PON1 status are associated with increased risk of ischemic stroke. Clin. Biochem. 2008;41:1–9. doi: 10.1016/j.clinbiochem.2007.08.010. [DOI] [PubMed] [Google Scholar]
- 21.Furlong CE, et al. PON1 status of farmworker mothers and children as a predictor of organophosphate sensitivity. Pharmacogenet. Genomics. 2006;16:183–190. doi: 10.1097/01.fpc.0000189796.21770.d3. [DOI] [PubMed] [Google Scholar]
- 22.Nakanishi M, et al. The ratio of serum paraoxonase/arylesterase activity using an improved assay for arylesterase activity to discriminate PON1(R192) from PON1(Q192) J. Atheroscler. Thromb. 2003;10:337–342. doi: 10.5551/jat.10.337. [DOI] [PubMed] [Google Scholar]
- 23.Leviev I, Negro F, James RW. Two alleles of the human paraoxonase gene produce different amounts of mRNA. An explanation for differences in serum concentrations of paraoxonase associated with the (Leu-Met54) polymorphism. Arterioscler. Thromb. Vasc. Biol. 1997;17:2935–2939. doi: 10.1161/01.ATV.17.11.2935. [DOI] [PubMed] [Google Scholar]
- 24.Garin MC, et al. Paraoxonase polymorphism Met-Leu54 is associated with modified serum concentrations of the enzyme. A possible link between the paraoxonase gene and increased risk of cardiovascular disease in diabetes. J. Clin. Invest. 1997;99:62–66. doi: 10.1172/JCI119134. [DOI] [PMC free article] [PubMed] [Google Scholar]
- 25.Brophy VH, et al. Effects of 5' regulatory-region polymorphisms on paraoxonase-gene (PON1) expression. Am. J. Hum. Genet. 2001;68:1428–1436. doi: 10.1086/320600. [DOI] [PMC free article] [PubMed] [Google Scholar]
- 26.Feingold KR, Memon RA, Moser AH, Grunfeld C. Paraoxonase activity in the serum and hepatic mRNA levels decrease during the acute phase response. Atherosclerosis. 1998;139:307–315. doi: 10.1016/S0021-9150(98)00084-7. [DOI] [PubMed] [Google Scholar]
- 27.Van Lenten BJ, Wagner AC, Navab M, Fogelman AM. Oxidized phospholipids induce changes in hepatic paraoxonase and ApoJ but not monocyte chemoattractant protein-1 via interleukin-6. J. Biol. Chem. 2001;276:1923–1929. doi: 10.1074/jbc.M004074200. [DOI] [PubMed] [Google Scholar]
- 28.Kumon Y, Suehiro T, Ikeda Y, Hashimoto K. Human paraoxonase-1 gene expression by HepG2 cells is downregulated by interleukin-1beta and tumor necrosis factor-alpha, but is upregulated by interleukin-6. Life Sci. 2003;73:2807–2815. doi: 10.1016/S0024-3205(03)00704-5. [DOI] [PubMed] [Google Scholar]
- 29.Deakin S, Leviev I, Guernier S, James RW. Simvastatin modulates expression of the PON1 gene and increases serum paraoxonase: A role for sterol regulatory element-binding protein-2. Arterioscler. Thromb. Vasc. Biol. 2003;23:2083–2089. doi: 10.1161/01.ATV.0000096207.01487.36. [DOI] [PubMed] [Google Scholar]
- 30.Dirican M, Akca R, Sarandol E, Dilek K. Serum paraoxonase activity in uremic predialysis and hemodialysis patients. J. Nephrol. 2004;17:813–818. [PubMed] [Google Scholar]
- 31.Marsillach J, et al. Administration of exogenous erythropoietin beta affects lipid peroxidation and serum paraoxonase-1 activity and concentration in predialysis patients with chronic renal disease and anaemia. Clin. Exp. Pharmacol. Physiol. 2007;34:347–349. doi: 10.1111/j.1440-1681.2007.04552.x. [DOI] [PubMed] [Google Scholar]
- 32.Rahimi-Ardabili B, et al. Paraoxonase enzyme activity is enhanced by zinc supplementation in hemodialysis patients. Ren. Fail. 2012;34:1123–1128. doi: 10.3109/0886022X.2012.717479. [DOI] [PubMed] [Google Scholar]
- 33.Hsu SP, et al. Chronic green tea extract supplementation reduces hemodialysis-enhanced production of hydrogen peroxide and hypochlorous acid, atherosclerotic factors, and proinflammatory cytokines. Am. J. Clin. Nutr. 2007;86:1539–1547. doi: 10.1093/ajcn/86.5.1539. [DOI] [PubMed] [Google Scholar]
- 34.Ghorbanihaghjo A, Argani H, Rahbaninoubar M, Rashtchizadeh N. Effect of nandrolonedecanonate on paraoxonase activity in hemodialysis patients. Clin. Biochem. 2005;38:1076–1080. doi: 10.1016/j.clinbiochem.2005.08.006. [DOI] [PubMed] [Google Scholar]
- 35.Kuo CL, La Du BN. Calcium binding by human and rabbit serum paraoxonases. Structural stability and enzymatic activity. Drug Metab. Dispos. 1998;26:653–660. [PubMed] [Google Scholar]
- 36.Public Health Statement: Acrolein—ATSDR. https://www.atsdr.cdc.gov › phs › phs. https://www.atsdr.cdc.gov/ToxProfiles/tp124-c1-b.pdf. Accessed 16 Jan 2020 (2007).
- 37.Gugliucci A, et al. Acrolein inactivates paraoxonase 1: Changes in free acrolein levels after hemodialysis correlate with increases in paraoxonase 1 activity in chronic renal failure patients. Clin. Chim. Acta. 2007;384:105–112. doi: 10.1016/j.cca.2007.06.012. [DOI] [PubMed] [Google Scholar]
- 38.Hanak V, Munoz J, Teague J, Stanley A, Bittner V. Accuracy of the triglyceride to high-density lipoprotein cholesterol ratio for prediction of the low-density lipoprotein phenotype B. Am. J. Cardiol. 2004;94:219–222. doi: 10.1016/j.amjcard.2004.03.069. [DOI] [PubMed] [Google Scholar]
- 39.Kidney Disease Outcomes Quality Initiative (K/DOQI) Group K/DOQI clinical practice guidelines for managing dyslipidemia in chronic kidney disease. Am. J. Kidney Dis. 2003;41:1–237. doi: 10.1016/S0272-6386(03)70056-0. [DOI] [Google Scholar]
- 40.Pan L, et al. The prevalence, awareness, treatment and control of dyslipidemia among adults in China. Atherosclerosis. 2016;248:2–9. doi: 10.1016/j.atherosclerosis.2016.02.006. [DOI] [PubMed] [Google Scholar]
- 41.Sanchis-Gomar F, Perez-Quilis C, Leischik R, Lucia A. Epidemiology of coronary heart disease and acute coronary syndrome. Ann. Transl. Med. 2016;4:256. doi: 10.21037/atm.2016.06.33. [DOI] [PMC free article] [PubMed] [Google Scholar]
- 42.Roger VL, et al. Heart disease and stroke statistics–2012 update: A report from the American Heart Association. Circulation. 2012;125:e2–e220. doi: 10.1161/CIR.0b013e318245fac5. [DOI] [PMC free article] [PubMed] [Google Scholar]
- 43.Ribeiro S, et al. Main determinants of PON1 activity in hemodialysis patients. Am. J. Nephrol. 2012;36:317–323. doi: 10.1159/000342235. [DOI] [PubMed] [Google Scholar]
- 44.Regieli JJ, et al. Paraoxonase variants relate to 10-year risk in coronary artery disease: impact of a high-density lipoprotein-bound antioxidant in secondary prevention. J. Am. Coll. Cardiol. 2009;54:1238–1245. doi: 10.1016/j.jacc.2009.05.061. [DOI] [PubMed] [Google Scholar]
- 45.Bhattacharyya T, et al. Relationship of paraoxonase 1 (PON1) gene polymorphisms and functional activity with systemic oxidative stress and cardiovascular risk. JAMA. 2008;299:1265–1276. doi: 10.1001/jama.299.11.1265. [DOI] [PMC free article] [PubMed] [Google Scholar]
- 46.Hegele RA, Brunt JH, Connelly PW. A polymorphism of the paraoxonase gene associated with variation in plasma lipoproteins in a genetic isolate. Arterioscler. Thromb. Vasc. Biol. 1995;15:89–95. doi: 10.1161/01.ATV.15.1.89. [DOI] [PubMed] [Google Scholar]
- 47.Imai Y, et al. Evidence for association between paraoxonase gene polymorphisms and atherosclerotic diseases. Atherosclerosis. 2000;149:435–442. doi: 10.1016/S0021-9150(99)00340-8. [DOI] [PubMed] [Google Scholar]
- 48.Vaisi-Raygani A, et al. ParaoxonaseArg 192 allele is an independent risk factor for three-vessel stenosis of coronary artery disease. Mol. Biol. Rep. 2011;38:5421–5428. doi: 10.1007/s11033-011-0696-3. [DOI] [PubMed] [Google Scholar]
- 49.Durrington PN, Mackness B, Mackness MI. Paraoxonase and atherosclerosis. Arterioscler. Thromb. Vasc. Biol. 2001;21:473–480. doi: 10.1161/01.ATV.21.4.473. [DOI] [PubMed] [Google Scholar]
- 50.Ruiz J, et al. Gln-Arg192 polymorphism of paraoxonase and coronary heart disease in type 2 diabetes. Lancet. 1995;346:869–872. doi: 10.1016/S0140-6736(95)92709-3. [DOI] [PubMed] [Google Scholar]
- 51.Pfohl M, et al. Paraoxonase 192 Gln/Arg gene polymorphism, coronary artery disease, and myocardial infarction in type 2 diabetes. Diabetes. 1999;48:623–627. doi: 10.2337/diabetes.48.3.623. [DOI] [PubMed] [Google Scholar]
- 52.Gardemann A, et al. The paraoxonase Leu-Met54 and Gln-Arg191 gene polymorphisms are not associated with the risk of coronary heart disease. Atherosclerosis. 2000;152:421–431. doi: 10.1016/S0021-9150(99)00489-X. [DOI] [PubMed] [Google Scholar]
- 53.Zhang G, et al. Association between paraoxonase gene and stroke in the Han Chinese population. BMC Med. Genet. 2013;28:14–16. doi: 10.1186/1471-2350-14-16. [DOI] [PMC free article] [PubMed] [Google Scholar]
- 54.Baráth A, et al. Roles of paraoxonase and oxidative stress in adolescents with uraemic, essential or obesity-induced hypertension. Kidney Blood Press. Res. 2006;29:144–151. doi: 10.1159/000095124. [DOI] [PubMed] [Google Scholar]
- 55.Dronca M, Paşca SP, Nemeş B, Vlase L, Vladutiu D. Serum paraoxonase 1 activities and homocysteinemia in hemodialysis patients. Clin. Chem. Lab. Med. 2008;46:880–881. doi: 10.1515/CCLM.2008.164. [DOI] [PubMed] [Google Scholar]
- 56.Gugliucci A, Schulze J, Kinugasa E, Ogata H, Kimura S. The free fraction of paraoxonase 1 is not increased in patients with end stage renal disease undergoing hemodialysis. Clin. Chim. Acta. 2009;402:209–210. doi: 10.1016/j.cca.2008.12.023. [DOI] [PubMed] [Google Scholar]
- 57.Varga Z, et al. Hyperleptinemia is not responsible for decreased paraoxonase activity in hemodialysis patients. Nephron. Clin. Pract. 2006;103:c114–120. doi: 10.1159/000092020. [DOI] [PubMed] [Google Scholar]
- 58.Itahara T, et al. Serum paraoxonase and arylesterase activities in hemodialysis patients. J. Atheroscler. Thromb. 2000;7:152–158. doi: 10.5551/jat1994.7.152. [DOI] [PubMed] [Google Scholar]
- 59.Zhang B, et al. Paraoxonase (Pon1) Q192R polymorphism and serum Pon1 activity in diabetic patients on maintenance hemodialysis. Clin. Nephrol. 2003;60:257–265. doi: 10.5414/CNP60257. [DOI] [PubMed] [Google Scholar]
- 60.Abdallah E, El-Shishtawy S, Sherif N, Ali A, El-Bendary O. Assessment of the relationship between serum paraoxonase activity and epicardial adipose tissue in hemodialysis patients. Int. Urol. Nephrol. 2017;49:329–335. doi: 10.1007/s11255-016-1465-y. [DOI] [PubMed] [Google Scholar]
- 61.Gugliucci A, et al. Paraoxonase-1 concentrations in end-stage renal disease patients increase after hemodialysis: correlation with low molecular AGE adduct clearance. Clin. Chim. Acta. 2007;377:213–220. doi: 10.1016/j.cca.2006.09.028. [DOI] [PubMed] [Google Scholar]
- 62.Dirican M, Sarandol E, Serdar Z, Ocak N, Dilek K. Oxidative status and prevalent cardiovascular disease in patients with chronic renal failure treated by hemodialysis. Clin. Nephrol. 2007;68:144–150. doi: 10.5414/CNP68144. [DOI] [PubMed] [Google Scholar]
- 63.Razavi AE, Ani M, Pourfarzam M, Naderi GA. Associations between high density lipoprotein mean particle size and serum paraoxonase-1 activity. Res. Med. Sci. 2012;17:1020–1026. [PMC free article] [PubMed] [Google Scholar]
- 64.Henning BF, Holzhausen H, Tepel M. Continuous reduction of plasma paraoxonase activity with increasing dialysis vintage in hemodialysis patients. Ther. Apher. Dial. 2010;14:572–576. doi: 10.1111/j.1744-9987.2010.00844.x. [DOI] [PubMed] [Google Scholar]
- 65.Ferretti G, Bacchetti T, Masciangelo S, Pallotta G. Lipid peroxidation in hemodialysis patients: Effect of vitamin C supplementation. Clin. Biochem. 2008;41:381–386. doi: 10.1016/j.clinbiochem.2007.12.011. [DOI] [PubMed] [Google Scholar]
- 66.Sztanek F, et al. Effect of nutritional status on human paraoxonase-1 activity in patients with chronic kidney disease. Kidney Blood Press. Res. 2012;36:310–319. doi: 10.1159/000343383. [DOI] [PubMed] [Google Scholar]
- 67.Harel M, et al. 3-D structure of serum paraoxonase 1 sheds light on its activity, stability, solubility and crystallizability. Arh. Hig. Rada Toksikol. 2007;58:347–353. doi: 10.2478/v10004-007-0028-0. [DOI] [PubMed] [Google Scholar]
- 68.Vlagopoulos PT, Sarnak MJ. Traditional and nontraditional cardiovascular risk factors in chronic kidney disease. Med. Clin. NorthAm. 2005;89:587–611. doi: 10.1016/j.mcna.2004.11.003. [DOI] [PubMed] [Google Scholar]
- 69.Seaman VY, Bennett DH, Cahill TM. Origin, occurrence, and source emission rate of acrolein in residential indoor air. Environ. Sci. Technol. 2007;41:6940–6946. doi: 10.1021/es0707299. [DOI] [PubMed] [Google Scholar]
- 70.Mathew AT, Fishbane S, Obi Y, Kalantar-Zadeh K. Preservation of residual kidney function in hemodialysis patients: Reviving an old concept for contemporary practice. Kidney Int. 2016;90:26271. doi: 10.1016/j.kint.2016.02.037. [DOI] [PMC free article] [PubMed] [Google Scholar]
- 71.Shafi T, et al. Association of residual urine output with mortality, quality of life, and inflammation in incident hemodialysis patients: The CHOICE (Choices for Healthy Outcomes in Caring for End-Stage Renal Disease) Study. Am. J. Kidney Dis. 2010;56:348–358. doi: 10.1053/j.ajkd.2010.03.020. [DOI] [PMC free article] [PubMed] [Google Scholar]
- 72.Saeed SA, Elsharkawy M, Elsaeed K, Fooda O. Paraoxonase-1 (PON1) activity as a risk factor for atherosclerosis in chronic renal failure patients. Hemodial. Int. 2008;12:471–479. doi: 10.1111/j.1542-4758.2008.00311.x. [DOI] [PubMed] [Google Scholar]
- 73.Kim DS, et al. Dietary cholesterol increases paraoxonase 1 enzyme activity. J. Lipid Res. 2012;53:2450–2458. doi: 10.1194/jlr.P030601. [DOI] [PMC free article] [PubMed] [Google Scholar]
- 74.Gupta N, Singh S, Maturu VN, Sharma YP, Gill KD. Paraoxonase 1 (PON1) polymorphisms, haplotypes and activity in predicting CAD risk in North-West Indian Punjabis. PLoS ONE. 2011;6:e17805. doi: 10.1371/journal.pone.0017805. [DOI] [PMC free article] [PubMed] [Google Scholar]
- 75.James RW, et al. Promoter Polymorphism T(−107)C of the paraoxonase PON1 gene is a risk factor for coronary heart disease in type 2 diabetic patients. Diabetes. 2000;49:1390–1393. doi: 10.2337/diabetes.49.8.1390. [DOI] [PubMed] [Google Scholar]
- 76.Grzegorzewska AE, et al. Paraoxonase 1 gene polymorphisms concerning non-insulin-dependent diabetes mellitus nephropathy in hemodialysis patients. J. Diabetes Complic. 2020;34:107687. doi: 10.1016/j.jdiacomp.2020.107687. [DOI] [PubMed] [Google Scholar]
- 77.Richter RJ, Furlong CE. Determination of paraoxonase (PON1) status requires more than genotyping. Pharmacogenetics. 1999;9:745–753. doi: 10.1097/00008571-199912000-00009. [DOI] [PubMed] [Google Scholar]
- 78.Jarvik GP, et al. Paraoxonase (PON1) phenotype is a better predictor of vascular disease than is PON1(192) or PON1(55) genotype. Arterioscler. Thromb. Vasc. Biol. 2000;20:2441–2447. doi: 10.1161/01.ATV.20.11.2441. [DOI] [PubMed] [Google Scholar]
- 79.Richter RJ, Jarvik GP, Furlong CE. Determination of paraoxonase 1 status without the use of toxic organophosphate substrates. Circ. Cardiovasc. Genet. 2008;1:147–152. doi: 10.1161/CIRCGENETICS.108.811638. [DOI] [PMC free article] [PubMed] [Google Scholar]
- 80.Mackness B, et al. Paraoxonase status in coronary heart disease: are activity and concentration more important than genotype? Arterioscler. Thromb. Vasc. Biol. 2001;21:1451–1457. doi: 10.1161/hq0901.094247. [DOI] [PubMed] [Google Scholar]
- 81.Taylor JK, et al. Paraoxonase responses to exercise and niacin therapy in men with metabolic syndrome. Redox Rep. 2015;20:42–48. doi: 10.1179/1351000214Y.0000000103. [DOI] [PMC free article] [PubMed] [Google Scholar]
- 82.Harper CR, Jacobson TA. Managing dyslipidemia in chronic kidney disease. J. Am. Coll. Cardiol. 2008;51:2375–2384. doi: 10.1016/j.jacc.2008.03.025. [DOI] [PubMed] [Google Scholar]
- 83.Gupta S, Vaidya SR, Arora S, Bahekar A, Devarapally SR. Type 2 versus type 1 myocardial infarction: a comparison of clinical characteristics and outcomes with a meta-analysis of observational studies. Cardiovasc. Diagn. Ther. 2017;7:348–358. doi: 10.21037/cdt.2017.03.21. [DOI] [PMC free article] [PubMed] [Google Scholar]
- 84.Torun E, et al. Serum paraoxonase 1 activity and oxidative stress in pediatric patients with pulmonary tuberculosis. Med. Princ. Pract. 2014;23:426–431. doi: 10.1159/000363700. [DOI] [PMC free article] [PubMed] [Google Scholar]
- 85.Yılmaz A, et al. Protective effects of caffeic acid phenethyl ester on fluoxetine-induced hepatotoxicity: An experimental study. Biomed. Res. Int. 2016;2016:1247191. doi: 10.1155/2016/1247191. [DOI] [PMC free article] [PubMed] [Google Scholar]
- 86.Zhao F, Song M, Wang Y, Wang W. Genetic model. J. Mol. Mol. Med. 2016;20:765. doi: 10.1111/jcmm.12751. [DOI] [PMC free article] [PubMed] [Google Scholar]
- 87.Lewis CM. Genetic association studies: Design, analysis and interpretation. Brief. Bioinform. 2002;3:146–153. doi: 10.1093/bib/3.2.146. [DOI] [PubMed] [Google Scholar]
- 88.Bae H, Perls T, Steinberg M, Sebastiani P. Bayesian polynomial regression models to fit multiple genetic models for quantitative traits. Bayesian Anal. 2015;10:53–74. doi: 10.1214/14-BA880. [DOI] [PMC free article] [PubMed] [Google Scholar]
- 89.Manly KF. Reliability of statistical associations between genes and disease. Immunogenetics. 2005;57:549–558. doi: 10.1007/s00251-005-0025-x. [DOI] [PubMed] [Google Scholar]
Associated Data
This section collects any data citations, data availability statements, or supplementary materials included in this article.
Supplementary Materials
Data Availability Statement
The datasets analysed during the current study are available from the corresponding author on reasonable request.