Abstract
Although acute respiratory infections are a leading cause of mortality in sub-Saharan Africa, surveillance of diseases such as influenza is mostly neglected. Evaluating the usefulness of influenza-like illness (ILI) surveillance systems and developing approaches for forecasting future trends is important for pandemic preparedness. We applied and compared a range of robust statistical and machine learning models including random forest (RF) regression, support vector machines (SVM) regression, multivariable linear regression and ARIMA models to forecast 2012 to 2018 trends of reported ILI cases in Cameroon, using Google searches for influenza symptoms, treatments, natural or traditional remedies as well as, infectious diseases with a high burden (i.e., AIDS, malaria, tuberculosis). The R2 and RMSE (Root Mean Squared Error) were statistically similar across most of the methods, however, RF and SVM had the highest average R2 (0.78 and 0.88, respectively) for predicting ILI per 100,000 persons at the country level. This study demonstrates the need for developing contextualized approaches when using digital data for disease surveillance and the usefulness of search data for monitoring ILI in sub-Saharan African countries.
Subject terms: Infectious diseases, Computational science
Introduction
Influenza and other respiratory tract infections remain a global public health issue in spite of vaccine availability1. Every year, there are about 650,000 deaths globally and three to five million respiratory illnesses due to the influenza virus2. In Africa, acute respiratory infections are thought to be a major cause of morbidity and mortality3,4, despite considerable under-reporting and sparsity of precise assessments of the total health and economic burden across the continent3,5.
The 2009 influenza pandemic reinforced the necessity for developing robust influenza surveillance systems globally6. Studies published right after the pandemic noted that many countries in Africa were not equipped with sufficient data on the epidemiology and risk factors of influenza to put in place the necessary approaches for influenza prevention and control7,8. This gap in global early-detection and response measures has motivated extensive research towards improving influenza surveillance using both traditional and non-traditional data streams9–19, as well as the development of a global standard for influenza surveillance by the World Health Organization (WHO)20. Though influenza surveillance data from Africa has improved in recent years, data quality is still lagging behind those implemented in other regions of the world. This lagging is mainly due to limited capacity for laboratory confirmation of influenza diagnoses and timely reporting of virological and epidemiological data. From a global perspective, understanding influenza dynamics in the tropics is important for pandemic planning and response since poor surveillance capabilities can delay the detection of novel viruses7,21. Although more than a billion people are living in tropical regions, there are no sufficient data on influenza-related mortality and morbidity21.
Digital epidemiology has enabled the use of non-traditional data sources (e.g., social media, Internet search queries) to monitor the spread of influenza-like illness (ILI)9,10,16,22–25. However, to our knowledge, no studies have focused on applying digital epidemiology to ILI surveillance in a sub-Saharan African country using data collected by a national surveillance system. Here, we seek to demonstrate that the adoption of digital data for public health surveillance in African countries requires a contextualized approach26,27. For example, cultural and societal practices unique to the sub-Saharan African context demands a rethinking of what search terms should be included in models used for surveillance. An individual with influenza-like symptoms might search for terms such as, “cold” or “catarrh”, but might also search for traditional or natural remedies and diseases such as HIV, TB and malaria, which have a high burden across sub-Saharan Africa and are well-known.
In this paper we aim to model and nowcast (hereafter referred to as, forecast) ILI in Cameroon using data from a surveillance system for influenza and ILI implemented by the Ministry of Health (MOH) in Cameroon28. Recent studies on influenza and ILI surveillance in Cameroon have focused on viral identification29, understanding genetic diversity30,31, and seasonality of circulating viruses32. Here, we focus on providing a framework for forecasting future trends, which could be invaluable for public health planning and response. Specifically, we considered a range of robust regression modeling approaches that have been previously used for forecasting influenza trends11,12,33: random forest regression, support vector regression, multivariable linear regression and ARIMA models. We fitted the models to six years of weekly reported ILI cases and google search data and used one year of data, not used for model fitting, for model cross-validation and comparison. The modeling approaches with the best fit were then used in one-week ahead forecasting.
Results
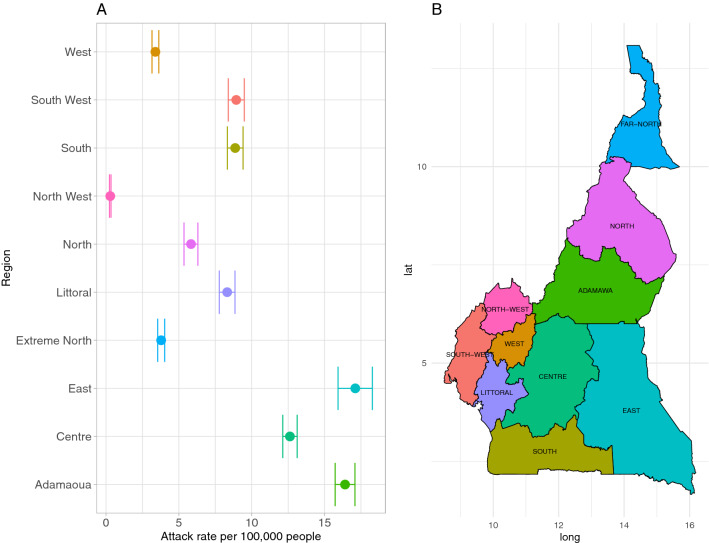
The weekly number of reported ILI cases and attack rate per 100,000 people from 2012 to 2018, collected by the Cameroon sentinel surveillance system, were obtained from the Ministry of Health (Fig. 1A). The number of reported ILI cases varied across the ten regions in Cameroon. The neighboring East and Adamaoua regions (Fig. 1B) had the highest number of reported cases; 17.1 (95% CI, 15.9–18.3) and 16.4 (95% CI, 15.7–17.1) reports per 100,000 people, respectively. The major economic regions, Littoral and Centre regions which had the most consistent reporting, had different attack rates: 8.3 (95% CI, 7.8–8.9) and 12.6 (95% CI, 12.1–13.1), respectively. There were no distinct regional groupings in reporting patterns.
Figure 1.
Distribution of ILI reports across the timespan of the study. (A) Attack Rate per 100,000 people (mean and 95% confidence interval) for each of the ten regions. (B) Map of Cameroon with regions for reference. The map was created in R version 4.0.2.
Out-of-sample predictions
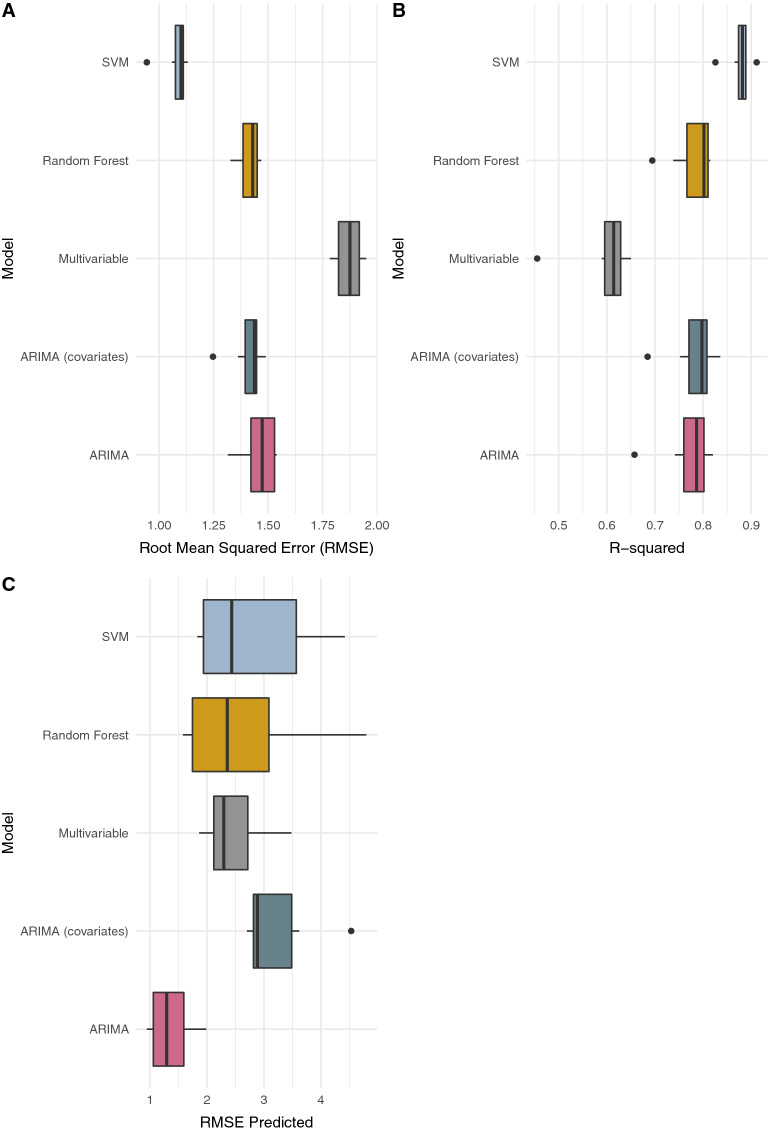
Out-of-sample predictions are predictions made by a model on data not used for model fitting. It is a cross-validation approach whereby at each modeling step, data excluded from model fitting are used in the model validation (comparing out-of-sample model predictions to data). We estimated the rate of ILI per 100,000 individuals using the following models: random forest regression (RF), support vector regression (SVM), multivariable linear regression and autoregressive integrated moving average (ARIMA) models. The Google search data were used as explanatory variables in all models except one set of ARIMA models, which were used as ‘baseline’ models to compare the model performance with and without Google search data. We used a leave-one-year-out approach (described in the “Methods”) to assess the usefulness of our approach for long term forecasting. Out-of-sample predictions based on the leave-1-year-out approach produced varying results across the regions. At the national level, search terms (SI Table 1) that had correlations of 0.3 or greater with ILI were used as explanatory variables in the models. These included, catarrh, pain, douleur (pain), transpire (sweat), gingembre (ginger), miel (honey), tea, malaria, paludisme (malaria), TB, AIDS, and HIV. SVM had the lowest mean RMSE and the highest mean R2—1.078 and 0.877, respectively (Fig. 2A,B). RF had a mean RMSE of 1.41 and R2 of 0.781. The ARIMA model that did not include the search terms as explanatory variables had comparable RMSE and R2 to Random Forest and the ARIMA model with explanatory variables. The R2 for SVM was statistically significantly different when compared to the multivariable and ARIMA models using the Nemenyi multiple comparison test at the 0.05 significance level. However, the RMSE for SVM was not statistically different when compared to the ARIMA model with covariates and the out-of-sample RMSE was only significantly different between SVM and the ARIMA model without covariates, and between the ARIMA models. Furthermore, the corresponding RMSE range for out-of-sample predictions using SVM was wider when compared to the other models (Fig. 2C); suggesting that SVM might not perform well in long range forecasts.
Figure 2.
Comparison of models at the national level. (A) Root Mean Squared Error (RMSE) of fitted values, (B) model R-squared and (C) RMSE of out-of-sample predictions. The models are Support Vector Machines Regression (SVM), Random Forest Regression, Multivariable linear regression, and ARIMA with [i.e., ARIMA (covariates)] and without (i.e., ARIMA) search data as explanatory variables.
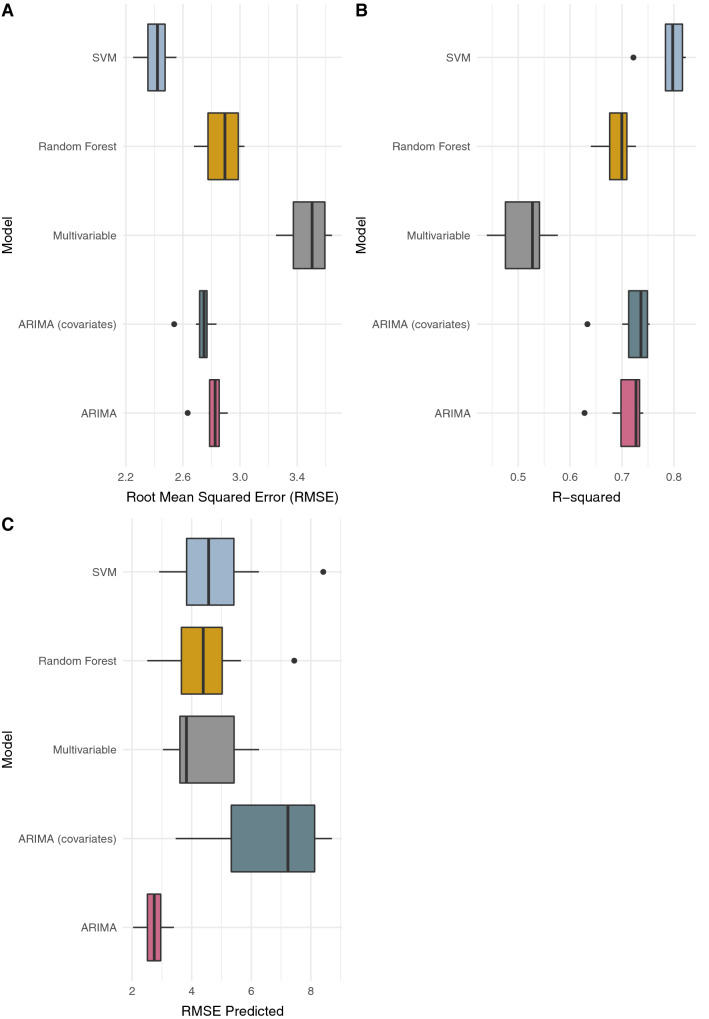
The regional models for Littoral performed similarly to the national models. The mean RMSE for SVM and RF were 2.412 and 2.876, respectively (Fig. 3A). While the corresponding average R2 were 0.791 and 0.691 (Fig. 3B). The mean R2 for the ARIMA models were 0.720 and 0.708 for the models with and without the Google search data, respectively. The respective mean RMSE were also in a similar range—2.73, and 2.80. The mean out-of-sample RMSE (Fig. 3C) was lower for the ARIMA model, and the ranges for models with search terms as explanatory variables were broader. The R2 and RMSE for SVM were slightly better than RF (p = 0.0115) and significantly better than multivariable regression (p < 0.005). However, the out-of-sample RMSE was not statistically significantly different. The search terms included in all the models were rhume (cold), cough, douleur (pain), aloe vera, citron (lemon), gingembre (ginger), miel (honey), malaria, TB, AIDS and HIV.
Figure 3.
Comparison of models fitted to data for the Littoral region. (A) Root Mean Squared Error (RMSE) of fitted values, (B) model R-squared and (C) RMSE of out-of-sample predictions. The models include Support Vector Machines Regression (SVM), Random Forest Regression, Multivariable linear regression, and ARIMA with [i.e., ARIMA (covariates)] and without (i.e., ARIMA) search data as explanatory variables.
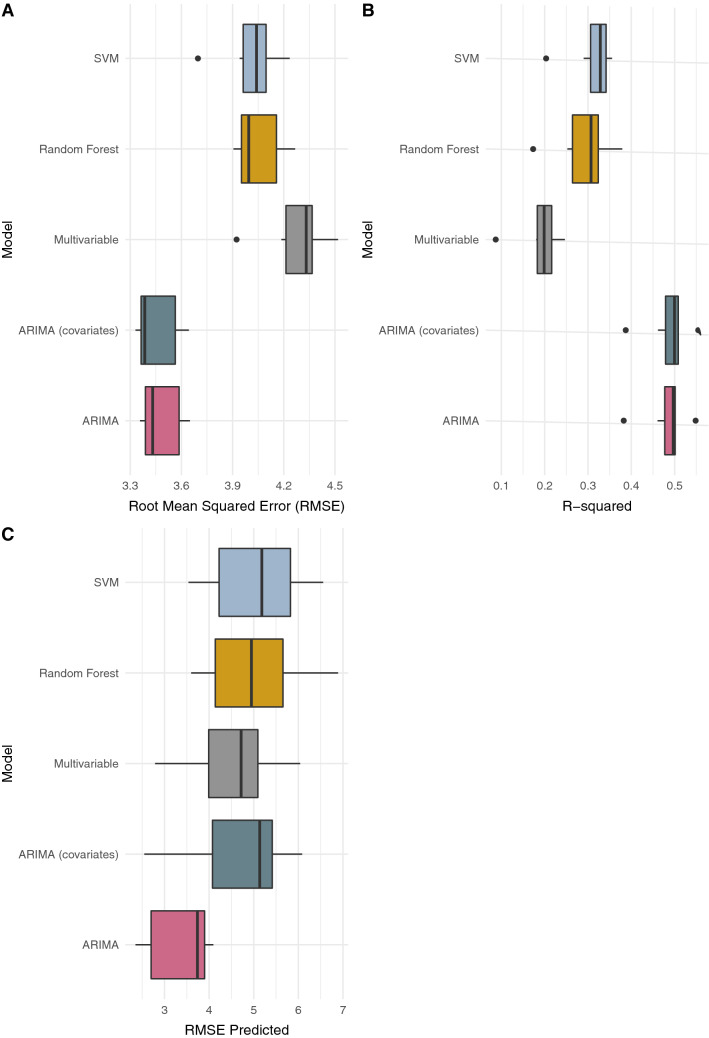
In contrast to the Littoral and national models, only three search terms were included in models for the Centre region; gingembre (ginger), lemon and AIDS. The data was noisier, the RMSE was higher for all models (Fig. 4A) and the highest variance explained was 55.5%; much lower compared to the national and Littoral models (Fig. 4B). The autoregressive models performed similarly, while the multivariable linear regression models had the poorest goodness of fit (mean R2 = 0.190) (Fig. 4C). The R2 for the ARIMA models were statistically significantly better than the multivariable model. The RMSE for the ARIMA models were also statistically better than the other model and out-of-sample RMSE was statistically better than that for RF and SVM.
Figure 4.
Comparison of models fitted to data for the Centre region. (A) Root Mean Squared Error (RMSE) of fitted values, (B) model R-squared and (C) RMSE of out-of-sample predictions. The models are Support Vector Machines Regression (SVM), Random Forest Regression, Multivariable linear regression, and ARIMA with [i.e., ARIMA (covariates)] and without (i.e., ARIMA) search data as explanatory variables.
These differences across the three regions show variability in data quality and highlight the need for regional models that capture underlying trends in reporting.
One-week-ahead forecasts
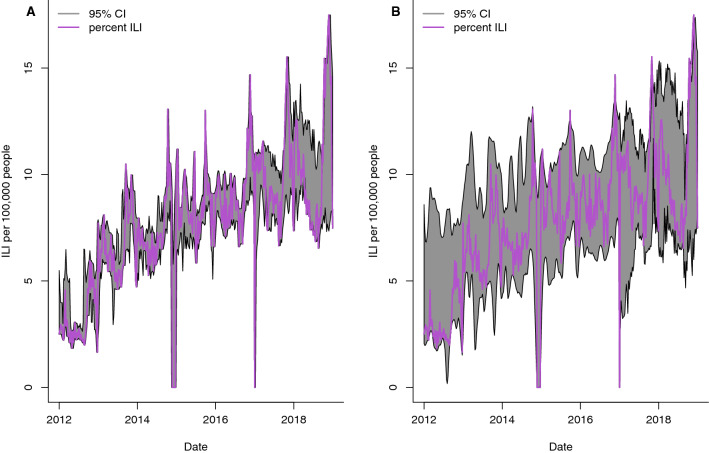
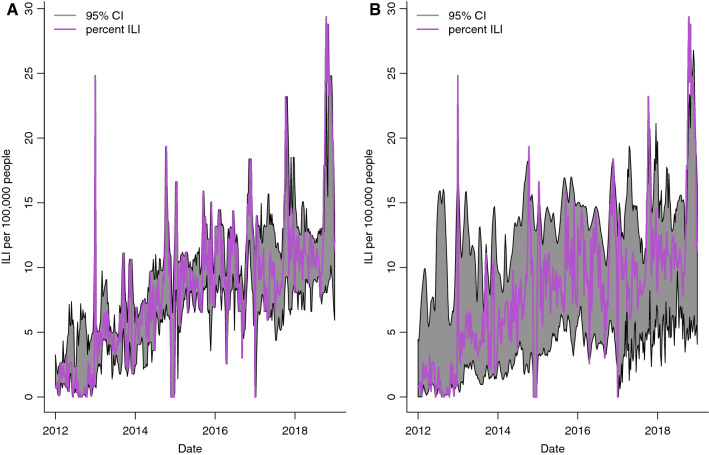
The same models used in out-of-sample predictions were also evaluated for one-week ahead forecasts of the rate of ILI per 100,000 individuals. The Google search data were also used as explanatory variables in all models except the baseline model. The correlation between the national rate of ILI per 100,000 individuals and forecasted values were 72.9% and 66.8% using the SVM and Random Forest models, respectively (Fig. 5). The search terms by order of importance in the Random Forest model were as follows: AIDS, catarrh, HIV, paludisme, gingembre, tea, miel (honey), malaria, transpire (sweat), douleur (pain), TB, and pain. Similar results were obtained for the Littoral region, where the correlation between the predicted ILI values and the reported rate of ILI per 100,000 individuals was 80.9% and 60.29% for SVM and Random Forest, respectively (Fig. 6). While the point estimates using the SVM model were more aligned with the reported ILI values, the confidence intervals for Random Forest were more robust. Furthermore, the ARIMA models also had similar performance as the SVM and Random Forest models for both the national (62.4% and 58.9%) and Littoral (71.1% and 71.1%) regions, however, the confidence intervals were not robust. In contrast, the best forecast for the Centre region was based on the ARIMA model using solely ILI data. The correlation between the forecasted values and the ILI data was 44.6%.
Figure 5.
95% Confidence Intervals (CI) for 1-week-ahead predictions of rate of ILI per 100,000 inhabitants at the national level. Models were fit using five years of data; week 1 to 261. Forecasts for the next week, t + 1, were made at week, t. Estimates using (A) Random Forest Regression and (B) Support Vector Machine Regression (SVM) are presented.
Figure 6.
95% Confidence Intervals (CI) for 1-week-ahead predictions of the rate of ILI per 100,000 inhabitants the Littoral region. Models were fit using 5 years of data; week 1 to 261. Forecasts for the next week, t + 1, were made at week, t. Estimates using (A) Random Forest Regression and (B) Support Vector Machine Regression (SVM) are presented.
Discussion
Influenza causes considerable disease burden in tropical and subtropical regions. However, despite its global significance, influenza surveillance systems in sub-Saharan Africa are lagging behind those in other regions of the world. National surveillance systems can fill in this gap in monitoring influenza-like illnesses, including emerging viruses, if the systems are well-designed, maintained and regularly evaluated. However, as noted across several countries including the United States, ILI reports from official sources such as, the Centers for Disease Control and Prevention (CDC) can be delayed9,34. Digital data sources can be used to supplement data from official sources.
In this study, we have shown that health information seeking trends on the Internet could be accurate predictors of disease trend in sub-Saharan African countries. Our results highlight two important public health opportunities for sub-Saharan Africa. First, health information seeking trends on the Internet are useful for monitoring health information needs in sub-Saharan African countries27. So, as mobile phone and Internet usage increases across the continent, data produced using these technologies can provide a supplementary approach for monitoring disease trends. However, the local context is important in both research and interpretation of findings. Search terms commonly associated with specific infectious diseases (such as, influenza or COVID-19) in western countries might not be associated with those diseases in sub-Saharan African countries35. For example: ginger, lemon, malaria, and AIDS were shown to be associated with ILI in Cameroon, where this is likely not ne the case in western countries. Second, our study also highlights a need for public health education about influenza and influenza-like illness in Cameroon. Africans, like people in other regions of the world, use the Internet for information seeking. Understanding how different Internet platforms are used can be useful for designing appropriate public health interventions, including disease prevention measures and education on the causes and treatment of diseases26,27,36.
Our findings suggest that search data related to influenza symptoms, treatments, natural or traditional remedies as well as infectious diseases with a high burden (i.e., AIDS, malaria, tuberculosis) in sub-Saharan countries could be useful for tracking ILI trends. Specifically, terms such as, cold, catarrh, and pain, and home remedies such as, tea, ginger and honey, were important predictors of ILI trends. Searches for AIDS and HIV might be due to HIV confirmed individuals searching if ILI symptoms are considered HIV symptoms. Studies have shown that individuals prefer using search engines to seek information on stigmatized topics37.
Also, our methods perform best in short-term forecasting, but also suggest some usability for long-term forecasting as demonstrated in the leave-1-year-out evaluation. Furthermore, ARIMA models using previous values of ILI to predict current values achieved reasonable accuracy suggesting that previously observed ILI trends can be used for predicting current and future trends. The machine learning regression methods, Random Forest and Support Vector Machines, performed similarly with some minor differences. The confidence intervals in the SVM model were more heavily influenced by variability in the search data and the ILI reports, when compared to the Random Forest estimates. Future studies will focus on developing ensemble approaches involving the consensus of multiple algorithms for real-time forecasting.
Syndromic and pre-diagnostic healthcare data (e.g., school absenteeism, pharmacy sales) in conjunction with statistical methods to monitor and characterize epidemics earlier than traditional public health systems and to provide situational awareness for ongoing outbreaks has been shown to be useful38,39. However, clear definitions of disease symptoms are important, especially when many diseases can cause influenza-like symptoms. To accomplish this, interventions including education on the causes and treatments of influenza-like disease are needed. These non-traditional methods can supplement traditional surveillance, however, the need for developing reliable surveillance systems remains. Additionally, consistent data collection procedures and case definition are necessary for evaluation of ILI surveillance systems. ILI cases are most likely severely underreported in Cameroon, and there is not sufficient information to adjust the data accordingly. To use these data and methods in reliable real-time weekly forecasting of ILI cases, these limitations in the data and collection systems need to be addressed.
Another challenge with forecasting ILI trends in subtropical and tropical regions is that seasonality is less defined; some regions experience semi-annual epidemics or annual influenza activity without a well-defined season while others have yearly epidemics that correspond with the rainy season17,40. Indoor crowding during the rainy season has been suggested as a possible driver of influenza epidemics in the tropics21,41. Moreover, a recent modeling study on Influenza seasonality in the tropics and subtropics showed that absolute humidity and temperature, respectively, have a bimodal and nonlinear effect on influenza transmission in Hong Kong,42 whereas previous modeling studies have shown that a unimodal effect of absolute humidity on transmission can accurately forecast the dynamics of seasonal influenza in temperate regions43,44. In the temperate regions of the world, influenza has marked seasonal patterns with increased rates during the winter months, followed by low activity during the warmer months45,46.
There are also limitations in the use of search data for disease surveillance. For instance, methods addressing spurious spikes in searches due to other factors such as, media coverage or reports of deaths, are needed47. This is especially relevant when developing approaches for monitoring emerging diseases such as the COVID-19, where media coverage and digital platforms have influenced the dissemination of information and population response.48 Search data is also not always representative of the entire population due to factors such as, variability in internet penetration, access and socioeconomic factors36,49. Furthermore, integrating these data with data from other digital sources can help to mitigate limitations inherent in each individual data source10.
Despite these limitations, these data have the potential to improve the timely detection of outbreaks and surges in unusual disease activity requiring further public health investigation. A lack of comprehensive health data in most sub-Saharan African countries is a major roadblock to disease control. The most effective approach to mitigating a potential pandemic is to stem disease emergence at its location of origin, the success of which depends on efficient disease surveillance systems. Addressing gaps in surveillance in sub-Saharan Africa should be a priority in our global preparedness and response strategies for influenza and other acute respiratory infections. Data from digital sources could support the development of up-to-date disease surveillance systems.
Methods
ILI data
The Cameroon sentinel surveillance system aims to detect the current type of influenza viruses and involves 22 health facilities across the country. The system also involves influenza-like illness surveillance based on symptom definition and is designed for early warning detections of surges. ILI was defined as sudden onset of fever (temperature > 38 °C) and cough or sore throat, with the onset of symptoms within the five days before presentation at a health facility based on the WHO’s Integrated Disease Surveillance and Response (IDSR)50. The Cameroon sentinel surveillance system provided a weekly number of cases reported each week to the Cameroon Ministry of Health (MOH) in Yaoundé from January 2012 to December 2018.
Google Search Data
We obtained the weekly volume of Google searches for 65 terms (see SI Table 1) in both French and English from the Google API at the national level, and for the Centre and Littoral regions from January 2012 to December 2018. Data was sparser for the other regions. The Google search terms consisted of ILI symptoms, home remedies typically used in Cameroon for colds, and inquiries for malaria, HIV/AIDs, and TB. We were particularly interested in home remedies because it captures a context-specific approach to managing ILI symptoms. Next, we excluded all search terms that had zero variance or had a Pearson correlation of less than 0.3, with weekly ILI reports from our data so we could focus our analysis on the most relevant terms. This resulted in three, eleven and twelve terms separately for the Centre region, Littoral region and the whole country. The Google search data represents aggregated anonymized queries that are normalized based on the geographical location and time. The searches are divided by the total volume of searches for that region and specific time range51. This suggests that zeroes in the data might not necessarily represent zero searches in a particular time period.
Statistical analysis
We used statistical and machine learning to models to nowcast ILI trends in Cameroon using weekly reported ILI cases and google search data from January 2012 to December 2018. To assess the potential usefulness of our approach for public health decision making in Cameroon, we performed two sets of analysis. First, we used a cross-validation approach whereby at each modeling step, one year of data is excluded from the fitting and used in the model validation. Since there were seven years of data, this implies seven different models were fitted. Next, the best modeling approach based on the model R2 and the root mean squared error (RMSE) were used in one-week ahead forecasting. This allows for forecasting the current reported rate of ILI per 100,000 inhabitants. Because Google search data were sparse for most regions of the country, the analyses were performed only for the Centre and Littoral regions, and the whole country.
We evaluated several multivariable regression models with the search data as explanatory variables and the ILI as the dependent variable. Regression models are traditional statistical models that are widely used to analyze quantitative data and make predictions about future values of the data. Here, we considered a range of robust regression modeling approaches that have been previously used for forecasting influenza trends11,12,33: random forest regression, support vector regression, multivariable linear regression and ARIMA models.
Random Forest is an ensemble of regression trees created by using bootstrap samples of the data and random feature selection in tree induction. To construct regression trees each node is split using the best split among a subset of predictors randomly chosen at that node. It is an extension of bagging—bootstrap aggregating—a method for combining several predictors to decrease the variance of the prediction function52–54. There are several advantages to random forests including, high accuracy, robustness to overfitting, and estimation of important variables54. These are useful for identifying which covariates are most significant in the model54. To address bias in Random Forest, we applied the linear model correction conceptually described in Zhang and Lu (2012)55.
Regression with Support Vector Machines (SVM) involves mapping the independent variables into a high-dimensional feature space using a linear or non-linear kernel function56. SVM regression with the linear kernel is akin to multivariate linear regression models. We used a radial kernel in SVM, since it fitted best to the data trend, and was selected using the tuning function in R57,58. The confidence intervals for SVM and RF were obtained using quantile SVM regression and quantile regression forests, respectively59.
ARIMA models are represented as ARIMA(p,d,q), where p denotes the autoregressive (AR) order, d the differencing order and q the moving average (MA) order. ARIMA models are widely used in time series forecasting. The model assumes that the time series is stationary60–62. The ARIMA models were implemented using the auto.arima function in the forecast package in R63 to select the model with the best fit based on the AIC and BIC at each time point . We used the Friedman test and Nemenyi multiple comparison test to compare the R2, and RMSE across the models at the 0.05 significance level64,65.
The ARIMA, random forest, SVM, and multivariable linear regression models involved fitting ILI to the Google search terms as explanatory variables. To capture the potential delay between the time when an individual with symptoms searches for information online, and when they visit a healthcare facility, we lagged some search terms for up to four weeks in the regression models based on prior examination of the cross correlations between the ILI data and search terms. We also applied LOESS (Local Polynomial Regression Fitting) smoothing to the search terms to capture the overall data trend, while reducing the noise introduced by weeks with zero searches. Similar approaches have been used in studies using digital data for disease modeling66,67. The LOESS parameter was set at 0.045.
Supplementary Information
Acknowledgements
We thank Hailun Wang and Reese Sy for their contributions to the project.
Author contributions
E.O.N. designed the study and analyzed the data. All authors interpreted the results. E.O.N., O.O. and M.L.M. wrote the manuscript. All authors edited the manuscript. ASAA provided data.
Funding
Elaine O. Nsoesie is supported by funding from the National Institutes of Health (Award Number K01ES025438). Martial L. Ndeffo-Mbah is supported by a faculty startup funding from Texas A&M University.
Competing interests
The authors declare no competing interests.
Footnotes
Publisher's note
Springer Nature remains neutral with regard to jurisdictional claims in published maps and institutional affiliations.
Supplementary Information
The online version contains supplementary material available at 10.1038/s41598-021-85987-9.
References
- 1.Fischer WA, 2nd, Gong M, Bhagwanjee S, Sevransky J. Global burden of influenza as a cause of cardiopulmonary morbidity and mortality. Glob. Heart. 2014;9:325–336. doi: 10.1016/j.gheart.2014.08.004. [DOI] [PMC free article] [PubMed] [Google Scholar]
- 2.World Health Organization (WHO). Influenza (Seasonal). https://www.who.int/news-room/fact-sheets/detail/influenza-(seasonal) (WHO, 2020).
- 3.Yazdanbakhsh M, Kremsner PG. Influenza in Africa. PLoS Med. 2009;6:e1000182. doi: 10.1371/journal.pmed.1000182. [DOI] [PMC free article] [PubMed] [Google Scholar]
- 4.Shek LP-C, Lee B-W. Epidemiology and seasonality of respiratory tract virus infections in the tropics. Paediatr. Respir. Rev. 2003;4:105–111. doi: 10.1016/S1526-0542(03)00024-1. [DOI] [PubMed] [Google Scholar]
- 5.Nair, H. et al. Global burden of respiratory infections due to seasonal influenza in young children: A systematic review and meta-analysis. Lancet378, 1917–1930 (2003). [DOI] [PubMed]
- 6.Fineberg HV. Pandemic preparedness and response—Lessons from the H1N1 influenza of 2009. N. Engl. J. Med. 2014;370:1335–1342. doi: 10.1056/NEJMra1208802. [DOI] [PubMed] [Google Scholar]
- 7.Katz, M. A. et al. Influenza in Africa: Uncovering the Epidemiology of a Long-Overlooked Disease. (Oxford University Press, 2012). [DOI] [PubMed]
- 8.Gessner BD, Shindo N, Briand S. Seasonal influenza epidemiology in sub-Saharan Africa: A systematic review. Lancet. Infect. Dis. 2011;11:223–235. doi: 10.1016/S1473-3099(11)70008-1. [DOI] [PubMed] [Google Scholar]
- 9.Nsoesie EO, Brownstein JS. Computational approaches to influenza surveillance: Beyond timeliness. Cell Host Microbe. 2015;17:275–278. doi: 10.1016/j.chom.2015.02.004. [DOI] [PMC free article] [PubMed] [Google Scholar]
- 10.Santillana M, et al. Combining search, social media, and traditional data sources to improve influenza surveillance. PLoS Comput. Biol. 2015;11:e1004513. doi: 10.1371/journal.pcbi.1004513. [DOI] [PMC free article] [PubMed] [Google Scholar]
- 11.Yuan Q, et al. Monitoring influenza epidemics in China with search query from Baidu. PLoS ONE. 2013;8:e64323. doi: 10.1371/journal.pone.0064323. [DOI] [PMC free article] [PubMed] [Google Scholar]
- 12.Nsoesie EO, Butler P, Ramakrishnan N, Mekaru SR, Brownstein JS. Monitoring disease trends using hospital traffic data from high resolution satellite imagery: A feasibility study. Sci. Rep. 2015;5:9112. doi: 10.1038/srep09112. [DOI] [PMC free article] [PubMed] [Google Scholar]
- 13.Althouse BM, et al. Enhancing disease surveillance with novel data streams: Challenges and opportunities. EPJ Data Sci. 2015;4:17. doi: 10.1140/epjds/s13688-015-0054-0. [DOI] [PMC free article] [PubMed] [Google Scholar]
- 14.Nsoesie EO, Brownstein JS, Ramakrishnan N, Marathe MV. A systematic review of studies on forecasting the dynamics of influenza outbreaks. Influenza Other Respir. Viruses. 2014;8:309–316. doi: 10.1111/irv.12226. [DOI] [PMC free article] [PubMed] [Google Scholar]
- 15.Nsoesie, E. O., Beckman, R., Marathe, M. & Lewis, B. Prediction of an epidemic curve: A supervised classification approach. Stat. Commun. Infect. Dis.3 (2011). [DOI] [PMC free article] [PubMed]
- 16.Biggerstaff M, et al. Results from the centers for disease control and prevention’s predict the 2013–2014 influenza season challenge. BMC Infect. Dis. 2016;16:357. doi: 10.1186/s12879-016-1669-x. [DOI] [PMC free article] [PubMed] [Google Scholar]
- 17.Shaman J, Karspeck A. Forecasting seasonal outbreaks of influenza. Proc. Natl. Acad. Sci. 2012;109:20425–20430. doi: 10.1073/pnas.1208772109. [DOI] [PMC free article] [PubMed] [Google Scholar]
- 18.Reich, N. G. et al. Accuracy of real-time multi-model ensemble forecasts for seasonal influenza in the U.S. PLoS Comput. Biol.15, e1007486–e1007486 (2019). [DOI] [PMC free article] [PubMed]
- 19.Gibson, G., Moran, K., Reich, N. & Osthus, D. Improving probabilistic infectious disease forecasting through coherence. bioRxiv (2019). [DOI] [PMC free article] [PubMed]
- 20.World Health Organization. WHO Global Technical Consultation: Global Standards and Tools for Influenza Surveillance. (2011).
- 21.Ng S, Gordon A. Influenza burden and transmission in the tropics. Curr. Epidemiol. Rep. 2015;2:89–100. doi: 10.1007/s40471-015-0038-4. [DOI] [PMC free article] [PubMed] [Google Scholar]
- 22.Brownstein JS, Freifeld CC, Madoff LC. Influenza A (H1N1) virus, 2009—Online monitoring. N. Engl. J. Med. 2009;360:2156–2156. doi: 10.1056/NEJMp0904012. [DOI] [PMC free article] [PubMed] [Google Scholar]
- 23.Salathé M, Freifeld CC, Mekaru SR, Tomasulo AF, Brownstein JS. Influenza A (H7N9) and the importance of digital epidemiology. N. Engl. J. Med. 2013;369:401–404. doi: 10.1056/NEJMp1307752. [DOI] [PMC free article] [PubMed] [Google Scholar]
- 24.Salathe M, et al. Digital epidemiology. PLoS Comput. Biol. 2012;8:e1002616. doi: 10.1371/journal.pcbi.1002616. [DOI] [PMC free article] [PubMed] [Google Scholar]
- 25.Culotta, A. Detecting Influenza Outbreaks By Analyzing Twitter Messages. arXiv preprint 1007.4748 (2010).
- 26.Nsoesie EO, Oladeji O, Sengeh MD. Digital platforms and non-communicable diseases in sub-Saharan Africa. Lancet Digit. Health. 2020;2:e158–e159. doi: 10.1016/S2589-7500(20)30028-5. [DOI] [PubMed] [Google Scholar]
- 27.Abebe, R., Hill, S., Vaughan, J. W., Small, P. M. & Schwartz, H. A. Using Search Queries to Understand Health Information Needs in Africa. CoRR abs/1806.05740 (2018).
- 28.Njouom R, et al. Circulation of human influenza viruses and emergence of Oseltamivir-resistant A(H1N1) viruses in Cameroon, Central Africa. BMC Infect. Dis. 2010;10:1–5. doi: 10.1186/1471-2334-10-56. [DOI] [PMC free article] [PubMed] [Google Scholar]
- 29.Njouom R, et al. Detection of influenza C virus infection among hospitalized patients, Cameroon. Emerg. Infect. Dis. 2019;25:607. doi: 10.3201/eid2503.181213. [DOI] [PMC free article] [PubMed] [Google Scholar]
- 30.Njifon HLM, et al. Genetic diversity of influenza A (H3N2) viruses in Northern Cameroon during the 2014–2016 influenza seasons. J. Med. Virol. 2019;91:1400–1407. doi: 10.1002/jmv.25456. [DOI] [PubMed] [Google Scholar]
- 31.Monamele, C. G. et al. Molecular characterization of influenza A (H1N1) pdm09 in Cameroon during the 2014–2016 influenza seasons. PloS One14 (2019). [DOI] [PMC free article] [PubMed]
- 32.Munshili Njifon, H. L. et al. Influence of meteorological parameters in the seasonality of influenza viruses circulating in Northern Cameroon. Influenza Respir. Viruses13, 158–165 (2019). [DOI] [PMC free article] [PubMed]
- 33.Santillana M, Nsoesie EO, Mekaru SR, Scales D, Brownstein JS. Using clinicians’ search query data to monitor influenza epidemics. Clin. Infect. Dis. 2014 doi: 10.1093/cid/ciu647. [DOI] [PMC free article] [PubMed] [Google Scholar]
- 34.Santillana M, Zhang DW, Althouse BM, Ayers JW. What can digital disease detection learn from (an external revision to) Google flu trends? Am. J. Prev. Med. 2014;14:S0749–3797. doi: 10.1016/j.amepre.2014.05.020. [DOI] [PubMed] [Google Scholar]
- 35.Nsoesie, E. O., Sy, K. T. L., Oladeji, O., Sefala, R. & Nichols, B. E. Nowcasting and forecasting provincial-level SARS-CoV-2 case positivity using google search data in South Africa. medRxiv 2020.11.04.20226092, 10.1101/2020.11.04.20226092 (2020).
- 36.Nsoesie, E. O. et al. Social media as a sentinel for disease surveillance: What does sociodemographic status have to do with it? PLOS Curr. Outbreaks (2016). [DOI] [PMC free article] [PubMed]
- 37.De Choudhury, M., Morris, M. R. & White, R. W. Seeking and sharing health information online: comparing search engines and social media. in Proceedings of the SIGCHI Conference on Human Factors in Computing Systems 1365–1376 (ACM, 2014).
- 38.Ashton RA, et al. The usefulness of school-based syndromic surveillance for detecting malaria epidemics: Experiences from a pilot project in Ethiopia. BMC Public Health. 2016;16:20. doi: 10.1186/s12889-015-2680-7. [DOI] [PMC free article] [PubMed] [Google Scholar]
- 39.Mack, A., Choffnes, E. R., Sparling, P. F., Hamburg, M. A. & Lemon, S. M. Global Infectious Disease Surveillance and Detection: Assessing the Challengesâ" Finding Solutions: Workshop Summary. (National Academies Press, 2007). [PubMed]
- 40.Koul PA, et al. Differences in influenza seasonality by latitude, northern India. Emerg. Infect. Dis. 2014;20:1723. doi: 10.3201/eid2010.140431. [DOI] [PMC free article] [PubMed] [Google Scholar]
- 41.Tamerius J, et al. Global influenza seasonality: Reconciling patterns across temperate and tropical regions. Environ. Health Perspect. 2011;119:439–445. doi: 10.1289/ehp.1002383. [DOI] [PMC free article] [PubMed] [Google Scholar]
- 42.Yuan, H., Kramer, S. C., Lau, E. H. Y., Cowling, B. J. & Yang, W. Modeling influenza seasonality in the tropics and subtropics. medRxiv, 10.1101/2021.02.04.21251148 (2021). [DOI] [PMC free article] [PubMed]
- 43.Shaman J, Kohn M. Absolute humidity modulates influenza survival, transmission, and seasonality. Proc. Natl. Acad. Sci. 2009;106:3243–3248. doi: 10.1073/pnas.0806852106. [DOI] [PMC free article] [PubMed] [Google Scholar]
- 44.Shaman J, Pitzer VE, Viboud C, Grenfell BT, Lipsitch M. Absolute humidity and the seasonal onset of influenza in the continental United States. PLoS Biol. 2010;8:e1000316. doi: 10.1371/journal.pbio.1000316. [DOI] [PMC free article] [PubMed] [Google Scholar]
- 45.Viboud, C., Alonso, W. J. & Simonsen, L. Influenza in tropical regions. PLoS Med.3 (2006). [DOI] [PMC free article] [PubMed]
- 46.Chowell G, Viboud C, Simonsen L, Miller M, Alonso WJ. The reproduction number of seasonal influenza epidemics in Brazil, 1996–2006. Proc. R. Soc. B Biol. Sci. 2010;277:1857–1866. doi: 10.1098/rspb.2009.1897. [DOI] [PMC free article] [PubMed] [Google Scholar]
- 47.Lazer D, Kennedy R, King G, Vespignani A. The parable of Google flu: Traps in big data analysis. Science. 2014;343:1203–1205. doi: 10.1126/science.1248506. [DOI] [PubMed] [Google Scholar]
- 48.Nsoesie EO, Cesare N, Müller M, Ozonoff A. COVID-19 misinformation spread in eight countries: Exponential growth modeling study. J. Med. Internet Res. 2020;22:e24425. doi: 10.2196/24425. [DOI] [PMC free article] [PubMed] [Google Scholar]
- 49.Henly S, et al. Disparities in digital reporting of illness: A demographic and socioeconomic assessment. Prev. Med. 2017;101:18–22. doi: 10.1016/j.ypmed.2017.05.009. [DOI] [PMC free article] [PubMed] [Google Scholar]
- 50.Njouom R, et al. Viral etiology of influenza-like illnesses in Cameroon, January–December 2009. J. Infect. Dis. 2012;206:S29–S35. doi: 10.1093/infdis/jis573. [DOI] [PMC free article] [PubMed] [Google Scholar]
- 51.FAQ About Google Trends Data.https://support.google.com/trends/answer/4365533?hl=en.
- 52.Breiman L. Bagging predictors. Mach. Learn. 1996;24:123–140. [Google Scholar]
- 53.Breiman L. Random forests. Mach. Learn. 2001;45:5–32. doi: 10.1023/A:1010933404324. [DOI] [Google Scholar]
- 54.Hastie, T., Tibshirani, R. & Friedman, J. The Elements of Statistical Learning. (2009).
- 55.Zhang G, Lu Y. Bias-corrected random forests in regression. J. Appl. Stat. 2012;39:151–160. doi: 10.1080/02664763.2011.578621. [DOI] [Google Scholar]
- 56.Drucker, H., Burges, C. J., Kaufman, L., Smola, A. J. & Vapnik, V. Support vector regression machines. in Advances in Neural Information Processing Systems 155–161 (1997).
- 57.Chang C-C, Lin C-J. LIBSVM: A library for support vector machines. ACM Trans. Intell. Syst. Technol. (TIST) 2011;2:1–27. doi: 10.1145/1961189.1961199. [DOI] [Google Scholar]
- 58.Meyer, D. et al.Package ‘e1071’. R J (2019).
- 59.Meinshausen, N. & Ridgeway, G. Quantile regression forests. J. Mach. Learn. Res.7 (2006).
- 60.Nsoesie EO, Mekaru SR, Ramakrishnan N, Marathe MV, Brownstein JS. Modeling to predict cases of hantavirus pulmonary syndrome in Chile. PLoS Negl. Trop. Dis. 2014;8:e2779. doi: 10.1371/journal.pntd.0002779. [DOI] [PMC free article] [PubMed] [Google Scholar]
- 61.Box, G.E.P. & Jenkins, G.M. Time Series Analysis: Forecasting & Control. (Holden-Day, 1970).
- 62.Brockwell, P. & Davis, R. Introduction to Time Series and Forecasting. (Springer, 2002).
- 63.Hyndman, R. J. & Khandakar, Y. Automatic Time Series for Forecasting: The Forecast Package for R. (Monash University, Department of Econometrics and Business Statistics, 2007).
- 64.Demšar J. Statistical comparisons of classifiers over multiple data sets. J. Mach. Learn. Res. 2006;7:1–30. [Google Scholar]
- 65.Nemenyi, P. Distribution-free multiple comparisons. in Biometrics Vol. 18 263 (International Biometric Society, 1962).
- 66.Majumder, M. S. et al. Utilizing nontraditional data sources for near real-time estimation of transmission dynamics during the 2015–2016 Colombian Zika virus disease outbreak. JMIR Public Health Surveill.2 (2016). [DOI] [PMC free article] [PubMed]
- 67.Lu FS, et al. Accurate influenza monitoring and forecasting using novel internet data streams: A case study in the Boston Metropolis. JMIR Public Health Surveill. 2018;4:e4. doi: 10.2196/publichealth.8950. [DOI] [PMC free article] [PubMed] [Google Scholar]
Associated Data
This section collects any data citations, data availability statements, or supplementary materials included in this article.


