Abstract
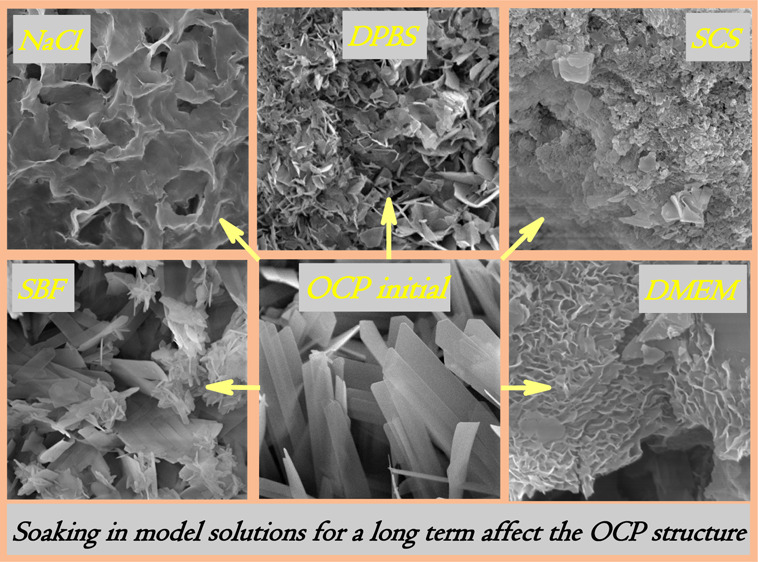
Octacalcium phosphate (OCP), a new-generation bone substitute material, is a considered precursor of the biological bone apatite. The two-layered structure of OCP contains the apatitic and hydrated layers and is intensively involved in ion-exchange surface reactions, which results in OCP hydrolysis to hydroxyapatite and adsorption of ions or molecular groups presented in the environment. During various in vitro procedures, such as biomaterial solubility, additive release studies, or the functionalization technique, several model solutions are applied. The composition of the environmental solution affects the degree and rate of OCP hydrolysis, its surface reactivity, and further in vitro and in vivo properties. The performed study was aimed to track the structural changes of OCP-based materials while treating in the most popular model solutions of pH values 7.2–7.4: simulated body fluid (SBF), Dulbecco’s phosphate-buffered saline (DPBS), supersaturated calcification solution (SCS), normal saline (NS), and Dulbecco’s modified Eagle’s medium (DMEM). Various degrees of OCP hydrolysis and/or precipitate formation were achieved through soaking initial OCP granules in the model solutions. Detailed data of X-ray diffraction, Fourier-transform infrared spectroscopy, atomic emission spectrometry with inductively coupled plasma, and scanning electron microscopy are presented. Cultivation of osteosarcoma cells was implemented on OCP pre-treated in DMEM for 1–28 days. It was shown that NS mostly degraded the OCP structure. DPBS slightly changed the OCP structure during the first treatment term, and during further terms, the crystals got thinner and OCP hydrolysis took place. Treatment in SBF and SCS caused the precipitate formation along with OCP hydrolysis, with a larger contribution of SCS solution to precipitation. Pre-treating in DMEM enhanced the cytocompatibility of materials. As a result, on performing the in vitro procedures, careful selection of the contact solution should be made to avoid the changes in materials structure and properties and get adequate results.
1. Introduction
Octacalcium phosphate [OCP, Ca8H2(PO4)6·5H2O] is of great interest in recent approaches to bone reconstruction and regeneration due to the combination of unique properties. OCP possesses highly bioactive and osteoconductive properties.1−4 It is the precursor of hydroxyapatite (HA) and the suggested precursor for biological apatite formed during biomineralization.5−7 Being implanted into bone defects, OCP shows a high resorption rate and enhances the new bone formation.1−4,8−10 However, the mechanisms of OCP biodegradation and issues in its osteoinduction capacity still remain unresolved. It is considered that the OCP environment in vivo accelerates the protein adsorption, induces the osteoclast-like cell attraction that increases the resorption of the material, and indirectly stimulates the osteoblasts.10−12 On the other hand, in vitro experiments for OCP materials are complicated by the influence of physicochemical effects of the material on the cultural medium, which even results in material cytotoxicity.13 This effect on cell response could be achieved not only for the OCP but also for calcium phosphates (CaPs) obtained by biomimetic precipitation that are more similar to the biominerals. In comparison with sintered ceramics, the nanocrystalline calcium-deficient HA, which is supposed to be more active, shows a lower cell proliferation activity and a higher level of apoptosis.13 From this point of view, the accepted methods for cytocompatibility evaluation can give ambiguous results. Such behavior of the OCP and bioactive biomimetic materials is explained by the ionic exchange occurring between the material and the environment (soaking solution, culture medium, or biological environment).
It is known that OCP converts to HA in vitro and in vivo.14 It was suggested that the OCP hydrolysis is a significant process in bone formation in terms of attaining osteoconductivity.11 The OCP hydrolysis degree influences the phase composition and material microstructure that significantly affect its behavior in vivo. It was found that the partially hydrolyzed OCP to a small amount of HA improves the bone formation significantly more than that of the OCP or the fully hydrolyzed OCP.15 Since W.E. Brown determined the two-layer structure of OCP, containing apatitic and hydrated layers,6 the OCP conversion to HA was studied in terms of structural changes and the influence on its biological response. The removal of water molecules and hydrogen ions from the hydrated layer of OCP occurs during the OCP conversion to HA. Along with this, the diffusion of calcium ions into the hydrolyzing crystals takes place, and the apatitic surface layers are formed to be an interlayered OCP–HA structure. Thus, the OCP hydrolysis is an irreversible process and occurs with phosphate ion release and calcium ion adsorption. The rate of ionic diffusion at the crystal–solution interface is controlled by the degree of solution supersaturation. Under the conditions of high supersaturation, the precipitation of amorphous phases takes place.14,16,17 The ion composition and concentration of the solution environment adjust the precipitation or/and hydrolysis preference.
To achieve the aim of using frequent in vitro procedures such as the biomaterial solubility study, additive release study (dopant, biomolecules, drug, etc.), or functionalization technique, the varied model solutions are applied.17−21 Among the various number of such solutions, CaP solutions mimicking the body environment are used. Calcium and phosphate concentrations and the inclusion of other ions affect the degree and rate of material dissolution or precipitation. Details of these processes could predict the in vitro and in vivo material behavior and provide the controlled effect. In the present work, the comparison study of OCP structure changes during soaking in different model solutions was performed to detail the contribution of OCP hydrolysis to HA or precipitation of amorphous phases depended on treated terms and the kind of solution. Various degrees of OCP hydrolysis were achieved through soaking the initial OCP granules in different solutions of pH values of 7.2–7.4: simulated body fluid (SBF); supersaturated calcification solution (SCS); Dulbecco’s phosphate-buffered saline (DPBS), and normal saline (NS). Also, Dulbecco’s modified Eagle’s medium (DMEM) was used in the study to compare the OCP structure changes as a result of treating in the cell growth medium, containing amino acids and other organic components. For this purpose, the investigation of microstructure and phase composition of the solid phase was performed, as well as the determination of changes in [Ca2+] and inorganic phosphate ion [Pi] concentrations in treating solutions during the elongated term. OCP cytocompatibility was estimated in terms of the effect of pre-treating in DMEM.
2. Experimental Procedure
2.1. Materials Preparation
OCP ceramic granules were fabricated by the low-temperature chemical transformation method of α-tricalcium phosphate (α-TCP) hydrolysis.22,23 For this purpose, the initial β-TCP powder was obtained by precipitation from 0.5 M aqueous solutions of calcium nitrate [Ca(NO3)2·4H2O] and ammonium hydrogen phosphate [(NH4)2HPO4] to achieve the ratio Ca/P = 1.5, according to reaction 1. The aqueous ammonia of 25% [NH4OH] was added to maintain the pH value at 7.0 ± 0.1. The reagents for the study of high purity were purchased from Sigma-Aldrich.
| 1 |
The obtained β-TCP powder was used to fabricate the porous ceramic granules by the method of porous polymer foam replication, as described elsewhere.24−26 First, the ceramic slip was prepared by mixing the β-TCP powder with a gelatin-based aqueous solution. The polyurethane reticulated foams of average pore size of 0.1–0.5 mm were impregnated with a β-TCP slip. Then, the dried samples were sintered at 1350 °C to burn out the polymeric component and to obtain the α-TCP ceramic phase. The resultant ceramics were then crushed into small parts and sorted by size to the fractions.
The α-TCP granules of an average size of 500–1000 μm were used for the chemical transformation procedure. First, the chemical transformation of α-TCP to dicalcium phosphate dihydrate (DCPD) was performed in an acetate solution in the presence of phosphoric acid, according to reaction 2, as described in refs;27,28 the procedure lasted for 7 days. The temperature was maintained at 37 °C and the pH value was kept at 5.5 ± 0.1 using the thermostat and pH-stat assembly. Second, DCPD was hydrolyzed in 1.5 M sodium acetate solution [CH3COONa] to obtain OCP composition in line with reaction 3, as noted in refs,27,28 the pH value was fixed at 9.0 ± 0.2 and the temperature at 37 °C. The resultant OCP granules were carefully washed with distilled water to achieve the pH of decanted water of 7.2–7.4, then dried at 40–50 °C, and fractionated to get the ceramic granules of average size of 500–100 μm.
| 2 |
| 3 |
2.2. Materials Characterization
X-ray diffraction (XRD) studies were performed on powdered samples using a Shimadzu XRD-6000 diffractometer (Japan) with Cu Kα radiation (λ = 1.5418 Å), 40 kV, and 200 mA. The angular-analyzed interval 2θ was from 4 to 60°, with a step of 0.02°. The phases were identified according to JSPDS. The IR spectra were recorded with a Nikolet Avatar 330 spectrometer (USA) in the 4000–400 cm–1 wavelength range. For this, the KBr pellet technique was used by mixing 1 mg of powdered samples with 50 mg of spectroscopic grade KBr. The surface structure and crystal morphology of OCP ceramic granules were examined by scanning electron microscopy (SEM), using a TESCAN VEGA II (Czech), previously coated with gold, from Q150R Quorum Technologies (England). Quantitative determination of the element content (calcium [Ca2+] and phosphorus [Pi]) was carried out by atomic emission spectrometry with inductively coupled plasma (AES–ICP) using an Optima 5300DV spectrometer (PerkinElmer, USA). For this purpose, the analytical solutions were diluted within the detection range.
2.3. Model Solutions for In Vitro Study
The in vitro study was performed to model conditions of different [Ca2+] and [Pi] concentrations of the environment and interpret the structure and phase transformations of OCP granules that can be observed in vivo during the first implantation period. The number of model solutions of pH values of 7.2–7.4 and different ion compositions was chosen to follow up the OCP modification during soaking (SBF, SCS, DPBS, NS, and DMEM) (Table 1).
Table 1. Ionic Concentration of Experimental Model Solutions and Human Blood Plasma, mmol/L.
| solution | Na+ | K+ | Mg2+ | Ca2+ | Cl– | HPO42– | SO42– | HCO3– | pH |
|---|---|---|---|---|---|---|---|---|---|
| NS | 154.0 | 154.0 | 7.1 | ||||||
| DPBS | 153.0 | 4.2 | 0.5 | 0.9 | 139.6 | 8.1 | 7.4 | ||
| SBF | 142.0 | 5.0 | 1.5 | 2.5 | 147.8 | 1.0 | 0.5 | 4.2 | 7.4 |
| SCS | 136.8 | 3.7 | 3.1 | 144.5 | 1.86 | 7.2 | |||
| DMEM | 155.3 | 5.3 | 0.8 | 1.8 | 119.2 | 0.9 | 0.8 | 44.1 | 7.4 |
| human plasma | 142.0 | 5.0 | 0.8–1.5 | 2.1–2.5 | 103.0 | 1.0 | 0.5 | 27 | 7.2–7.4 |
To prepare the model inorganic solutions, the following reagents were dissolved in distilled deionized water, heated to 37 °C, and mixed in appropriate quantities: NaCl, NaHCO3, KCl, K2HPO4·3H2O, MgCl2·6H2O, CaCl2·2H2O, and Na2SO4, according to the classic recipes.29−31 The reagents for the study of high purity were purchased from Sigma-Aldrich. The pH value was adjusted to 7.2–7.4 with Tris(hydroxymethyl)aminomethane and HCl. Table 1 details the characteristics of model solutions used in the work.
For the experiment, the DMEM solution (DMEM, high glucose, sterile, Pr. no. 41965039, PanEco, Russia) supplemented with fetal calf serum (FCS) (HyClone, USA) (with a final concentration of 10%), gentamicin (50 μL/mL), and HEPES buffer (20 mmol/mL) (PanEco, Russia) was applied. In addition to the content of inorganic salts, DMEM contains a number of amino acids, vitamins, and glucose, such as the plasma compound. The designated medium composition was also applied for further in vitro experiments on cell culture.
2.4. OCP Soaking Procedure
The porous OCP granules of 1 g in weight were placed in glass vessels and filled with 60 mL of model inorganic solutions (the ratio of the material to the soaking solution was 1:60). Soaking of the samples was performed in glass vessels at 37 °C for 1–44 days in a thermostat with continuous stirring without change in the solutions. All the experiments were carried out according to ISO-10993.32 At predetermined time periods, the samples were removed and carefully washed with deionized distilled water and dried at 37 °C in a thermostat. All sets of ceramic samples and analytes were examined to study the microstructure, phase composition of the OCP granules, and ion composition of the solutions.
Soaking in DMEM was performed through the following experiment design. Sterile OCP granules (γ-irradiation, 18 kGr) were placed in 24-well culture plates (Costar, USA), 33 mg per well (in triplets for each term of the experiment), and 2.0 mL of DMEM was added to wells (the ratio of the material to the medium was 1:60). In total, eight plates were prepared: one for each soaking term for further evaluation of cytocompatibility and one for phase and structural analysis. The procedure started from the maximum terms to the minimum (28, 21, 14, 7, 3, 1, and 0 days) and was performed without changing the medium, in a CO2 incubator (Sanyo, USA), at 37 °C and 5% CO2. After treatment, DMEM was collected from each well to determine the concentration of analytes, the OCP samples were washed quickly with PBS and deionized water, and then dried at 37 °C in a thermostat.
2.5. Cell Culture
Human osteoblast-like cells MG63 (Russian Collection of vertebrate Cell Cultures, Institute of Cytology, Russian Academy of Sciences, Saint Petersburg) were used for the in vitro experiments. The cells were cultured in DMEM (PanEco, Russia) supplemented with 10% FCS (HyClone, USA), 50 μL/mL gentamicin (PanEco, Russia), and 20 mmol/mL HEPES buffer (PanEco, Russia).
2.6. Cytocompatibility Study
The cytocompatibility study of OCP samples after soaking in DMEM was carried out in terms of 1, 4, 7, 11, 14, 18, and 21 days. DMEM was removed and a suspension of MG-63 cells in a concentration of 4 × 10⁴ cells in 2.0 mL medium was added to each well with the material. The culture medium was changed three times in the first week of the experiment and then it was changed daily. For the experiment, seven groups of samples were formed: I—cells on an OCP sample without preliminary soaking in DMEM; II—1 day of soaking; III—4 days of soaking; IV—7 days of soaking; V—14 days of soaking; VI—21 days of soaking, and VII—28 days of OCP soaking in DMEM. The control group was the cell growth on polystyrene culture plastic.
The cytocompatibility was estimated by analysis of cell viability by the [3-(4,5-dimethylthiazol-2-yl)-2,5-diphenyltetrazolium bromide] (MTT) assay and light microscopy. The MTT assay involves the conversion of the water-soluble yellow tetrazolium salt MTT (Sigma, USA) to an insoluble purple formazan by the action of mitochondrial reductase. Formazan was then dissolved by isopropyl alcohol (Chimmed, Russia), and its concentration was determined by measuring the optical density at 540 nm.33 The amount of formazan produced was directly proportional to the number of living cells, presented during MTT exposure.34,35
The population of viable cells (PVC) in the experiment was calculated in relation to the control (in %) using the formula
where OD is the value of optical density of formazan solution in the experiment and control, respectively.
2.7. Statistical Analysis
The results of viability assays were presented as mean ± SD (significance difference). SD for the experiment and control was evaluated using standard methods of variational statistics: parametric Student’s t test (marked *), Student’s t test with Bonferroni correction (marked **), and ANOVA. Differences were considered statistically significant at p < 0.05.
3. Results
3.1. Initial Materials Characterization
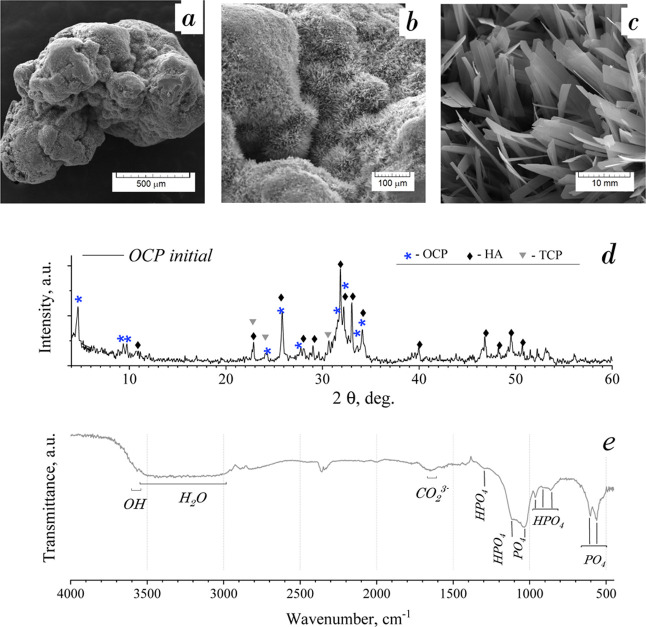
The SEM observation of the initial granules revealed that the ceramic surface was composed of radiated petal-like crystals of up to 100 nm in thickness and 1–4 μm in width. The particles were assembled into flower-like clusters of 50–150 μm in size (Figure 1a–c). It could be named radiated morphology when an aggregate is composed of needle-like, scales, or column crystals radiating from a central point.
Figure 1.
Characterization study of the initial OCP granules: (a–c) SEM observation, (d) XRD: phase composition corresponding to OCP, HA, and trace of α-TCP, and (e) IR spectrum revealing the OCP phase.
The XRD pattern of the initial material is shown in Figure 1d. The reflections observed for the material corresponded to OCP as the main phase, HA, and a trace of α-TCP. The strong peak at 2θ = 4.72° corresponded to the main OCP characteristic reflection (010). The 2θ values of the other most intensive OCP reflections were extremely close to the HA reflections (in the range of 2θ = 31.55/33.97°). The presence of HA phase was indicated by the peak at 2θ = 10.82° and by the number of peaks in the range of 2θ > 39.8°. Due to the different preferred OCP crystal orientation, the ratio of the main peak intensities of the OCP and HA could not give an accurate estimation of the phase ratio. It could also be noted that the HA lines were slightly shifted toward the larger 2θ values. Trace amounts of α-TCP have occurred as slight remains of source material from the transformation procedure.
The IR spectrum of the initial material demonstrated that the vibration bands corresponded to the OCP structure groups (Figure 1e).36,37 The duplet bends at 1036 and 1121 cm–1 were assigned to the ν3 PO4 and HPO4 stretching bands, respectively. The bands at 861 ([P–(OH)] stretch), 916 ([P–(OH)] stretch), and 1291 cm–1 (OH in-plane bend of HPO4) were also assigned to HPO4 group vibrations. The PO4 groups had a number of bends at 560 and 603 cm–1 (ν4 mode) and 961 cm–1 (ν1 mode). The wide band in the range of 3000–3500 cm–1 was assigned to H2O vibration modes. The weak bend at 3565 cm–1 corresponded to the OH stretch. According to ref,36 the weak OH band at 3565 cm–1 could serve as evidence of HA impurity in OCP due to hydrolysis, however, there was a lack of OH band at 635 cm–1, which is one of the main IR-characteristics of HA structure presented as an obvious triplet in the range of 560–640 cm–1 with the abovementioned PO4 bands and OH band. The band at 1643 cm–1 was attributed to CO3 groups and the weak peak at 2330–2350 cm–1 was attributed to adsorbed CO2 during the sample preparation procedure.
As a result, the material used for the study was OCP granules with a highly developed surface due to the radial arrangement of thin crystals. The material phase was OCP, partially hydrolyzed to calcium-deficient HA.
3.2. OCP In Vitro Behavior in Model Inorganic Solutions
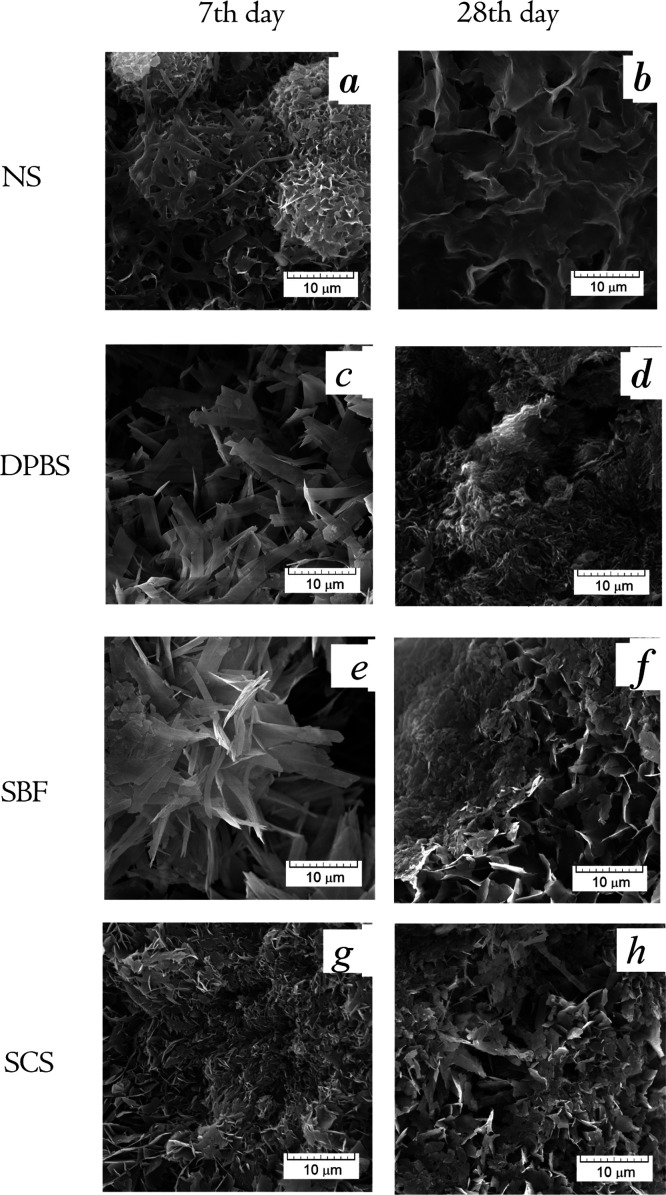
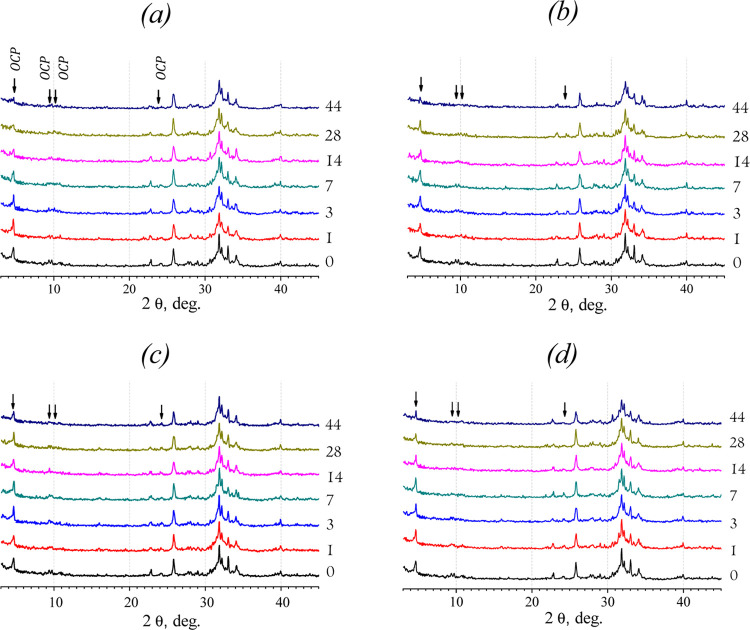
The comparison of SEM and XRD data of materials soaked in inorganic model solutions is shown in Figures 2 and 3. The differences in XRD patterns are indicated with arrows for OCP decrease. The SEM observation of the materials soaked in NS showed the evident dissolution of OCP crystals (Figure 2a,b). Within the term of seventh day, the petal-like OCP crystals got thin and bent over, with irregular faces. On the 28th day of soaking, the plate-like surface became smaller in length, porous, and rough with sharp points. XRD revealed a decrease of the OCP phase and an increase of the HA phase in the total compound of all the materials treated in NS (Figure 3a). Up to the 44th day of soaking, the material consisted of HA and a small amount of OCP. It could be concluded through the data that the intense OCP dissolution with hydrolysis to HA took place during soaking of the material in NS. This confirms that NaCl accelerates the initial hydrolysis rate of OCP.38
Figure 2.
SEM micrographs of OCP materials treated during 7 and 28 day in NS (a,b—respectively), DPBS (c,d—respectively), SBF (e,f—respectively), and SCS (g,h—respectively).
Figure 3.
XRD patterns of materials soaked in different solutions for 1–44 days: (a) NS, (b) DPBS, (c) SBF, (d) SCS (terms are showed on the plot). Arrows pointed on the OCP diffraction peaks detached from the HA peaks to trace changes in intensities.
According to the SEM analysis of materials soaked in DPBS, the slight deformation of plate-like crystals was observed over 7 days of treatment. On the 28th day, there were large areas of fine particles stretched across the surface in radiating directions (Figure 2c,d). XRD patterns in Figure 3b demonstrate the approximately constant intensity of the main OCP peak at 2θ = 4.72° over 14 days of soaking, then it slightly decreases during the 14–28 days, and reduces on the 44th day.
After treating in SBF during the first 3 days, no significant changes in the crystals were revealed (data are not demonstrated). Since the seventh day, the slight thinning and flexing of the elongated OCP particles took place (Figure 2e). The faint amorphous phase was observed randomly on the OCP particles since the 14th day of soaking in SBF (Figure 2f). The SCS treatment led to a slight thinning and deformation of OCP petal-like particles after 7 days (Figure 2g). During the last term of soaking in SCS, the surface was occasionally coated with a thin amorphous layer (Figure 2h). There were the same XRD pattern changes for SBF and SCS, which illustrated a constant value of OCP and HA phase in compounds during 7 days of soaking, and OCP decrease over the last period (Figure 3c,d).
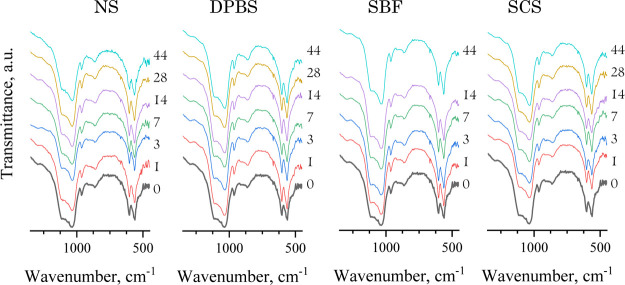
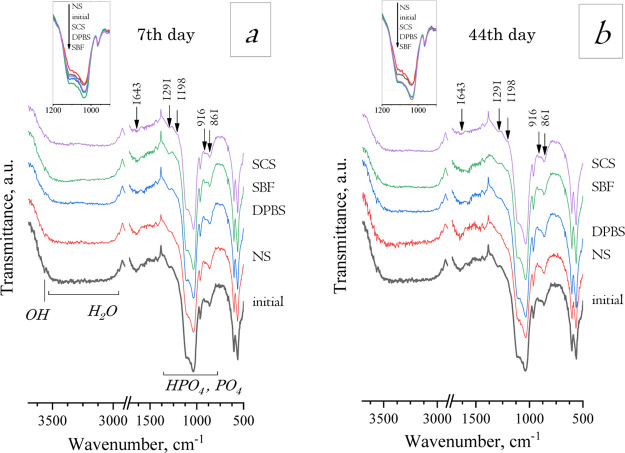
The IR spectra obtained for all materials treated in inorganic model solutions revealed the OCP band characteristics (Figure 4). The evidence of crystallinity decrease during material treatment could be traced by reducing the bends at 1036–1121 cm–1 for HPO4 and PO4, which were more noticeable for NS treatment since the bands became shorter and less expressed; soaking in DPBS, SBF, and SCS led to a slight rise in this bend (Figure 5). Changes in weak bands at 1291, 1198, 916, and 861 cm–1 attributed to HPO4 groups could indicate the hydrolysis OCP to HA, according to ref.37 During hydrolysis, the 917 cm–1 IR bend decreased more rapidly than the 816 cm–1 bend. This set of bands decreased more insistently within the NS-treating term and have almost disappeared by the 44th day of soaking in NS (Figure 5). For DPBS-treated materials, there were constant intensity values for the HPO4 bands when tracked up to 14 days, and then there was a barely noticeable decrease. The SBF treatment was caused in resolution enhancement of a set of HPO4 bands and a visible increase of the 916 cm–1-band that could serve as evidence for OCP-like phase rising. For SCS, the HPO4 bands remained mostly unchanged in intensity.
Figure 4.
IR spectra of materials soaked in model solutions for 1–44 days (the treatment terms are pointed on the plot).
Figure 5.
IR spectra of soaked materials on the 7th (a) and 44th (b) days of treatment. Comparison of changes in intensities of HPO4- and PO4-bands depending on the type of treating solution.
Figure 6 shows the dynamics of [Ca2+] and [Pi] release from the material after soaking in four experimental solutions for 1–28 days. The presented data were estimated with an account of initial ion concentrations for each solution, so the ordinate values corresponded to the difference in values of elemental concentration of the assay and the initial solution (NS/DBPS/SBF/SCS). During materials soaking in NS, the [Ca2+] and [Pi] release increased rapidly up to the seventh day, by about 15 ppm [Ca2+] and 50 ppm [Pi] for each time point. On the period of 7–28 days, the rate of ion release slowed down and reached 58 ppm for [Ca2+] and 205 ppm for [Pi] on the 28th day. Within the total period of treatment in DPBS, the [Ca2+] concentration did not change significantly. There was the adsorption of [Pi] from DPBS on the first soaking day by 14 ppm and then its monotonous release up to 60 ppm by the 28th day. SBF soaking had led to a linear increase of [Pi] release to 68 ppm by the end of the term, and [Ca2+] adsorption took place on the first day up to 62 ppm, then it was slightly released. SCS soaking shows the more intensive trend of ion release, with [Ca2+] and [Pi] adsorption at the first day, then a continuous intensive [Pi] release and a constant value of [Ca2+] concentration with some increase on the 14th day.
Figure 6.
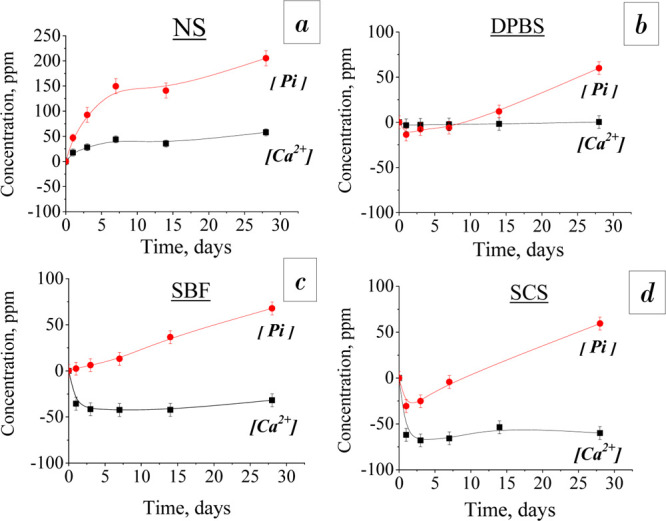
Dependence of [Ca2+] and [Pi] concentrations in different model inorganic solutions on the soaking time: (a) NS, (b) DPBS, (c) SBF, and (d) SCS.
3.3. OCP In Vitro Behavior in DMEM
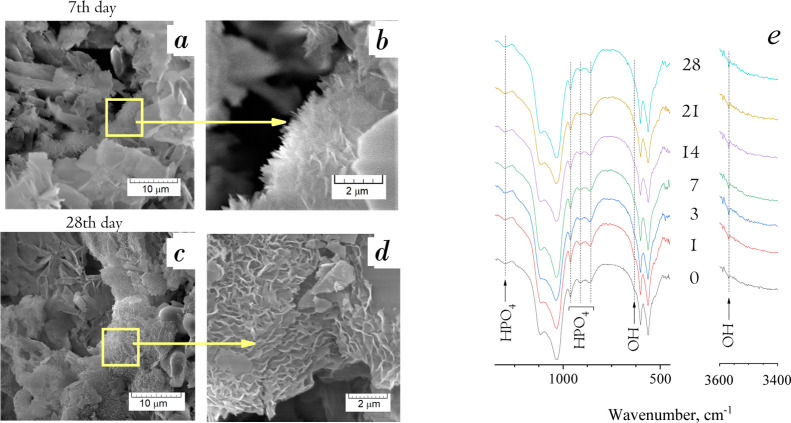
The SEM study of materials treated in DMEM indicated the formation of a new phase (Figure 7a–d). Up to the seventh day of soaking, a thin needle-like phase onto the OCP surface was found. Subsequently, up to the 28th day, the coating of the plate-like phase on the large OCP crystals was observed. The layer thickness reached 400–500 nm. Such sites were located widely, and the newly formed phase occurred in radial or perpendicular directions to the original surface. The radial growth is typical for OCP, while HA crystalizes in thin hexagonal prisms perpendicular to the initial surface, or ACP is of globular morphology when its surface consists of little spheres with a loose surface.
Figure 7.
SEM micrographs of the OCP surface, soaked in DMEM for 7 (a,b) and 28 (c,d) days: demonstration of newly formed OCP by thin needles on the primary plate-like OCP petals (a,c—5 kx magnification; b, d—20 kx—magnification). (e) IR spectra of DMEM-treated materials) (days of soaking are indicated in the plot).
IR spectral analysis did not show noticeable changes in the lines for materials treated for different terms in DMEM (Figure 7e). The set of HPO4 bends remained visibly unchanged. Only the peak at 3550 cm–1 corresponded to OH groups that appeared for materials treated in DMEM, more intensively for the terms of 3 and 7 days. This could indicate the partial OCP hydrolysis to HA.
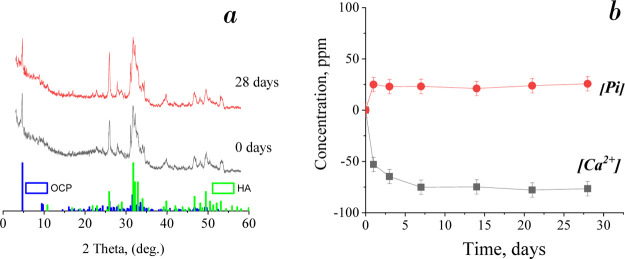
XRD data give more obvious evidence of HA presence in the compound of materials without soaking and with soaking for 28 days (Figure 8a). The intensive peak at 2θ = 25.88° and a set of peaks in the range of 2θ = 46–54° corresponded to the HA phase. XRD patterns of materials treated for 0 and 28 days are close, with a slight HA content increase on the 28th day. ICP data analyses confirmed the calcium ion adsorption and phosphate ion release in DMEM, especially intensive during the first 7 days of soaking. In the longer term, the ion exchange slowed down (Figure 8b).
Figure 8.
XRD patterns of OCP soaked in DMEM for 0 and 28 days (a) and changes in [Ca2+] and [Pi] during OCP soaking in DMEM (b).
It could be concluded that during soaking in DMEM, both of the following processes took place: formation of a new OCP-like phase and OCP hydrolysis to HA.
3.4. Cytocompatibility Study
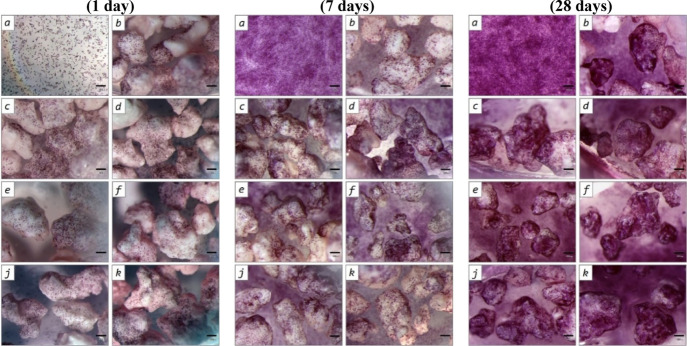
It was shown that the I experimental group (MG-63 cells cultured on intact OCP) reliably (p < 0.05) lagged from the control on all periods of experiment. The PVC value was 88% (1 day of cultivation), then it decreased to 66% (on the 11th day of observation), and increased to 95% by the 18th and 21st days of experiment (Tables 2, 3 and Figure 9). The statistically significant gap of cell population on the fourth and seventh days of observation (p < 0.05) was shown compared to the control (PVC value 62–75% for the fourth day and 68–74%—for the seventh day). By the 14th day of observation, the difference in the experimental groups and control was either absent (sample II), or statistically significantly exceeded the control values (samples III–VII). This trend continued up to the 21st day of experiment (p < 0.05). Analysis of MG-63 cell viability on the intact OCP and after DMEM-treatment during 1–28 days found that soaking in the growth medium improved the material cytocompatibility at all periods of cultivation. The MG-63 population was significantly higher in groups II–VII versus I (p < 0.05) (Tables 2, 3, and Figure 9). However, the slight difference between groups I (0 days), III (3 days), IV (7 days), and VII (28 days) (days of pre-treatment in DMEM) could be detected.
Table 2. Optical Density of Formazan Solution (OD, MTT Assay) during 1–21 days of MG-63 Cell Cultivation on DMEM-Treated OCP Granules (0–28 days).
| OD of
formazan solution |
|||||||
|---|---|---|---|---|---|---|---|
| group number (soaking term, days) | 1 day | 4 days | 7 days | 11 days | 14 days | 18 days | 21 days |
| cell control | 0.151 ± 0.001 | 0.652 ± 0.004 | 1.210 ± 0.010 | 1.547 ± 0.020 | 1.594 ± 0.013 | 1.511 ± 0.011 | 1.884 ± 0.011 |
| I (0) | 0.133 ± 0.001* | 0.280 ± 0.004* | 0.468 ± 0.005* | 1.022 ± 0.006* | 1.267 ± 0.002* | 1.447 ± 0.001* | 1.779 ± 0.005* |
| II (1) | 0.154 ± 0.001*,** | 0.439 ± 0.002*,** | 0.881 ± 0.005*,** | 1.482 ± 0.003*,** | 1.632 ± 0.004** | 1.515 ± 0.005** | 1.870 ± 0.006** |
| III (3) | 0.163 ± 0.001*,** | 0.417 ± 0.002*,** | 0.857 ± 0.003*,** | 1.632 ± 0.004*,** | 1.656 ± 0.007*,** | 1.490 ± 0.011** | 2.000 ± 0.007*,** |
| IV (7) | 0.151 ± 0.001** | 0.478 ± 0.001*,** | 0.889 ± 0.001*,** | 1.592 ± 0.008** | 1.459 ± 0.013*,** | 1.559 ± 0.006*,** | 2.192 ± 0.007*,** |
| V (14) | 0.142 ± 0.001*,** | 0.487 ± 0.005*,** | 0.888 ± 0.006*,** | 1.543 ± 0.003** | 1.753 ± 0.007*,** | 1.540 ± 0.004** | 2.243 ± 0.012*,** |
| VI (21) | 0.145 ± 0.001* | 0.434 ± 0.001*,** | 0.884 ± 0.001*,** | 1.521 ± 0.009** | 1.710 ± 0.007*,** | 1.580 ± 0.003*,** | 2.222 ± 0.005*,** |
| VII (28) | 0.148 ± 0.001*,** | 0.407 ± 0.003*,** | 0.819 ± 0.005*,** | 1.376 ± 0.005*,** | 1.700 ± 0.004*,** | 1.613 ± 0.005*,** | 2.113 ± 0.010*,** |
Table 3. Population of Viable MG-63 Cells (PVC) Cultured during 1–21 days on DMEM-Treated OCP Granules (0–28 days).
| PVC
(%) at different times of cell growth (days) |
|||||||
|---|---|---|---|---|---|---|---|
| group number (soaking term, days) | 1 | 4 | 7 | 11 | 14 | 18 | 21 |
| cell control | 100.0 | 100.0 | 100.0 | 100.0 | 100.0 | 100.0 | 100.0 |
| I (0) | 88.1 | 42.9 | 38.7 | 66.1 | 79.5 | 95.8 | 95.0 |
| II (1) | 102.0 | 67.3 | 72.8 | 95.8 | 102.3 | 100.3 | 100.0 |
| III (3) | 107.9 | 64.0 | 70.8 | 105.5 | 103.9 | 98.6 | 106.7 |
| IV (7) | 100.0 | 73.3 | 73.5 | 102.9 | 91.5 | 103.2 | 117.0 |
| V (14) | 94.0 | 74.7 | 73.4 | 99.7 | 110.0 | 102.0 | 119.7 |
| VI (21) | 89.4 | 66.6 | 73.1 | 98.3 | 107.3 | 104.6 | 118.6 |
| VII (28) | 98.0 | 62.4 | 67.7 | 89.0 | 106.6 | 106.8 | 112.8 |
Figure 9.
MG-63 cells cultured for 1 day, 7 days, and 21 days on polystyrene (control, a), intact OCP sample (b) and DMEM-treated OCP samples (treatment term, days: c—1, d—4, e—7, f—14, j—21, k—28). MTT test, magnification ×40.
4. Discussion
The structural features of OCP determine its exclusive in vivo behavior. The two-layer structure of OCP consisted of hydrate and apatite layers involved in the ion-exchange reactions at the phase boundary between the material crystals and the environment. The high surface area of OCP crystals and activity for interaction with biomolecules determine their high adsorption capacity. It was proposed that the amount of adsorption sites changes during the OCP hydrolysis to HA,38 which can affect the bone formation. There are several works to study for the in vivo response of OCP of different hydrolysis rates.1,15 It was demonstrated that hydrolyzed OCP to Ca-deficient HA significantly reduced the bone formation compared to the OCP.1 On the other hand, partly hydrolyzed OCP enhanced the bone formation significantly more than OCP and fully hydrolyzed OCP.15 OCP structural changes during hydrolysis affect its chemical–physical properties that predict its behavior in vivo. The rate of OCP hydrolysis is controlled by the degree of solution supersaturation stipulated by the chemical composition of the solution environment.11,39 In this regard, this kind of solution causes different degrees of OCP hydrolysis depending on the treatment time and pH value.
The present study was aimed at tracking the structural changes in the OCP-based material and changes in ion concentrations of the solution environment during material soaking in various model solutions. For this purpose, the OCP granules of an average size of 500–1000 μm were produced for in vitro experiments. The material is intended for bone implantation.2,38 The OCP phase was formed by the low-temperature chemical transformation method of α-TCP hydrolysis. The obtained material was described by the diffraction lines for both OCP and HA phase. The set of OCP diffraction lines was clearly in accord with the OCP card. As for HA, the lines were slightly shifted toward the larger 2θ values. This indicated the reduced parameters of HA crystal lattice. The IR spectral observation did not reveal the obvious HA presence because of the absence of strong vibration bands for the (OH)-group as the part of triplet for one (OH) bend and two (PO4) bends in the range of wavenumbers 560–640 cm–1. Thus, it was assumed that the material used for the experiment after α-TCP conversion was the partially hydrolyzed OCP.
For the study, several model solutions were used in terms of the most popular solutions for in vitro experiments. We used SBF due to the closest ion composition to the blood serum.18,19,30 Despite the difference in protein absence and natural buffering via carbonates in blood, SBF is the most popular solution to simulate the material behavior in vivo. At the same time, SBF conditions perform the apatite formation or precipitation because its ion composition is supersaturated toward HA and can mimic biomineralization.40 Under conditions of supersaturation, the HA formation occurs through ACP precipitation as a precursor to the OCP phase and its slow hydrolysis.1,17,41 To enhance the CaP precipitation on the material surface, we regarded the SCS solution with a higher calcium ion concentration, and the lack of Mg2+ and HCO3– ions inhibited the crystallization and crystal growth.42,43 DPBS is the widespread buffer solution with a lower calcium concentration than SBF and SCS. It was used in the study to track the material changes over a long period at the physiological pH value and low calcium content. NS without calcium, phosphate, and other ions contained in serum was used as the isotonic saline to distinguish the contribution of hydrolysis during OCP dissolution. Regarding the adsorption affinity of OCP to proteins, we considered that the presence of several numbers of organic components of the solution environment could involve the physicochemical changes of the material on the interface. Therefore, the cell growth medium, DMEM, was also applied for the study.
It is known that the dissolution of CaPs’ surface layers or a new CaP phase precipitation on the surface occurs through ion exchange at the interphase boundary dependent on local supersaturation.44 The dissolution rate and new-phase formation depend on the ion composition and conditions of the solution and on the surface conditions of the material: composition, presence of defects, roughness, particle size, etc.19 In solutions, OCP converts to HA by hydrolysis through calcium ion incorporation and phosphoric acid release within HA formation, according to reactions 4 and 5(6)
| 4 |
| 5 |
Besides, under supersaturation, the formation of OCP occurs through the formation and crystallization of the amorphous CaP phase, then it hydrolyzes to calcium-deficient HA and subsequently to HA with a long-range order. Depending on the ion composition and concentration, the following processes take place such as OCP dissolution, OCP hydrolysis to HA, or CaP precipitate formation, or a combination of these processes.
The presented data indicate that treatment in NS provides rapid OCP dissolution with intensive calcium and phosphate ion release. In general, ion diffusion is driven by the concentration gradient from surface layers of the material to solution in the absence of these ions in the solution. Apparently, reaction 4 occurs in preference, while OCP is dissolved by NS. The XRD and Fourier-transform infrared spectroscopy (FTIR) data confirm this by the continuous and significant decrease of OCP content and a nonmonotonic small decrease of HA content after soaking in NS for 14 days; and since the 14th day of soaking, the OCP phase is present in a small amount. In this case, the HA phase as more stable and insoluble in comparison with OCP seems to be slightly dissolved, but its amount is compensated by partially hydrolyzed OCP. The microstructure observations also provide the obvious evidence of phase intensive dissolution since the third day of soaking when the crystals became thinner and reduced in size (Figure 2a–d). It should be assumed that in the absence of calcium and phosphate ions in the solution, the OCP dissolution occurs with rapid calcium and phosphate ion release and simultaneous HA formation.
The DPBS treatment of the OCP granules resulted in a constant value of calcium ions equal to the initial calcium concentration in the solution ([Ca2+] = 0.9 mmol/L) within the period of 28 days. With this, some adsorption of phosphate ions on the first day and its subsequent continuous release proceeded. We consider that the DPBS is in balance for calcium concentration with the OCP surface. XRD data indicated a significant decrease in the OCP content after the seventh day of soaking due to the loss of intensity of diffraction lines. The HA content was slightly decreased for the overall treatment period. SEM observations pointed to crystal thinning, which is especially notable by the 28th day of incubation. Estimation of ion concentration revealed that the hydrolysis, reaction 4, with the release of phosphoric acid proceeded during DPBS soaking at concentrations of [Ca2+] = 0.9 mmol/L and [HPO42–] = 8.1 mmol/L. Thus, in DPBS, the OCP hydrolysis with the release of phosphoric acid and HA formation took place.
During the SBF soaking, the monotonous release of phosphate ions occurred within all period. The adsorption of calcium ions lasted until the third day of treatment and then it became stable in value, with the slight release on the 28th day. These ion concentration changes agree with the changes in the cell culture media, while cells were cultured on the CaPs materials during the standard tests for the evaluation of proliferation of cell activity.13 Therefore, both hydrolysis reactions, reactions 4 and 5, occurred with calcium adsorption from the solution and the release of phosphoric acid. These are the basic principles of OCP hydrolysis. At the same time, XRD data indicate a decrease in the intensity of the OCP diffraction lines and almost constant HA intensity diffraction lines up to the third day of soaking. The FTIR spectra reveal the OCP structure by the full set of weak bands assigned for HPO4 groups, which are the most expressed in comparison with other model solutions. Due to SEM observations, it can be suggested that a precipitate is actually formed from the solution. It is confirmed that SBF provides the hydrolysis processes and the precipitation of amorphous CaP phases. The newly formed CaP precipitate accelerates OCP hydrolysis due to a higher solubility that increases supersaturation around OCP with respect to HA.39 The CaP precipitate converts to OCP with the OCP content rising on the third day of treatment. After the 14th day, these processes are weakened, possibly by subsequent hydrolysis of the precipitate and shield the internal phase from subsequent active hydrolysis.
In the SCS, the material behavior is similar to SBF, with a large precipitation contribution. An ambiguous change in the intensity of diffraction lines for HA gives a tendency to its content decrease. For OCP, the intensity of its lines increases by the seventh day, which then decreases constantly. Distinct ion adsorption of [Ca2+] and [Pi] from the solution together with the SEM observation data also point to the precipitate formation in SCS.
The SEM observation of treated in DMEM presents the direct evidence of new phase formation on the primary OCP crystals. The new phase spreads confidently over the surface increasing in amount with time. The radiated morphology points to OCP-like phase formation. Unfortunately, neither XRD analysis nor Ca/P estimation (data are not presented) cannot give the unambiguous answer about phase composition of the newly formed phase, because its summary amount on the surface is much less, then in the volume of a whole granule. Indirectly with results, the processes of dissolution/precipitation occur alternately during treatment. In this regard, it is difficult to accurately assess the phase composition of the material at each treatment period. The calcium adsorption and phosphate ion release occur during OCP soaking in DMEM, more intensively for 7 days and unchanged during the further period. Among the treatment media selected for the experiment, SBF (as inorganic solution) and DMEM (cell growth media) can be compared by ion composition as the closest to the internal environment of the body. It was confirmed that the OCP behavior is similar while soaking in SBF and DMEM: a new OCP-like phase formed during the period of third to seventh day of treatment and it increased during the further terms. Despite this, the OCP hydrolysis to HA occurred during all treatment terms, more intensively after 7 days of soaking. Due to the DMEM composition, supplemented with amino acids and other organic components, and presence of CO2, the conditions close to the in vivo ones were achieved as was mentioned in ref.30 More intensive new OCP-like phase formation and less intensive hydrolysis of OCP in DMEM indirectly indicated the organic components’ involvement in OCP nucleation.
The results analysis of osteosarcoma cells cultivation on OCP showed that pre-treatment in DMEM enhances the cytocompatibility of the materials. The MG-63 population and the optical density of formazan solution are statistically higher in groups of materials soaked in DMEM than without primary soaking. On one hand, the treatment time did not significantly affect the viability of cells between all groups. On the other hand, there is a difference between groups I (0 days), III (3 days), IV (7 days), and VII (28 days) (days of pre-treatment in DMEM). The trend for the OD of MG-63 cells on the materials treated for 3 and 7 days was growing on the 11th day of cultivation and then it was decreasing during 14–18 days of cultivation. The maximum value of OD was achieved on the 28th day of cultivation on the material pre-treated for 28 days. We interpret this cell behavior by the following way. OCP materials without pre-treatment lag from the control. When incubated in DMEM, the partial hydrolysis of OCP to HA (confirmed by [Ca2+] adsorption and [Pi] release) has a positive effect on the reaction of cells on the material. HA is the chemical phase of excellent biocompatibility. Furthermore, organic compounds of DMEM (proteins/amino acids) interact with calcium ions received from the medium during OCP hydrolysis. The surface enriched with incorporated biomolecules is preferable for cells. Consequently, the material soaked in growth media for 7 days showed a higher trend of cell population. During the further terms of the in vitro cell experiment, the products of cell interaction with the material surface led to a similar tendency of cell behavior, probably, due to a long time of medium influence. Thus, during the last term of the experiment, the difference in the surface structure of the materials soaked for various times disappeared. In that way, the rough surface of partial hydrolysis to the HA phase of OCP in combination with a new OCP-like phase is preferable for cells, which is especially important during the early stages of new bone formation.
5. Conclusions
Based on the results presented above, it can be concluded that during the OCP soaking in model solutions, the OCP dissolution takes place through its hydrolysis to HA. The HA formation depends on the solution saturation of calcium and phosphate ions and is driven by the concentration gradient at the crystal–solution boundary. Treatment in NS in the absence of calcium and phosphate ions provides rapid OCP dissolution with intensive calcium and phosphate ion release. This leads to degradation of the material crystal structure with thinning and reduction of the OCP particles. DPBS soaking results in non-released calcium ions and constant release of the phosphate ions. With this, the OCP structure with radiated needle-like crystals remains unchanged over the long term. In the calcium-saturated solution, calcium ion adsorption and phosphate release through HA formation take place on the crystal surface. Both OCP hydrolysis and amorphous phase precipitation occur in SBF and SCS solutions. The contribution of the precipitation process during soaking in SCS is greater than that in SBF, which is important for the incorporation procedures. It was confirmed that the OCP behavior is similar while soaking in SBF and DMEM: the amount of new OCP-like phase formed during the terms from the third day of soaking and increased during the further terms. However, the new OCP formation in DMEM is more intensive than in SBF, which indicates organic component involvement in OCP nucleation and inhibits hydrolysis to OCP. Analysis of the results of osteosarcoma cell cultivation on OCP showed that pre-treatment in DMEM enhanced the cytocompatibility of the materials. With this, the rough surface of partly hydrolyzed to the HA phase in combination with a new OCP-like phase is preferable for cells, which is especially important in the early stages of new bone formation.
Acknowledgments
The authors acknowledge the Russian Foundation for Basic Research (RFBR) for financial support [grant number 18-29-11052].
Supporting Information Available
The Supporting Information is available free of charge at https://pubs.acs.org/doi/10.1021/acsomega.0c06016.
BET and mass loss data; mass loss for materials soaked in inorganic solutions; change in the surface area of the samples soaked in DPBS, SCS, and DMEM; and most active changes in dynamics of the OD of formazan solution during the cultivation of human sarcoma cells MG-63 on an intact OCP sample and OCP after soaking in DMEM for 3, 7, and 28 days (PDF)
The authors declare no competing financial interest.
Supplementary Material
References
- Suzuki O.; Kamakura S.; Katagiri T.; Nakamura M.; Zhao B.; Honda Y.; Kamijo R. Bone formation enhanced by implanted octacalcium phosphate involving conversion into Ca-deficient hydroxyapatite. Biomaterials 2006, 27, 2671–2681. 10.1016/j.biomaterials.2005.12.004. [DOI] [PubMed] [Google Scholar]
- Komlev V. S.; Barinov S. M.; Bozo I. I.; Deev R. V.; Eremin I. I.; Fedotov A. Y.; Gurin A. N.; Khromova N. V.; Kopnin P. B.; Kuvshinova E. A.; Mamonov V. E.; Rybko V. A.; Sergeeva N. S.; Teterina A. Y.; Zorin V. L. Bioceramics Composed of Octacalcium Phosphate Demonstrate Enhanced Biological Behavior. ACS Appl. Mater. Interfaces 2014, 6, 16610–16620. 10.1021/am502583p. [DOI] [PubMed] [Google Scholar]
- Sugiura Y.; Munar M. L.; Ishikawa K. Fabrication of octacalcium phosphate block through a dissolution-precipitation reaction using a calcium sulphate hemihydrate block as a precursor. J. Mater. Sci.: Mater. Med. 2018, 29, 151–158. 10.1007/s10856-018-6162-1. [DOI] [PubMed] [Google Scholar]
- He J.; Ye H.; Li Y.; Fang J.; Mei O.; Lu X.; Ren F. Cancellous-Bone-like Porous Iron Scaffold Coated with Strontium Incorporated Octacalcium Phosphate Nanowhiskers for Bone Regeneration. ACS Biomater. Sci. Eng. 2019, 5, 509–518. 10.1021/acsbiomaterials.8b01188. [DOI] [PubMed] [Google Scholar]
- Brown W. E. Crystal growth of bone mineral. Clin. Orthop. Relat. Res. 1966, 44, 205–220. 10.1097/00003086-196600440-00021. [DOI] [PubMed] [Google Scholar]
- Brown W. E.; Mathew M.; Tung M. S. Crystal chemistry of octacalcium phosphate. Prog. Cryst. Growth Charact. 1981, 4, 59–87. 10.1016/0146-3535(81)90048-4. [DOI] [Google Scholar]
- Suzuki O.; Nakamura M.; Miyasaka Y.; Kagayama M.; Sakurai M. Bone formation on synthetic precursors of hydroxyapatite. Tohoku J. Exp. Med. 1991, 164, 37–50. 10.1620/tjem.164.37. [DOI] [PubMed] [Google Scholar]
- Kobayashi K.; Anada T.; Handa T.; Kanda N.; Yoshinari M.; Takahashi T.; Suzuki O. Osteoconductive property of a mechanical mixture of octacalcium phosphate and amorphous calcium phosphate. ACS Appl. Mater. Interfaces 2014, 6, 22602–22611. 10.1021/am5067139. [DOI] [PubMed] [Google Scholar]
- Chiba S.; Anada T.; Suzuki K.; Saito K.; Shiwaku Y.; Miyatake N.; Baba K.; Imaizumi H.; Hosaka M.; Itoi E.; Suzuki O. Effect of resorption rate and osteoconductivity of biodegradable calcium phosphate materials on the acquisition of natural bone strength in the repaired bone. J. Biomed. Mater. Res., Part A 2016, 104, 2833–2842. 10.1002/jbm.a.35828. [DOI] [PubMed] [Google Scholar]
- Boanini E.; Torricelli P.; Forte L.; Pagani S.; Mihailescu N.; Ristoscu C.; Mihailescu I. N.; Bigi A. Antiresorption implant coatings based on calcium alendronate and octacalcium phosphate deposited by matrix assisted pulsed laser evaporation. Colloids Surf., B 2015, 136, 449–456. 10.1016/j.colsurfb.2015.09.044. [DOI] [PubMed] [Google Scholar]
- Suzuki O.; Yagishita H.; Yamazaki M.; Aoba T. Adsorption of Bovine Serum Albumin onto Octacalcium Phosphate and its Hydrolyzates. Cells Mater. 1995, 5, 45–54. [Google Scholar]
- Imaizumi H.; Sakurai M.; Kashimoto O.; Kikawa T.; Suzuki O. Comparative study on osteoconductivity by synthetic octacalcium phosphate and sintered hydroxyapatite in rabbit bone marrow Calcif. Tissue Int. 2006, 78, 45–54. 10.1007/s00223-005-0170-0. [DOI] [PubMed] [Google Scholar]
- Sadowska J. M.; Guillem-Marti J.; Espanol M.; Stähli C.; Döbelin N.; Ginebra M.-P.; Ginebra M.-P. In vitro response of mesenchymal stem cells to biomimetic hydroxyapatite substrates: a new strategy to assess the effect of ion exchange. Acta Biomater. 2018, 76, 319–332. 10.1016/j.actbio.2018.06.025. [DOI] [PubMed] [Google Scholar]
- Eidelman N.; Chow L. C.; Brown W. E. Calcium Phosphate Saturation Levels in Ultrafiltered Serum Calcif. Tissue Int. 1987, 40, 71–78. 10.1007/bf02555708. [DOI] [PubMed] [Google Scholar]
- Miyatake N.; Kishimoto K. N.; Anada T.; Imaizumi H.; Itoi E.; Suzuki O. Effect of partial hydrolysis of octacalcium phosphate on its osteoconductive characteristics. Biomaterials 2009, 30, 1005–1014. 10.1016/j.biomaterials.2008.10.058. [DOI] [PubMed] [Google Scholar]
- Tung M. S.; Brown W. E. An intermediate state in hydrolysis of amorphous calcium phosphate Calcif. Tissue Int. 1983, 35, 783–790. 10.1007/bf02405124. [DOI] [PubMed] [Google Scholar]
- Brečević L.; Furedi-Milhofer H. J. Precipitation of calcium phosphates from electrolyte solutions. II. The formation and transformation of precipitates Calcif. Tissue Res. 1972, 10, 82–90. 10.1007/bf02012538. [DOI] [PubMed] [Google Scholar]
- Kokubo T.; Takadama H. How useful is SBF in predicting in vivo bone bioactivity?. Biomaterials 2006, 27, 2907–2915. 10.1016/j.biomaterials.2006.01.017. [DOI] [PubMed] [Google Scholar]
- Baino F.; Yamaguchi S. The Use of Simulated Body Fluid (SBF) for Assessing Materials Bioactivity in the Context of Tissue Engineering. Rev. Challenges Biomimetics 2020, 5, 57. 10.3390/biomimetics5040057. [DOI] [PMC free article] [PubMed] [Google Scholar]
- Bigi A.; Boanini E. Functionalized biomimetic calcium phosphates for bone tissue repair. J. Appl. Biomater. Funct. Mater. 2017, 15, e313–e325. 10.5301/jabfm.5000367. [DOI] [PubMed] [Google Scholar]
- Kuvshinova E. A.; Petrakova N. V.; Sergeeva N. S.; Kirsanova V. A.; Sviridova I. K.; Teterina A. Y.; Komlev V. S.; Kaprin A. D. The Functionalization of Calcium Phosphate Materials of Protein-based Biologically. Active Mol. Biomed. Chem. 2019, 2, e00096. 10.18097/bmcrm00096. [DOI] [Google Scholar]
- Fedotov A. Y.; Smirnov I. V.; Barinov S. M.; Komlev V. S. Highly porous bioceramics based on octacalcium phosphate Inorganic Materials. App. Res. 2017, 8, 723–726. 10.1134/s2075113317050100. [DOI] [Google Scholar]
- Bigi A.; Boanini E.; Botter R.; Panzavolta S.; Rubini K. α-Tricalcium phosphate hydrolysis to octacalcium phosphate: effect of sodium polyacrylate. Biomaterials 2002, 23, 1849–1854. 10.1016/s0142-9612(01)00311-8. [DOI] [PubMed] [Google Scholar]
- Milosevski M.; Bossert J.; Milosevski D.; Gruevska N. Preparation and properties of dense and porous calcium phosphate. Ceram. Int. 1999, 25, 693–696. 10.1016/s0272-8842(99)00003-6. [DOI] [Google Scholar]
- Hsu Y. H.; Turner I. G.; Miles A. W. Fabrication and mechanical testing of porous calcium phosphate bioceramic granules. J. Mater. Sci.: Mater. Med. 2007, 18, 1931–1937. 10.1007/s10856-007-3128-0. [DOI] [PubMed] [Google Scholar]
- Petrakova N. V.; Kuvshinova E. A.; Ashmarin A. A.; Konovalov A. A.; Nikitina Y. O.; Egorov A. A.; Sviridova I. K.; Barinov S. M.; Komlev V. S. Calcium phosphate ceramic surface coating via precipitation approach. IOP Conf. Ser.: Mater. Sci. Eng. 2019, 525, 012101. 10.1088/1757-899x/525/1/012101. [DOI] [Google Scholar]
- Lilley K. J.; Gbureck U.; Wright A. J.; Knowles J. C.; Farrar D. F.; Barralet J. E. Brushite cements from polyphosphoric acid, calcium phosphate systems. J. Am. Ceram. Soc. 2007, 90, 1892–1898. 10.1111/j.1551-2916.2007.01619.x. [DOI] [Google Scholar]
- Mandel S.; Tas A. C. Brushite (CaHPO4 ·2H2O) to octacalcium phosphate (Ca8(HPO4)2(PO4)4 ·5H2O) transformation in DMEM solutions at 36,5 °C Mater. Mater. Sci. Eng., C 2010, 30, 245–254. 10.1016/j.msec.2009.10.009. [DOI] [PubMed] [Google Scholar]
- Liu Q.; Weng J.; Wolke J. G. C.; de Wijn J. R.; van Blitterswijk C. A. A Novel In Vitro Model to Study the Calcifification of Biomaterials. Cells Mater. 1997, 7, 41–51. [Google Scholar]
- Bohner M.; Lemaitre J. Can bioactivity be tested in vitro with SBF solution?. Biomaterials 2009, 30, 2175–2179. 10.1016/j.biomaterials.2009.01.008. [DOI] [PubMed] [Google Scholar]
- Tas A. C. Synthesis of Biomimetic Ca-Hydroxyapatite Powders at 37 °C in Synthetic Body Fluids. Biomaterials 2000, 21, 1429–1438. 10.1016/s0142-9612(00)00019-3. [DOI] [PubMed] [Google Scholar]
- ISO-10993-14-2011 “Biological evaluation of medical devices-Part 14: Identification and quantification of degradation products from ceramics”.
- Mossman T. Rapid colorimetric assay for cellular growth and survivals: Application of proliferation and cytotoxicity assays. J. Immunol. Methods 1983, 65, 55–63. 10.1016/0022-1759(83)90303-4. [DOI] [PubMed] [Google Scholar]
- Olkowski R.; Kaszczewski P.; Czechowska J.; Siek D.; Pijocha D.; Zima A.; Ślósarczyk A.; Lewandowska-Szumieł M. Cytocompatibility of the selected calcium phosphate based bone cements: comparative study in human cell culture. J. Mater. Sci.: Mater. Med. 2015, 26, 270. 10.1007/s10856-015-5589-x. [DOI] [PMC free article] [PubMed] [Google Scholar]
- Sylvester P. W. Optimization of the tetrazolium dye (MTT) colorimetric assay for cellular growth and viability Methods. Mol. Biol. 2011, 716, 157–168. 10.1007/978-1-61779-012-6_9. [DOI] [PubMed] [Google Scholar]
- Fowler B. O.; Markovic M.; Brown W. E. Octacalcium Phosphate. 3. Infrared and Raman Vibrational Spectra. Chem. Mater. 1993, 5, 1417–1423. 10.1021/cm00034a009. [DOI] [Google Scholar]
- Barrère F.; van der Valk C. M.; Dalmeijer R. A. J.; van Blitterswijk C. A.; de Groot K.; Layrolle P. In vitro and in vivo degradation of biomimetic octacalcium phosphate and carbonate apatite coatings on titanium implants. J. Biomed. Mater. Res., Part A 2003, 64, 378–387. 10.1002/jbm.a.10291. [DOI] [PubMed] [Google Scholar]
- Octacalcium Phosphate Biomaterials: Understanding of Bioactive Properties and Application; Suzuki O., Insley G., Eds.; Woodhead Publishing, 2020; p 369, ISBN 978-0-08-102511-6. [Google Scholar]
- Tung M. S.; Tomazic B.; Brown W. E. The effects of magnesium and fluoride on the hydrolysis of octacalcium phosphate. Arch. Oral Biol. 1992, 37, 585–591. 10.1016/0003-9969(92)90142-u. [DOI] [PubMed] [Google Scholar]
- Lu X.; Leng Y. Theoretical analysis of calcium phosphate precipitation in simulated body fluid. Biomaterials 2005, 26, 1097–1108. 10.1016/j.biomaterials.2004.05.034. [DOI] [PubMed] [Google Scholar]
- Posner A. S.; Betts F. Synthetic amorphous calcium-phosphate and its. relation to bone-mineral structure. Acc. Chem. Res. 1975, 8, 273–281. 10.1021/ar50092a003. [DOI] [Google Scholar]
- Barrere F.; van Blitterswijk C. A.; de Groot K.; Layrolle P. Influence of ionic strength and carbonate on the Ca-P coating formation from SBF×5 solution. Biomaterials 2002, 23, 1921–1930. 10.1016/s0142-9612(01)00318-0. [DOI] [PubMed] [Google Scholar]
- Barrere F.; van Blitterswijk C. A.; de Groot K.; Layrolle P. Nucleation of biomimetic Ca–P coatings on Ti6Al4V from a SBF×5 solution: influence of magnesium. Biomaterials 2002, 23, 2211–2220. 10.1016/s0142-9612(01)00354-4. [DOI] [PubMed] [Google Scholar]
- Eliaz N.; Metoki N. Calcium Phosphate Bioceramics: A Review of Their History, Structure, Properties. Coating Technol. Biomed. Appl. Mater. 2017, 10, 334. 10.3390/ma10040334. [DOI] [PMC free article] [PubMed] [Google Scholar]
Associated Data
This section collects any data citations, data availability statements, or supplementary materials included in this article.


