Abstract
Nursing staff turnover has long been considered an important indicator of nursing home quality. However, turnover has never been reported on the Nursing Home Compare website, likely due to the lack of adequate data. On July 1, 2016, the Centers for Medicare and Medicaid Services began collecting auditable payroll-based daily staffing data for U.S. nursing homes. We used 492 million nurse shifts from these data to calculate a novel turnover metric representing the percentage of hours of nursing staff care that turned over annually at each of 15,645 facilities. Mean and median annual turnover rates for total nursing staff were roughly 128% and 94%, respectively. Turnover rates were correlated with facility location, for-profit status, chain ownership, Medicaid census, and five-star ratings. Disseminating facilities’ nursing staff turnover rates on Nursing Home Compare could provide important quality information for policymakers, payors, and consumers, and it may incentivize efforts to reduce turnover.
The high rate of nursing staff turnover in nursing homes is a longstanding concern in long-term care policy.(1) The largest previous study examining staff turnover found an average turnover rate of 56.2% for registered nurses (RNs), 53.6% for licensed practical nurses (LPNs), and 78.1% for certified nursing assistants (CNAs).(2)
In theory, turnover need not necessarily be a cause for concern. For example, high rates of turnover may be a good thing if they reflect facilities enforcing high standards for their staff. The common perception, however, is that high rates of turnover are a serious concern that relates to multiple factors including low compensation, poor working conditions, and few opportunities for advancement.(1) New staff may not be as familiar with the facility’s residents and practices, which may lead to quality problems. For example, high rates of turnover have been found to lead to more rehospitalizations (3) and more frequent use of physical restraints.(4) Recently, concerns have been raised that staff turnover at nursing homes could result in more infection control violations, potentially leading to COVID-19 outbreaks at facilities.(5)
Although staff turnover measures are thought to be an important indicator of nursing home quality, they have never been included on the federal Nursing Home Compare website. Importantly, there was no reliable way to measure nursing staff turnover for all US nursing homes. Section 6106 of the Patent Protection and Affordable Care Act laid the groundwork for a reliable measure, by mandating that the Centers for Medicare and Medicaid Services (CMS) collect staffing information on all direct care staff at nursing homes based on auditable payroll data. In 2016, CMS began collecting these data in the Long-Term Care Facility Staffing Payroll-Based Journal (PBJ) system.(6) As of July 1, 2016, nursing homes are required to submit reports each quarter that detail the daily hours worked by staff who provide direct care and services to residents, including both agency and contract staff. CMS began using the PBJ data as the source for staffing information on Nursing Home Compare in April 2018.
In this article, we use the newly-available PBJ data to construct a novel measure of nursing staff turnover, which we apply to virtually all nursing homes in the United States. We compute our measures for each of the three main types of nursing staff—registered nurses (RNs), licensed practical nurses (LPNs), and certified nursing assistants (CNAs)—as well as for all three types combined.
Dozens of studies have examined staff turnover at nursing homes. Estimates of turnover from this literature are correspondingly varied depending on the sample and method for calculating turnover rates: 14%-64% for RNs, 8-103% for LPNs, and 14-346% for CNAs.(2–4,7–17) Many of these studies were able to obtain data for only a small sample of facilities—such as a single state (10,11)—with some studies examining only a single facility.(13,14) Moreover, studies have often relied on voluntary survey responses,(9,15) which are not auditable and reflect a selected sample of facilities willing to respond. Finally, data limitations have created challenges in appropriately addressing part-time employees and employees with short employment spells. Studies have sometimes failed to distinguish between turnover in full-time and part-time employees,(3,16) or computed turnover in a way that is likely to miss short-term staff.(14)
The richness of the PBJ data allows us to alleviate these concerns. The PBJ data is auditable and includes virtually all CMS-certified nursing homes. Of the 15,771 and 15,757 facilities in the 2017 and 2018 Nursing Home Compare Provider Info files, just 242 and 229, respectively, are missing from the corresponding year of PBJ data. It also provides granular details on employee shifts that allow us to construct a turnover measure that factors in the number of hours that each nursing staff member worked at the facility. Rather than treating all nursing staff equally, our measure places greater weight on the turnover of staff who provided more care hours to patients. Moreover, the daily nature of the PBJ data also allows us to measure turnover in nursing staff with short employment spans, such as temporary agency staff. Staff with short employment spells are often excluded from other sources of staffing data, especially if their employment started and ended within the same year.
We construct and analyze our annual turnover rates for 15,645 facilities to study the national distribution of turnover rates for RNs, LPNs, CNAs, and total nursing staff, as well as to assess how total nursing staff turnover varies across different states and with facilities’ other characteristics.
Study Data and Methods
Study Data:
We used employee-level data from the PBJ to construct measures of nursing staff turnover. Unlike the PBJ data currently available on data.cms.gov—which only provide aggregated daily counts of staffing hours—these data specify the daily hours worked by each individual employee. In particular, the data identifies when each nurse stops working at a facility and how much care they were providing prior to leaving. The selected data cover 492 million recorded shifts for 4.4 million nurses (RNs, LPNs, and CNAs) at 15,647 facilities between October 1, 2016 and March 31, 2019. Using these data, we were able to construct annual turnover rates for 2017 and 2018 for nearly all nursing homes in the United States. We obtained nursing home characteristics—including location, ownership type, and the share of Medicaid and Medicare residents—from Brown University’s Long-Term Care Focus (LTCFocus) dataset. LTCFocus provides aggregated nursing home data from a variety of sources, including the Certification and Survey Provider Enhanced Reports (CASPER), CMS’s Nursing Home Compare, and the Minimum Data Set. We obtained poverty rate data from the U.S. Census Bureau’s Small Area Income and Poverty Estimates at the county-level, and we obtained urban and rural indicators from CASPER based on facility location.
We obtained Nursing Home Compare Five-Star Quality Ratings from data.cms.gov. We analyzed overall ratings, as well as four sub-ratings reflecting health survey deficiencies, staffing levels, RN staffing levels, and quality measures. All ratings are measured on a scale of one to five stars, with five stars representing the top level of performance. Although CMS updates ratings quarterly on the Nursing Home Compare website, we used rounded yearly averages in our analysis.
Methods:
Turnover Measure
We constructed a novel annual staff turnover measure to represent the percentage of staffing care in hours (as opposed to the percentage of staff members) that turned over at the facility during a given year. We calculated this turnover measure in three steps:
We identified employees who left within a given year based on whether the employee still worked at the facility in the first quarter of the following year. We did not observe whether the departures were voluntary or involuntary, nor did we distinguish whether the vacated position was subsequently filled.
We used the number of hours for each nurse logged in the PBJ to compute a “weight” representing each departing employee’s contribution to the total hours of nursing care provided at the facility. Specifically, our weight is the percentage of the facility’s nursing care hours that a departing employee provided in the 90 days prior to their last workday. This value represents the percentage of care that “turns over” when the employee leaves.
We summed the weights over all of the facility’s employees who left that year. This sum represents the total impact of all employees who left, as measured by their percent contributions to hours of nursing care at the facility.
We computed the annual turnover rate separately for RNs, LPNs, and CNAs, as well as for all nursing staff together.
As an example, consider a facility with two nurses, nurse A and nurse B, who respectively provide 80% and 20% of care hours. If only nurse B leaves, the facility’s turnover rate is 20%. If nurse A leaves instead, the turnover rate is 80%. If both nurses leave at the same time, the turnover rate is the sum of 20% and 80%, or 100%. As another example, consider the case where nurse A is replaced by a newly hired nurse C, who assumes nurse A’s responsibility for delivering 80% of care hours. If nurse C also leaves within the same year, again vacating 80% of care hours, the resulting annual turnover rate is the sum of both reductions, 160%. In this way, our measure accounts for both the fact that nurses may provide differing quantities of care and the fact that replacement nursing staff may also turn over within the same year.
This metric is predicated on our belief that weighting nurses by the amount of care they provide in hours is preferable to treating all nurses equally. Our reasoning is that the disruption to patient care is likely larger for turnover in staff who provide more hours of care. Failing to account for the amount of care provided would tend to overstate the impact of turnover among temporary and part-time staff, and tend to understate the impact of turnover in full-time staff.
Analytical Approach
We merged turnover measures with facility organizational information and regional characteristics collected from various sources. We then produced summary statistics to describe turnover rate by facility organizational characteristics (for-profit status, chain ownership, Medicaid share, five-star rating), and local area information (urban location, poverty share). To illustrate geographic variation in the turnover rate, we also produced gradient maps with turnover at the state level.
Limitations
Our study is limited in several ways. First, the PBJ collects data only on paid hours, suggesting it might not accurately reflect when salaried staff work more or less than is nominally specified by their employment agreement. However, prior research suggests this issue is fairly minor,(6) and this type of measurement error should have a minimal impact on staff turnover.
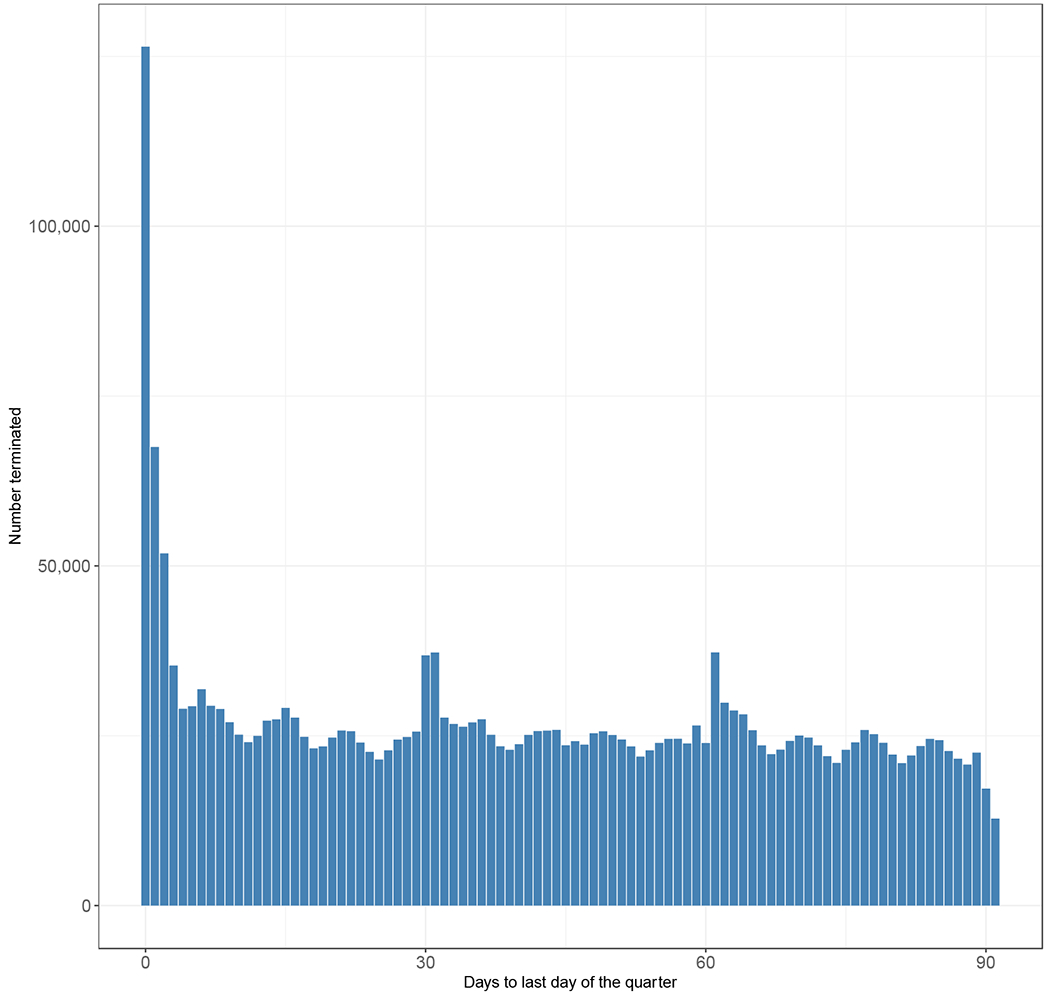
Additionally, employee-tracking in the PBJ may be imperfect. We observe a slight increase in employment departures in the final days of each quarter (Appendix Exhibit A).(18) While the observed increase might reflect intentional timing of some staff departures to coincide with the end of the reporting quarter, it may also reflect one or more data quality issues related to submission on a quarterly basis. Notably, the pattern would be consistent with occasional improper tracking of employees across quarters. Facilities may be less diligent about recording shifts from employees who departed early in a quarter. Alternatively, facilities may not always be careful to keep employee IDs consistent across reporting quarters. Such data quality issues would likely inflate turnover rates. However, the relatively small magnitude of the observed end-of-quarter spike gives us confidence that our measure is not dramatically overstated. In addition, we primarily reported and analyzed medians, as medians are more robust than means to data quality issues that manifest as outliers. We also excluded implausible values (i.e., turnover rates in excess of 400%) when plotting the distributions of the data. This entails excluding 2,438(15.6%), 1,325(8.4%), and 1,367(8.7%) facility-year observations for RNs, LPNs, and CNAs, respectively.
Finally, our analysis does not measure the degree to which our turnover rates provide information about quality that cannot already be inferred from existing Nursing Home Compare measures. This limitation suggests an important direction for future research: linking these PBJ-based turnover rates to resident assessments and claims data, in order to estimate the association between staff turnover and patient health outcomes.
Study Results
Average annual nursing staff turnover rates varied across RNs, LPNs, and CNAs (Exhibit 1). RNs had the highest mean turnover rate (140.7%). Although lower, the mean turnover rates for LPNs (114.1%) and CNAs (129.0%) were also substantial. Turnover rates varied greatly by facility and had a long right tail. Some facilities had annual total nursing staff turnover rates in excess of 300% (Exhibit 2). RNs also had the highest median turnover rate (102.9%), followed by CNAs (98.8%) and LPNs (79.8%). As noted earlier, we therefore focused on median rates, which are less sensitive than means to variation in the tails of the distributions.
Exhibit 1: Mean and median of annual nursing staff turnover rates at Nursing Homes by staff type, 2017-2018.
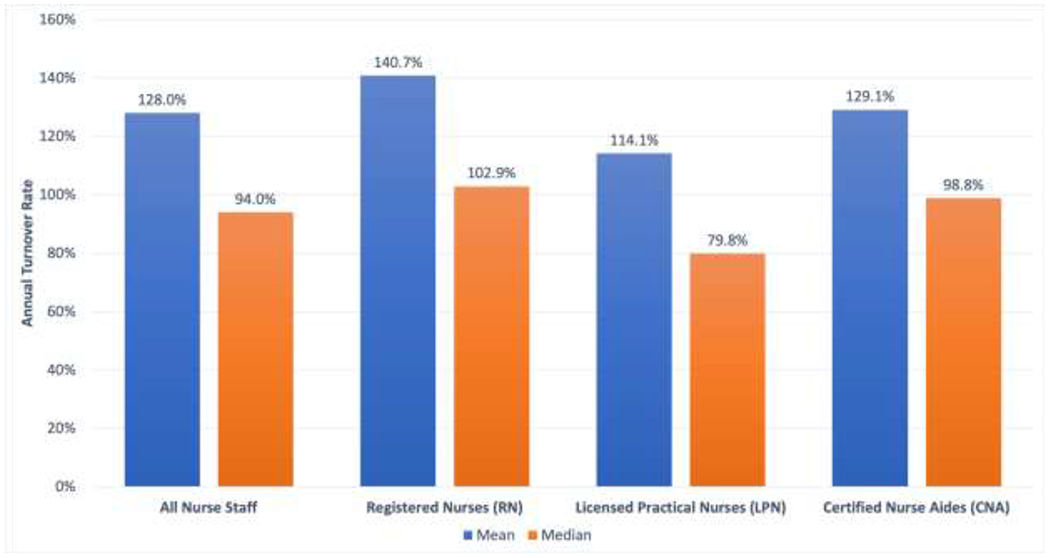
Notes: The annual turnover rates are measured as a percentage of the hours of nursing care that a facility provides. We calculate the turnover rate by summing the percentages of care hours provided by departing employees in the 90 days prior to their last workday.
Exhibit 2: Distribution of annual nursing staff turnover rates at Nursing Homes by staff type, 2017-2018.
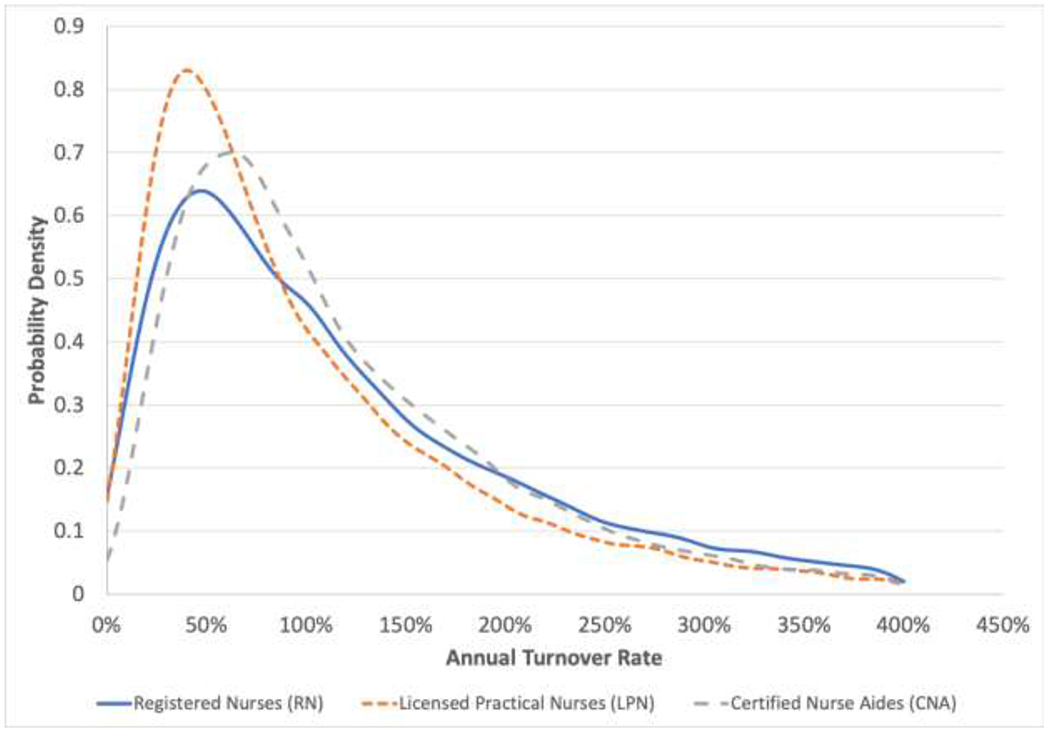
Notes: We exclude observations with turnover rates greater than 400%, as these are likely to reflect data reporting issues rather than true turnover rates. For registered nurses (RN), licensed practical nurses (LPN), and certified nurse aides (CNA) turnover, we respectively exclude 2,438, 1,325, and 1,367 facility-year observations.
Turnover also varied considerably by state (Exhibit 3). Oklahoma (165.1%), Montana (148.9%) and Kansas (144.8%) had the highest median turnover rates in total nursing staff, while Hawaii (39.3%), Connecticut (53.1%) and New Jersey (58.6%) had the lowest median turnover rates.
Exhibit 3: Median annual total nursing staff turnover rates at Nursing Homes, by state, 2017-2018.
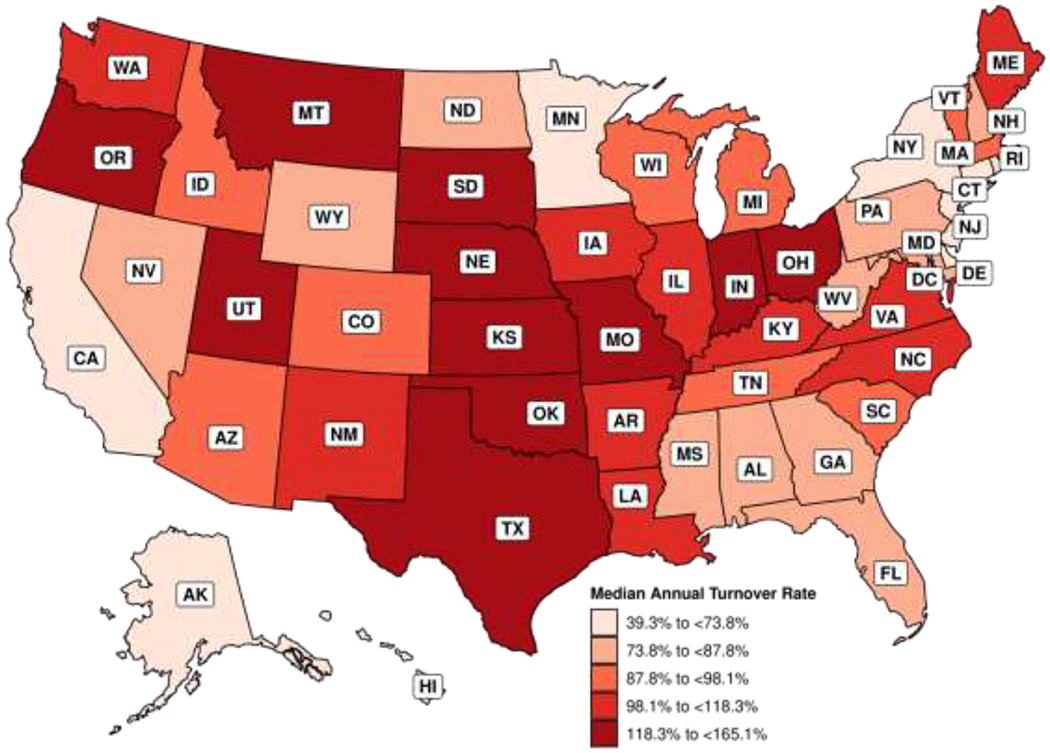
Notes: Turnover is computed based on total nurse staffing, including registered nurses, licensed practical nurses, and certified nurse aides.
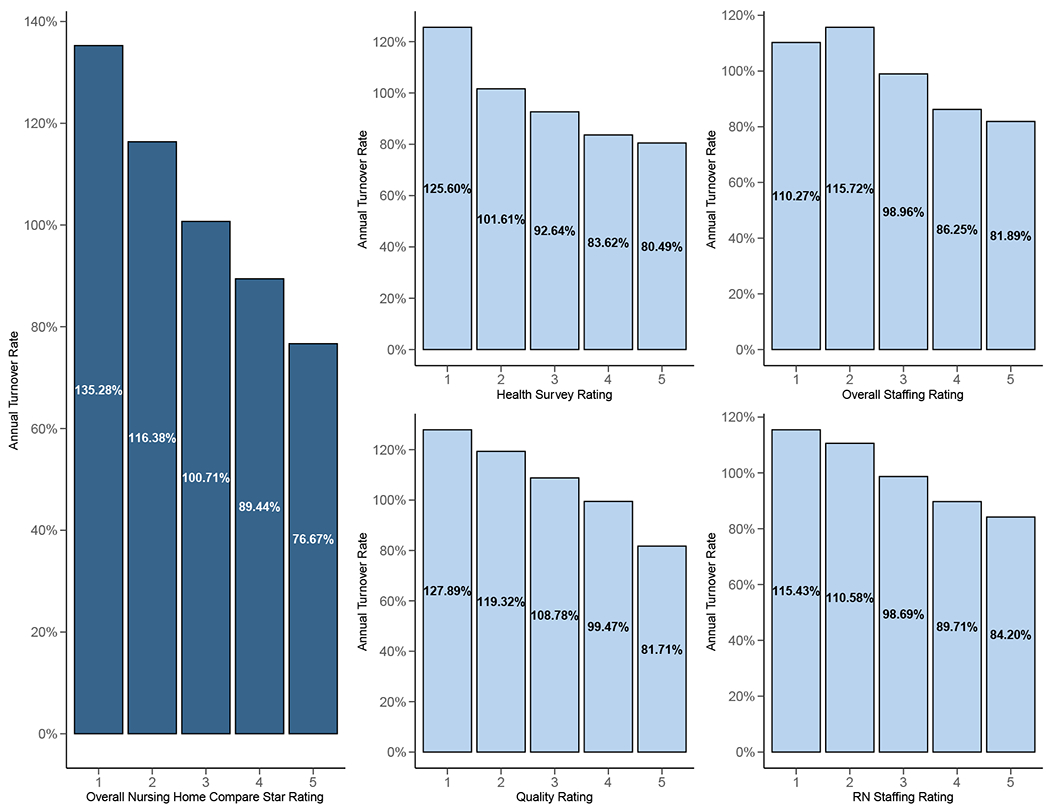
Annual total nursing staff turnover also varied by organizational characteristics. This was particularly pronounced for one characteristic: facilities’ overall five-star ratings on Nursing Home Compare. Low-rated one-star facilities had the highest median turnover rate (135.3%), while the highest rated five-star facilities had the lowest turnover rate (76.7%) (Exhibit 4). The same negative relationship between turnover and quality applied to the five-star ratings for health survey ratings, quality measures, overall staffing, and RN staffing (Appendix Exhibit B).(18) Total nursing staff turnover rates were also higher at facilities that were for-profit, chain-owned, or predominantly Medicaid, as well as facilities located in urban areas and areas with more poverty (Appendix Exhibit C).(18)
Exhibit 4: Median annual total nursing staff turnover rates by overall Nursing Home Compare five-star rating, 2017-2018.
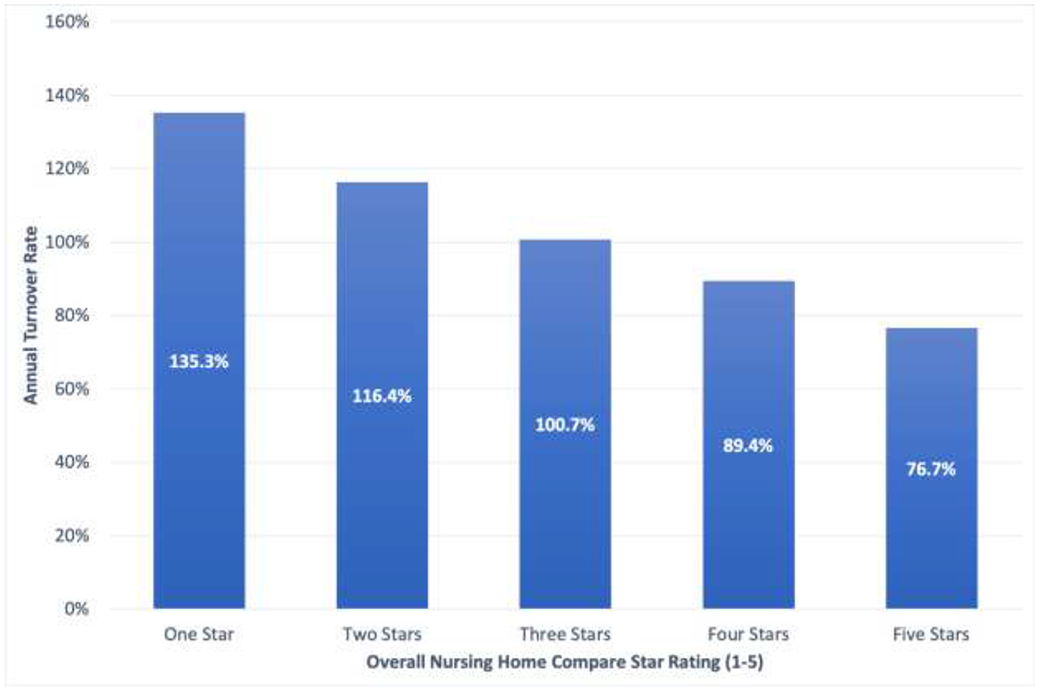
Notes: The Nursing Home Compare website features an overall rating for each nursing home, measured on a scale of one to five stars. This rating reflects a composite score of the facility’s performance on health inspections, staffing levels, and quality measures. Nursing homes that receive five stars are considered to have the highest level of overall quality. Turnover is computed based on total nurse staffing, including registered nurses, licensed practical nurses, and certified nurse aides. We compare the medians of total nursing staff turnover rate using the Mood’s test. The p-value is less than 0.001, indicating significant difference of medians at different star rating levels.
Discussion
This study is the first to examine nursing staff turnover at the facility level for nearly all U.S. nursing homes. It employs a novel metric and a new, granular data set created by the recently-implemented requirement that CMS collect direct care staffing information based on auditable payroll data. The results suggest nursing staff turnover at U.S. nursing homes is higher than previous work typically suggests, highly variable across facilities, and strongly correlated with specific organizational characteristics. As such, our findings have implications for both policy and future research.
Our novel measure of nursing staff turnover has several advantages over those used in previous studies. First, our measure is computed using auditable payroll-based data rather than relying on self-reported measures provided by facilities in surveys or on state cost reports. Second, it is collected for virtually all CMS-certified nursing facilities. Third, by using daily data collected year-round, we can effectively capture positions that turn over multiple times during the year.
We measure turnover rates to be higher than typically reported in previous studies.(2–4,7,8,10,11,13,14,16,17) There are several possible reasons why previous studies would have tended to underestimate turnover rates. Facilities may not have accurate and complete records of departing nursing staff when responding to surveys. Moreover, studies that rely on voluntary facility-reported turnover rates may disproportionately include facilities with lower turnover rates. Additionally, some studies fail to include agency and temporary staff when calculating turnover rates, or do not account for positions that turn over multiple times in a year.
Finally, because the PBJ data also measure hours worked, turnover can be weighted based on the amount of care provided by each nurse. Prior turnover measures have sometimes treated all nursing staff equally, assigning equal importance to turnover in part-time and full-time positions. Using the PBJ data, we were able to compute a turnover measure that accounts for the potential impact of each nurse departure, based on the hours of care provided by the departing nurse. Notably, we found that an unweighted measure typically resulted in higher turnover rates due to the inflated the importance of turnover in nursing staff that provide relatively few hours of care.
We identified several organizational characteristics that are correlated with total nursing staff turnover. Nursing staff turnover rates were higher in regions with lower per-capita income. This may reflect nursing staff being more likely to depart from their positions due to inadequate pay in these regions.(16) We also find that for-profit status and chain-ownership are associated with higher turnover rates. This may reflect for-profit nursing homes failing to support the needs of nursing staff (19) and chain-owned facilities imposing stricter standardization and oversight on their employees.(7) Finally, we find that greater Medicaid census is also associated with greater nursing staff turnover. Because Medicaid reimbursement rates are generally lower than those of Medicare and private pay,(17) it’s likely that facilities with a greater share of Medicaid residents are less financially capable of paying staff higher wages and offering benefits, which could contribute to higher turnover.
The availability of granular and comprehensive PBJ staffing data will facilitate future research on a range of different questions. For example, how does turnover at a facility fluctuate with economic trends like the local unemployment rate? Are facilities with higher turnover more likely to hospitalize residents? And, how does the loss of a longstanding RN affect quality? Researchers can also study turnover in leadership positions such as the director of nursing or the facility administrator.(20)
Nursing staff turnover rates, as calculated in our study, may provide meaningful information for policymakers and consumers as another report card measure of facility quality. The high rates of turnover found in our analysis suggest a need for policies targeted at reducing turnover. Some literature suggests that this can be done by incentivizing facilities to invest in staff wages and benefits.(1,16,17) Direct caregivers such as CNAs—who are predominantly female and are often US-born minorities and immigrants—earn low wages (often close to minimum wage) and receive few benefits.(1,21)
It has proven challenging to increase nursing staff wages at a national level given that Medicaid is the dominant payer for nursing home services. Even when states increase Medicaid reimbursement, nursing homes do not necessarily use these dollars to support their workforce. Therefore, some states have earmarked Medicaid rate increases for staff through wage pass-through policies,(22) which have been found to increase staffing wages.(23) States and CMS might also consider adjusting payments to be higher for facilities that have low staff turnover rates.
Policymakers could also consider mandating benefits such as health insurance and nonpunitive sick leave. Such policies could substantially improve conditions for lower-wage staff, such as CNAs, and might aid in reducing their turnover. In addition, policymakers could provide financial support for CNAs and LPNs seeking upward-mobility within a facility through further education and training. For example, some nursing homes have ladder programs in which CNAs receive financial support to receive their LPN degree. This type of program might be supported more broadly through payment add-ons to the facilities from Medicaid or Medicare.
Policymakers may wish to consider reporting facilities’ staffing turnover rates on the Nursing Home Compare website, as well as incorporating turnover rates into the five-star staffing rating used by Nursing Home Compare. Residents and their families could use these measures to seek out facilities with more stable nurse staffing. In turn, facilities could be financially incentivized to implement practices to reduce turnover.
Moving forward, PBJ data could be used to calculate additional measures of staffing stability. While “turnover” measures the staff who stop working within a period, “retention” measures those who remain employed through the end of that period. Given the recency of its adoption by Nursing Home Compare, PBJ data can only be used to measure retention since July 1, 2016. However, as nursing homes continue to report such data, an easily interpreted retention measure may be an additional way for consumers to gauge nursing staff stability.
Recent concerns regarding the spread of Coronavirus in care facilities have heightened awareness of the possible implications of nursing staff stability for infection control,(5) which may prove a particularly important consideration during the current pandemic and in future public health emergencies. Facilities with lower turnover rates may be better positioned to withstand challenges, such as absences due to sickness. Staff at such facilities may also be more familiar with the infection control protocols of their facility. Finally, lower turnover likely entails fewer individuals entering the facility, which could limit the spread of infectious disease.
Conclusion
Measurements of nursing staff turnover at nursing homes, derived from newly-available PBJ data, suggest turnover is high nationwide, varies considerably across facilities and regions, and is correlated with numerous organizational characteristics. Moving forward, publicly available nursing staff turnover data may help to incentivize changes to reduce turnover, while providing valuable new information for consumers, policymakers, payors, and other stakeholders.
Appendix Exhibit A: Total nursing staff departure by days to last day of the quarter.
Source: Authors’ analysis of data from the Payroll-Based Journal (PBJ).
Notes: Total nursing staff includes registered nurses, licensed practical nurses and certified nurse aides.
Appendix Exhibit B: Median total nursing staff turnover by overall Nursing Home Compare five-star rating, 2017-2018.
Source: Authors’ analysis of data from the Payroll-Based Journal (PBJ) and Nursing Home Compare.
Notes: The Nursing Home Compare website features a quality rating system for each nursing home, measured on a scale of one to five stars. This rating reflects a facility’s performance on health inspections, staffing levels, and quality measures. Nursing homes that receive five stars are considered to have the highest level of quality.
Turnover is computed based on total nurse staffing, including registered nurses, licensed practical nurses, and certified nurse aides.
We compare the medians of total nursing staff turnover rate using the Mood’s test. The p-values for tests are all less than 0.001, indicating significant difference of medians at different star rating level.
Appendix Exhibit C:
Median staff turnover by organizational characteristics, 2017-2018
| Organizational Characteristic | No. of facilities | RN | LPN | CNA | Nurse Total | |
|---|---|---|---|---|---|---|
| Profit | No | 8818 | 81.77% | 68.47% | 83.50% | 81.30% |
| Yes | 20679 | 110.35% | 82.35% | 102.69% | 100.00% | |
| p-val | < 0.001**** | < 0.001**** | < 0.001**** | < 0.001**** | ||
| Chain-owned | No | 12211 | 90.17% | 70.78% | 90.48% | 87.82% |
| Yes | 17286 | 110.63% | 83.51% | 101.40% | 99.18% | |
| p-val | < 0.001**** | < 0.001**** | < 0.001**** | < 0.001**** | ||
| Urban/Rural | Rural | 8909 | 94.70% | 70.95% | 96.80% | 92.40% |
| Urban | 20489 | 105.30% | 81.29% | 97.43% | 95.78% | |
| p-val | < 0.001**** | < 0.001**** | 0.648 | < 0.001**** | ||
| Medicaid | Q1 | 7377 | 91.94% | 73.68% | 93.30% | 91.09% |
| Q2 | 7379 | 100.80% | 78.12% | 98.01% | 94.67% | |
| Q3 | 7396 | 105.31% | 79.03% | 98.60% | 96.06% | |
| Q4 | 7345 | 110.67% | 80.74% | 99.10% | 97.20% | |
| p-val | < 0.001**** | < 0.001**** | < 0.001**** | < 0.001**** | ||
| Medicare | Q1 | 7378 | 99.71% | 79.23% | 97.33% | 95.14% |
| Q2 | 7391 | 103.55% | 80.67% | 100.90% | 97.55% | |
| Q3 | 7359 | 103.48% | 76.52% | 97.18% | 94.21% | |
| Q4 | 7369 | 100.27% | 76.48% | 93.66% | 92.36% | |
| p-val | < 0.0279** | 0.0142** | < 0.001**** | 0.0014*** | ||
| %<Poverty Rate | Q1 | 7431 | 94.56% | 78.21% | 91.61% | 91.18% |
| Q2 | 7584 | 99.88% | 77.03% | 95.38% | 92.72% | |
| Q3 | 7119 | 103.23% | 79.40% | 101.42% | 97.09% | |
| Q4 | 7363 | 110.37% | 77.89% | 99.76% | 96.95% | |
| p-val | < 0.001**** | 0.557 | < 0.001**** | < 0.001**** | ||
Source: Authors’ analysis of data from the Payroll-Based Journal (PBJ), Brown University’s Long-Term Care Focus (LTCFocus), Certification and Survey Provider Enhanced Reports (CASPER), and U.S. Census Bureau’s Small Area Income and Poverty Estimates (SAIPE).
Notes:
CNA = certified nurse aide; LPN = licensed practical nurse; RN = registered nurse.
The p-values for comparing medians are computed using the Krukal-Wallis test, which assumes that the shapes of the distributions are identical.
The asterisks following the p-values indicate the levels of significance:
p<0.10
p<0.05
p<0.01
p<0.001.
Contributor Information
Ashvin Gandhi, University of California Los Angeles, Anderson School of Management, Los Angeles, California.
Huizi Yu, University of California Los Angeles.
David C. Grabowski, Harvard Medical School, Boston, Massachusetts
REFERENCES
- 1.Institute of Medicine. Nursing Staff in Hospitals and Nursing Homes: Is It Adequate? Washington, D.C.: National Academy Press; 1996. [PubMed] [Google Scholar]
- 2.American Health Care Association. Results of the 2001 AHCA nursing position vacancy and turnover survey. Washington, DC: AHCA, Health Services Research and Evaluation. 2002 [Google Scholar]
- 3.Thomas KS, Mor V, Tyler DA, Hyer K. The relationships among licensed nurse turnover, retention, and rehospitalization of nursing home residents. The Gerontologist. 2013;53(2):211–21. [DOI] [PMC free article] [PubMed] [Google Scholar]
- 4.Castle NG, Engberg J. Staff turnover and quality of care in nursing homes. Med Care. 2005. June;43(6):616–26. [DOI] [PubMed] [Google Scholar]
- 5.Loomer L, Grabowski DC, Gandhi A. Association between Nursing Home Staff Turnover and Infection Control Citations. Working paper 2020. [DOI] [PMC free article] [PubMed] [Google Scholar]
- 6.Geng F, Stevenson DG, Grabowski DC. Daily Nursing Home Staffing Levels Highly Variable, Often Below CMS Expectations. Health Aff (Millwood). 2019;38(7):1095–100. [DOI] [PubMed] [Google Scholar]
- 7.Castle NG, Engberg J. Organizational characteristics associated with staff turnover in nursing homes. Gerontologist. 2006;46(1):62–73. [DOI] [PubMed] [Google Scholar]
- 8.Donoghue C Nursing Home Staff Turnover and Retention. J Appl Gerontol. 2010;29(1):89–106. [Google Scholar]
- 9.Castle NG, Measuring Staff Turnover in Nursing Homes. The Gerontologist. 2006; 46(2): 210–219 [DOI] [PubMed] [Google Scholar]
- 10.Zimmerman S, Gruber-Baldini AL, Hebel JR, Sloane PD, & Magaziner J Nursing home facility risk factors and hospitalization: Importance of registered nurse turnover, administration, and social factors. Journal of the American Geriatrics Society. 2002; 50(12): 1987–1995. [DOI] [PubMed] [Google Scholar]
- 11.Fitzpatrick PG. Turnover of certified nursing assistants: A major problem for long-term care facilities. Hospital Topics. 2002; 80(2): 21–25. [DOI] [PubMed] [Google Scholar]
- 12.Brannon D, Zinn JS, Mor V, Davis J. An Exploration of Job, Organizational, and Environmental Factors Associated with High and Low Nursing Assistant Turnover. The Gerontologist. 2002;42(2):159–168. [DOI] [PubMed] [Google Scholar]
- 13.Gaddy T, & Bechtel GA. Nonlicensed employee turnover in a long-term care facility. The Health Care Supervisor, 1995; 13: 54–60. [PubMed] [Google Scholar]
- 14.Remsberg RE, Armacost KA, & Bennett RG. Improving nursing assistant turnover and stability rates in long-term care facilities. Geriatric Nursing, 1999; 20(4): 203–208. [DOI] [PubMed] [Google Scholar]
- 15.Straker JK, & Atchley RC. Recruiting and retaining frontline workers in long-term care: Usual organizational practices in Ohio. Oxford, OH: Miami University, Scripps Gerontology Center. 1999 [Google Scholar]
- 16.Banaszak-Holl J, & Hines MA. Factors associated with nursing home staff turnover. The Gerontologist,1996; 36(4), 512–517. [DOI] [PubMed] [Google Scholar]
- 17.Harrington C, Swan JH. Nursing home staffing, turnover, and case mix. Med Care Res Rev. 2003. September;60(3):366–92; discussion 393–9. [DOI] [PubMed] [Google Scholar]
- 18.To access the Appendix, click on the Appendix link in the box to the right of the article online.
- 19.Woodhead EL, Northrop L, Edelstein B. Stress, Social Support, and Burnout Among Long-Term Care Nursing Staff. J Appl Gerontol. 2016. January;35(1):84–105. [DOI] [PubMed] [Google Scholar]
- 20.Castle NG, Lin M. Top management turnover and quality in nursing homes. Health Care Manage Rev. 2010;35(2):161–74. [DOI] [PubMed] [Google Scholar]
- 21.Zallman L, Finnegan KE, Himmelstein DU, Touw S, Woolhandler S. Care For America’s Elderly And Disabled People Relies On Immigrant Labor. Health affairs (Project Hope). 2019;38(6):919–26. [DOI] [PubMed] [Google Scholar]
- 22.Miller EA, Wang L, Feng Z, Mor V. Improving direct-care compensation in nursing homes: Medicaid wage pass-through adoption, 1999–2004. J Health Polit Policy Law. 2012;37(3):469–512. [DOI] [PMC free article] [PubMed] [Google Scholar]
- 23.Baughman RA, Smith K. The effect of Medicaid wage pass-through programs on the wages of direct care workers. Medical care. 2010;48(5):426–32. [DOI] [PubMed] [Google Scholar]


