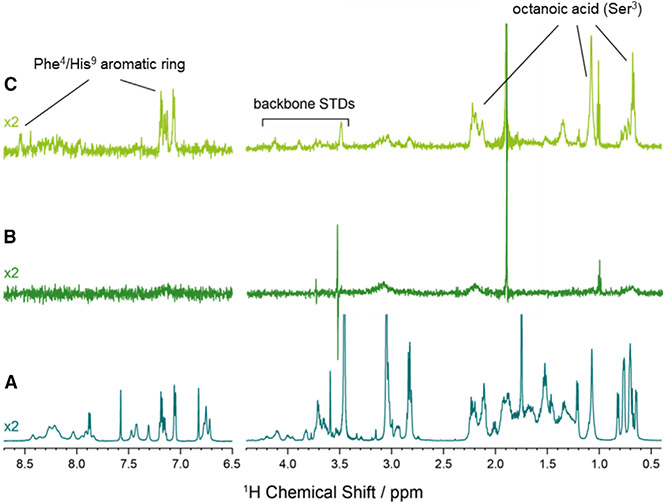
Figure 1. 1H NMR Saturation Transfer Difference Spectroscopy of Ghrelin at GHSR.
(A) 1H NMR spectrum of ghrelin.
(B) 1H STD NMR spectrum of ghrelin in the presence of 5 mM DMPC/DHPC bicelles.
(C) 1H STD NMR spectrum of ghrelin in the presence of 5 mM DMPC/DHPC bicelles with 25 μM GHSR. All NMR spectra were acquired in 50 mM NaP buffer (pH 7) at 20°C.

