Abstract
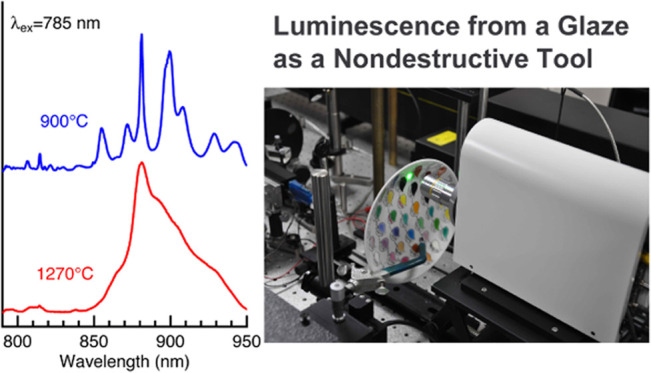
Raman spectroscopy is a powerful technique for a wide range of materials, including porcelain, and near-infrared excitation is often used to suppress a fluorescence background from a sample. When we measured the Raman spectra of porcelains at 785 nm excitation, we observed a strong broad band in a high-frequency region, and its origin was not clearly elucidated. In this study, we have measured the spectra of glazed porcelains at 532, 785, and 1064 nm excitation and demonstrated that the broad feature originates from luminescence around 880 nm and not from Raman scattering. We provide experimental evidence showing that the band originates from a thin layer of glaze. Since the band shape depends on the processing temperature, the luminescence spectra can be a nondestructive probe for studying the glass formation of a glaze.
Introduction
Pottery, porcelain, and ceramic artifacts in general are inorganic, nonmetallic solids prepared by firing and subsequent cooling. They are also composite materials combining crystalline and noncrystalline phases and are usually covered by a thin layer of glaze. The glazing provides a seal, improves the ceramic body’s durability, and serves a decorative function. Because ceramic artifacts are chemically stable and one of the oldest synthetic materials made by human hands, they have been well studied in archeology. In addition, ceramic materials are important in modern industry. Thus, the use of nondestructive techniques in chemical and structural characterization is important for ceramic artifacts, and Raman spectroscopy is one of the most powerful nondestructive methods.
Raman spectroscopy has been used extensively to investigate glazed ceramics and colored glasses,1−4 and it provides information regarding crystalline or glassy structures composed of the covalent bonds between SiO4 tetrahedral units. The Raman spectra of a glaze show two broad bands around 1000 and 500 cm–1, and these are due to the Si–O stretching and bending vibrations, respectively. The intensity ratio of the two bands is correlated to the processing temperature of the kiln and also glaze composition.5 For example, silica-rich glazes exhibit a strong band at ∼500 cm–1, whereas a band at ∼1000 cm–1 dominates for PbO-rich glazes.5,6 Although these features provide useful information, their intensities are weak, making it difficult to use Raman bands as analytical signatures for glazes.
In Raman spectroscopy, the selection of an excitation wavelength is important, since the intensity of the Raman scattering increases as a sample is irradiated with a shorter excitation wavelength.7 Because of this wavelength dependence, a visible excitation, commonly 532 nm, is used. However, a visible excitation often gives rise to a fluorescence that interferes with relatively small Raman signals. For these cases, a longer excitation wavelength such as 785 nm in a near-infrared region is preferred to suppress the fluorescence while retaining relatively high Raman intensities. Raman spectroscopic studies on pottery and porcelain have utilized a visible laser as the main light source. Several studies reported the Raman spectra of ceramic artifacts with near-infrared excitation.3,8−12 These studies showed that the spectra obtained at 785 nm excitation exhibit a broad feature in a high-frequency region around 1300–2000 cm–1, which is not present for visible excitation. This broad feature was noted as fluorescence12 or simply a “glassy silicate”.9 It was also attributed to the excitation of electronic transitions of transition metal ions or rare earth elements.3,11 These assignments were consistent with the specificity to 785 nm excitation,3,9,12 but conclusive evidence has not been reported.
In this study, we have obtained solid experimental evidence that the broad feature is due to photoluminescence around 880 nm and not Raman scattering. We also found that this luminescence arises from a thin layer of glaze. Since the band shape depends on both the firing temperature and the glaze compositions, the luminescence band acts as a potential probe for glazed porcelain.
Results and Discussion
Luminescence Spectra Characteristics of a Glaze
Figure 1 shows the ancient and modern porcelains investigated in the present study. An ancient shard, made during 1650–1670 in Arita, was provided by the Arita Museum of History (Arita, Saga Prefecture, Japan). The modern porcelains (Seto, Japan; Jingdezhen, China; Meissen, Germany; and Karatsu, Japan) were commercially available.
Figure 1.
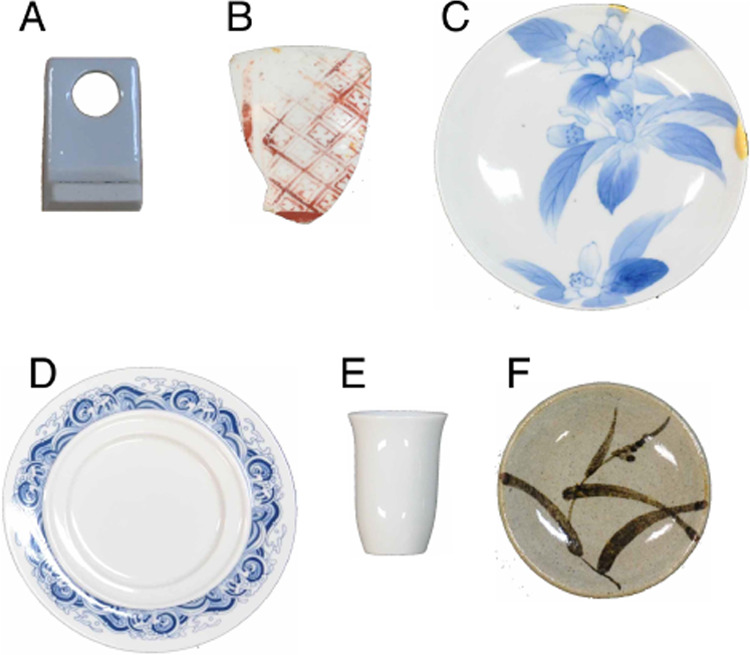
Analyzed glazed porcelain samples. (A) A test sample coated with a wollastonite glaze. (B) An ancient porcelain shard produced in Arita, Japan between 1650 and 1670. (C–F) Commercially available porcelains produced at (C) Seto, Japan, (D) Jingdezhen, China, (E) Meissen, Germany, and (F) Karatsu, Japan.
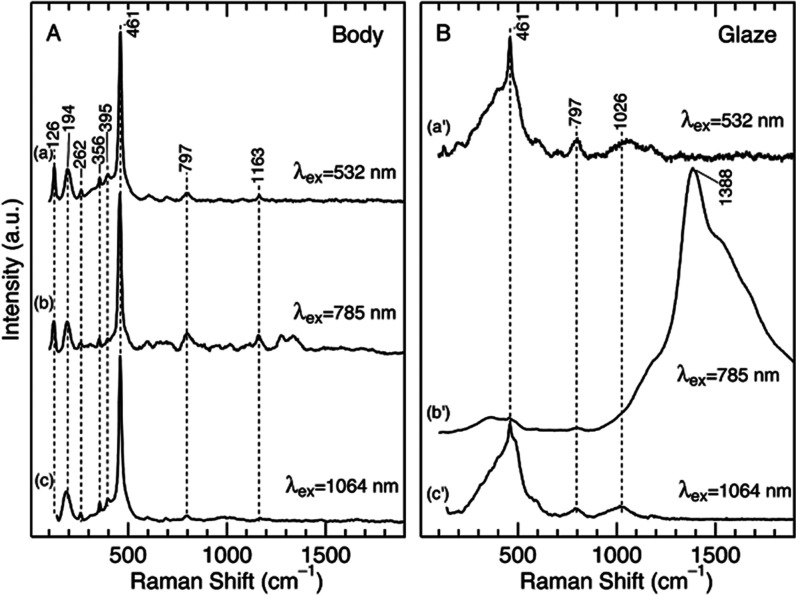
We first measured the Raman/luminescence spectra of a test porcelain sample. This sample was coated with a wollastonite glaze, and its firing temperature was 1270 °C. Figure 2 compares the spectra obtained with 532, 785, and 1064 nm excitation. In these measurements, the sample was cut to make a cross section, and the spectra at the unglazed body (panel A) and the glaze layer (panel B) were selectively measured from the cross section. The Raman spectrum of the body with 532 nm excitation (Figure 2A, trace a) exhibited Raman bands at 126, 194, 461, 797, and 1163 cm–1, and these bands are characteristics of α-quartz (SiO2).13 Similar spectra were also observed with 785 and 1064 nm excitation (traces b and c). These spectral features are commonly observed in modern and ancient porcelains in the Arita area of Japan. In Figure 2B, we show the spectra measured at the glazed layer of the sample. The spectrum with 532 nm excitation exhibits a broad band near 500 cm–1 as the predominant component (trace a’). The broad band shape indicates that the glaze had an amorphous glassy nature. A similar spectral feature at ca. 500 cm–1 was seen in the spectra at 785 and 1064 nm excitation (traces b’ and c’). However, the spectrum at 785 nm excitation exhibits an additional strong band in the range of ca. 1300–2000 cm–1 with a peak maximum near 1390 cm–1. The absence of this intense broad feature in the spectra of the body indicates that it is a unique feature of the glaze.
Figure 2.
Raman/luminescence spectra of a porcelain sample coated by a wollastonite glaze at 532, 785, and 1064 nm excitation. The spectra were measured at (A) the body and (B) the glaze portions of a cross section of the sample.
Next, we consider the origin of the intense broad band associated with the glaze. In some cases, glazed porcelains show broad Raman bands due to amorphous carbon,14 which typically exhibits bands between 1340–1400 and 1540–1600 cm–1.15 The frequency for amorphous carbon roughly corresponds to that for the broad feature of the glaze. We can, however, rule out this possibility because the Raman bands of amorphous carbon should appear at all three excitation wavelengths. Thus, it is possible that the broad feature originates from a resonance enhancement of a Raman scattering or the photoluminescence of an unknown chemical species under 785 nm excitation.
Raman spectroscopy is based on an inelastic light scattering, and the difference in energy between the incident and scattered lights, which is called the Raman shift, is independent of the excitation wavelength. This implies that the absolute wavelengths of the scattered light differ when we use a different excitation wavelength. On the other hand, the wavelength of luminescence is independent of the wavelength of the incident light. Thus, a straightforward experiment that discriminates the two mechanisms would involve measurements at different excitation wavelengths. For this purpose, we used a test porcelain sample that exhibits a relatively sharp band in the high-frequency region and measured its spectra by two near-infrared Raman spectrometers that have different excitation wavelengths: 785.4 and 784.8 nm. Figure 3 shows the spectra measured with the different excitation wavelengths. These spectra were taken at the glazed surface of the sample. Since the incident laser light penetrated into the body, both the α-quartz Raman band from the body (∼814 nm) and the broad feature from the glaze (850–950 nm) were observed. In this figure, the spectral intensity is plotted against the horizontal axis of the absolute wavelength (nm), and the broad feature due to the glaze exhibits the same peak position of 880.7 nm. In contrast, the Raman band of α-quartz was observed at different wavelengths of 814.8 and 814.2 nm when the excitation wavelengths were changed. These observations indicate that the intense broad band due to the glaze is luminescence and not Raman scattering. In Figure S1 in the Supporting Information, we also show the same spectra with the horizontal axis of the Raman shift (cm–1). This is a common format for showing Raman spectra, and the Raman band of α-quartz at 461 cm–1 is observed at the same frequency. However, the broad band from the glaze is shifted when the excitation wavelength is changed, confirming that a porcelain glaze exhibits luminescence at ∼880 nm with 785 nm excitation.
Figure 3.
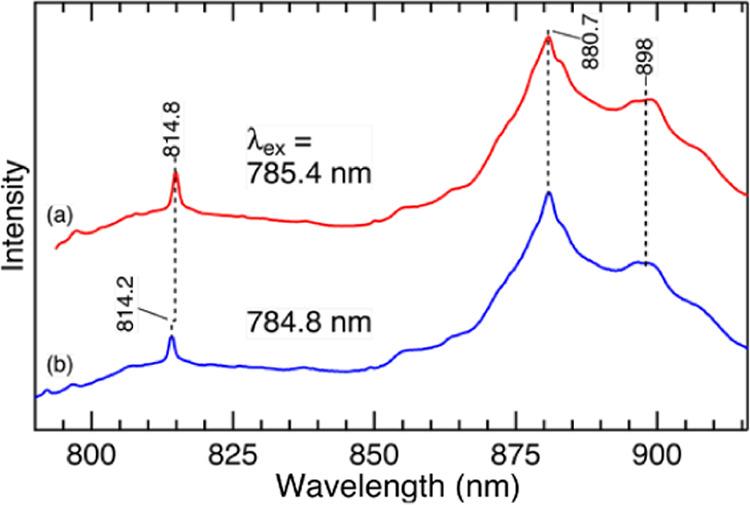
Raman/luminescence spectra of a glazed porcelain sample with 785.4 and 784.8 nm excitation. The spectra were measured at the surface of the sample. The horizontal axis was shown as the absolute wavelength (nm).
Luminescence at Near-Infrared Excitation Is General for a Glaze
Next, we examine whether the luminescence at ∼880 nm is general to most porcelain glazes or specific to a wollastonite glaze in Arita, Japan. For this purpose, we measured the Raman/luminescence spectra of several porcelain samples, which Figure 4 compares. The selected samples include an ancient porcelain shard produced in Arita and modern porcelains produced at Seto (Japan), Jingdezhen (China), Meissen (Germany), and Karatsu (Japan). As shown in the figure, all porcelain samples examined here exhibit broad bands at 850–950 nm. A similar feature was also observed for Medici3,8 and ancient Chinese porcelains.9,11 These observations imply that the luminescence band is generally observed for glazed porcelains. This result is reasonable since a similar broad feature near 880 nm at 785 nm excitation has also been observed for a glass material16,17 and obsidian.18 It is therefore likely that the luminescence band is generally observed for a glassy silicate produced from natural raw materials.
Figure 4.
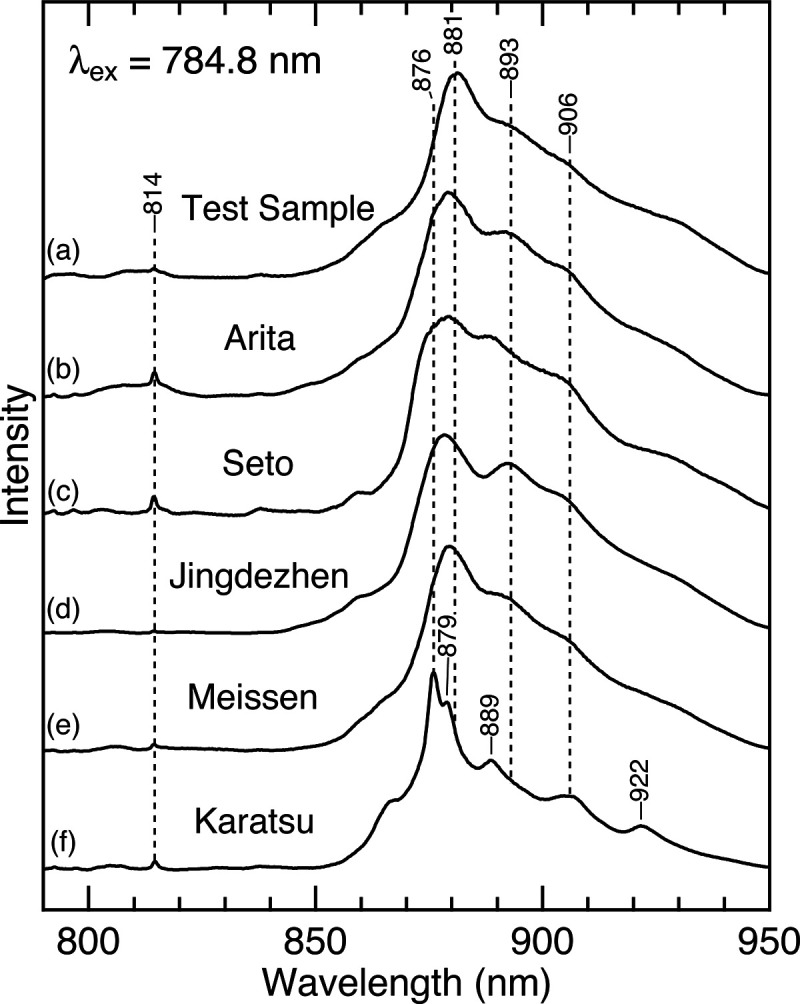
Raman/luminescence spectra of the glazed porcelain samples with 784.8 nm excitation. (a) A test sample coated with a wollastonite glaze. (b) An ancient porcelain shard produced in Arita, Japan between 1650 and 1670. Modern porcelains from (c) Seto, Japan, (d) Jingdezhen, China, (e) Meissen, Germany, and (f) Karatsu, Japan.
Here, we note that there are detectable differences in the luminescence spectra shown in Figure 4. For instance, the band maximum for the porcelain from Meissen is blue shifted by ∼2 nm compared to that for the wollastonite glaze (traces e and a). More strikingly, the spectrum for the porcelain from Karatsu shows distinct bands at 876, 879, 889, 906, and 922 nm (trace f), which are not seen in the wollastonite glaze. The present result is consistent with a previous finding for Medici porcelains, in which relatively sharp bands were observed in the soft (more crystalline) body, whereas broad bands were seen in the glaze (glassy phase).3,8 The origin of these spectral differences is unknown, but Colomban3 suggested that the luminescence band arises from 3d or 4f ion-doping. Analogously, previous reports on a glass material speculated16,17 that a similar feature is the result of a trace amount of rare earth elements. The identification of the luminescent center is beyond the scope of the present study, but we will undertake it in future studies.
Luminescence from a Glaze as an Analytical Tool
A glaze is a thin layer of silicate glass that covers a porcelain body, and its Raman spectra are broad and weak in intensity. These spectroscopic features make it difficult to measure a glaze’s Raman spectrum; a sophisticated confocal Raman setup is usually required.1,2 In contrast, the intensity of the luminescence reported here is relatively strong. We, therefore, expected that the luminescence spectra with 785 nm excitation act as a nondestructive analytical tool for studying glaze characteristics such as processing temperature. To explore this idea, we examined the effect of the processing temperature on the Raman/luminescence spectra of porcelain samples coated by a wollastonite glaze. The data shown in Figure 5 indicate that the processing temperature significantly affects the luminescence bands around 850–950 nm. These results can be summarized in two points. First, the luminescence spectra of the glaze prepared under lower processing temperatures (900–1100 °C) consist of several distinct bands at 849, 855, 871, 881, 899, and 908 nm. As the temperature increases (>1200 °C), these spectral features become less clear, and a broad band centered at ∼880 nm is observed. The broad spectral feature demonstrates a glassy nature at higher temperatures, implying that the luminescence spectra reflect a melting process (i.e., glass transition) of the glaze. Second, careful inspection of the spectra in Figure 5 shows that the relative intensities of the luminescence band at 880 nm and the Raman band at 461 cm–1 (814 nm) vary when the processing temperatures are changed. Although quantitative analysis is difficult because the thickness of the glaze layer may differ among the samples, the photoluminescence intensity increases with the processing temperature. This result suggests that the glass transition may alter a change in the local environments of photoluminescence centers.
Figure 5.
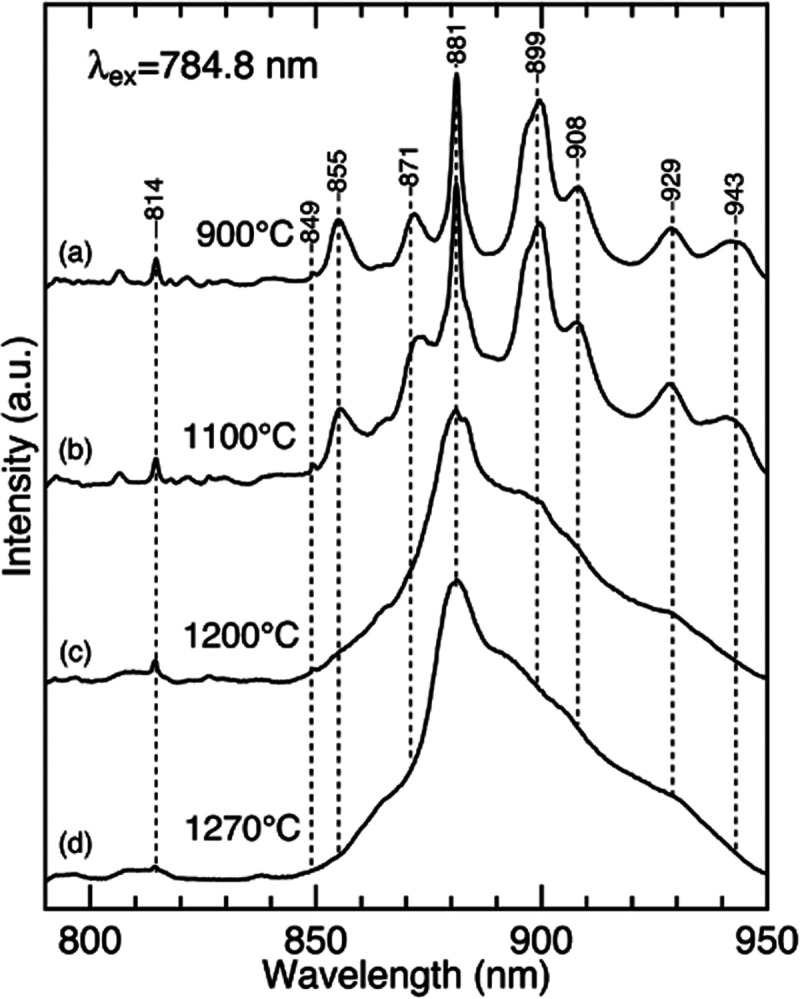
Raman/luminescence spectra of the porcelain samples that are coated by a wollastonite glaze. The processing temperatures are (a) 900, (b) 1100, (c) 1200, and (d) 1270 °C. The spectra were obtained with 784.8 nm excitation.
In summary, we have shown that glazed porcelains exhibit a broad luminescence band around 850–950 nm that appears when a glaze layer is excited at 785 nm. This band is assigned to luminescence because the band did not shift when the sample was excited at slightly different incident wavelengths. The present finding is consistent with a previous suggestion that the feature observed with near-infrared excitation is due to luminescence,3,8,9,11 and we provided unambiguous experimental evidence for this conclusion. In a further investigation, we have found that the processing temperature significantly affects the luminescence spectra. Since its intensity is distinctly large compared to Raman intensities, the luminescence spectra can be a potential nondestructive marker for the processing temperature of a porcelain glaze.
Experimental Section
Sample Preparation
The test samples of glazed porcelain as well as modern and ancient porcelains were used in the present study. The body of the test samples was prepared with Amakusa porcelain clay, and a wollastonite glaze was used. This glaze is commonly used in Arita, the center of porcelain production in Japan. The studied glazes had the following compositions: 25% feldspar (Taishu), 25% feldspar (Masuda), 21% silica stone, 14% wollastonite, 8% kaolin (New Zealand), 4% limestone, and 2% potters stone (Amakusa). The samples were fired under a reducing atmosphere (10% CO, 80% N2) between 900 and 1270 °C in a gas-fired kiln.
Raman/Luminescence Measurements
Four Raman spectrometer systems were used to measure the Raman/luminescence spectra. The spectra at 532 nm excitation were obtained by a backscattering Raman spectrometer consisting of a microscopy unit (COMET; Photon Design Co.), a diode-pumped solid-state (DPSS) laser (Cobolt Samba 04-01; HÜBNER Photonics), and a 0.3 m imaging spectrograph (SpectraPro 2300i; Princeton Instruments) equipped with a thermoelectrically cooled charge-coupled device (CCD) detector (PIXIS: 256E; Teledyne Princeton Instruments).
Most of the spectra at 785 nm excitation were measured by a near-infrared Raman spectrometer.19 The excitation light at 784.8 nm was obtained from a diode laser (iBeam-smart-785; Toptica), and backscattered light was collected by collection optics. The spectra were obtained by a lens spectrograph (Acton LS 785; Princeton Instruments) equipped with a thermoelectrically cooled CCD detector (PIXIS: 256E; Teledyne Princeton Instruments). We also measured near-infrared Raman/luminescence spectra with 785.4 nm excitation. For this measurement, we used a spectrometer system that was originally designed to measure Raman optical activity spectra.20,21 This instrument consists of the same type of lens spectrograph (Acton LS 785) equipped with a thermoelectrically cooled CCD detector (PIXIS: 400BR eXcelon; Teledyne Princeton Instruments) and a diode laser (Cobolt 08-NLD 785 nm; HÜBNER Photonics).
A 1064 nm light from a DPSS laser (Cobolt, Rumba 05–01; HÜBNER Photonics) was used to measure the Raman spectra with this excitation wavelength. The backscattered light from the sample was collected by an aspheric glass condenser lens and refocused by an achromatic lens to the end of a single core fiber with a core diameter of 200 μm. A long-pass edge filter (OD > 6; Semrock Inc.) rejected the laser light before the refocusing lens. The light was directed into a spectrometer (SpectraPro HRS-300; Teledyne Princeton Instruments) equipped with an InGaAs array detector (iDus-1.7; Andor).
The Raman spectra were calibrated using neat fenchone as a standard sample. The emission spectra from a neon lamp were used to calibrate the spectra in an absolute nanometer unit.
Acknowledgments
The authors acknowledge Prof. Takanori Watari for his valuable suggestions.
Supporting Information Available
The Supporting Information is available free of charge at https://pubs.acs.org/doi/10.1021/acsomega.1c00322.
Raman/luminescence spectra of a glazed porcelain sample (PDF).
Author Contributions
∥ S.K., T.T., and H.M. contributed equally to this work.
The authors declare no competing financial interest.
Supplementary Material
References
- Liem N. Q.; Sagon G.; Quang V. X.; Tan H. V.; Colomban P. Raman Study of the Microstructure, Composition and Processing of Ancient Vietnamese (Proto)Porcelains and Celadons (13–16th Centuries). J. Raman Spectrosc. 2000, 31, 933–942. . [DOI] [Google Scholar]
- Liem N. Q.; Thanh N. T.; Colomban P. Reliability of Raman Micro-Spectroscopy in Analysing Ancient Ceramics: The Case of Ancient Vietnamese Porcelain and Celadon Glazes. J. Raman Spectrosc. 2002, 33, 287–294. 10.1002/jrs.854. [DOI] [Google Scholar]
- Colomban P. Raman μ-Spectrometry, A Unique Tool for On-Site Analysis and Identification of Ancient Ceramics and Glasses. Mater. Res. Soc. Symp. Proc. 2004, 852, OO8.3 10.1557/PROC-852-OO8.3. [DOI] [Google Scholar]
- Colomban P. The Destructive/Non-Destructive Identification of Enameled Pottery, Glass Artifacts and Associated Pigments—A Brief Overview. Arts 2013, 2, 77–110. 10.3390/arts2030077. [DOI] [Google Scholar]
- Colomban P. Polymerization Degree and Raman Identification of Ancient Glasses Used for Jewelry, Ceramic Enamels and Mosaics. J. Non-Cryst. Solids 2003, 323, 180–187. 10.1016/S0022-3093(03)00303-X. [DOI] [Google Scholar]
- Colomban P.; Tournie A.; Bellot-Gurlet L. Raman Identification of Glassy Silicates used in Ceramics, Glass and Jewellery: A Tentative Differentiation Guide. J. Raman Spectrosc. 2006, 37, 841–852. 10.1002/jrs.1515. [DOI] [Google Scholar]
- Griffiths P. R.Introduction to Vibrational Spectroscopy. In Handbook of Vibrational Spectroscopy; John Wiley & Sons, Ltd.: Chichester, 2002; pp 33–43. [Google Scholar]
- Colomban P.; Milande V.; Lucas H. On-Site Raman Analysis of Medici Porcelain. J. Raman Spectrosc. 2004, 35, 68–72. 10.1002/jrs.1085. [DOI] [Google Scholar]
- Widjaja E.; Lim G. H.; Lim Q.; Mashadi A. B.; Garland M. Pure Component Raman Spectral Reconstruction from Glazed and Unglazed Yuan, Ming, and Qing Shards: A Combined Raman Microscopy and BTEM Study. J. Raman Spectrosc. 2011, 42, 377–382. 10.1002/jrs.2721. [DOI] [Google Scholar]
- Colomban P.; Ambrosi F.; Ngo A.-T.; Lu T.-A.; Feng X.-L.; Chen S.; Choi C.-L. Comparative Analysis of Wucai Chinese Porcelains Using Mobile and Fixed Raman Microspectrometers. Ceram. Int. 2017, 43, 14244–14256. 10.1016/j.ceramint.2017.07.172. [DOI] [Google Scholar]
- Carter E. A.; Wood M. L.; de Waal D.; Edwards H. G. M. Porcelain Shards from Portuguese Wrecks: Raman Spectroscopic Analysis of Marine Archaeological Ceramics. Heritage Sci. 2017, 5, 17 10.1186/s40494-017-0130-9. [DOI] [Google Scholar]
- Simsek G.; Unsalan O.; Bayraktar K.; Colomban P. On-Site pXRF Analysis of Glaze Composition and Colouring Agents of “Iznik” Tiles at Edirne Mosques (15th and 16th-Centuries). Ceram. Int. 2019, 45, 595–605. 10.1016/j.ceramint.2018.09.213. [DOI] [Google Scholar]
- Scott J. F.; Porto S. P. S. Longitudinal and Transverse Optical Lattice Vibrations in Quartz. Phys. Rev. 1967, 161, 903–910. 10.1103/PhysRev.161.903. [DOI] [Google Scholar]
- Kock L. D.; Waal D. D. Raman Studies of the Underglaze Blue Pigment on Ceramic Artefacts of the Ming Dynasty and of Unknown Origins. J. Raman Spectrosc. 2007, 38, 1480–1487. 10.1002/jrs.1805. [DOI] [Google Scholar]
- Dresselhaus M. S.; Jorio A.; Saito R. Characterizing Graphene, Graphite, and Carbon Nanotubes by Raman Spectroscopy. Annu. Rev. Condens. Matter Phys. 2010, 1, 89–108. 10.1146/annurev-conmatphys-070909-103919. [DOI] [Google Scholar]
- Fikiet M. A.; Tuschel D.; Ermolenkov V. V.; Lednev I. K. Clarifying Glass Luminescence at Near-Infrared Excitation. Appl. Spectrosc. 2020, 74, 187–192. 10.1177/0003702819879109. [DOI] [PubMed] [Google Scholar]
- Kamemoto L. E.; Misra A. K.; Sharma S. K.; Goodman M. T.; Luk H.; Dykes A. C.; Acosta T. Near-Infrared Micro-Raman Spectroscopy for in Vitro Detection of Cervical Cancer. Appl. Spectrosc. 2010, 64, 255–261. 10.1366/000370210790918364. [DOI] [PMC free article] [PubMed] [Google Scholar]
- Kelloway S. J.; Kononenko N.; Torrence R.; Carter E. A. Assessing the Viability of Portable Raman Spectroscopy for Determining the Geological Source of Obsidian. Vib. Spectrosc. 2010, 53, 88–96. 10.1016/j.vibspec.2010.02.006. [DOI] [Google Scholar]
- Sato T.; Kikukawa T.; Miyoshi R.; Kajimoto K.; Yonekawa C.; Fujisawa T.; Unno M.; Eki T.; Hirose Y. Protochromic Absorption Changes in the Two-Cysteine Photocycle of a Blue/Orange Cyanobacteriochrome. J. Biol. Chem. 2019, 294, 18909–18922. 10.1074/jbc.RA119.010384. [DOI] [PMC free article] [PubMed] [Google Scholar]
- Haraguchi S.; Shingae T.; Fujisawa T.; Kasai N.; Kumauchi M.; Hanamoto T.; Hoff W. D.; Unno M. Spectroscopic Ruler for Measuring Active-Site Distortions Based on Raman Optical Activity of a Hydrogen out-of-Plane Vibration. Proc. Natl. Acad. Sci. U.S.A. 2018, 115, 8671–8675. 10.1073/pnas.1806491115. [DOI] [PMC free article] [PubMed] [Google Scholar]
- Matsuo J.; Kikukawa T.; Fujisawa T.; Hoff W. D.; Unno M. “Watching” a Molecular Twist in a Protein by Raman Optical Activity. J. Phys. Chem. Lett. 2020, 11, 8579–8584. 10.1021/acs.jpclett.0c02448. [DOI] [PubMed] [Google Scholar]
Associated Data
This section collects any data citations, data availability statements, or supplementary materials included in this article.


