

Abstract

Surface-enhanced vibrational spectroscopy strongly increases the cross section of Raman scattering and infrared absorption, overcoming the limited sensitivity and resolution of these two powerful analytic tools. While surface-enhanced setups with maximum enhancement have been studied widely in recent years, substrates with reproducible, uniform enhancement have received less attention although they are required in many applications. Here, we show that plasmonic supercrystals are an excellent platform for enhanced spectroscopy because they possess a high density of hotspots in the electric field. We describe the near field inside the supercrystal within the framework of plasmon polaritons that form due to strong light-matter interaction. From the polariton resonances we predict resonances in the far-field enhancement for Raman scattering and infrared absorption. We verify our predictions by measuring the vibrations of polystyrene molecules embedded in supercrystals of gold nanoparticles. The intensity of surface-enhanced Raman scattering is uniform within 10% across the crystal with a peak integrated enhancement of up to 300 and a peak hotspot enhancement of 105. The supercrystal polaritons induce pairs of incoming and outgoing resonances in the enhanced cross section as we demonstrate experimentally by measuring surface-enhanced Raman scattering with multiple laser wavelengths across the polariton resonance. The infrared absorption of polystyrene is likewise enhanced inside the supercrystals with a maximum enhancement of 400%. We show with a coupled oscillator model that the increase originates from the combined effects of hotspot formation and the excitation of standing polariton waves. Our work clearly relates the structural and optical properties of plasmonic supercrystals and shows that such crystals are excellent hosts and substrates for the uniform and predictable enhancement of vibrational spectra.
Keywords: supercrystals, gold nanoparticles, plasmonics, polariton, surface-enhanced Raman scattering (SERS), surface-enhanced infrared absorption spectroscopy (SEIRAS), coupled oscillator
Plasmonic supercrystals are highly ordered three-dimensional assemblies of plasmonic nanoparticles.1−3 Light inside these supercrystals gets tightly confined into regularly arranged hotspots for the electric field.1,4−6 This enhances the light-matter interaction of molecules inside the supercrystal. The large density of hotspots is especially beneficial for vibrational spectroscopy, with its weak cross section.7 Indeed, a high sensitivity and a reproducible near-field enhancement in supercrystals were demonstrated for surface-enhanced Raman scattering (SERS).8−11 Supercrystals of gold nanorods were used for the quantitative detection of prions with a sensitivity in the zeptomolar regime8 and the label-free in situ imaging of quorum sensing in bacterial biofilms.10 The high density of hotspots is also beneficial for surface-enhanced infrared absorption spectroscopy (SEIRAS).12,13 It was shown that two-dimensional plasmonic superlattices possess broadband enhancement in the mid-infrared (IR) spectral range by the lightning-rod effect as well as plasmonic resonances in the visible, which enabled the combination of SERS and SEIRAS on a single substrate.14,15 The potential of three-dimensional plasmonic supercrystals for SEIRAS has not been explored yet.
The rational design of plasmonic supercrystals as substrates for enhanced vibrational spectroscopy requires a thorough understanding of their optical properties.11,16 We recently demonstrated that three-dimensional plasmon polaritons determine the optical response of the supercrystals.3 These excitations arise from a hybridization of the collective plasmonic states with free space photons.3,17−20 The polariton dispersion determines the effective refractive index and thus the wavelength of light inside the supercrystal. A polaritonic band gap prevents light from entering the crystal in the visible spectral range if the crystal has a sufficiently large metal volume fill fraction.3,21 In the near- and mid-IR the plasmon polaritons propagate through the crystal. The propagating modes are confined by the crystal boundaries, which leads to the formation of standing waves.3,22 This gives rise to pronounced optical resonances that can be tuned by choice of film thickness, nanoparticle geometry and substrate.3,21−23 On the basis of simulations, it was demonstrated that plasmonic hot spots can extend through the bulk of the crystal with a spatial distribution resembling the standing waves.4,24 This highlights that molecules across the entire bulk of the crystal can be probed by vibrational spectroscopy.1,16 However, the implications of polariton formation for vibrational spectroscopy have not been studied systematically.
Here, we show that plasmon polaritons induce electromagnetic near-field enhancement in three-dimensional (3D) gold supercrystals, all the way from the visible to the mid-IR. We synthesize gold nanoparticle supercrystals by self-assembly on a liquid subphase using polystyrene ligand molecules as spacers between the nanoparticles. With optical spectroscopy and finite-difference time-domain (FDTD) simulations we draw a connection between the far-field spectra and the near-field enhancement inside the supercrystals. In the near- and mid-IR, plasmon polaritons lead to a resonant near-field enhancement in the bulk of the crystals. In the visible, the polaritonic stop band restricts the enhancement to the surface of the supercrystal. We access the averaged near-field enhancement inside the supercrystals experimentally through the vibrational spectra of the polystyrene ligand molecules. By using Raman spectroscopy with tunable excitation wavelength, we measure pronounced SERS resonances in the near-infrared that correlate with the optical spectra of the supercrystals. We analyze the SERS enhancement by comparison to FDTD simulations and show that it arises from overlapping incoming- and outgoing polaritonic Raman resonances. This leads to a blue shift (60–80 meV) of the peak SERS enhancement (1–3 × 10²) with respect to the polariton energies. The polaritonic resonances of multilayered supercrystals enhance the IR-active vibrations of the polystyrene molecules, which we probe with SEIRAS. The IR absorption increases by 400% when a polaritonic resonance matches the molecular vibrations. We explain the enhancement with a coupled oscillator model that provides design rules for plasmonic supercrystals with resonant SEIRAS enhancement.
Results and Discussion
Synthesis and Optical Properties of 3D Gold Nanoparticle Supercrystals
We synthesize supercrystals via the self-assembly of gold nanoparticles on a liquid subphase for excellent structural order and small interparticle gaps (see the Methods).25−27 The gold nanoparticles are functionalized with thiolated polystyrene molecules that stabilize the supercrystals and act as spacers between the nanoparticles. Figure 1a shows a transmission electron microscopy (TEM) image of gold nanospheres with 63 nm diameters that are assembled into a hexagonally close packed monolayer. The nanoparticles are separated by 1–4 nm gaps, that are determined by an interplay of repulsive forces from the polystyrene molecules and van der Waals attraction between the gold nanoparticles.25,26 By slowing the rate of self-assembly and increasing the nanoparticle concentration, we trigger the formation of 3D supercrystals (Figure 1b).3,25
Figure 1.

Plasmon polaritons in thin films of 3D gold nanoparticle supercrystals. (a) Transmission electron microscopy image of a monolayer of gold nanoparticles self-assembled into a hexagonally close-packed lattice. (b) Scanning electron microscopy image of five nanoparticle layers packed into an fcc supercrystal. The nanoparticle diameters in (a) and (b) are 63 nm.25 (c) Optical reflectance and (d) transmittance as a function of excitation energy and number of stacked nanoparticle layers measured on crystals of 63 nm gold nanoparticles. (e) Sketch of standing waves that form inside a thin plasmonic supercrystal. The standing waves are labeled by the number of nodes j and highlighted by dashed lines in (c) and (d). The data in (c) and (d) were taken from the repository 10.17169/refubium-26819.
We characterize the supercrystals optically with microabsorbance spectroscopy (see Methods).3,22 The optical contrast in transmittance and the scattering at the layer step edges allow us to identify supercrystals of different thicknesses with optical microscopy (Figure S1). Figure 1c shows the reflectance as a function of excitation energy and crystal thickness. A polaritonic stop band is visible as a spectral range of constant and large reflectance. It arises from deep strong light-matter coupling for the plasmonic excitations.3 In this spectral range, light cannot enter the crystal and will only excite plasmonic modes in the uppermost layer. The stop band is overlaid by interband transitions of gold for energies >2.2 eV.28 A series of reflection dips in the near-infrared comes from the optical excitation of plasmon polaritons that propagate through the crystal and form standing waves.3,4,22,24 A polariton resonance occurs at wavelengths λpp = 2h/j, where h is the thickness of the supercrystal film and j integer. A film that consists of NL stacked nanoparticle layers supports NL – 1 polariton resonances with j = 1, 2, ..., NL – 1 (Figure 1e). Increasing the crystal thickness leads to a red shift and the activation of additional polariton resonances (see the dashed lines in Figure 1c).3,22 Defects and imperfections lead to a broadening of the polariton resonances.22,23,25 The resonant excitation of polaritons facilitates the propagation of light through the crystal in the near-infrared, where each reflectance dip is accompanied by a transmittance maximum (Figure 1d). The transmittance can be as high as 80% and increases toward the mid-infrared.6 Close to the polaritonic stop band, in contrast, light is mainly absorbed by the crystal (Figure S2). In a previous work we determined the polariton dispersion ωpp = 2πc/λpp which lets us predict the polariton resonance energies ωj for any crystal thickness h.3
Simulated Near-Field Enhancement in Plasmonic Supercrystal Films
We now analyze the distribution of the electric field and the field enhancement inside a plasmonic supercrystal by FDTD simulations. Figure 2a shows the electric field amplitude in an fcc crystal of gold nanospheres at energies where polaritons are resonantly excited (dashed lines in Figure 2c and Figure S3). The standing wave character of the electric field amplitude is clearly visible. The electric field amplitude is symmetrically distributed without depletion toward the bottom of the supercrystal for excitation energies in the near-infrared (0.5 and 1.14 eV in Figure 2). The internal wavelength decreases with increasing excitation energy and equals twice the nanoparticle layer distance close to the onset of the polaritonic band gap (see 1.37 eV in Figure 2a and j = 5 in Figure 1e). This corresponds to an increase in effective refractive index from n(0.50 eV) = 4.1 to n(1.37 eV) = 9.0. The strong dispersion of the polaritons close to the band gap, i.e., the fast increase of the refractive index, gives rise to losses that are visible as a decaying field amplitude in Figure 2a, 1.37 eV. For excitation energies in the polaritonic band gap, light cannot enter the crystal and the electric field amplitude is only enhanced in the uppermost layers (2.11 eV in Figure 2a).
Figure 2.

Simulated near-field enhancement in films of 3D gold supercrystals. (a) Field amplitude enhancement Re[Ey(r)] as a function of position inside an fcc supercrystal that is six layers thick. The plasmon polaritons are visible as standing waves (0.5–1.37 eV). Light cannot enter the crystal at energies of the polaritonic stop band (2.11 eV). The field enhancement is truncated to values from −10 to +10 for better visualization. The polarization of the incident light was chosen along y. The scale bar is 30 nm. (b) Top and side view of the plasmonic supercrystal. The plane in which the field enhancement was evaluated is highlighted by red lines. (c) Electric field intensity enhancement in the hot spots of the supercrystal. The field enhancement was calculated in the hotspots of the uppermost nanoparticle layer (blue, surface) and as the mean value of the enhancement in the hot spots of all layers (red, bulk). The polarization of the incident light was chosen along x. Dashed lines show the energies of the plots in (a). Parameters: 60 nm nanoparticle diameters, 1.5 nm interparticle gaps, background refractive index of nm = 1.4, layer stacking along [111].
Light is strongly confined inside a plasmonic supercrystal.4,6,24,29 The electric field is situated outside the plasmonic nanoparticles because of the large dielectric contrast of metals and dielectrics in the near-infrared (Figure 2a). The near-field interaction between neighboring nanoparticles leads to a further confinement into hot spots at the interparticle gaps. This results in a thousandfold increase in electric field intensity, which we evaluate as a function of excitation energy in Figure 2c. We calculate the enhancement in the bulk of the crystal as the mean value of the enhancement in the hot spots of all layers (Figure 2c, red). The enhancement depends strongly on wavelength; it peaks at the resonance energies of the polaritons. The largest enhancement factors coincide with the absorption maxima and reflectance dips in the optical spectra (Figure S3). We also evaluate the electric field enhancement at the supercrystal surface, i.e., in the hotspots of the uppermost layer (Figure 2c, blue). Interestingly, the enhancement tracks that of the bulk in the near-infrared with even more pronounced polaritonic resonances. This shows that the optical properties of the bulk also determine the field enhancement at the surface of the crystal, which is highly relevant to experiments where an analyte is drop casted on the surface of the crystal. The situation is different in the spectral range of the polaritonic band gap. While the field enhancement is suppressed in the bulk, pronounced resonances occur at the crystal surface with a field enhancement similar to the near-infrared for the present geometry. The origin of those are higher-order plasmon resonances in the top nanoparticle layer, such as quadrupoles and hexapoles, that do not depend on the boundary conditions of the crystal (see Figure 2a, 2.11 eV). These resonances are beneficial for sensing applications in the visible spectral range. Polaritonic resonances in the near-infrared, on the other hand, provide enhancement in the tissue transparency window that is relevant for biological applications.30 While the field enhancement at the crystal surface is independent of the crystal thickness in the visible, it can be tuned by the number of nanoparticle layers in the near-infrared (see Figure S4).
Probing the Near-Field Enhancement with Wavelength-Scanned SERS
In the following, we probe the near-field enhancement in plasmonic crystals with surface-enhanced Raman spectroscopy of the polystyrene ligand molecules. Figure 3a shows a SERS line scan over the step edge from a monolayer (bottom) to a bilayer (top) of close-packed gold nanospheres with 50 nm diameters. The spectra were recorded with a laser excitation energy of 1.42 eV. The most prominent SERS peaks are the C–C–C ring-bending mode of polystyrene at 1000 cm–1 and the hydrogen bending mode at 1029 cm–1.31,32 The enhanced scattering is very uniform; the SERS intensity varies by less than 10% when changing the position on the bilayer or monolayer (Figure 3a, inset). This shows the high repeatability of SERS on plasmonic crystals, that originates from the large number of hot spots that are probed within each measurement spot.1 Naturally, the spatial distribution of the SERS intensity depends also on the distribution of probe molecules within the crystal, which requires optimizing molecular diffusion for future applications.1,33 The SERS intensity measured on the bilayer is an order of magnitude larger than for the monolayer, even though the bilayer contains only twice as many molecules. To find the origin of this enhancement we measure the reflectance spectra of the mono- and bilayer (Figure 3b). The spectrum of the bilayer contains a pronounced reflectance dip at 1.34 eV (Figure 3b, red) because of a j = 1 polariton resonance (Figure 3b, inset).22,23 The dip is absent for the monolayer, because a monolayer does not support polaritonic resonances (Figure 3b, black).22 This suggests that the polariton resonance of the bilayer leads to the additional SERS enhancement.
Figure 3.

Polariton-mediated SERS resonances. (a) SERS spectra of the polystyrene ligand molecules in a supercrystal of gold nanoparticles with diameters of 50 nm. The spectra are a line scan from a monolayer (bottom) to a bilayer (top) of close-packed nanoparticles. The laser excitation energy was 1.42 eV. The inset shows the peak areas of the two SERS modes as a function of position. (b) Reflectance spectra of a bi- (red) and a monolayer (black) of 50 nm gold nanoparticles. The inset shows the j = 1 polariton mode that is excited in the bilayer. (c) SERS enhancement measured on the bi- (red dots, left y axis) and monolayer (black dots) as a function of excitation energy. The solid lines are FDTD simulations of the SERS enhancement (right axis), calculated as the average of the local enhancement at the positions of all polystyrene molecules inside the plasmonic crystal. (d, e) Same as (b, c) but for a tri- (blue) and monolayer (black) of close-packed gold nanoparticles with diameters of 63 nm. The j = 2 polariton mode is excited (see inset). The gap sizes were 2.6 nm for the FDTD simulations in (c) and 3.7 nm in (e).
To find a relationship between the polariton resonance and SERS, we determine the wavelength dependence of the SERS enhancement. We use a Raman spectrometer with fully tunable laser excitation to measure the SERS intensity as a function of excitation energy (Methods, Figure S5).34,35 To determine a SERS enhancement factor we divide the peak area of the C–C–C ring bending mode at 1000 cm–1 by a reference spectrum of bulk polystyrene and correct for the different number of molecules (see the Methods and Supporting Information).36,37 The SERS enhancement as a function of excitation energy, Figure 3c, has a pronounced resonance for the bilayer with a peak enhancement factor of 2.8 × 10². This SERS resonance is clearly assigned to the j = 1 polariton resonance of the bilayer. It is blue-shifted with respect to the reflectance minimum by 80 meV. The SERS enhancement by the monolayer, in contrast, does not track a resonance and scatters around an enhancement factor of 40. A qualitatively similar behavior is observed for a trilayer of gold nanoparticles with 63 nm diameters (Figures 3d, e): The increase in the number of nanoparticle layers activates the second polariton resonance with j = 2 (Figure 3d, inset) and red shifts the j = 1 resonance out of our spectral range.3,22,23 The j = 2 resonance is visible as a reflection dip at 1.40 eV in Figure 3d. Similar to the bilayer, we observe a resonant SERS enhancement that is blue-shifted by 60 meV with respect to the reflectance minimum. The enhancement factor is slightly lower than in the bilayer and peaks around 102. Again no resonance is visible for the monolayer which provides enhancement factors around 20.
The SERS enhancement of 102 appears small compared to typical enhancement factors reported for plasmonic oligomers, which are on the order of 106–1010.11,36,38 This has several reasons: (i) We probe molecules across the entire volume of the plasmonic crystal and therefore measure the average SERS enhancement inside the crystal. The enhancement factors reported for plasmonic oligomers typically refer to the local enhancement in the hot spots.38 A much larger SERS enhancement of 104–105 is expected in the hotspots of the supercrystal (Figure S6d). (ii) The large refractive index n ≈ 4–10 of the supercrystals reduces the amount of Raman-scattered light that reaches the detector. The Raman light can only leave the supercrystal film if it is emitted within a critical angle toward the surface normal, and otherwise couples into waveguide modes.39 This reduces the SERS enhancement approximately by a factor of n2/nPS2 ≈ 10–40, where nPS = 1.58 is the refractive index of polystyrene in the reference experiment.40 (iii) Plasmonic oligomers have dimensions much smaller than the wavelength of light and can therefore extract electromagnetic energy from their environment.41 This increases the electric field enhancement in the single or few hot spots of the oligomer. Such light concentration is impossible in plasmonic supercrystals because of their large spatial extent, resulting in smaller peak enhancement factors. Instead, plasmonic supercrystals provide a large density of hotspots, which enables a high sensitivity for volume analytes and repeatability in SERS measurements.1
To explain the excitation energy dependence and magnitude of the SERS enhancement we performed FDTD simulations (see the Methods). We model the microscopic geometry of the films based on structural parameters obtained by TEM assuming that each gold nanoparticle is surrounded by a shell of polystyrene molecules (Figure S6a).25,26 An uncertain parameter is the interparticle gap size, which ranges from 1 to 4 nm according to TEM and small-angle X-ray scattering experiments.25 We used the interparticle gap size as a free parameter to reproduce the energy of the polariton resonance in the reflection measurements. To model the SERS experiments, we determine a volume-integrated SERS enhancement factor38,42
| 1 |
where Eloc(r, ω) is the local electric field amplitude normalized by the amplitude of the incident field. The electric field is evaluated at the frequency of the incoming light ω and the frequency of the Raman-scattered light ω – ωvib and averaged over the volume VPS of all polystyrene shells (see the Methods).
The excitation-energy dependence of the simulated enhancement excellently matches the experimental data (solid lines in Figures 3c,e). We find an overlap of an incoming resonance, when the energy of the incoming light matches the plasmon polariton (ω = ωpp), and an outgoing resonance, when the Raman-scattered light matches the plasmon polariton (ω = ωpp + ωvib).43,44 This explains the blue shift (80 meV) of the peak SERS enhancement with respect to the polariton resonances in reflection, which is on the order of ωvib/2 = 62 meV. The two resonances are visible as distinct overlapping peaks in the simulated enhancement profiles but washed out in the experimental data. The experimental SERS resonances have the same spectral width of 180–200 meV as the simulated enhancement profiles. This is surprising as the measured reflectance dips are 1.5 times broader than the simulated spectra (see Figure S6b) due to variations of gap size within the laser spot.22,25 As we show in Figure S7, the spectral width of the SERS resonances is primarily set by the Raman shift ωvib. It changes only little when increasing the spectral width γpp of the polariton resonance, as long as γpp ≈ ωvib. This makes the SERS resonances robust against variations in geometrical parameters.
The measured SERS enhancement is an order of magnitude smaller than the simulated enhancement for the 50 nm nanoparticle bilayer and by a factor of 3 for the 63 nm nanoparticle trilayer (Figures 3c,e). This is primarily because the simulated enhancement (eq 1) does not account for the different detection angles in the SERS and reference experiments, but is calculated from the local electric field amplitude. Furthermore, the spectral broadening of the polariton resonance reduces the SERS enhancement approximately by a factor of 3 (Figure S7). A high structural order and control of the interparticle gap sizes is thus key to achieve the maximum possible SERS enhancement, as was already found for other optical properties.22,23,25 The overall good agreement between experiment and theory is surprising, as the SERS enhancement of single- or few-hotspot systems typically deviated by two to four orders of magnitude from theory, and SERS resonances were much narrower than in simulations.38
Probing the Near-Field Enhancement with SEIRAS
Polariton resonances in thicker crystals extend all the way into the spectral range of molecular IR vibrations. Figure 4a shows the mid-infrared transmittance spectra of three supercrystals that are several hundred nanometers thick. A polariton resonance is visible as a pronounced transmittance peak that occurs at different energies because of the varying thickness. The narrow transmittance dips on top of the resonances are due to the IR absorption of the polystyrene ligands. The dips are most pronounced when the frequency of the polariton resonance matches with the molecular vibration (compare black and red lines in Figure 4a). Figure 4b shows the absorption spectra of the C–H stretch vibrations of polystyrene.32 The absorption increases by 740% when the polariton resonance is shifted to the same spectral range. This clearly shows that polariton resonances mediate the infrared absorption of molecules in the plasmonic crystals.
Figure 4.

Polariton-enhanced infrared absorption. (a) Transmittance spectra of gold nanoparticle supercrystals of different thickness (12–18 nanoparticle layers L) in the spectral range of the polystyrene vibrations. The supercrystals consisted of gold nanoparticles with 33 nm diameters. The crystal thicknesses were obtained from the analysis in (c). (b) SEIRAS spectra of the crystals in (a) with subtracted background, in the spectral range of the j = 1 polariton resonance. A reference spectrum of a 100 nm thick PS film is shown for comparison (gray). (c) Transmittance spectra calculated with a coupled oscillator model; see the Methods. Supercrystal thicknesses of 12L (black), 16L (blue), and 18L (red) were assumed to reproduce the energies of the polariton resonances in (a). (d) Sketch of the coupling parameters used in the coupled oscillator model. (e) SEIRAS enhancement for four of the vibrational modes of polystyrene in (b) as a function of supercrystal thickness. Data points show the experimental enhancement (left axis) and solid lines the prediction by the coupled oscillator model (right axis). (f) FDTD simulation of the near-field intensity enhancement in the hotspots of plasmonic supercrystals with different nanoparticle diameters and thicknesses (see legend) and a gap size of 2.8 nm. The solid lines show the enhancement in the hotspots of the uppermost nanoparticle layer and the dashed lines the averaged enhancement in the hotspots of all layers.
We explain the enhancement of absorption and the changes in transmittance of the polystyrene-containing supercrystals by a coupled oscillator model (Figures 4c,d, see the Methods). The collective plasmonic modes and the molecular vibrations are two Lorentz oscillators that each couple to light independently with coupling factors Ωpl and Ωvib (Figure 4d). The direct near-field interaction of the two oscillators is described by a dimensionless plasmon-molecule coupling factor Mpl-vib. We obtain an effective dielectric function of the plasmonic supercrystal film and calculate the optical spectra with a transfer-matrix formalism (see Methods). In our previous work, we measured the plasmon-polariton dispersion of the plasmonic crystals from which we know Ωpl = 2.72 eV and the collective plasmon frequency ωpl = 2.04 eV.3 We also showed how to determine the crystal thickness from the energies of the polariton resonances by comparing results from optical and electron microscopy, optical spectroscopy, and numerical simulations (see also Figure 1b and Figure S1).3 Applying this analysis, we find that the resonances in Figure 4a are produced by supercrystals with thicknesses of 12, 16, and 18 nanoparticle layers (Figure 4c). Finally, we determine the oscillator strengths Ωvib = 4–40 cm–1 and frequencies ωvib = 1028–3103 cm–1 from a fit of a reference spectrum of a polystyrene film (Figure 4b, gray, and Figure S8). The transmittance dips by the molecular IR absorption are perfectly reproduced by the coupled oscillator model when assuming a wavelength-independent coupling factor Mpl-vib = 0.132 (Figure 4c).
To determine the SEIRAS enhancement we compare the recorded spectra to the IR absorption of a pure polystyrene film (Figure 4b, gray) and account for the different numbers of molecules (Methods, Supporting Information). Figure 4e shows the enhancement of the C–H stretch vibrations as a function of nanoparticle layer number. With increasing thickness of the supercrystal the polariton resonance shifts across the spectral range of the molecular vibrations. While the IR absorption is slightly decreased in the off-resonant case (12 layers), it increases by almost 400% in the resonant case for 18 nanoparticle layers. The dependence of the SEIRAS enhancement on supercrystal thickness is well reproduced by the coupled oscillator model (Figure 4e, solid lines). It predicts a lower absorption increase of 250%, which is most likely due to experimental uncertainties in the reflectance spectra (Methods, Figure S9).
The coupled oscillator model allows us to identify different contributions to the SEIRAS enhancement. (i) When switching off the plasmon-molecule interaction (Mpl-vib = 0) the vibrational absorption is underestimated by a factor of 3.5 (Figure S10a). In this case the collective plasmons and molecular vibrations are two Lorentz oscillators that each couple to light independently. The plasmon-polaritons cause a large refractive index n ≈ 4 of the supercrystal, that acts as a dielectric background for the molecular vibrations. Because of the crystal boundaries, light is resonantly trapped as standing waves. This causes a wavelength- and thickness-dependent change of the electric field intensity inside the supercrystal that manifests in the SEIRAS enhancement (Figure 4e). (ii) The plasmon-molecule coupling factor Mpl-vib accounts phenomenologically for the field confinement into the hotspots inside the supercrystal. The experimental transmittance spectra are best reproduced when assuming a constant factor Mpl-vib = 0.132 (Figure 4c). The field confinement therefore leads to a wavelength-independent enhancement factor of 3.5.15 A decomposition into the two enhancement factors shows that the field confinement into hot spots is by far the dominant enhancement mechanism (Figure S10b).
The measured SEIRAS enhancement factors reported here are smaller than for isolated nanostructures and nanoshell superlattices.13−15,45 This is because we average across all molecules in the bulk of the plasmonic supercrystal (compare SERS discussion above). Based on FDTD simulations we expect a field intensity enhancement of 150 (15.000%) in the hotspots between nanoparticles at the supercrystal surface (Figure 4f, red solid line). This enhancement can be exploited for SEIRAS experiments where analyte molecules are positioned on the surface. The enhancement can be further optimized by the supercrystal geometry. When increasing the nanoparticle diameters to 60 nm, a supercrystal thickness of only eight nanoparticle layers is sufficient to shift the polariton resonance to the spectral range of the C–H stretch vibrations (Figure 4f, orange, and Figure S11). The peak SEIRAS enhancement at the crystal surface increases to 500 (Figure 4f, orange solid line) and the transmittance dips in the experimental spectra become more pronounced (Figure S11). The tunability of the polariton resonance by the crystal thickness allows for the selective enhancement of molecular vibrations.
Conclusions
In conclusion, we demonstrated that plasmon polaritons mediate the electric-field enhancement in plasmonic supercrystals, which we exploited for SERS and SEIRAS. Based on a combination of experiments, simulations and analytical modeling, we showed that the confinement of light in plasmonic supercrystals is driven by four effects: (1) The polaritonic coupling leads to a large refractive index of the supercrystal, that reduces the wavelength of light by a factor of 4–10. (2) The supercrystal acts as an open cavity resonantly trapping light in the form of standing waves. (3) The large dielectric contrast between metals and dielectrics confines light outside the plasmonic nanoparticles. (4) The near-field interaction between neighboring nanoparticles results in hotspots with strongly increased electric-field intensities. The first two effects lead to pronounced optical resonances in the near- and mid-infrared that can be tuned by geometrical parameters. These polaritonic resonances are combined with an almost wavelength-independent enhancement from effects (3) and (4). Overall, the confinement of light results in an 102–103 fold resonant enhancement of the electric-field intensity in hotspots between neighboring nanoparticles. This, in combination with the large density of field hotspots, makes plasmonic supercrystals an excellent platform for sensing applications and surface-enhanced vibrational spectroscopy.
We used the vibrational spectra of polystyrene ligand molecules to probe the SERS and SEIRAS enhancement as a function of excitation wavelength and crystal geometry. The plasmon polaritons of thin supercrystals lead to SERS resonances in the near-IR, which we resolved with wavelength-scanned Raman spectroscopy. The largest SERS enhancement occurred at an excitation wavelength that was blue-shifted (60–80 meV) with respect to the polariton resonance by half of the Raman shift. This has to be taken into account when designing plasmonic supercrystals for SERS at a specific target wavelength. The measured SERS enhancement agreed well with the electromagnetic enhancement factors derived from FDTD simulations and tracked the same wavelength dependence. Plasmonic supercrystals are therefore a promising platform for quantitative and repeatable SERS detection. We also demonstrated the potential of the polariton resonances for SEIRAS. The IR absorption of polystyrene increased by 400% when a polariton resonance matched the energies of the molecular vibrations. Plasmonic supercrystals that consist of several nanoparticle layers support multiple polaritonic resonances from the mid- to near-infrared spectral range. Polariton-mediated SERS and SEIRAS can thus be combined on a single substrate.
Methods
Materials
Tetrachloroauric(III) acid (≥99.9% trace metals basis), hexadecyltrimethylammonium bromide (CTAB, ≥98%) and chloride (CTAC, ≥98%), l-ascorbic acid (reagent grade), trisodium citrate dihydrate (≥99.0%), and sodium borohydride (≥98%) were from Sigma-Aldrich (USA). Toluene (≥99.5%), tetrahydrofuran (THF, ≥99.5%), and ethanol (denat, >96%) were from VWR (USA). Diethylene glycol (DEG, reagent grade) was from Merck (Germany). Thiolated polystyrenes (PSSH, PSSH5k: Mn = 5,300 g mol–1, Mw = 5,800 g mol–1; PSSH12k: Mn = 11,500 g mol–1, Mw = 12,400 g mol–1) were from Polymer Source (Canada). All reagents were used without further treatment. For the gold nanoparticle (AuNP) synthesis ultrapure water (18.2 MΩ × cm) was used.
Synthesis of Plasmonic Supercrystal Films
AuNPs were synthesized with variations of established seeded-growth protocols as described previously.25,27 The supercrystals used for the SEIRAS experiments consisted of citrate-stabilized AuNPs (diameter d = 33.1 ± 3.7 nm, determined by TEM). These AuNPs were functionalized with PSSH5k by ethanol-assisted phase transfer into toluene solutions of the polystyrene ligand (0.16 mM).27 The supercrystals used for SERS were CTAC-stabilized AuNPs (d = 50.5 ± 1.1 nm and d = 63.4 ± 1.8 nm, determined by TEM). These AuNPs were functionalized by pipetting small volumes (∼100 μL) of concentrated aqueous solutions into THF solutions of the polystyrene ligand (6 mL, 0.5 mM).25 The 50 nm AuNPs were functionalized with PSSH5k and the 63 nm AuNPs with PSSH12k. After the reaction was completed (∼16 h), THF was evaporated and the functionalized AuNPs dissolved in toluene. All functionalized AuNPs were purified by repeated centrifugation, displacing the supernatants with toluene. Plasmonic supercrystals were prepared with the purified solutions by slow evaporation of the toluene on a liquid DEG subphase as described previously.3,25,27 The formed plasmonic supercrystals were then transferred to the desired substrate and dried in vacuum (2–3 h).
Optical Characterization in the Visible and Near-IR
Transmittance and reflectance spectra were recorded with a microabsorbance spectrometer, as described in ref (22). Briefly, the light of a supercontinuum laser (NKT SuperK Fianium FIU-15) was focused on the sample with a 100× objective (Leica HCX PL Fluotar, 0.9 NA). The transmitted light was collected with another 100× objective (Olympus MPlan FL N BD, 0.9 NA) and guided to fiber optical spectrometers (Avantes, AvaSpec 3648 for 450–900 nm and AvaSpec NIR512 for 900–1600 nm wavelength). The transmitted light through the substrate at a position without plasmonic crystals served as a reference to determine the transmittance. The spectra of the two wavelength ranges were pinned together. The reflected light was separated from the incoming light by a beam splitter (Thorlabs, BSW26R for 450–900 nm and BSW29R for 900–1600 nm) and detected in another set of measurements. The reflected light of a silver mirror was used as a reference to determine the reflectance. The laser power on the sample was kept below 60 μW. Note that the numerical aperture (NA) is reduced to below 0.2 inside the plasmonic supercrystal films because of their large effective refractive index.3 We therefore primarily probed the transmission and reflection of light at normal incidence.
Wavelength-Scanned Surface-Enhanced Raman Spectroscopy
We used a Horiba T64000 Raman spectrometer with tunable excitation energy for the SERS measurements. A titanium-sapphire continuous wave laser (Coherent MBR 110) was used as a light source providing excitation energies that range from 1.24 to 1.77 eV. The laser light was guided through a premonochromator and focused on the supercrystal surface with a 100× objective (Olympus MPlan, 0.9 NA). The laser power was kept below 1 mW to avoid sample heating and typical integration times were 200 s. The inelastically backscattered light was collected by the same objective, filtered with a long pass filter and focused on the entrance slit of the Raman spectrometer. The light was dispersed with a 600 grooves per mm grating and detected by a silicon charge coupled device (CCD). In order to account for the wavelength-dependent sensitivity of the setup, reference spectra of diamond were recorded with the same settings. We chose diamond as a reference as it does not have Raman resonances in the spectral range of our measurements. There are remaining uncertainties of the SERS intensity from changes in laser power during acquisition and defocusing, which lead to the scattering and deviations of the data points in Figure 3c,e. The SERS spectra in Figure 3a were calibrated by the spectrum of a neon lamp.
The polystyrene C–C–C ring bending mode at 1000 cm–1 in the SERS spectra (see Figure 3a) and the 1332 cm–1 diamond mode in the reference spectra were fit with Lorentzian peaks. By dividing the Raman peak areas we obtained the normalized SERS intensity ISERS(ω) as a function of excitation energy ℏω (see Figure S5a,b). In a second set of measurements, we also recorded the Raman intensity of bulk polystyrene ligand molecules. The Raman intensity of the C–C–C ring bending mode normalized by that of diamond is shown in Figure S5c. We fit the energy-dependent Raman intensity Imol(ω) with an analytic expression from the microscopic theory of Raman scattering44
| 2 |
where ωmol,n is the frequency, 2γmol,n is the spectral width of a molecular Raman resonance n, and Mmol, n is a fitting parameter that gives the strength of the Raman resonance. The fits are shown as solid lines in Figure S5c. The data are well explained by two molecular Raman resonances at ℏωmol,1 = 1.34 eV and ℏωmol,2 = 1.70 eV.
The energy-dependent SERS enhancement factor in Figure 3c,e was calculated as36,37
| 3 |
where we divided the data points for ISERS(ω) in Figure S5a,b by the fits Imol(ω) in Figure S5c. NmolSERS is the number of molecules that are probed in the SERS experiment and Nmol the number of molecules probed in the reference experiment. Based on the structural parameters of the plasmonic supercrystals and the density of polystyrene molecules, we obtained Nmolref/Nmol = 121 for the monolayer of 50 nm nanoparticles and Nmolref/Nmol = 55 for the monolayer of 63 nm nanoparticles (see Supplementary Section S1).
Infrared Spectroscopy
We used a Bruker Hyperion 2000 equipped with a liquid nitrogen cooled MCT detector coupled to a Bruker Vertex 80v spectrometer to acquire IR transmittance and reflectance spectra of microscopic sample regions.45 Plasmonic supercrystal films were deposited on a TEM grid with a 10 nm thick amorphous carbon film as support, to achieve the spectral range undisturbed by the substrate. The incident light was focused on one mesh cell (40 × 40 μm) of the TEM grid and the light outside this area was blocked by a quadratic aperture. Transmittance T and reflectance R spectra were measured on supercrystal films that had a homogeneous thickness over the size of one TEM grid cell. The transmitted light through a TEM grid cell devoid of a supercrystal (with amorphous carbon) and the light reflected off a gold mirror served as reference spectra. The reflectance spectra are shown in Figure S9. The absorption spectra were obtained as A = 100% – T – R. The measurement of the reflectance was challenging because of distortions and an uneven surface of the supercrystals on the TEM grid. This leads to uncertainties in the experimental absorption spectra. To determine the SEIRAS enhancement we recorded an infrared absorption spectrum of an h0 = 1 μm thick spin-coated polystyrene film on a CaF2 substrate (Figure S8). Using the Lambert–Beer law
| 4 |
we rescaled the reference spectrum A(h0) to a PS film thickness h that corresponds to the same number of molecules as probed in the SEIRAS measurement (h = 145 nm for 12L, 193 nm for 16L, and 217 nm for 18 L plasmonic crystal thickness, see Supplementary Section S1). The reference spectrum is shown in Figure 4b for a PS film thickness of 100 nm.
Finite-Difference Time-Domain (FDTD) Simulations
FDTD simulations were conducted with the commercial software package Lumerical FDTD Solutions. The simulation layout was similar to our previous works.22,29 Briefly, the unit cell of a hexagonally packed monolayer of gold nanospheres was constructed with periodic boundary conditions along x and y. The nanoparticle layers were then stacked along the z direction with the abc stacking sequence of an fcc crystal along [111]. The dielectric function of gold was modeled with a fit of experimental data by Olmon et al.46 The supercrystal film was illuminated with a plane-wave source along z. Even though we used objectives with 0.9 NA in our experiments, this is a good approximation because the large refractive index of the supercrystals reduces the NA inside the crystals to below 0.2.3 Power monitors were positioned behind the supercrystal and behind the source to record the transmitted and reflected light. Mesh override regions with cubic cells of 0.5–0.7 nm were used to discretize space inside the supercrystals. In the simulations for Figure 2a, a monitor was used to record the amplitude and phase of the electric field as a function of position and wavelength. The electric field amplitude was corrected for the wavelength-dependent phase shift that the incident light accumulated between the source and the supercrystal surface. In the simulations for Figure 2, all space around the gold nanospheres was filled with a medium with refractive index nm = 1.4 to mimic the effective dielectric environment by the polystyrene molecules. In the simulations for SERS and SEIRAS (Figures 3 and 4) the microscopic structure was modeled in greater detail: the polystyrene molecules were modeled as spherical shells that surrounded the gold nanospheres. The simulation layout is shown for a bilayer in Figure S6a. The shells were assigned the refractive index of polystyrene, i.e. n = 1.58 in the visible and n = 1.56 in the mid infrared. Shell thicknesses of 3.3 and 5.3 nm were chosen for the PSSH5k and PSSH12k ligand molecules, according to measurements by Ye et al.26 When a polystyrene shell overlapped with the next gold nanoparticle the overlapping volume was overwritten by the refractive index of gold. To calculate the SERS enhancement, we used a 3D electric field monitor and only evaluated the electric field inside the polystyrene shells; see eq 1.
Coupled Oscillator Model
We used a coupled Lorentz oscillator model to obtain analytic expressions for the enhanced infrared absorption of molecules in plasmonic crystals. There are two excitations in the plasmonic crystal that couple to light: The collective plasmon modes “pl” of the gold nanoparticle crystal with polarization density μpl and the IR active molecular vibrations “vib” of the polystyrene molecules with polarization density μvib. The plasmonic and vibrational excitations furthermore couple with each other via their optical near fields. Following a model by Thomas et al. for exciton polaritons,47 their interaction can be described by the following equations of motion
| 5 |
| 6 |
where Ωpl and Ωvib are the light-matter coupling strength of the collective plasmon and IR vibration and Mpl–vib a factor that describes their near-field coupling. E0 is the amplitude of the light field at frequency ω, and ωj and γj are the frequencies and spectral broadening of the plasmonic and vibrational excitations j = pl, vib. ϵeff is an effective constant for the dielectric background in the absence of metal and IR vibrations. We approximate it as ϵeff = [1.4(1 – F) + F]2, where F is the metal volume fill fraction of the plasmonic crystal.3
From the steady-state solutions μpl0 and μvib for the plasmonic and vibrational polarization densities we obtain the linear optical polarizability of the plasmonic crystal α(ω) = (μpl0 + μvib)/E0 and the dielectric function
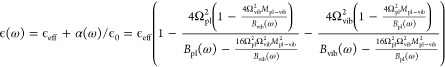 |
7 |
where Bpl(ω) = ω2 – ωpl2 + i γplω and Bvib(ω) = ω2 –
ωvib + i γvibω. To calculate the SEIRAS
spectra we treat the plasmonic crystal as a metamaterial with effective
refractive index  and thickness
  , where NL is the number of stacked nanoparticle layers, d the nanoparticle diameter and a the interparticle
gap size.3 The optical transmittance and
reflectance is then calculated by a transfer-matrix approach as48
, where NL is the number of stacked nanoparticle layers, d the nanoparticle diameter and a the interparticle
gap size.3 The optical transmittance and
reflectance is then calculated by a transfer-matrix approach as48
| 8 |
and
| 9 |
In the Supporting Information we show how to extend this model to multiple IR vibrations.
Acknowledgments
This work was supported by the European Research Council (ERC) under grant DarkSERS (772108) to S.R. and the German Research Foundation (DFG, project HE 2063/5-1) to J.H., S.R. and J.H. acknowledge the Focus Area NanoScale of Freie Universität Berlin. P.K. was supported by the German Research Foundation (DFG, project 2244). H.L. and F.S. were supported by the Cluster of Excellence “Advanced Imaging of Matter” of the German Research Foundation (DFG-EXC 2056-project ID 390715994). We thank Sabrina Jürgensen for help with recording SEM images. The SERS, SEIRAS, and FDTD raw data that were used to generate figures in this work are available at the repository REFUBIUM, under identifier 10.17169/refubium-29372. The reflectance and transmittance spectra are available at the repository REFUBIUM, under identifier 10.17169/refubium-26819.
Supporting Information Available
The Supporting Information is available free of charge at https://pubs.acs.org/doi/10.1021/acsnano.1c00352.
Supplementary figures with optical microscope images; absorption spectra from Figure 1c,d; simulated optical spectra supplementing Figure 2c; simulated field enhancement for different crystal thicknesses; wavelength-scanned Raman intensities of SERS and reference spectra; FDTD simulations to model the SERS experiments; effect of polariton line width on the SERS resonance; IR reference spectrum of a 1 μm thick polystyrene film; IR reflectance spectra of the supercrystals in Figure 4; calculations with the coupled oscillator model to analyze the SEIRAS enhancement; SEIRAS spectra for supercrystals of 63 nm nanoparticles; estimation of the z laser spot size in Raman measurements; supplementary text on estimating the number of polystyrene molecules probed in experiments and coupled oscillator model for multiple IR vibrations (PDF)
The authors declare no competing financial interest.
Supplementary Material
References
- García-Lojo D.; Núñez-Sánchez S.; Gómez-Graña S.; Grzelczak M.; Pastoriza-Santos I.; Pérez-Juste J.; Liz-Marzán L. M. Plasmonic Supercrystals. Acc. Chem. Res. 2019, 52, 1855–1864. 10.1021/acs.accounts.9b00213. [DOI] [PubMed] [Google Scholar]
- Ross M. B.; Mirkin C. A.; Schatz G. C. Optical Properties of One-, Two-, and Three-Dimensional Arrays of Plasmonic Nanostructures. J. Phys. Chem. C 2016, 120, 816–830. 10.1021/acs.jpcc.5b10800. [DOI] [Google Scholar]
- Mueller N. S.; Okamura Y.; Vieira B. G. M.; Juergensen S.; Lange H.; Barros E. B.; Schulz F.; Reich S. Deep Strong Light–Matter Coupling in Plasmonic Nanoparticle Crystals. Nature 2020, 583, 780–784. 10.1038/s41586-020-2508-1. [DOI] [PubMed] [Google Scholar]
- Solís D. M.; Taboada J. M.; Obelleiro F.; Liz-Marzán L. M.; García de Abajo F. J. Toward Ultimate Nanoplasmonics Modeling. ACS Nano 2014, 8, 7559–7570. 10.1021/nn5037703. [DOI] [PubMed] [Google Scholar]
- Blanco-Formoso M.; Pazos-Perez N.; Alvarez-Puebla R. A. Fabrication of Plasmonic Supercrystals and Their SERS Enhancing Properties. ACS Omega 2020, 5, 25485–25492. 10.1021/acsomega.0c03412. [DOI] [PMC free article] [PubMed] [Google Scholar]
- Palmer S. J.; Xiao X.; Pazos-Perez N.; Guerrini L.; Correa-Duarte M. A.; Maier S. A.; Craster R. V.; Alvarez-Puebla R. A.; Giannini V. Extraordinarily Transparent Compact Metallic Metamaterials. Nat. Commun. 2019, 10, 2118. 10.1038/s41467-019-09939-8. [DOI] [PMC free article] [PubMed] [Google Scholar]
- Le Ru E. C.; Etchegoin P.. Principles of Surface-Enhanced Raman Spectroscopy: And Related Plasmonic Effects, 1st ed., 2009 ed.; Elsevier Science: The Netherlands, 2008; p 688. [Google Scholar]
- Alvarez-Puebla R. A.; Agarwal A.; Manna P.; Khanal B. P.; Aldeanueva-Potel P.; Carbó-Argibay E.; Pazos-Pérez N.; Vigderman L.; Zubarev E. R.; Kotov N. A.; Liz-Marzán L. M. Gold Nanorods 3D-Supercrystals as Surface Enhanced Raman Scattering Spectroscopy Substrates for the Rapid Detection of Scrambled Prions. Proc. Natl. Acad. Sci. U. S. A. 2011, 108, 8157–8161. 10.1073/pnas.1016530108. [DOI] [PMC free article] [PubMed] [Google Scholar]
- Alba M.; Pazos-Perez N.; Vaz B.; Formentin P.; Tebbe M.; Correa-Duarte M. A.; Granero P.; Ferré-Borrull J.; Alvarez R.; Pallares J.; Fery A.; de Lera A. R.; Marsal L. F.; Alvarez-Puebla R. A. Macroscale Plasmonic Substrates for Highly Sensitive Surface-Enhanced Raman Scattering. Angew. Chem., Int. Ed. 2013, 52, 6459–6463. 10.1002/anie.201302285. [DOI] [PMC free article] [PubMed] [Google Scholar]
- Bodelón G.; Montes-García V.; López-Puente V.; Hill E. H.; Hamon C.; Sanz-Ortiz M. N.; Rodal-Cedeira S.; Costas C.; Celiksoy S.; Pérez-Juste I.; Scarabelli L.; La Porta A.; Pérez-Juste J.; Pastoriza-Santos I.; Liz-Marzán L. M. Detection and Imaging of Quorum Sensing in Pseudomonas aeruginosa Biofilm Communities by Surface-Enhanced Resonance Raman Scattering. Nat. Mater. 2016, 15, 1203–1211. 10.1038/nmat4720. [DOI] [PMC free article] [PubMed] [Google Scholar]
- Langer J.; Jimenez de Aberasturi D.; Aizpurua J.; Alvarez-Puebla R. A.; Auguié B.; Baumberg J. J.; Bazan G. C.; Bell S. E. J.; Boisen A.; Brolo A. G.; Choo J.; Cialla-May D.; Deckert V.; Fabris L.; Faulds K.; García de Abajo F. J.; Goodacre R.; Graham D.; Haes A. J.; Haynes C. L.; et al. Present and Future of Surface-Enhanced Raman Scattering. ACS Nano 2020, 14, 28–117. 10.1021/acsnano.9b04224. [DOI] [PMC free article] [PubMed] [Google Scholar]
- Ataka K.; Heberle J. Biochemical Applications of Surface-Enhanced Infrared Absorption Spectroscopy. Anal. Bioanal. Chem. 2007, 388, 47–54. 10.1007/s00216-006-1071-4. [DOI] [PMC free article] [PubMed] [Google Scholar]
- Neubrech F.; Huck C.; Weber K.; Pucci A.; Giessen H. Surface-Enhanced Infrared Spectroscopy Using Resonant Nanoantennas. Chem. Rev. 2017, 117, 5110–5145. 10.1021/acs.chemrev.6b00743. [DOI] [PubMed] [Google Scholar]
- Wang H.; Kundu J.; Halas N. J. Plasmonic Nanoshell Arrays Combine Surface-Enhanced Vibrational Spectroscopies on a Single Substrate. Angew. Chem., Int. Ed. 2007, 46, 9040–9044. 10.1002/anie.200702072. [DOI] [PubMed] [Google Scholar]
- Le F.; Brandl D. W.; Urzhumov Y. A.; Wang H.; Kundu J.; Halas N. J.; Aizpurua J.; Nordlander P. Metallic Nanoparticle Arrays: A Common Substrate for Both Surface-Enhanced Raman Scattering and Surface-Enhanced Infrared Absorption. ACS Nano 2008, 2, 707–718. 10.1021/nn800047e. [DOI] [PubMed] [Google Scholar]
- Scarabelli L.; Hamon C.; Liz-Marzán L. M. Design and Fabrication of Plasmonic Nanomaterials Based on Gold Nanorod Supercrystals. Chem. Mater. 2017, 29, 15–25. 10.1021/acs.chemmater.6b02439. [DOI] [Google Scholar]
- Park D. J.; Zhang C.; Ku J. C.; Zhou Y.; Schatz G. C.; Mirkin C. A. Plasmonic Photonic Crystals Realized through DNA-Programmable Assembly. Proc. Natl. Acad. Sci. U. S. A. 2015, 112, 977–981. 10.1073/pnas.1422649112. [DOI] [PMC free article] [PubMed] [Google Scholar]
- Lamowski S.; Mann C.-R.; Hellbach F.; Mariani E.; Weick G.; Pauly F. Plasmon Polaritons in Cubic Lattices of Spherical Metallic Nanoparticles. Phys. Rev. B: Condens. Matter Mater. Phys. 2018, 97, 125409. 10.1103/PhysRevB.97.125409. [DOI] [Google Scholar]
- Yannopapas V.; Modinos A.; Stefanou N. Optical Properties of Metallodielectric Photonic Crystals. Phys. Rev. B: Condens. Matter Mater. Phys. 1999, 60, 5359–5365. 10.1103/PhysRevB.60.5359. [DOI] [Google Scholar]
- Huang C.-p.; Yin X.-g.; Wang Q.-j.; Huang H.; Zhu Y.-y. Long-Wavelength Optical Properties of a Plasmonic Crystal. Phys. Rev. Lett. 2010, 104, 016402 10.1103/PhysRevLett.104.016402. [DOI] [PubMed] [Google Scholar]
- Sun L.; Lin H.; Kohlstedt K. L.; Schatz G. C.; Mirkin C. A. Design Principles for Photonic Crystals Based on Plasmonic Nanoparticle Superlattices. Proc. Natl. Acad. Sci. U. S. A. 2018, 115, 7242–7247. 10.1073/pnas.1800106115. [DOI] [PMC free article] [PubMed] [Google Scholar]
- Mueller N. S.; Vieira B. G. M.; Schulz F.; Kusch P.; Oddone V.; Barros E. B.; Lange H.; Reich S. Dark Interlayer Plasmons in Colloidal Gold Nanoparticle Bi- and Few-Layers. ACS Photonics 2018, 5, 3962–3969. 10.1021/acsphotonics.8b00898. [DOI] [Google Scholar]
- Mueller N. S.; Vieira B. G. M.; Höing D.; Schulz F.; Barros E. B.; Lange H.; Reich S. Direct Optical Excitation of Dark Plasmons for Hot Electron Generation. Faraday Discuss. 2019, 214, 159–173. 10.1039/C8FD00149A. [DOI] [PubMed] [Google Scholar]
- Hamon C.; Novikov S. M.; Scarabelli L.; Solís D. M.; Altantzis T.; Bals S.; Taboada J. M.; Obelleiro F.; Liz-Marzán L. M. Collective Plasmonic Properties in Few-Layer Gold Nanorod Supercrystals. ACS Photonics 2015, 2, 1482–1488. 10.1021/acsphotonics.5b00369. [DOI] [PMC free article] [PubMed] [Google Scholar]
- Schulz F.; Pavelka O.; Lehmkühler F.; Westermeier F.; Okamura Y.; Mueller N. S.; Reich S.; Lange H. Structural Order in Plasmonic Superlattices. Nat. Commun. 2020, 11, 3821. 10.1038/s41467-020-17632-4. [DOI] [PMC free article] [PubMed] [Google Scholar]
- Ye X.; Zhu C.; Ercius P.; Raja S. N.; He B.; Jones M. R.; Hauwiller M. R.; Liu Y.; Xu T.; Alivisatos A. P. Structural Diversity in Binary Superlattices Self-Assembled from Polymer-Grafted Nanocrystals. Nat. Commun. 2015, 6, 10052. 10.1038/ncomms10052. [DOI] [PMC free article] [PubMed] [Google Scholar]
- Schulz F.; Tober S.; Lange H. Size-Dependent Phase Transfer Functionalization of Gold Nanoparticles to Promote Well-Ordered Self-Assembly. Langmuir 2017, 33, 14437–14444. 10.1021/acs.langmuir.7b03600. [DOI] [PubMed] [Google Scholar]
- Pinchuk A.; Plessen G. v.; Kreibig U. Influence of Interband Electronic Transitions on the Optical Absorption in Metallic Nanoparticles. J. Phys. D: Appl. Phys. 2004, 37, 3133–3139. 10.1088/0022-3727/37/22/012. [DOI] [Google Scholar]
- G. M. Vieira B.; Mueller N. S.; Barros E. B.; Reich S. Plasmonic Properties of Close-Packed Metallic Nanoparticle Mono- and Bilayers. J. Phys. Chem. C 2019, 123, 17951–17960. 10.1021/acs.jpcc.9b03859. [DOI] [Google Scholar]
- Alabugin A. Near-IR Photochemistry for Biology: Exploiting the Optical Window of Tissue. Photochem. Photobiol. 2019, 95, 722–732. 10.1111/php.13068. [DOI] [PubMed] [Google Scholar]
- Jasse B.; Chao R. S.; Koenig J. L. Laser Raman Scattering in Uniaxially Oriented Atactic Polystyrene. J. Polym. Sci., Polym. Phys. Ed. 1978, 16, 2157–2169. 10.1002/pol.1978.180161206. [DOI] [Google Scholar]
- Liang C. Y.; Krimm S. Infrared Spectra of High Polymers. VI. Polystyrene. J. Polym. Sci. 1958, 27, 241–254. 10.1002/pol.1958.1202711520. [DOI] [Google Scholar]
- Hamon C.; Sanz-Ortiz M. N.; Modin E.; Hill E. H.; Scarabelli L.; Chuvilin A.; Liz-Marzán L. M. Hierarchical Organization and Molecular Diffusion in Gold Nanorod/Silica Supercrystal Nanocomposites. Nanoscale 2016, 8, 7914–7922. 10.1039/C6NR00712K. [DOI] [PMC free article] [PubMed] [Google Scholar]
- Wasserroth S.; Bisswanger T.; Mueller N. S.; Kusch P.; Heeg S.; Clark N.; Schedin F.; Gorbachev R.; Reich S. Graphene as a Local Probe to Investigate Near-Field Properties of Plasmonic Nanostructures. Phys. Rev. B: Condens. Matter Mater. Phys. 2018, 97, 155417. 10.1103/PhysRevB.97.155417. [DOI] [Google Scholar]
- Wasserroth S.; Heeg S.; Mueller N. S.; Kusch P.; Hübner U.; Gaufrès E.; Tang N. Y. W.; Martel R.; Vijayaraghavan A.; Reich S. Resonant, Plasmonic Raman Enhancement of α-6T Molecules Encapsulated in Carbon Nanotubes. J. Phys. Chem. C 2019, 123, 10578–10585. 10.1021/acs.jpcc.9b01600. [DOI] [PMC free article] [PubMed] [Google Scholar]
- Wang X.; Huang S.-C.; Hu S.; Yan S.; Ren B. Fundamental Understanding and Applications of Plasmon-Enhanced Raman Spectroscopy. Nat. Rev. Phys. 2020, 2, 253–271. 10.1038/s42254-020-0171-y. [DOI] [Google Scholar]
- Le Ru E. C.; Etchegoin P. G. Quantifying SERS Enhancements. MRS Bull. 2013, 38, 631–640. 10.1557/mrs.2013.158. [DOI] [Google Scholar]
- Heeg S.; Mueller N. S.; Wasserroth S.; Kusch P.; Reich S. Experimental Tests of Surface-Enhanced Raman Scattering: Moving Beyond the Electromagnetic Enhancement Theory. J. Raman Spectrosc. 2021, 52, 310–322. 10.1002/jrs.6014. [DOI] [Google Scholar]
- Vaskin A.; Kolkowski R.; Koenderink A. F.; Staude I. Light-Emitting Metasurfaces. Nanophotonics 2019, 8, 1151–1198. 10.1515/nanoph-2019-0110. [DOI] [Google Scholar]
- Loa I.; Gronemeyer S.; Thomsen C.; Ambacher O.; Schikora D.; As D. J. Comparative Determination of Absolute Raman Scattering Efficiencies and Application to GaN. J. Raman Spectrosc. 1998, 29, 291–295. 10.1002/(SICI)1097-4555(199804)29:4<291::AID-JRS239>3.0.CO;2-8. [DOI] [Google Scholar]
- Schuller J. A.; Barnard E. S.; Cai W.; Jun Y. C.; White J. S.; Brongersma M. L. Plasmonics for Extreme Light Concentration and Manipulation. Nat. Mater. 2010, 9, 193–204. 10.1038/nmat2630. [DOI] [PubMed] [Google Scholar]
- Ding S.-Y.; You E.-M.; Tian Z.-Q.; Moskovits M. Electromagnetic Theories of Surface-Enhanced Raman Spectroscopy. Chem. Soc. Rev. 2017, 46, 4042–4076. 10.1039/C7CS00238F. [DOI] [PubMed] [Google Scholar]
- Mueller N. S.; Heeg S.; Reich S. Surface-Enhanced Raman Scattering as a Higher-Order Raman Process. Phys. Rev. A: At., Mol., Opt. Phys. 2016, 94, 023813 10.1103/PhysRevA.94.023813. [DOI] [Google Scholar]
- Mueller N. S.; Reich S.. Modeling Surface-Enhanced Spectroscopy with Perturbation Theory. Front. Chem. 2019, 10.3389/fchem.2019.00470. [DOI] [PMC free article] [PubMed] [Google Scholar]
- Pfitzner E.; Seki H.; Schlesinger R.; Ataka K.; Heberle J. Disc Antenna Enhanced Infrared Spectroscopy: From Self-Assembled Monolayers to Membrane Proteins. ACS Sensors 2018, 3, 984–991. 10.1021/acssensors.8b00139. [DOI] [PubMed] [Google Scholar]
- Olmon R. L.; Slovick B.; Johnson T. W.; Shelton D.; Oh S.-H.; Boreman G. D.; Raschke M. B. Optical Dielectric Function of Gold. Phys. Rev. B: Condens. Matter Mater. Phys. 2012, 86, 235147. 10.1103/PhysRevB.86.235147. [DOI] [Google Scholar]
- Thomas R.; Thomas A.; Pullanchery S.; Joseph L.; Somasundaran S. M.; Swathi R. S.; Gray S. K.; Thomas K. G. Plexcitons: The Role of Oscillator Strengths and Spectral Widths in Determining Strong Coupling. ACS Nano 2018, 12, 402–415. 10.1021/acsnano.7b06589. [DOI] [PubMed] [Google Scholar]
- Nicolson A. M.; Ross G. F. Measurement of the Intrinsic Properties of Materials by Time-Domain Techniques. IEEE Trans. Instrum. Meas. 1970, 19, 377–382. 10.1109/TIM.1970.4313932. [DOI] [Google Scholar]
Associated Data
This section collects any data citations, data availability statements, or supplementary materials included in this article.