

Abstract
Atypical teratoid/rhabdoid tumors (ATRTs) typically arise in the central nervous system (CNS) of children under 3 years of age. Despite intensive multimodal therapy (surgery, chemotherapy and, if age permits, radiotherapy), median survival is 17 months1,2. We show that ATRTs robustly express B7-H3/CD276 that does not result from the inactivating mutations in SMARCB1 (refs.3,4), which drive oncogenesis in ATRT, but requires residual SWItch/Sucrose Non-Fermentable (SWI/SNF) activity mediated by BRG1/SMARCA4. Consistent with the embryonic origin of ATRT5,6, B7-H3 is highly expressed on the prenatal, but not postnatal, brain. B7-H3. BB.z-chimeric antigen receptor (CAR) T cells administered intracerebroventricularly or intratumorally mediate potent antitumor effects against cerebral ATRT xenografts in mice, with faster kinetics, greater potency and reduced systemic levels of inflammatory cytokines compared to CAR T cells administered intravenously. CAR T cells administered ICV also traffic from the CNS into the periphery; following clearance of ATRT xenografts, B7-H3.BB.z-CAR T cells administered intracerebroventricularly or intravenously mediate antigen-specific protection from tumor rechallenge, both in the brain and periphery. These results identify B7-H3 as a compelling therapeutic target for this largely incurable pediatric tumor and demonstrate important advantages of locoregional compared to systemic delivery of CAR T cells for the treatment of CNS malignancies.
B7-H3 targeting immunotherapies are currently under clinical investigation in children and adults with refractory extracranial solid tumors and brain tumors (NCT02982941, NCT01391143 and NCT04185038) (refs.7–9). In preclinical models, systemically delivered B7-H3-targeted CAR T cells mediate potent effects in pediatric solid tumors7,8; however, heterogeneous expression of B7-H3 (ref.8) may limit the efficacy of monospecific CARs10–16. We screened 47 primary ATRT samples (Supplementary Tables 1 and 2) and 10 ATRT cell lines (Supplementary Table 3) for B7-H3 surface expression. Strikingly, 100% of tumors and cell lines expressed B7-H3 (Fig. 1a–d and Extended Data Fig. 1a), with 72% strongly positive (37 out of 47; H-score > 200) and 23% moderately positive (11 out of 47, H-score = 100–200). As shown in representative examples from two infants (<1 year of age; Fig. 1b) ATRT B7-H3 cell surface staining is robust and homogeneous, whereas normal cerebral cortex or cerebellum adjacent to the tumor is negative (Fig. 1c); B7-H3 is expressed at similar levels across the three recently identified ATRT subgroups17,18 (ATRT-TYR, ATRT-SHH and ATRT-MYC) (Fig. 1d, P = NS and Extended Data Fig. 1b). These data suggest that CAR T cells targeting B7-H3 could provide a therapeutic approach for this highly lethal pediatric tumor.
Fig. 1 |. High levels of B7-H3 expression in ATRTs and during normal prenatal brain development.
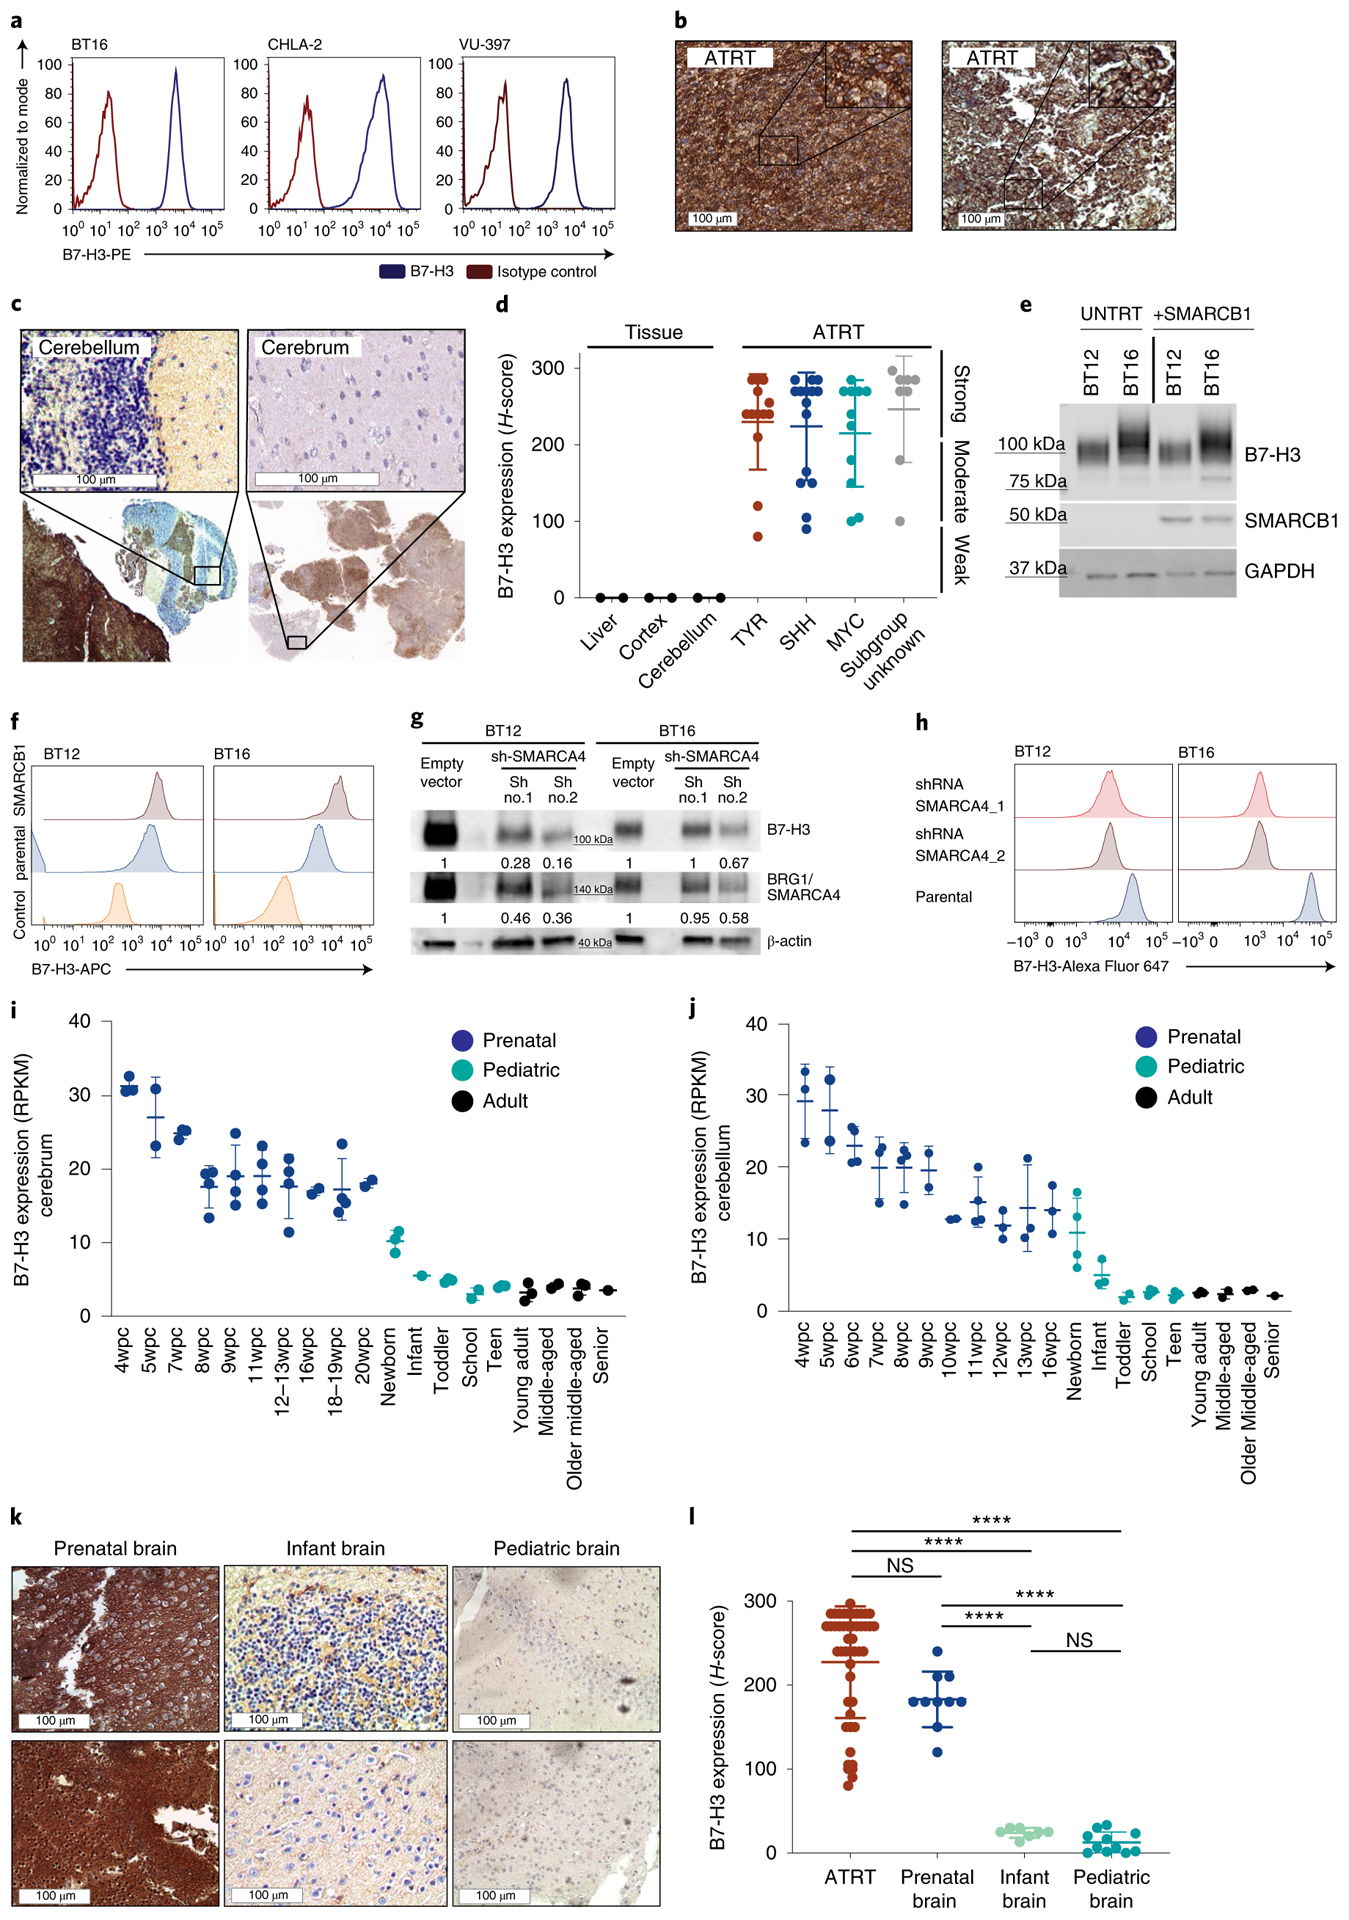
a, Flow cytometry analysis of B7-H3 expression on the ATRT cell lines BT16 (ATRT-TYR), CHLA-2 (ATRT-SHH) and VU-397 (ATRT-MYC). b,c, Representative IHC images showing B7-H3 expression on ATRT tumors (b) and two infant ATRT cases with normal adjacent cerebellum and cerebrum (top, close up; bottom, overview) (c). d,e, H-score values of B7-H3 IHC analyses calculated by multiplying the percentage of cells positive by 1, 2 or 3 based on expression level (d). Ordinary one-way ANOVA TYR versus SHH, P = 0.9955; TYR versus MYC, P = 0.9491; SHH versus MYC, P = 0.9870 (statistics were calculated by comparing only the ATRT subgroups). ATRT, n = 47; TYR n = 13; SHH n = 15; MYC n = 11; subgroup unknown, n = 8. Liver, n = 3; cortex, n = 2; cerebellum, n = 2. BT12 and BT16 ATRT cell lines were parental (UNTRT) or transduced with viral vector expressing SMARCB1. Five days later, B7-H3 and SMARCB1 protein expression levels were analyzed by western blotting (e). f, Flow cytometry analysis of B7-H3 expression from cells treated as in e. g, Western blot analysis of B7-H3 and BRG1/SMARCA4 protein in SMARCB1-deficient ATRT cell lines (BT12 and BT16) 5 d after shRNA SMARCA4 knockdown with two different short hairpins. Densitometry quantification of the fold change of B7-H3 and SMARCA4 signals was normalized to the loading control (β-actin). h, Flow cytometry analysis of B7-H3 expression on the surface of cells treated as in g. i,j, mRNA expression levels of B7-H3 in normal tissue from developing and mature cerebrum (i) (prenatal, n = 32; pediatric, n = 12; adult, n = 9) (i) and cerebellum (j) (prenatal, n = 33; pediatric, n = 17; adult, n = 8). wpc, weeks postconception. RPKM, reads per kilobase of transcript per million mapped reads. k, Representative IHC images of B7-H3 staining on normal prenatal (left), infant (middle) and pediatric brain (right). l, Summary of H-score values of B7-H3 on ATRTs (n = 47), normal prenatal brain (n = 10), infant brain (n = 7) and pediatric brain (n = 11). Ordinary one-way ANOVA ATRT versus prenatal brain, P = 0.104; ATRT versus infant brain, ****P < 10−15; ATRT versus pediatric brain, ****P < 10−15; prenatal brain versus infant brain, ****P = 8 × 10⁷; prenatal brain versus pediatric brain, ****P = 5 × 10⁻⁹; infant brain versus pediatric brain, P = 0.9741. a,e,f,g,h, Representative of two independent experiments. b,k, Experiments were performed once. All data shown are the mean ± s.d.
ATRTs manifest very few genetic mutations19, with many tumors containing only biallelic inactivating mutations in SMARCB1/INI1 (refs.4,19–21), a core subunit of the SWI/SNF (BAF) chromatin remodeling complex that regulates gene expression. We tested whether SMARCB1 deficiency drives B7-H3 expression by overexpressing SMARCB1 in ATRT cell lines. We observed no decrease in B7-H3 expression (Fig. 1e), but rather a trend toward increased cell surface expression (Fig. 1f), an observation validated in a published dataset using an inducible SMARCB1 rhabdoid cell line22 (Extended Data Fig. 1c). SMARCB1 mutant rhabdoid tumors retain residual SWI/SNF activity mediated by SMARCA4, which plays an essential role in maintaining cell viability and proliferation by preserving H3K27ac (ref.23). Consistent with SMARCA4-mediated H3K27ac driving B7-H3 expression in ATRTs, chromatin immunoprecipitation sequencing (ChIP–seq) data from primary ATRTs demonstrated enrichment of H3K27ac and SMARCA4 at the B7-H3 promoter region across all subgroups (Extended Data Fig. 1d,e); transient short hairpin RNA (shRNA) knockdown of SMARCA4 in SMARCB1-deficient ATRT cell lines reduced B7-H3 (Fig. 1g,h and Extended Data Fig. 1f). Analysis of a previously published RNA sequencing (RNA-seq) dataset of ATRT revealed a significant correlation between SMARCA4 and B7-H3 (P = 0.026) (ref.17) (Extended Data Fig. 1g).
ATRTs display characteristics of embryonic tumors5 and a recent study illustrated a critical role of developmental stage in ATRT initiation6. Therefore, we evaluated B7-H3 expression during brain development and observed that B7-H3 messenger RNA is highly expressed in the prenatal brain, but dramatically downregulated after birth24,25 (Fig. 1i,j); B7-H3 protein is high in fetal brain tissue, but very low or absent in infant (<1 year) and pediatric brain tissue (1–19 years) (Fig. 1k,l and Supplementary Table 4). The strong positive correlation between SMARCA4 and B7-H3 mRNA observed in ATRTs is also evident during brain development (Extended Data Fig. 1h) (ref.26). By contrast, miR-29, a posttranscriptional regulator of B7-H3 (ref.27), followed an inverse pattern of expression compared to B7-H3 (Extended Data Fig. 1i,j and Supplementary Table 5) (ref.27). ChIP–seq data from primary ATRTs reveals no enrichment of H3K27ac at the miR29 locus across all ATRT subgroups, suggesting low levels of miR-29 in ATRTs (Extended Data Fig. 1k). Together, these data are consistent with a model wherein B7-H3 overexpression in ATRTs is driven by residual SWI/SNF activity mediated by SMARCA4, which mirrors B7-H3 expression in an embryonic neural cell of origin from which ATRTs derive. These findings align with a recent report demonstrating conservation of fetal transcriptional programs in pediatric cerebellar tumors28. The dramatic reduction in B7-H3 expression that occurs after birth results in differential cell surface expression between ATRTs and nonmalignant postnatal brain, and provides a potential therapeutic window for CAR T cell therapy.
A previously described B7-H3.BB.z-CAR that contained a humanized single-chain variable fragment (scFv) (CD276.MG) (refs.8,29) demonstrated higher amounts of secreted interferon-gamma (IFN-γ), cytotoxicity and control of tumor cell growth against eight different ATRT cell lines compared to CD19.BB.z-CAR T cells (used as a nonspecific control) (Extended Data Fig. 2a–d). To assess in vivo efficacy, we utilized two aggressive ATRT patient-derived xenograft (PDX) models, IC-pPDX-69 and IC-pPDX-159, which belong to the ATRT-MYC subgroup and exhibit high B7-H3 expression. Because these PDX tumors were not adapted to the CNS, evaluation of CAR efficacy was assessed after engraftment in the flank (Extended Data Fig. 3a). Strikingly, B7-H3 CAR T cell administration eradicated ten out of ten and nine out of ten tumors (Extended Data Fig. 3b–f).
We next analyzed the ability for B7-H3 CAR T cells to control orthotopic ATRT xenografts using the BT16 and BT12 (refs.30,31) cells lines, which resemble the ATRT-TYR subgroup17, express high levels of B7-H3 as xenografted tumors (Fig. 2a and Extended Data Fig. 4a) and share key biological features with primary ATRTs, including rapid growth and infiltration of the ventricular and/or subarachnoid compartment30. To determine the most efficacious route of administration, we injected B7-H3.BB.z- or CD19.BB.z- CAR T cells intratumorally (IT), intracerebroventricularly (ICV) or intravenously (IV) by the tail vein (Fig. 2b). In the BT16 model, 1 × 10⁶ B7-H3 CAR T cells administered IT and ICV eradicated all established tumors, leading to a highly significant survival benefit compared to control (Fig. 2c,d, P = 0.0003, P = 0.0007, respectively), while the same B7-H3 CAR T cell dose administered IV did not cure any mice (Fig. 2e, P = NS). Similar efficacy of B7-H3.BB.z-CAR T cells was observed in the BT12 cell line (Extended Data Fig. 4). Dose titration experiments revealed that 0.25 × 10⁶ T cells administered ICV cured 60% of the mice, and 0.5 × 10⁶ CAR T cells administered ICV cured 100% of the mice, whereas, 2.5 × 10⁶ cells were required for cure in the IV group (Extended Data Fig. 5).
Fig. 2 |. Locoregional administration of B7-H3 CAR T cells is more potent and results in lower systemic inflammatory cytokine levels than iV administration against aggressive orthotopic ATRT xenografts.
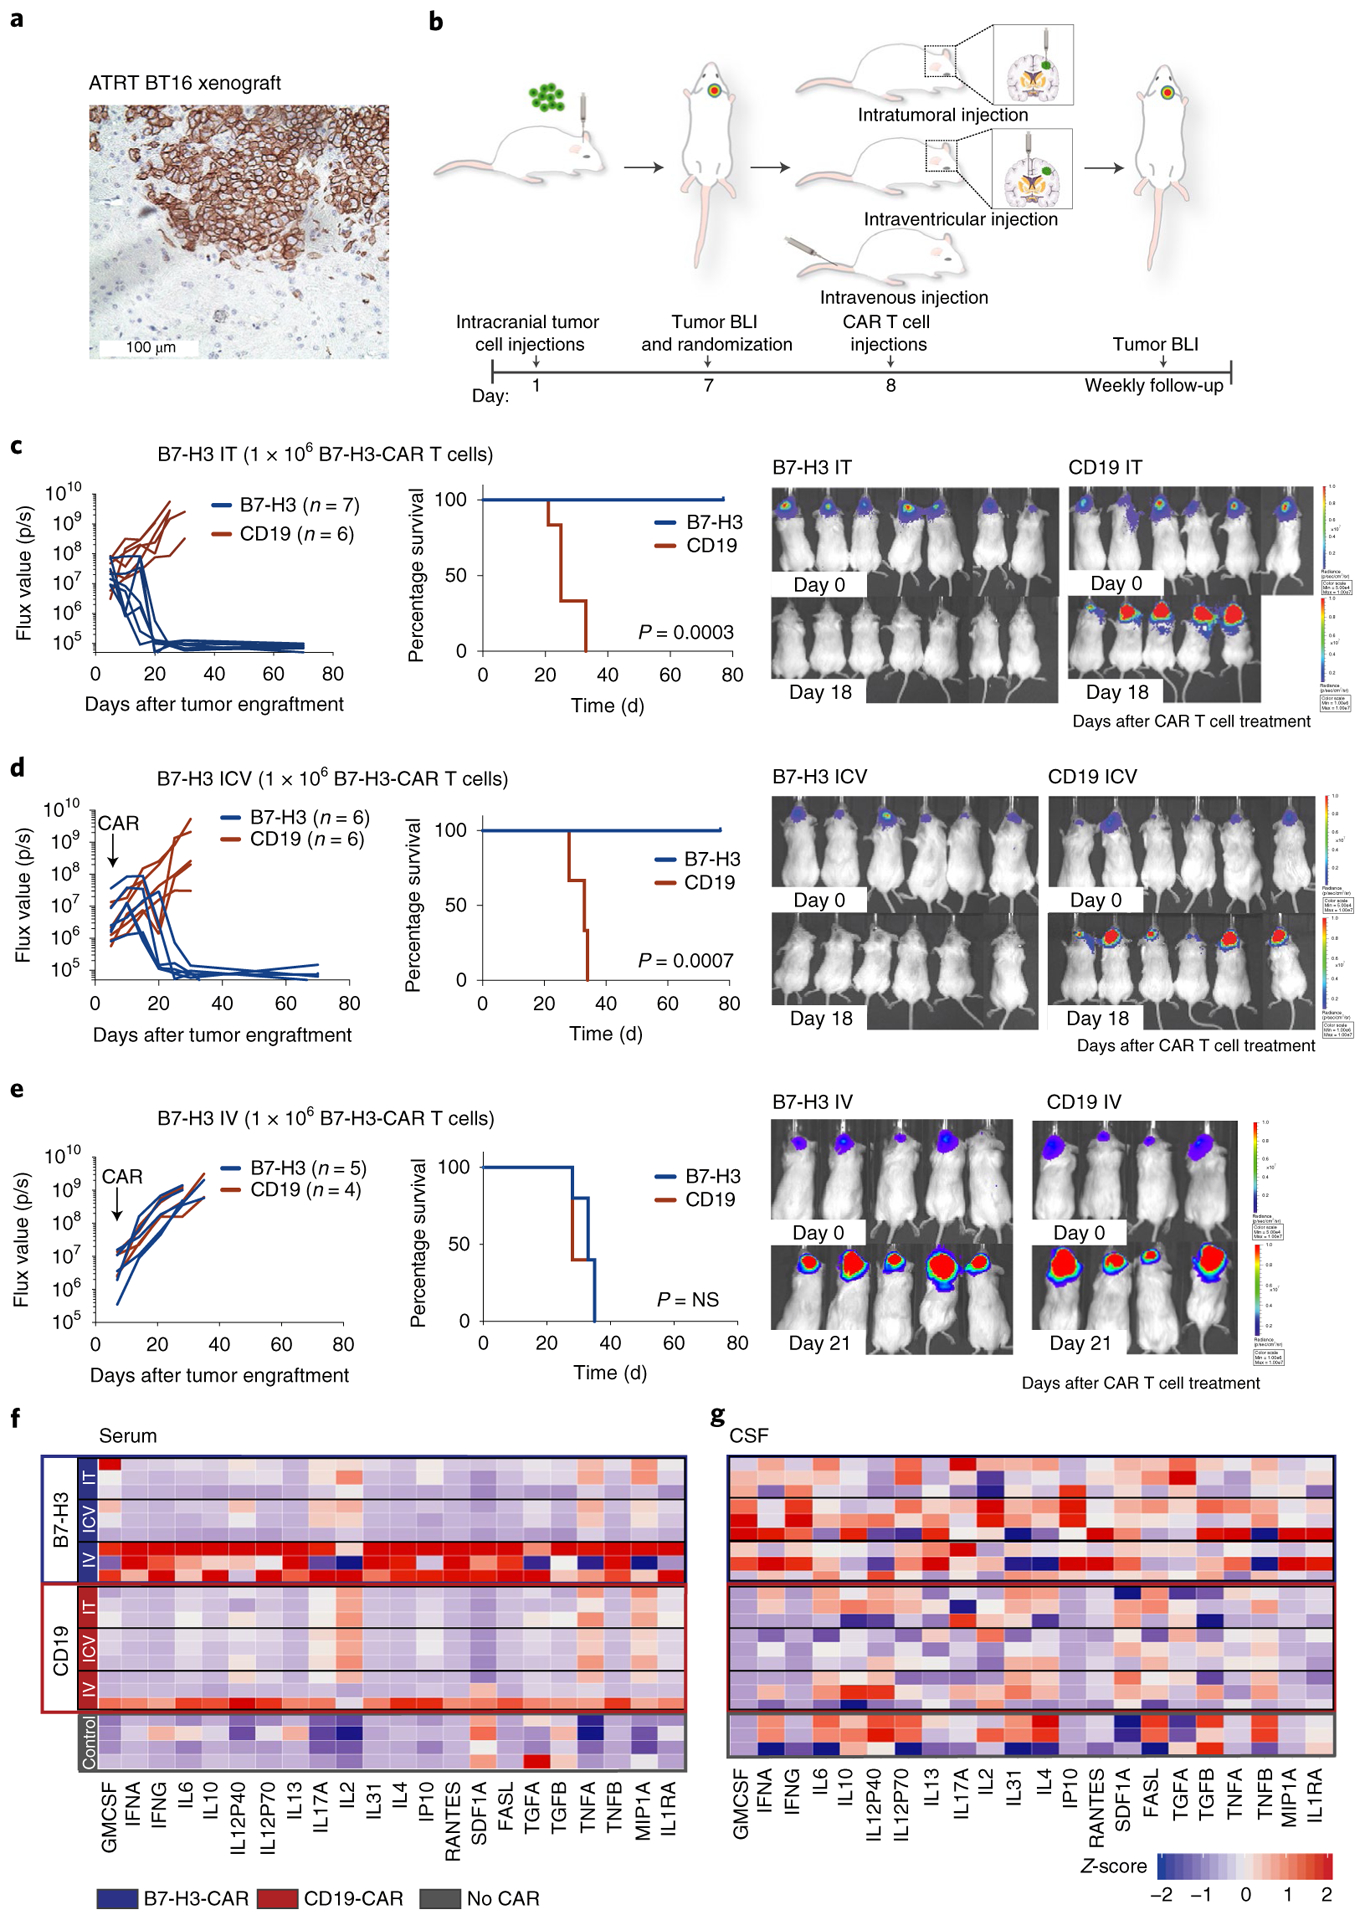
a, Representative IHC image of B7-H3 staining of the BT16 ATRT xenograft (H-score = 285). Staining was performed once. b, Experimental overview of the evaluation of in vivo efficacy of B7-H3 CAR T cells comparing different routes of CAR T cell administration. Mouse cartoon adapted from Gholamin et al.44. c, Intratumoral (IT) group 1 × 10⁶ CAR T cells. d, Intracerebroventricular (ICV) group 1 × 10⁶ CAR T cells. e, IV group 1 × 10⁶ CAR T cells. BLI was obtained serially; the flux curve and corresponding bioluminescent images at designated time points are shown. Kaplan-Meier analysis of B7-H3 versus CD19 (control) CAR T cell-treated mice (IT, P = 0.0003; ICV, P = 0.0007; IV, P = 0.74). Two-tailed, log-rank Mantel–Cox test. Experiments were conducted in two independent cohorts of mice. f,g, Heatmap of cytokines detected in the serum (f) and CSF (g) from mice 7 d after CAR T cell treatment (at curative doses: IT, ICV 1 × 10⁶ CAR T cells; IV 10 × 106 CAR T cells). Z-score values were calculated for each cytokine; for better visualization purposes, the z-score was limited to 2 s.d.; three mice per group, except for the control group in serum, n = 4. Statistics were calculated using box plots. Overall cytokine secretion in serum: CD19 IT versus B7-H3 IT, P = 0.638; CD19 ICV versus B7-H3 ICV, P = 0.025; CD19 IV versus B7-H3 IV, P = 1 × 10⁻⁷; B7-H3 IT versus B7-H3 ICV, P = 0.039; B7-H3 IT versus B7-H3 IV, P = 8 × 10⁻¹⁰; B7-H3 ICV versus B7-H3 IV, P = 6 × 10⁻¹¹. Overall cytokine secretion in the CSF: CD19 IT versus B7-H3 IT, P = 0.039; CD19 ICV versus B7-H3 ICV, P = 7 × 10⁻⁷; CD19 IV versus B7-H3 IV, P = 0.0004; B7-H3 IT versus B7-H3 ICV, P = 0.024; B7-H3 IT versus B7-H3 IV, P = 0.133; B7-H3 ICV versus B7-H3 IV, P = 0.094. Two-tailed Mann–Whitney U-test.
While limited efficacy of systemically administered CAR T cells could be overcome by increasing the T cell dose in our model, we hypothesized that systemic administration might also increase the risk of toxicity since several studies have reported that higher doses of systemically delivered CAR T cells are associated with increased severity of cytokine release syndrome and/or neurotoxicity following CD19 CAR T cell therapies12,32–34. Thus, we measured inflammatory cytokines in the serum and cerebrospinal fluid (CSF)35 following IT, ICV and IV CAR T cell administration of B7-H3. BB.z- or CD19.BB.z-CAR T cells (Fig. 2f,g). We detected significantly higher serum concentrations of inflammatory cytokines (that is, IFN-γ, interleukin-4 (IL-4), IL-10) following IV administration (Fig. 2f and Extended Data Fig. 6), while serum levels following IT or ICV administration were not elevated compared to control animals. Cytokine levels in intravenously treated mice decreased on day 13 after CAR T cell administration (Extended Data Fig. 6). In the CSF, we observed increased levels of inflammatory cytokines in all B7-H3.BB.z-CAR compared to CD19.BB.z-CAR-treated mice, regardless of the route of administration, with no significant difference between mice treated IV and ICV (Fig. 2g). Together, the data demonstrate that B7-H3.BB.z-CAR T cells mediate potent antitumor effects in ATRTs following IT or ICV delivery without incurring elevations in systemic inflammatory cytokines, whereas the doses required for efficacy following IV delivery are associated with increased systemic levels of inflammatory cytokines. While assessing cytokine release syndrome and neurotoxicity in mouse models is challenging, our data suggest that locoregional administration of CAR T cells may be less toxic than systemic delivery.
To test whether trafficking and tumor infiltration of CAR T cells were affected by the route of administration36,37, we administered NanoLuc luciferase-expressing CAR T cells to track CAR T cell expansion and localization following IT, ICV and IV administration (Fig. 3a–c and Extended Data Fig. 7a). Despite a tenfold higher dose of CAR T cells administered IV, bioluminescence imaging (BLI) revealed that 5 d after ICV or IT CAR T cell administration, B7-H3 CAR T cells were already present within the tumor, but were not yet detectable following IV administration (Fig. 3c,d, IV versus ICV, P = 0.011; IV versus IT, P = 0.048). Similarly, immunofluorescence analysis of tissue sections revealed that 2 d after administration, B7-H3 CAR T cells administered IT or ICV had penetrated the tumor, whereas B7-H3.BB.z-CAR T cells administered IV could not be detected (Fig. 3e). Control CD19.BB.z-CAR T cells were only observed in tumors following IT administration (Fig. 3e) and Ki67 expression, a marker for proliferation, was exclusively observed in B7-H3.BB.z-CAR T cells, but not CD19.BB.z-CAR T cells, indicating antigen-specific reactivity (Extended Data Fig. 7b). Analysis of brains 47 d after infusion showed that CAR T cells persisted in the brain in all groups, with no significant differences in number based on the route of administration (Fig. 3f,g).
Fig. 3 |. Locoregionally administered B7-H3 CAR T cells home more rapidly to cerebral ATRT xenografts than those administered intravenously. B7-H3 CAR T cells administered intracerebroventricularly efficiently migrate out of the CNS.
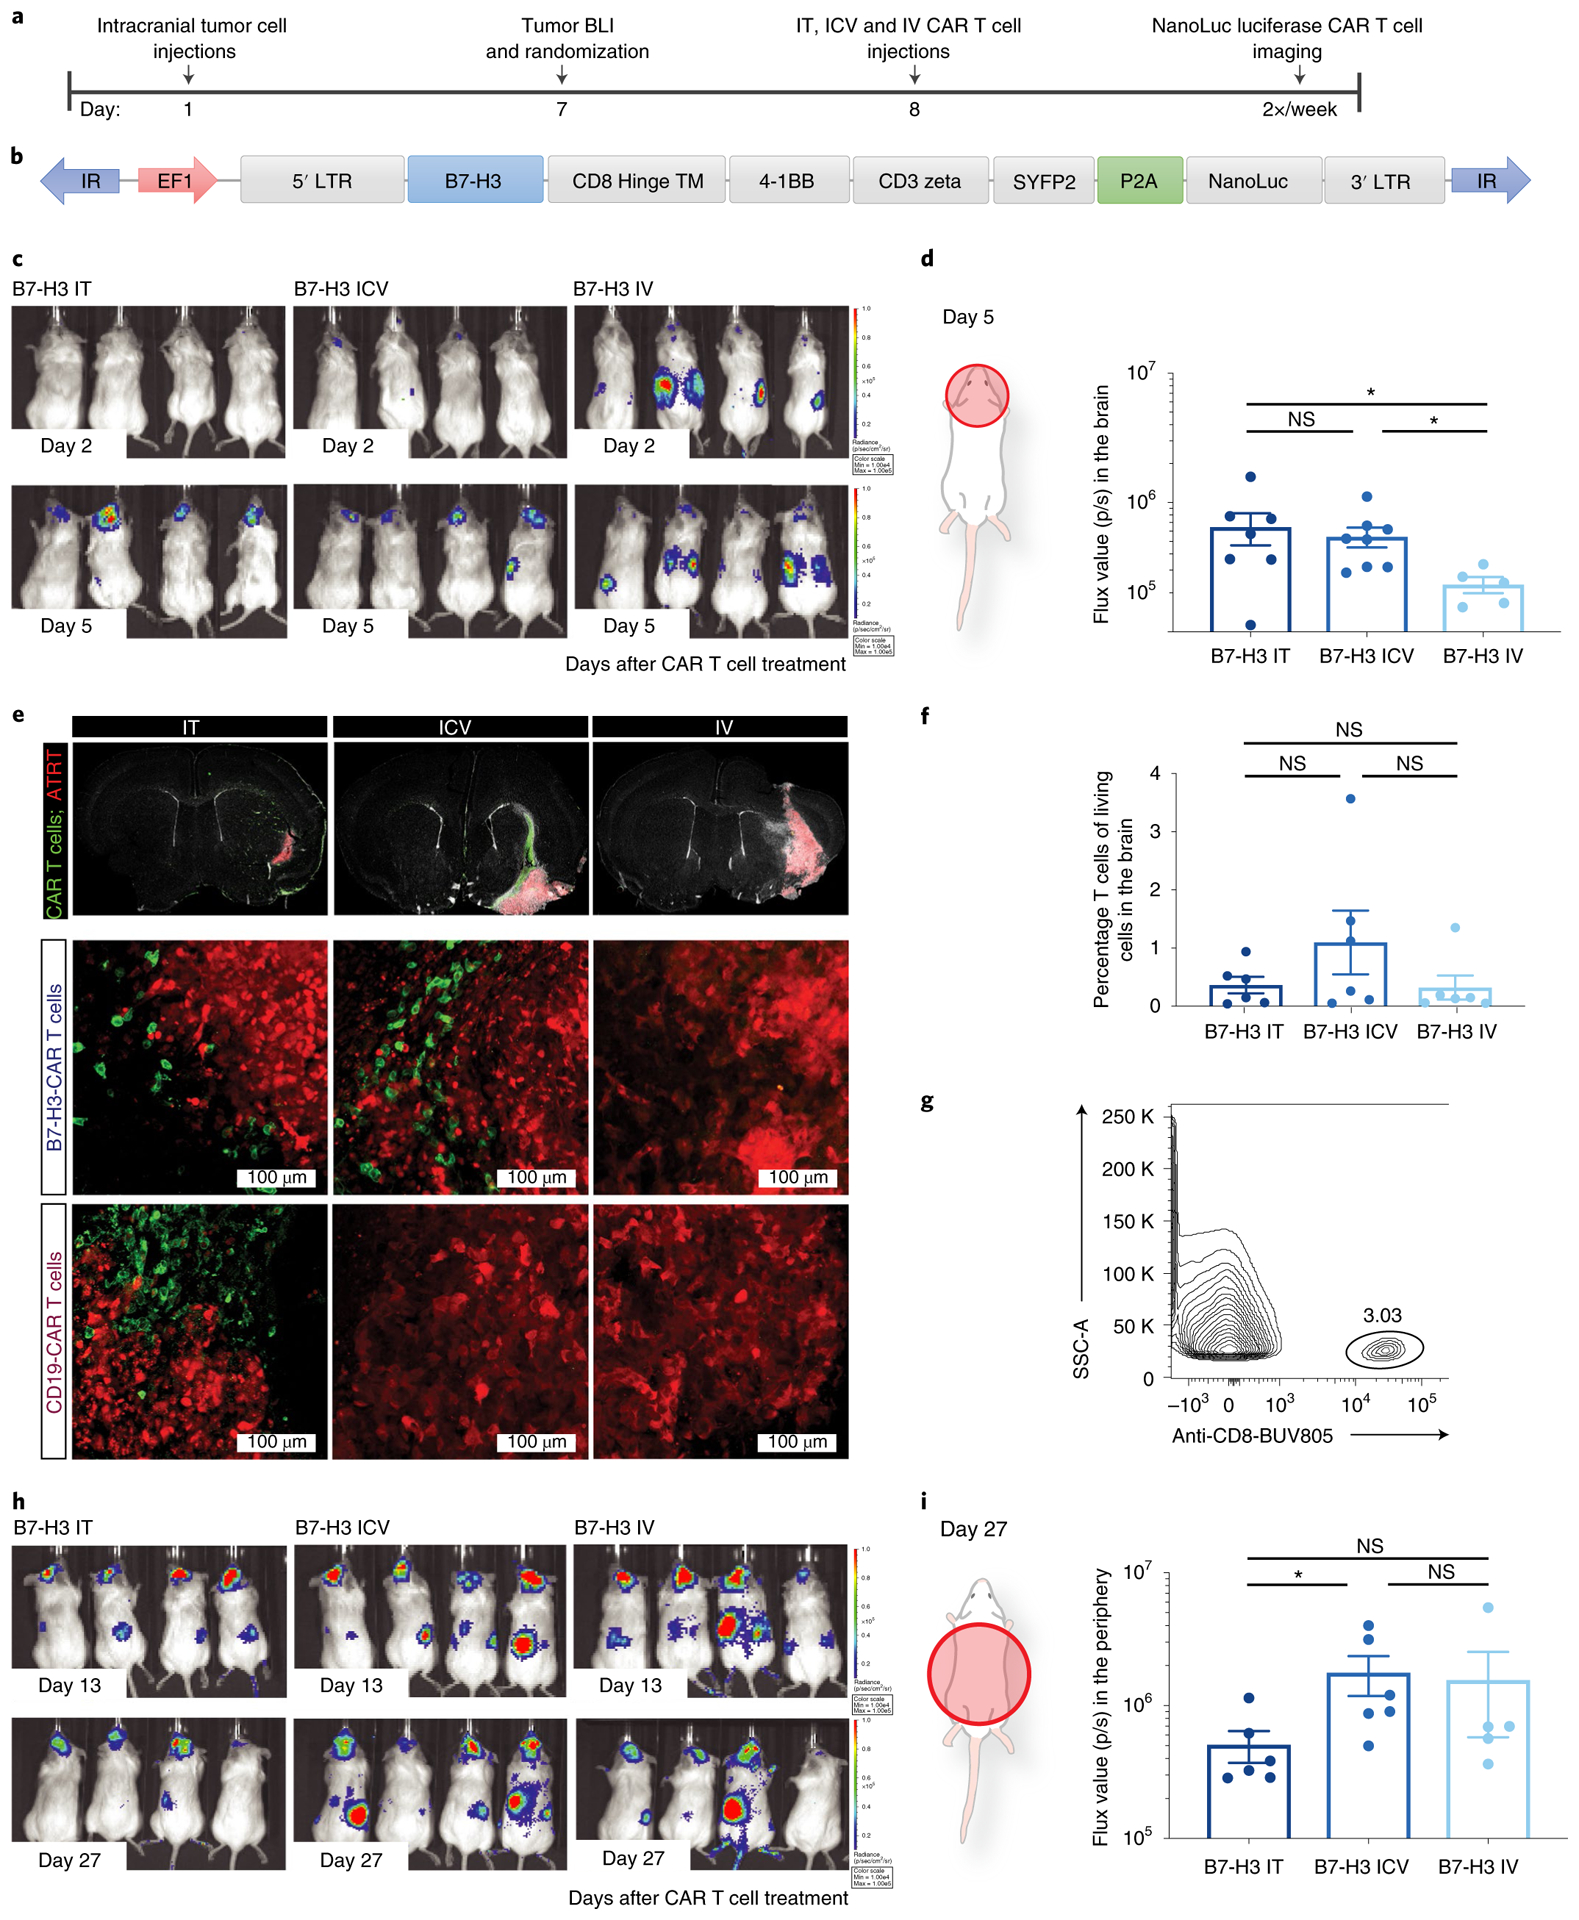
a, Experimental setup (IT, ICV: 1 × 10⁶ CAR T cells; IV: 10 × 106 CAR T cells). LTR, long terminal repeat. b, Bicistronic vector expressing NanoLuc luciferase and the CAR T cell fused to a fluorescent protein. c, BLI signal emanating from the CAR T cells was measured at the indicated time points. d, Quantification of BLI signal in the brain of mice on day 5 after treatment (n = 7 IT, n = 8 ICV and n = 5 IV B7-H3 CAR T cell-treated mice). IT versus ICV, P = 0.613; IT versus IV, *P = 0.048; ICV versus IV, *P = 0.011 (two-tailed Mann–Whitney U-test). Experiments were conducted in two independent cohorts of mice. e, Immunofluorescence microscopy imaging of brains from mice on day 2 after treatment. B7-H3 or control CD19 CAR T cells are shown in green in mice that were previously engrafted with BT16 ATRT cells (red). Tiled images across engrafted regions (top), representative confocal microscopy of B7-H3 CAR T cell-treated groups (middle) and CD19 - CAR T cell-treated groups (bottom) are shown. Scanning of 1:12 series from three independent mice per group. f,g, Quantification (f) and representative flow cytometry (g) showing persisting T cells in the brain following administration of 1 × 10⁶ (IT and ICV) or 10 × 106 (IV) B7-H3 CAR T cells (n = 6 IT, n = 6 ICV and n = 6 IV B7-H3 CAR T cell-treated mice). Pooled data from two independent experiments (IT versus ICV, P = 0.394; IT versus IV, P = 0.732; ICV versus IV, P = 0.394). Two-tailed Mann–Whitney U-test. h, BLI 13 and 27 d after B7-H3 CAR T cell treatment. i, Quantification of BLI signal in the trunk of mice on day 27 after treatment (IT versus ICV, *P = 0.026; IT versus IV, P = 0.178; ICV versus IV, P = 0.329; n = 6 IT, n = 6 ICV and n = 5 IV B7-H3 CAR T cell-treated mice). Two-tailed Mann–Whitney U-test. All data shown are the mean ± s.e.m.
We and others have shown that CAR T cells can migrate from the periphery to the brain13,38; preclinical and clinical studies have demonstrated that CAR T cells administered ICV can effectively traffic and target multifocal tumor lesions within the CNS16,37. However, less is known of whether T cells administered into the CNS efficiently traffic to the periphery. We next analyzed migration and persistence of CAR T cells delivered IT and ICV 13 d after treatment, and found that a significant fraction of CAR T cells had trafficked to the periphery, most notably to the spleen and liver (Fig. 3h), with significantly higher numbers of T cells found in the periphery of mice treated ICV compared to mice treated IT (Fig. 3h,i). In addition, we detected a trend toward higher frequencies of splenic CAR T cells in mice treated ICV versus mice treated IV, despite a tenfold lower dose (Extended Data Fig. 7c,d); the ratio of splenic CAR T/mock T cells was significantly higher in the group treated ICV (P = 0.04; Extended Data Fig. 7e), suggesting that a greater fraction of CAR T cells administered IV did not expand and/or never trafficked to the CNS tumor. Together, these data demonstrate that CAR T cells administered locoregionally (IT, ICV) home rapidly to the site of intracranial tumors, expand early in the presence of tumor antigen, and that CAR T cells administered ICV migrate efficiently out of the CNS and persist in the periphery at levels similar to those in mice receiving a tenfold higher dose via the IV route. Although this migratory ability may pose a potential risk for toxicity, systemically delivered mouse B7-H3- CAR T cells were recently evaluated in an immunocompetent model of pancreatic cancer with no observed toxicity7.
To evaluate if CAR T cells persisting after tumor eradication can mediate protection from rechallenge, and whether protection differs according to the route of administration, we rechallenged cured mice in the contralateral cerebral hemisphere with the same tumor line 40 d after infusion of one dose of IT, ICV or IV CAR T cells (Fig. 4a). To control for xenogeneic immune responses and/or nonspecific tumor rejection, we generated a BT16/B7-H3 knockout cell line using CRISPR–Cas9 (Fig. 4b,c). B7-H3 knockout cells were morphologically similar to their parental counterpart but displayed a slight decrease in proliferative rate in vitro and in vivo (Extended Data Fig. 8). At the time of CNS rechallenge, immunofluorescence microscopy revealed only few persisting T cells in the brains of all groups (Fig. 4d). After CNS rechallenge, all tumors from the parental line were rejected, whereas all B7-H3 knockout tumors progressed (Fig. 4e,f). To evaluate if CAR T cells delivered ICV and/or IV protect from rechallenge with peripheral tumors, we rechallenged mice with BT16/B7-H3 knockout or parental cells in the flank. We observed antigen-specific tumor protection in both groups (IV group, P = 0.0002; ICV group, P = 0.008; Fig. 4g,h). Similar to the results with CNS rechallenge, despite a tenfold lower dose in the ICV group, CAR T cells delivered IV and ICV were equally efficient at rejecting extra-CNS tumors (P = NS). These results demonstrate that B7-H3.BB.z-CAR T cells not only can clear established brain ATRTs in immunodeficient mice, but also mediate antigen-specific immune memory capable of protecting from rechallenge in the brain or periphery regardless of the route of CAR T cell administration. Since rhabdoid tumors can also occur outside the CNS, most often in the kidney, and CNS and non-CNS rhabdoid tumors may present in a synchronous fashion, especially in patients with germline mutations, this property may be clinically beneficial39,40.
Fig. 4 |. B7-H3 CAR T cells persist in the brain and lead to antigen-specific protection from tumor rechallenge.
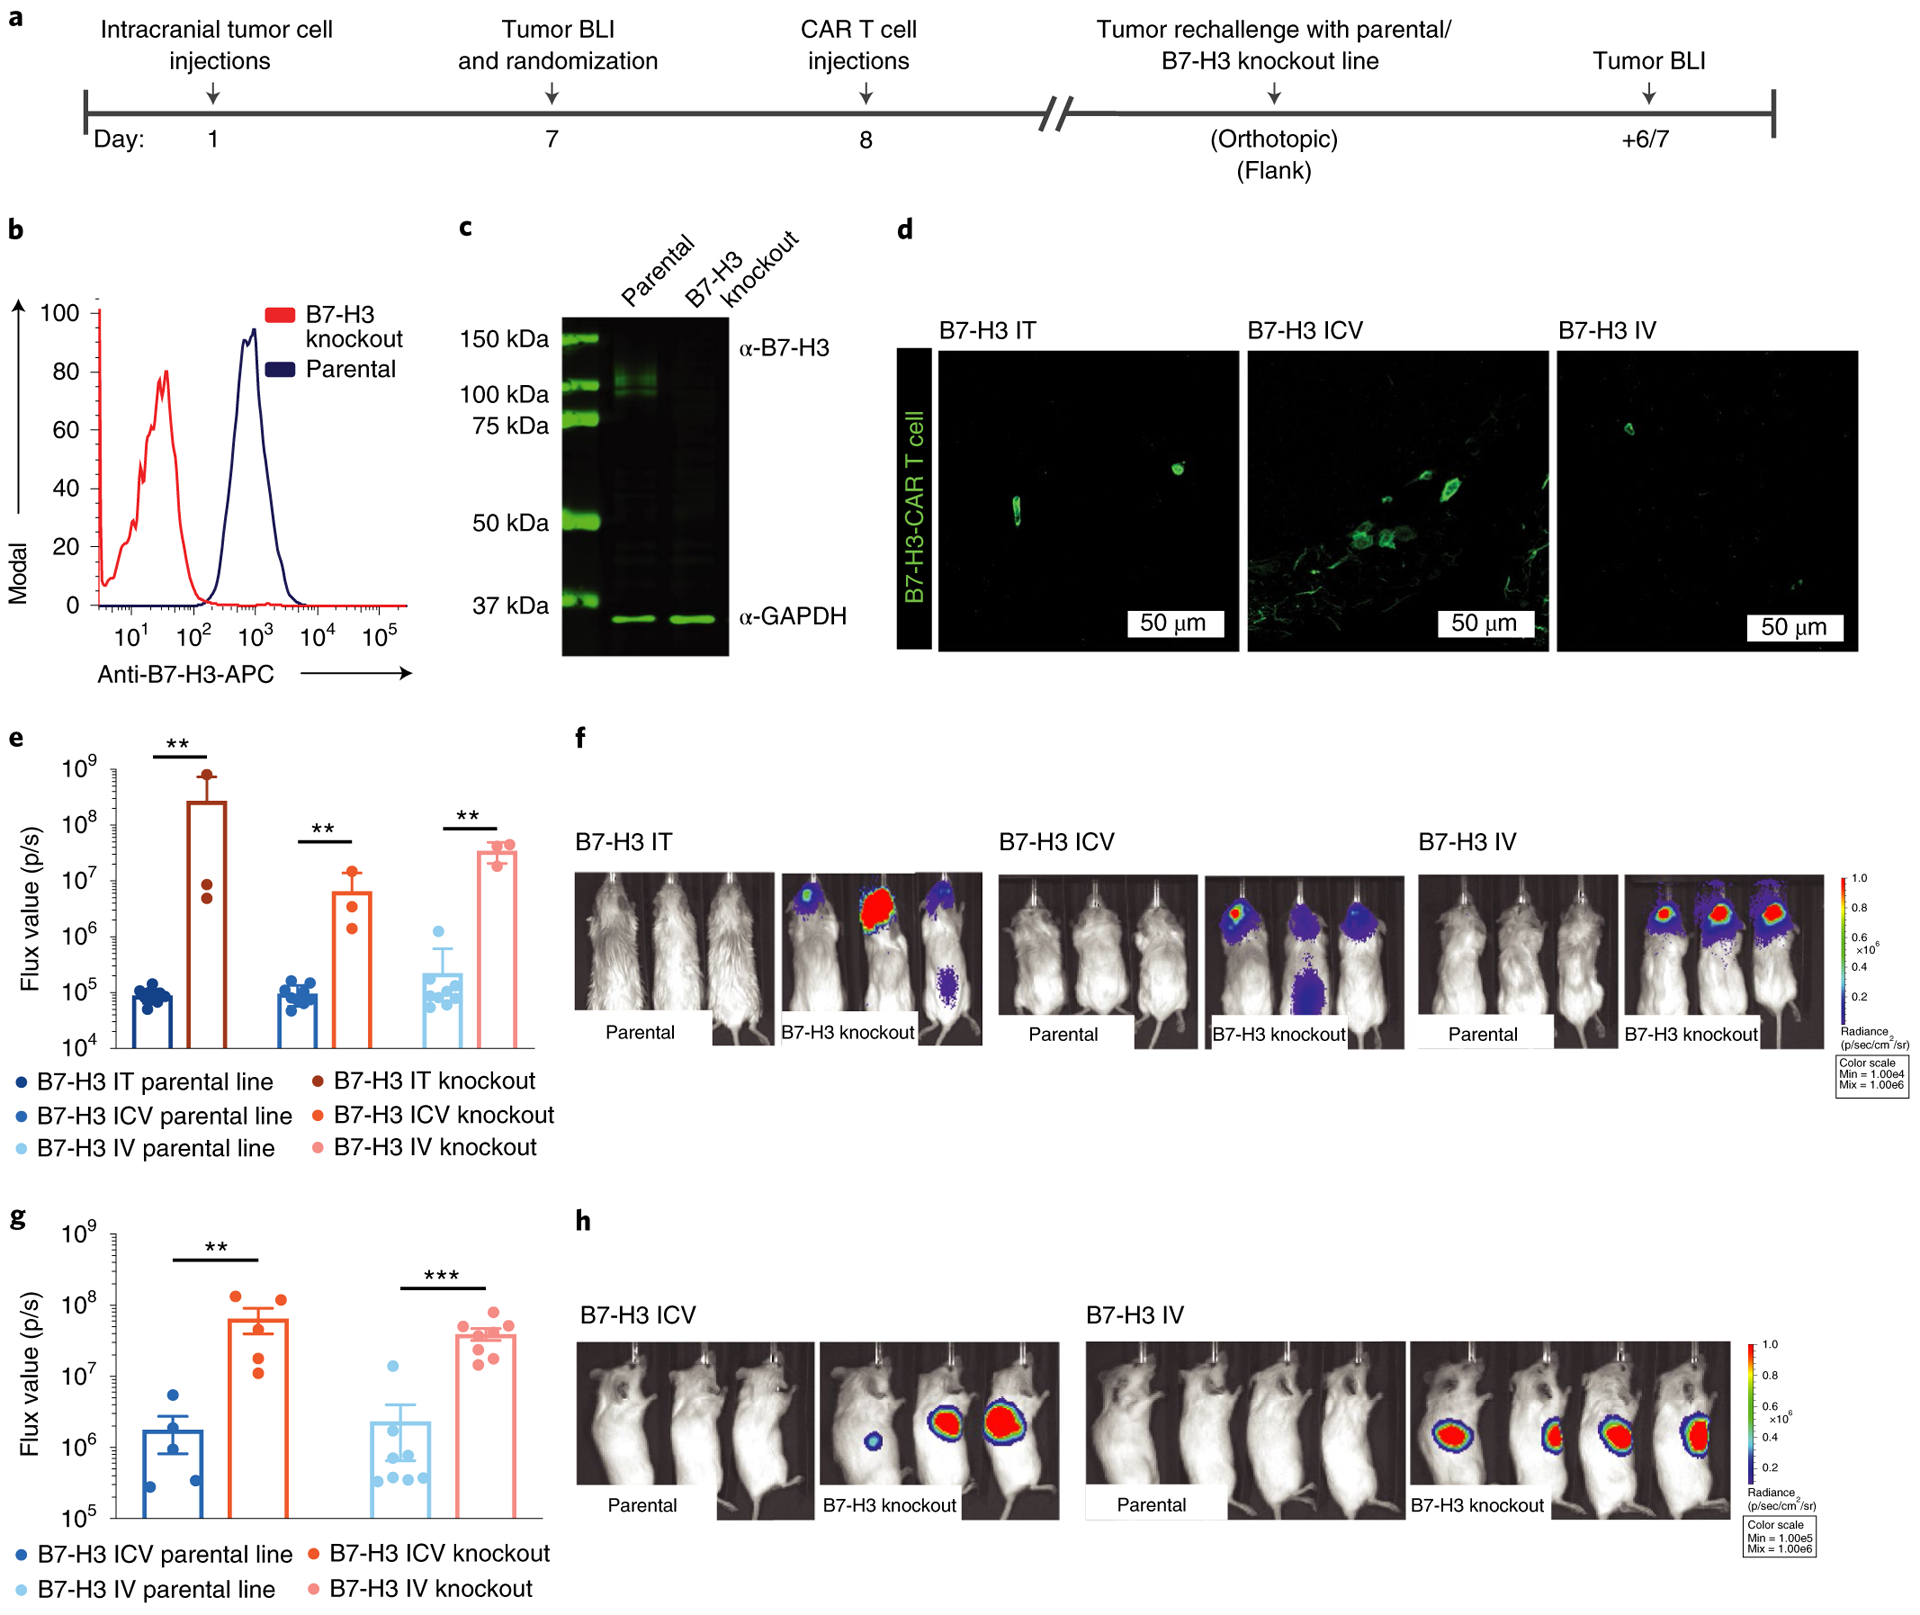
a, Treatment scheme for in vivo validation of functional CAR T cell persistence (IT, ICV, 1 × 10⁶ CAR T cells; IV, 10 × 106 CAR T cells). b,c, Flow cytometry (b) and western blot analysis (c) of B7-H3 expression on a CRSIPR–cas9-edited (knockout) ATRT cell line. Representative of two independent experiments. d, Confocal microscopy analysis of persisting B7-H3 CAR T cells in the brain 40 d after a single administration in mice treated IT, ICV or IV. Scanning of individual sections with persisting CAR T cells from three independent mice per group was performed and a representative immunofluorescence image is shown. e, Pooled flux values of two independent experiments (one rechallenge with parental line and one parental versus knockout line; IT, n = 10 parental versus 3 knockout; ICV, n = 9 parental versus 3 knockout; IV, n = 9 parental versus 3 knockout). f, BLI images of one representative experiment 6 d after orthotopic rechallenge with BT16 or BT16/B7-H3 knockout tumor cells (IT group: BT16 versus B7-H3 knockout, **P = 0.007; ICV group: BT16 versus B7-H3 knockout, **P = 0.009; IV group: BT16 versus B7-H3 knockout, **P = 0.009). Two-tailed Mann–Whitney U-test. g, Pooled flux values of two independent experiments (ICV: n = 5 parental versus 5 knockout; IV: n = 8 parental versus 8 knockout). h, BLI images after flank rechallenge with BT16 or BT16/B7-H3 knockout tumor cells (ICV group: BT16 versus B7-H3 knockout, **P = 0.008; IV group: BT16 versus B7-H3 knockout, ***P = 0.0002; BT16 ICV versus BT16 IV, P = 0.9433). Two-tailed Mann–Whitney U-test. All data shown are the mean ± s.e.m.
Data on CAR T cells administered ICV or IT in CNS malignancies in humans are scarce and mostly report unsuccessful results (NCT03638167, NCT03500991, NCT02442297 and NCT02442297) with the exception of one patient with multifocal glioblastoma who experienced a complete response after multiple ICV and IT CAR T cell infusions targeting interleukin-13 receptor subunit alpha-2 (IL-13RA2) (ref.16) No CAR T cells were found in the blood and there was limited persistence of CAR T cells in this patient16. The distinction could be related to the lack of lymphodepletion in the clinical setting, which has been shown to improve CAR T cell persistence and expansion41. Whether lymphodepletion is necessary for T cells delivered ICV to traffic and persist in the periphery is an area of future study, which should be undertaken in immunocompetent murine models of CNS ATRT; these are currently lacking. Furthermore, because murine and human B7-H3 differ functionally and structurally42,43, it is important to note that CAR T cells targeting murine B7-H3 may show different activity and efficacy than CAR T cells targeting human B7-H3 as evaluated in this study.
In summary, we have discovered that ATRTs, but not pediatric or adult brain tissue, express high levels of B7-H3, probably reflecting the developmental stage of these embryonic tumors; thereby, they credential B7-H3 as a promising immunotherapeutic target for this lethal cancer. We demonstrated that B7-H3 CAR T cells are highly active against ATRTs in vitro and in xenograft murine models and that ICV delivery may be preferable for the treatment of these tumors since curative doses demonstrate more rapid kinetics, greater potency and diminished systemic levels of inflammatory cytokines compared to CAR T cells administered IV. We also show a remarkable capacity of CAR T cells to mediate immunological memory both in the brain and in the periphery, regardless of whether cells are administered via the IV or ICV route. These findings have direct implications for clinical testing of CAR T cell-based immunotherapies for ATRTs and other CNS malignancies for which current therapeutic options have proven widely ineffective.
Methods
Primary tissue samples.
Archived samples of ATRTs and normal tissue (adult liver, different brain regions of various ages) were obtained from multiple sources (Stanford University, University of California, San Francisco, Universitätsklinikum Münster and University of British Columbia) as unstained slides. Informed consent was obtained from all participants or their guardians to use their samples for research. Where local institutional review boards confirmed that de-identified analyses did not constitute human patient research, informed consent was waived. Fetal brain tissues were de-identified and handled according to Stanford University’s policy.
Cells and culture conditions.
Cell lines were infected with porcine teschovirus-1 2A (P2A)-tdTomato or green fluorescent protein (GFP)-P2A-firefly luciferase retrovirus, double-sorted for tdTomato or GFP signal and passaged in either DMEM, 10% FCS, penicillin-streptomycin and GlutaMAX (BT12, BT16, CHLA-266 cell lines) or neural stem cell expansion media consisting of Neurobasal-A medium (Invitrogen), B27-A (Invitrogen), human basic fibroblast growth factor (20 ng ml−1) (Shenandoah Biotechnology), human epidermal growth factor (20 ng ml−1) (Shenandoah Biotechnology), human recombinant leukemia inhibitory factor (Millipore, as required) and heparin sulfate (10 ng ml−1) (CHLA-2, CHLA-4, CHLA-5, CHLA-6, VU-397, ATRT-CHB-1, ATRT 13808).
Plasmids.
The CAR constructs used in this study were expressed from MSGV-derived vectors containing a granulocyte-macrophage colony-stimulating factor leader sequence, CD8α stalk and transmembrane domains, and 4–1BB and CD3ζ endodomains45. The scFv of the MGA271 anti-B7-H3 antibody29, with heavy and light chains fused via a (GGGGS)3 linker, was inserted between the granulocyte-macrophage colony-stimulating factor signal sequence and the CD8α hinge domain to generate the B7-H3-BBz-CAR. A similar approach was used for the CD19-BBz-CAR using an scFv derived from the FMC63 anti-CD19 antibody, as described previously45. CAR constructs with reporter proteins were constructed by fusing the yellow fluorescent protein SYFP2 (ref.46) to the C terminus of CD3ζ, followed by a P2A ribosome skipping site47 and NanoLuc luciferase48 (CAR-BBz-SYFP2-P2A-NLuc).
The INI1 expression cassette was constructed by inserting the coding sequence for INI1 (National Center for Biotechnology Information accession code NM_003073) into a tricistronic MSGV-based vector with reporter proteins in the following order: INI1-P2A-tdTomato-P2A-firefly luciferase.
The lentiviral pLKO.1-puro-shSMARCA4 vector and pLKO.1-puro empty vector used as the control have been described previously23.
Lentiviral infection of rhabdoid cells.
Transduction of the BT12 and BT16 rhabdoid cell lines with pLKO.1-puro-shSMARCA4 has been described previously23. Briefly, viral particles at a multiplicity of infection of 5 were added to the culture media. For antibiotic selection, 1 μg ml−1 puromycin (Invitrogen) was used. The efficiency of SMARCA4 expression was assessed 5 and 7 d postinfection.
CAR T cell transduction.
Retroviral supernatant for the B7-H3.BB.z- or CD19. BB.z-CAR T cells was produced by transient transfection of 293GP cells with the corresponding CAR plasmid and an RD114 envelope plasmid. Peripheral blood mononuclear cells were thawed and activated using anti-CD3/CD28 beads (Dynabeads, Human T-Activator CD3/CD28; Thermo Fisher Scientific) at a 3:1 bead:T cell ratio and cultured for 2 or 3 d. Two rounds of transductions with supernatants containing retrovirus on RetroNectin-coated nontissue culture plates (on-plate method according to the manufacturer’s instructions; Takara) were performed on days 2 and 3 or 3 and 4 of culture, followed by magnetic bead removal on day 4 or day 5. During the whole process, cells were cultured in AIM V medium containing 100 U ml−1 IL-2. For all in vitro and in vivo assays, CAR T cells were used on days 9–11 of culture.
T cell functional assays.
IFN-γ release was assayed by coincubating 100,000 CAR+ T cells and 100,000 tumor cell targets (1:1 ratio) in complete AIM V medium without IL-2. At 24 h, supernatants were collected and cytokines were measured with a Human Cytometric Bead Array Kit (BD Biosciences).
Proliferation and killing assay.
For real-time analyses, the IncuCyte ZOOM System (Essen Bioscience) was used. For the proliferation assay, BT16-red fluorescent protein (RFP) or BT16-B7-H3 knockout RFP cells were seeded into 96-well plates. For the killing assays, BT12-GFP or BT16-RFP cells were coincubated with different ratios of B7-H3.BB.z- or CD19.BB.z-CAR T cells. The culture plates were incubated using an IncuCyte ZOOM System in a cell culture incubator. Cell images were captured in four fields per well every 2–3 h. Total red or green object integrated intensity (gas calibration unit × μm2 per image) was determined using the IncuCyte ZOOM software ver2016B (Essen Bioscience).
Generation of B7-H3 knockout cell lines.
Gene-edited B7-H3 knockout cell lines were generated by electroporation of single guide RNA (sgRNA)/Cas9 ribonucleoprotein complexes using the 4D Nucleofector System and the SE Cell Line 4D Nucleofector X Kit S (catalog no. V4XC-1032; Lonza). To select the B7-H3-targeting guide RNA sequences, CRISPOR version 4 (http://www.crispr.tefor.net/) was used as a tool; the synthetic sgRNA target sequence 5′-GTGCAGCCCTGGGAGCACTGTGG-3′ (protospacer adjacent motif in bold) was synthesized with chemical modifications (Synthego). Ribonucleoprotein complexes were formed by mixing 6 μg Cas9 nuclease (Alt-R S.p. Cas9 Nuclease V3, catalog no. 1081059; Integrated DNA Technologies) and 3.2 μg of sgRNA and incubating them for 10 min at room temperature. The BT12 and BT16 cell lines were collected, washed with PBS twice; 1 × 10⁶ cells were resuspended in 20 μl of Lonza buffer and added to 16-well Nucleocuvette Strips. Precomplexed sgRNA/Cas9 was added and electroporation was performed using the MG-63 (BT12) or HEK293 (BT16) program. After electroporation, complete medium was added and cells were expanded for 4 d before analysis by flow cytometry.
Antibodies and flow cytometry analyses.
Staining for B7-H3 expression on tumor lines was performed with phycoerythrin (PE)- or allophycocyanin (APC)-conjugated mouse anti-human B7-H3 antibody (clone 185504; R&D Systems). CAR expression on transduced T cells was also measured by flow cytometry. CAR T cells were stained with Pierce biotinylated recombinant protein L (Thermo Fisher Scientific), followed by fluorophore-conjugated streptavidin (BD Biosciences). For T cell detection, anti-human CD4 and CD8 were used (clone SK3 and SK1, respectively; BD Biosciences). All staining was performed in 0.1 ml fluorescence-activated cell sorting buffer (PBS + 2% bovine serum albumin). Flow cytometry was performed using a BD LSRFortessa (BD Biosciences) and analyzed with the FlowJo software version 10.4.2 (FlowJo LLC).
B7-H3 surface molecule quantification.
B7-H3 surface molecule expression was assessed using the Quantibrite-PE Assay Kit (BD Biosciences). Briefly, 10,000 Quantibrite-PE events were recorded. Afterwards, the assay was recorded with the same instrument settings. This allowed the calculation of the number of PE molecules bound per cell. By using known ratios of PE to antibodies, we could then convert PE molecules per cell to antibodies per cell.
Immunohistochemistry (IHC).
IHC for B7-H3 was performed using a Ventana DISCOVERY platform and an R&D Systems antibody (goat polyclonal antibody, catalog no. AF1027) at a 1:300 dilution. Briefly, formalin-fixed paraffin-embedded tissue sections were deparaffinized and rehydrated before being incubated in Tris-EDTA buffer (cell conditioning 1 standard) at 95 °C for 36 min to retrieve antigenicity. Subsequently, incubation with the primary antibody for 2 h and no heat was performed. Tissue sections with bound primary antibody were then incubated with rabbit anti-goat secondary antibodies (1:500 dilution, catalog no. 305-005-045; Jackson ImmunoRsearch), followed by UltraMap anti-rabbit horseradish peroxidase and ChromoMap DAB detection. Staining specificity was confirmed independently by two MDs with pathology training. Tumor sections were scanned and B7-H3 and IHC was quantified blindly by an MD with pathology training (AD) for staining intensity (0–3) and percentage of positive cells (0–100%). For each sample, the H-score was calculated as staining intensity (0–3) × percentage of positive cells. A B7-H3 positivity score for each scanned section was also determined automatically with the Aperio ImageScope software. If H-score values were obtained for different regions of the brain, an average was calculated and reported.
Immunofluorescence.
Mice were deeply anesthetized with tribromoethanol (Avertin) before being perfused transcardially with cold PBS. Brains were fixed overnight in 4% paraformaldehyde/PBS and transferred to 30% sucrose for 2 d. Serial 40-μm coronal sections were then cut on a freezing microtome and serial sections were stained (1:12 series) overnight at 4 °C with anti-GFP (1:1,000; Abcam), anti-RFP (1:1,000; Abcam) or anti-Ki67 (1:1,000; Cell Signaling Technology). Secondary antibodies raised in donkey and conjugated with Alexa Fluor 488 or 647 were used at 4 °C overnight to detect primary labeling (1:500; Jackson ImmunoResearch) and counterstained with 4,6-diamidino-2-phenylindole. Mounted samples were imaged by confocal microscopy (LSM 710; ZEISS); acquired Z stacks through the tumor region were flattened by maximum intensity projection (ImageJ version 1.51g; National Institutes of Health). Tile images were acquired on an upright epifluorescence microscope with motorized stage (Axio Imager M2; ZEISS) and tile scanning software Stereo Investigator, version 2019.1.3 (MBF Bioscience).
Methylation array.
DNA methylation profiling from ATRT cells lines was performed using the Illumina Methylation EPIC BeadChip 850K array platform at the German Cancer Research Center (DKFZ) Genomics and Proteomics Core Facility according to the manufacturer’s instructions and as described previously23.
Analysis of H3K27ac at the CD276 promoter and miR-29 locus in primary ATRT samples.
H3K27ac ChIP–seq data was already available from Johann et al.17 and short-read sequencing data have been deposited at the European Genome-phenome Archive (http://www.ebi.ac.uk/ega/) hosted by the European Bioinformatics Institute under accession no. EGAS00001001297.
Immunoblotting.
Whole-cell protein lysates from BT12 and BT16 cells were obtained in radioimmunoprecipitation assay buffer. Protein concentrations were estimated by Bio-Rad colorimetric assay. Immunoblotting was performed by loading 10 μg of protein onto 7.5% or gradient 4–20% polyacrylamide electrophoresis gels followed by transfer to polyvinyl fluoride membranes. Signals were detected by enhanced chemiluminescence (Pierce) or with the Odyssey imaging system (LI-COR). The following primary antibodies were purchased from Abcam: SMARCA4/BRG1 (catalog no. ab110641), β-actin (catalog no. ab49900) and CD276 (catalog no. ab89133). The SMARCB1/BAF47 (catalog no. 91735) and GAPDH (catalog no. 97166) antibodies were from Cell Signaling Technology.
Quantitative, reverse transcription PCR (RT–qPCR).
A total of 1,000 ng of RNA was converted into complementary DNA (cDNA) using the High-Capacity RNA-to-cDNA Kit (Applied Biosystems) according to the manufacturer’s instructions. RT–qPCR was performed using the Power SYBR Green Master Mix (Thermo Fisher Scientific) using a ViiA7 PCR system (Applied Biosystems). Standard ΔΔCt quantification of cDNA amplification was done using GAPDH as the reference. The following oligonucleotides were used (5′ > 3′): GAPDH forward: CAGGTCATCCATGACAACTTTG; GPADH reverse: GTCCACCACCCTGTTGCTGTAG; CD276 forward: CTGAGGCTGAGGTGTTCTGG; CD276 reverse: CACGGCTCCTGGTGGGG.
RNA extraction and micro RNA (miRNA) expression analysis.
Total RNA was extracted from six ATRT cell lines, mature and immature neurons using the Direct-zol RNA Kit (Zymo Research) according to the manufacturer’s instructions. RNA quality and quantity were determined in a bioanalyzer (Agilent Technologies). The expression of 799 human miRNAs was assayed using the NanoString nCounter miRNA microarray platform (NanoString Technologies) according to manufacturer’s instructions at the Stanford University Functional Genomics Facility. The nCounter results were loaded into the nSolver Analysis Software v.4.0, normalized and analyzed according to the manufacturer’s instructions.
Mice.
All mice were housed in specific pathogen-free conditions at a barrier facility at the Lokey Stem Cell Research Building (SIM1), Stanford School of Medicine. All animal handling, surveillance and experimentation was performed in accordance with and approval from the Stanford University Administrative Panel on Laboratory Animal Care.
ATRT PDX models IC-pPDX-69 and IC-pPDX-159.
IC-pPDX-69 was derived from a 2-month-old female patient with spinal tumor and IC-pPDX-159 from a 1-year-old female patient with supratentorial ATRT. Both belong to the MYC subgroup. Diagnosis of the primary tumors was confirmed by the identification of a biallelic alteration of the SMARCB1 gene for both cases. PDX models were derived by interscapular subcutaneous implantation of fresh tumor chunks on NSG or Swiss Nude recipient mice and maintained by successive engraftment of tumor chunks on new recipient mice. For the CAR T cell treatment experiments, tumor chunks with a 2–3-mm diameter were implanted subcutaneously into the right flank of NSG mice. Tumor engraftment was then confirmed based on palpation and when tumors were measurable (smallest diameter > 3 mm). Mice were randomized and treated with 10 × 106 B7-H3 or CD19 control CAR T cells intravenously on day 8 or 9 after tumor implantation. Tumor growth was followed by tumor measurements twice a week.
Orthotopic xenograft model for brain tumors.
BT12-tdTomato-Luc or BT16-tdTomato-Luc cells were dissociated to single cells and orthotopically injected into 6–10-week-old NOD scid gamma mice. Briefly, mice were anesthetized with 3% isoflurane (Minrad International) in an induction chamber. Anesthesia on the stereotactic frame (David Kopf Instruments) was maintained at 2% isoflurane delivered through a nose adapter. A burr hole was placed 2 mm lateral and 2 mm posterior of bregma. A blunt-ended needle (75 N, 26s/2”/2, 5 μl; Hamilton Company) was lowered into the burr hole to a depth of 3.5 mm below the dura surface and retracted 0.5 mm to form a small reservoir. Using a microinjection pump (UMP-3; World Precision Instruments), 5 × 10⁵ BT12-tdTomato-Luc or BT16-tdTomato-Luc cells were injected in a volume of 4 μl at 30 nl s−1. After leaving the needle in place for 1 min, it was retracted at 3 mm min−1. Tumor growth was followed by BLI on an IVIS Spectrum In Vivo Imaging System (PerkinElmer) and quantified with the Live Image v.4.0 software (Living Image; PerkinElmer).
In vivo CAR T cell treatment.
After confirmation of tumor engraftment, mice were randomized into six treatment groups (B7-H3 or CD19 control CAR T cells, either IT, ICV or IV) based on flux values, before treatment. For systemic (IV) treatment, CAR T cells were administered into the tail vein of the mice at a volume of 200 μl. For IT or ICV treatment, CAR T cells were injected at a volume of 4 μl either in the same coordinates as the tumor injection (IT) or into the right lateral ventricle according to predefined coordinates (on the coronal suture, 2 mm right lateral to midline, 4 mm into the lateral ventricle) (ICV) using the same stereotactic apparatus and anesthesia as described earlier.
Tumor rechallenge.
Forty or 53 (orthotopic model) or 20 or 39 d (flank model) after one-time CAR T cell treatment, mice were rechallenged with BT16-tdTomato-Luc or BT16-tdTomato-Luc B7-H3 knockout cells. For the orthotopic rechallenge, cells were implanted as described earlier. For the flank rechallenge, 200,000 tumor cells were diluted in a total volume of 200 μl (50% Matrigel) and implanted into the flank of the mice. BLI was performed 1 day before and 6–7 d after rechallenge.
In vivo monitoring of CAR T cell trafficking.
We imaged NanoLuc activity of injected CAR T cells by injecting 5 μg (approximately equal to 0.25 mg kg−1) furimazine (approximately equal to 40× dilution of Nano-Glo substrate) in 100 μl of sterile PBS intraperitoneally; we imaged mice on an IVIS Spectrum within 7 min of injection.
Serum collection for cytokine analysis.
Blood was sampled by puncture of the retrobulbar sinus from the medial canthus of the eye using clean 75-μl EDTA-coated capillary tubes. The blood samples were centrifuged at 5,000g for 5 min in a microcentrifuge (Thermo Fisher Scientific) followed by pipetting of the serum into cryovials, which were then stored at −80 °C until analysis.
CSF collection for cytokine analysis.
CSF was collected using a method described previously49. Briefly, mice were anesthetized using a ketamine (100 mg kg−1)/xylazine (10 mg kg−1) mixture and placed on the stereotactic instrument so that the body made a 135-degree angle with the fixed head. A sagittal incision of the skin was made inferior to the occiput. Under a dissection microscope, the subcutaneous tissue and neck muscles through the midline were separated using blunt forceps. A microretractor was used to hold the muscles apart. The dura was then penetrated with a 5-cm-long glass capillary with a tapered tip. The average volume of CSF obtained was approximately 15 μl. All samples were stored in polypropylene tubes at −80 °C until analysis.
Measurement of cytokines from serum and CSF.
This assay was performed at the Human Immune Monitoring Center of Stanford University. Human 62-plex kits were purchased from eBioscience/Affymetrix and used according to the manufacturer’s recommendations with modifications as described. Briefly, beads were added to a 96-well plate and washed in a BioTek ELx405 Select Deep Well Washer. Samples were added to the plate containing the mixed antibody-linked beads and incubated at room temperature for 1 h followed by overnight incubation at 4 °C with shaking. The cold and room temperature incubation steps were performed on an orbital shaker at 500–600 r.p.m. After overnight incubation, plates were washed in a BioTek ELx405 Select Deep Well Washer; then, biotinylated detection antibody was added for 75 min at room temperature with shaking. The plate was washed as described earlier and streptavidin-PE was added. After incubation for 30 min at room temperature, washing was performed as described earlier and reading buffer was added to the wells. Each sample was measured in duplicate. Plates were read using a Luminex FLEXMAP 3D instrument with a lower bound of 50 beads per sample per cytokine. Custom assay control beads by Radix Biosolutions were added to all wells. The dilution factor was accounted for. For each cytokine, z-scores of cytokine levels measured as mean fluorescence intensities were calculated. Heatmaps were generated using the ggplot2 v3.2.1 function in R. For better visualization, z-scores were limited to a range of <2 and >−2.
Statistical analysis.
Data analysis and visualization was performed using Prism 7.0 (GraphPad Software). Graphs represent either group mean values ± s.e.m./s.d. (as indicated in the figure legends) or individual values. P values were calculated with log-rank statistics for survival analyses, then repeated-measures analysis of variance (ANOVA) for tumor growth curves. A Mann–Whitney U-test was used to compare IT versus ICV, IT versus IV and ICV versus IV treatment. A one-way ANOVA was used for the in vitro cytokine data (comparing cytokine production by B7-H3 CAR T cells IT, ICV and IV and CD19 T cells IT, ICV, and IV). An unpaired t-test was used to compare B7-H3 versus CD19 CAR T cells and a Pearson correlation was used to determine to which degree a relationship was linear. P < 0.05 was considered statistically significant. P values are denoted with asterisks: P > 0.05, NS; *P < 0.05; **P < 0.01; ***P < 0.001; and ****P < 0.0001.
Reporting Summary.
Further information on research design is available in the Nature Research Reporting Summary linked to this article.
Data availability
All unprocessed western blot images and statistics are supplied as Source Data. All source data for Figs. 1–4 and Extended Data Figs. 1–8 are supplied in the Supplementary Dataset.
Extended Data
Extended Data Fig. 1 |. Regulation of B7-H3 expression in ATRT and during normal brain development.
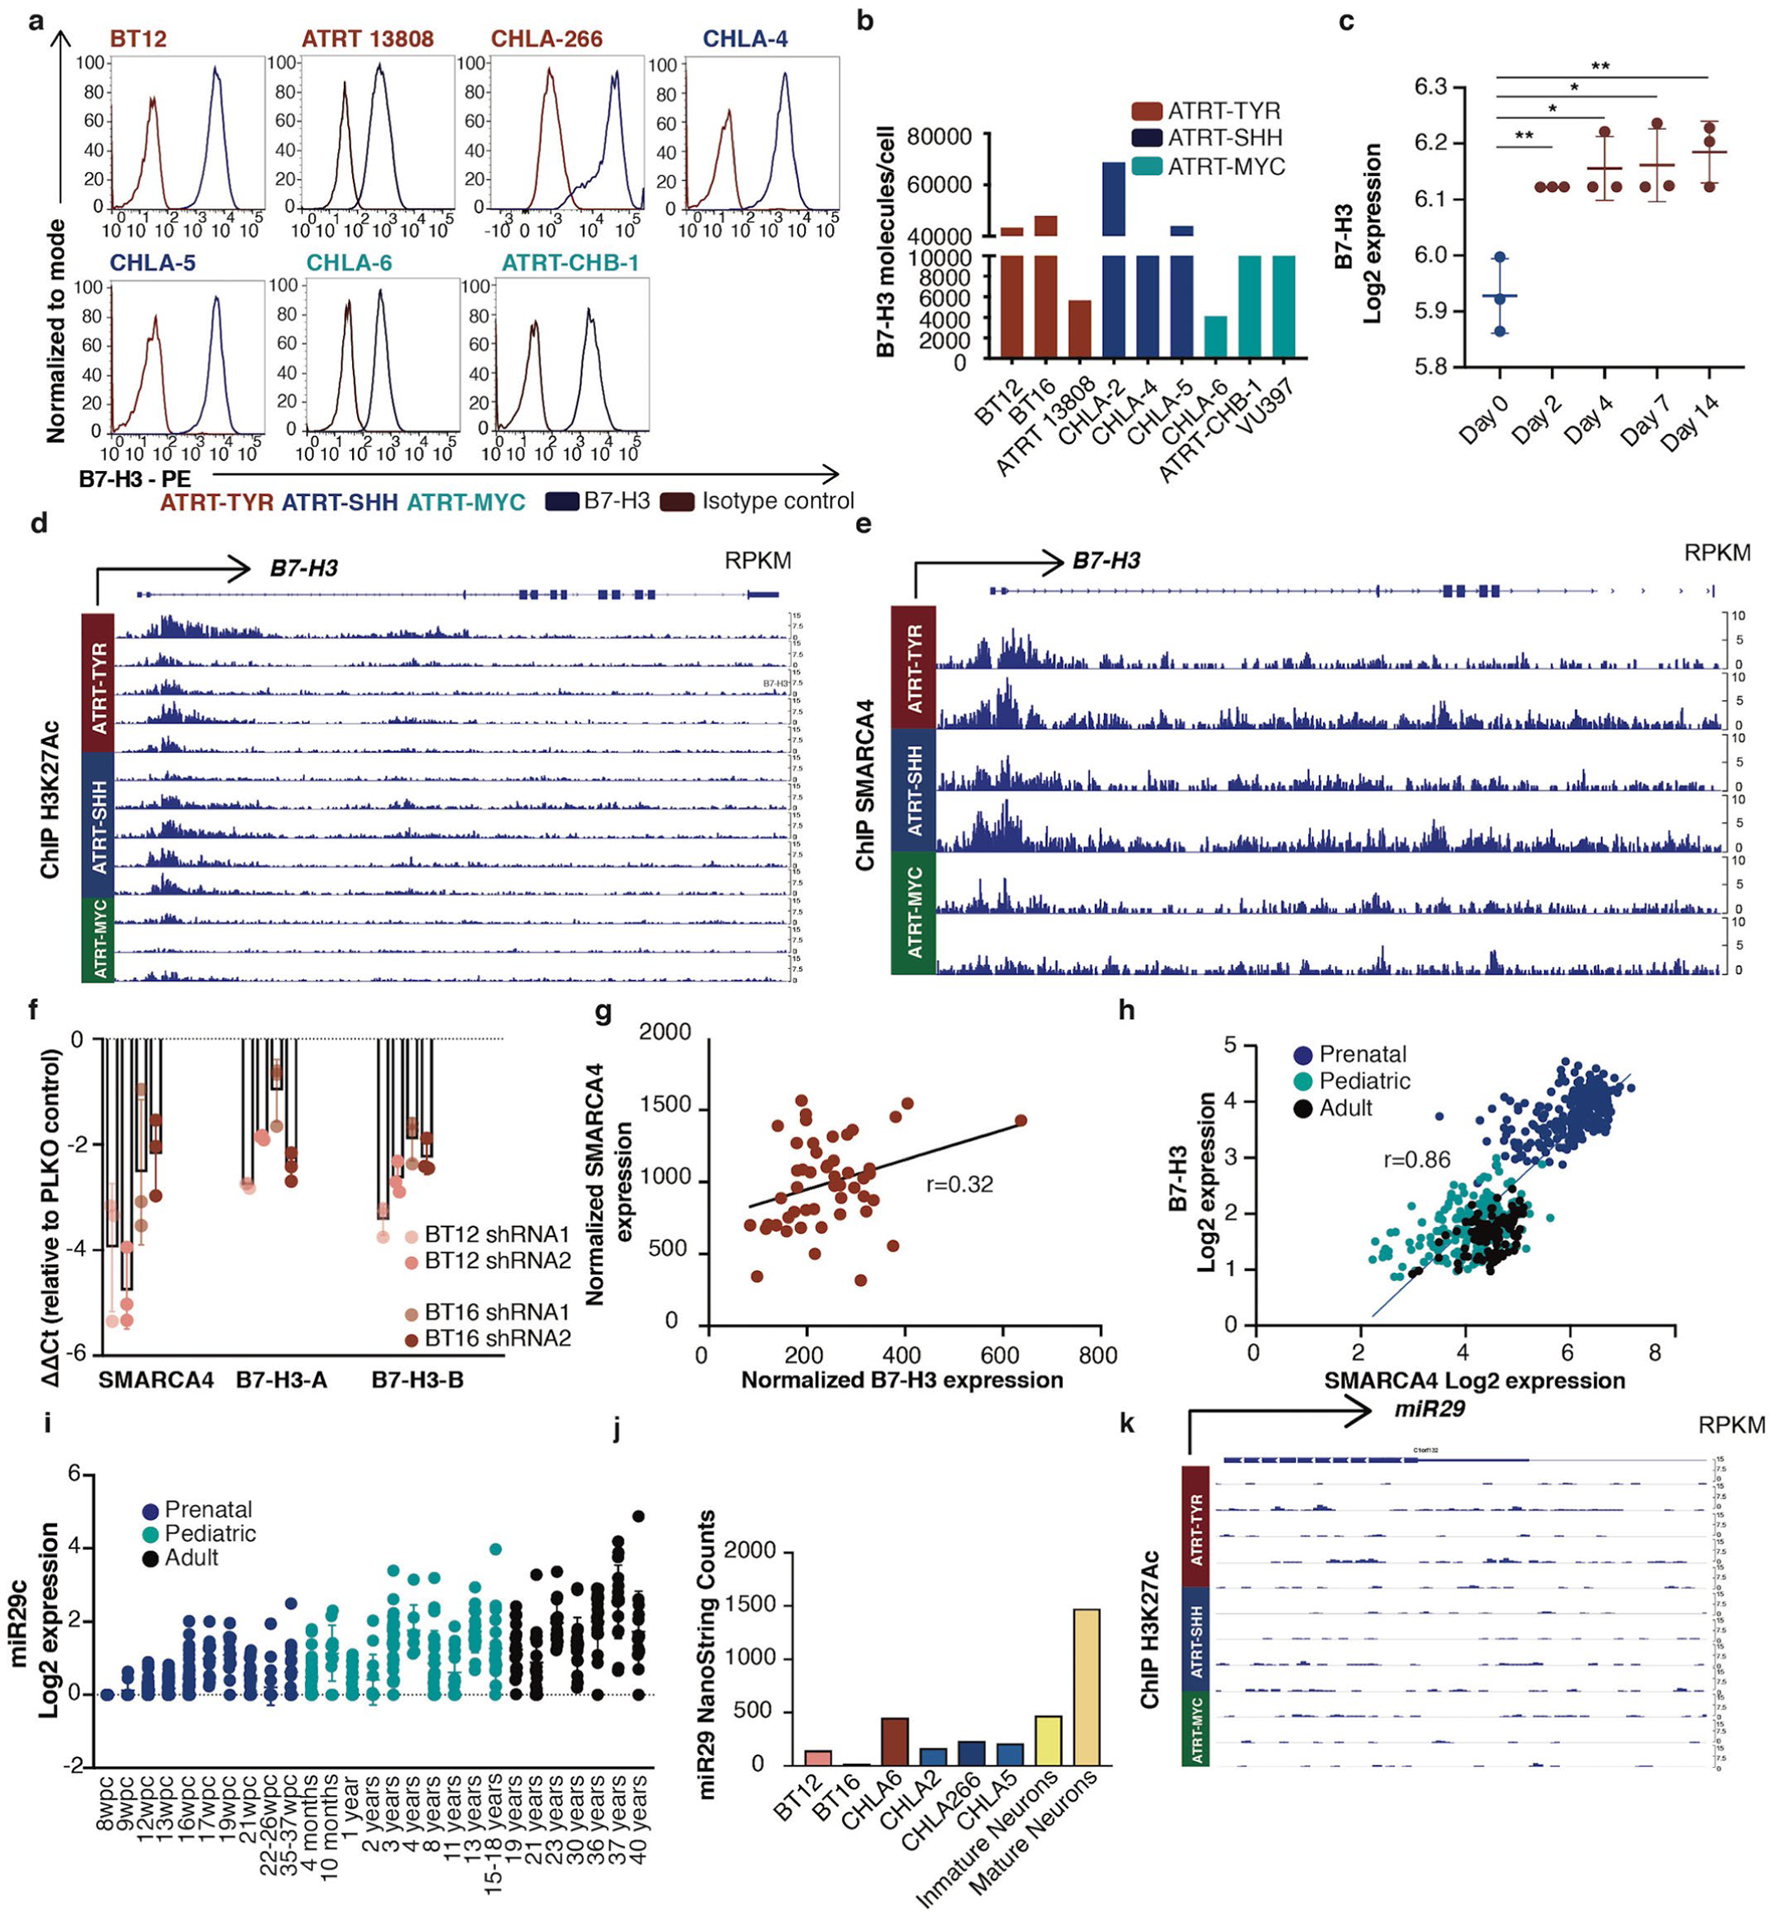
a, Flow cytometric analysis of B7-H3 expression on ATRT cell lines. Representative of two independent experiments is shown b, Quantification of B7-H3 molecules per cell on ATRT cell lines using flow cytometry (TYR n = 3, SHH n = 3, MYC n = 3; TYR vs. SHH p = 0.700; TYR vs. MYC p = 0.400; SHH vs MYC p = 0.200) (Mann-Whitney test, two-tailed). c, B7-H3 mRNA upon SMARCB1 re-expression from datamining of Chauvin et al (GSE98277 Cell Rep1017) published inducible SMARCB1 system in a SMARCB1-deficient rhabdoid cell line (n = 3 for all time points) 0 days vs. 2 days **p = 0.007; 0 days vs. 4 days *p = 0.011; 0 days vs. 7 days *p = 0.012; 0 days vs. 14 days **p = 0.007) (unpaired t-test, two-tailed). d, ChipSeq H3K27Ac data of the promoter region of B7-H3 in primary ATRT tumors. e, ChipSeq SMARCA4 data at the promoter region of B7-H3 in primary ATRT tumors f, RT-qPCR analysis of B7-H3 and SMARCA4 mRNA expression levels in SMARCB1-deficient ATRT cell lines (BT12 and BT16) five days after shRNA SMARCA4 knock down (k.d.) with two different short hairpins. Graph represents ΔΔCt relative to cells transduced with empty vector. Triplicates were run in each experiment. Representative results of two independent experiments is shown g, Correlation of normalized SMARCA4 and normalized B7-H3 expression from primary ATRT tumors (GSE70678) (n = 49) (r = 0.32, p = 0.026) (Pearson correlation, two-sided) h, Correlation of mRNA expression of SMARCA4 and B7-H3 during normal brain development (prenatal n = 237; pediatric n = 178; adult n = 109) (r = 0.86; p = <1×10⁻¹⁵) (Pearson correlation, two-sided). (i) mRNA expression levels of miR29c during and after normal brain development (prenatal n = 237; pediatric n = 178; adult n = 109). j, miR29 nanostring counts in ATRT cells lines and mature and immature neurons. k, ChipSeq H3K27Ac data around miR29 locus in primary ATRT tumors. All data are means ± s.d.
Extended Data Fig. 2 |. B7-H3 CAR T cells are highly potent against ATRT cell lines in vitro.
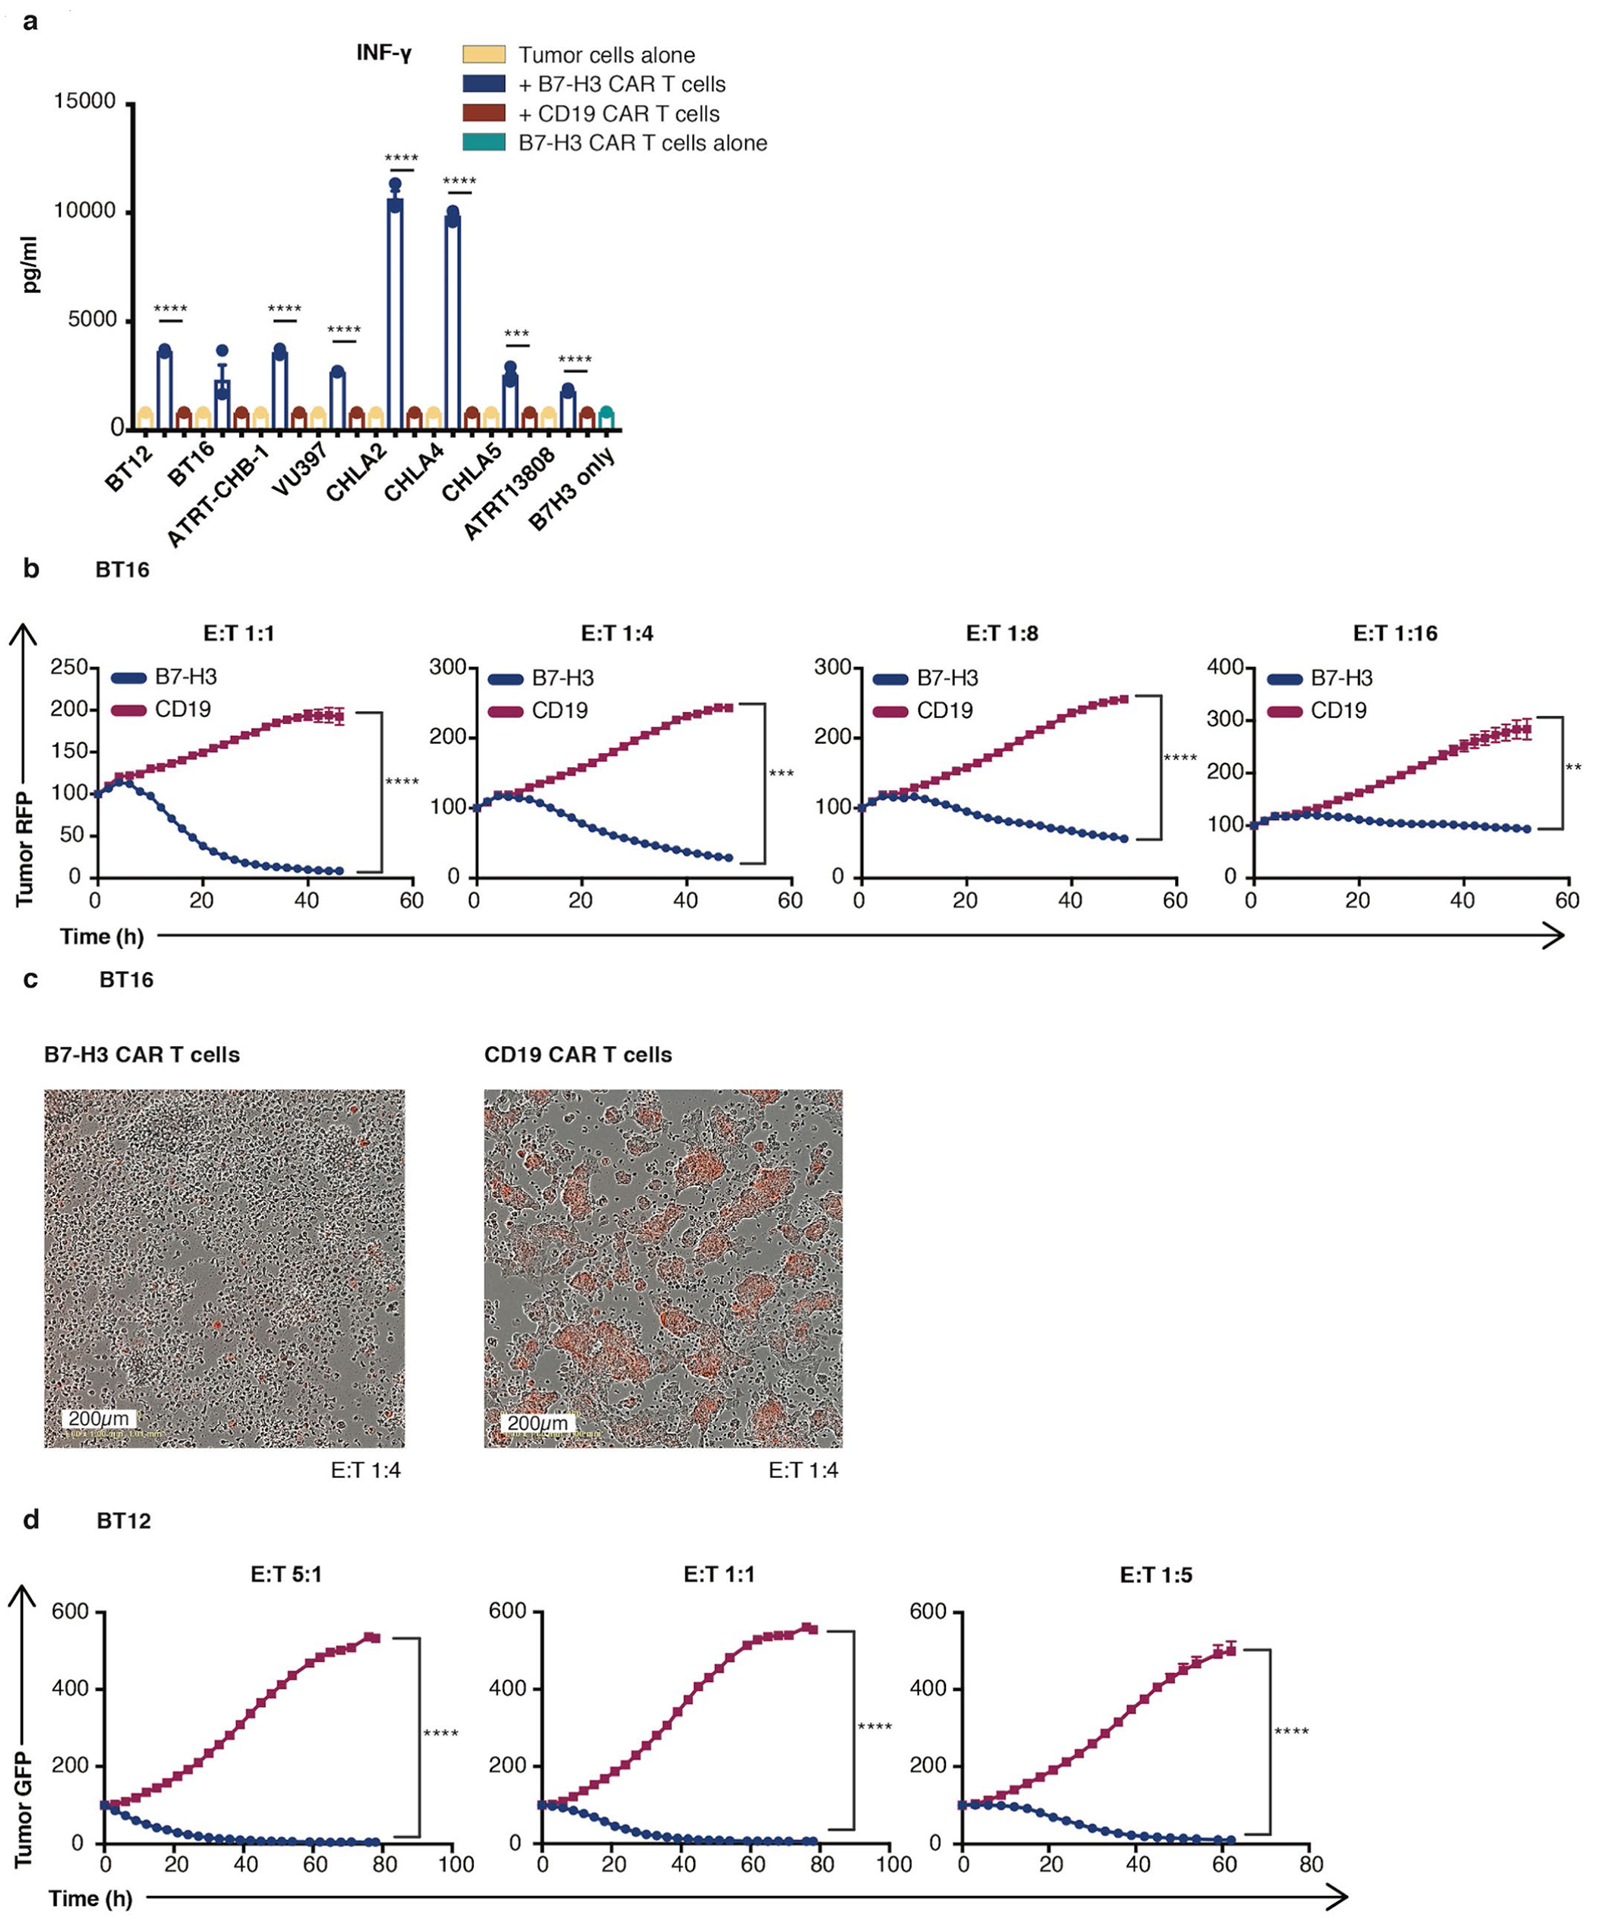
a, Cytometric Bead Array of interferon γ release 24 hours after co-culture of B7-H3 CAR T cells or CD19 CAR T cells (control) with ATRT tumor cells (B7-H3 CAR T cells vs. CD19 CAR T cells: BT12 ****p = 5×10⁻⁷; BT16 p = 0.086; ATRT-CHB-1 ****p = 5×10⁻⁶; VU397 ****p = 5×10⁻⁸; CHLA-2 ****p = 9×10⁻⁶; CHLA-4 ****p = 5×10⁻⁷; CHLA-5 ***p = 9×10⁻⁴; ATRT13808 ****p = 7×10⁻⁵) (unpaired t-test, two-tailed). b, Killing assay of BT16 ATRT tumor cells when co-cultured with B7-H3 CAR T cells or CD19 CAR T cells (control) at different E:T ratios (B7-H3 CAR T cells vs. CD19 CAR T cells: 1:1 ****p = 5×10⁻⁵; 1:4 ***p = 3×10⁻⁴; 1:8 ****p = 2×10⁻⁶; 1:16: **p = 0.003) (Two-Way Anova). c, Representative images obtained 72 hours after co-culture of BT16 ATRT tumor cells (red) with B7-H3 or CD19 CAR T cells in a 1:4 ratio. d, Killing assay of BT12 ATRT tumor cells when co-cultured with B7-H3 CAR T cells or CD19 CAR T cells (control) at different E:T ratios (B7-H3 CAR T cells vs. CD19 CAR T cells: 5:1 ****p = 3×10⁻⁶; 1:1 ****p = 8×10⁻⁵; 1:5 ****p = 5×10⁻⁶) (Two-Way Anova). All data are means ± s.e.m. (a-d) n = 3 independent samples, experiments have been conducted three times.
Extended Data Fig. 3 |. B7-H3 CAR T cells are highly potent against ATRT PDXs in vivo.
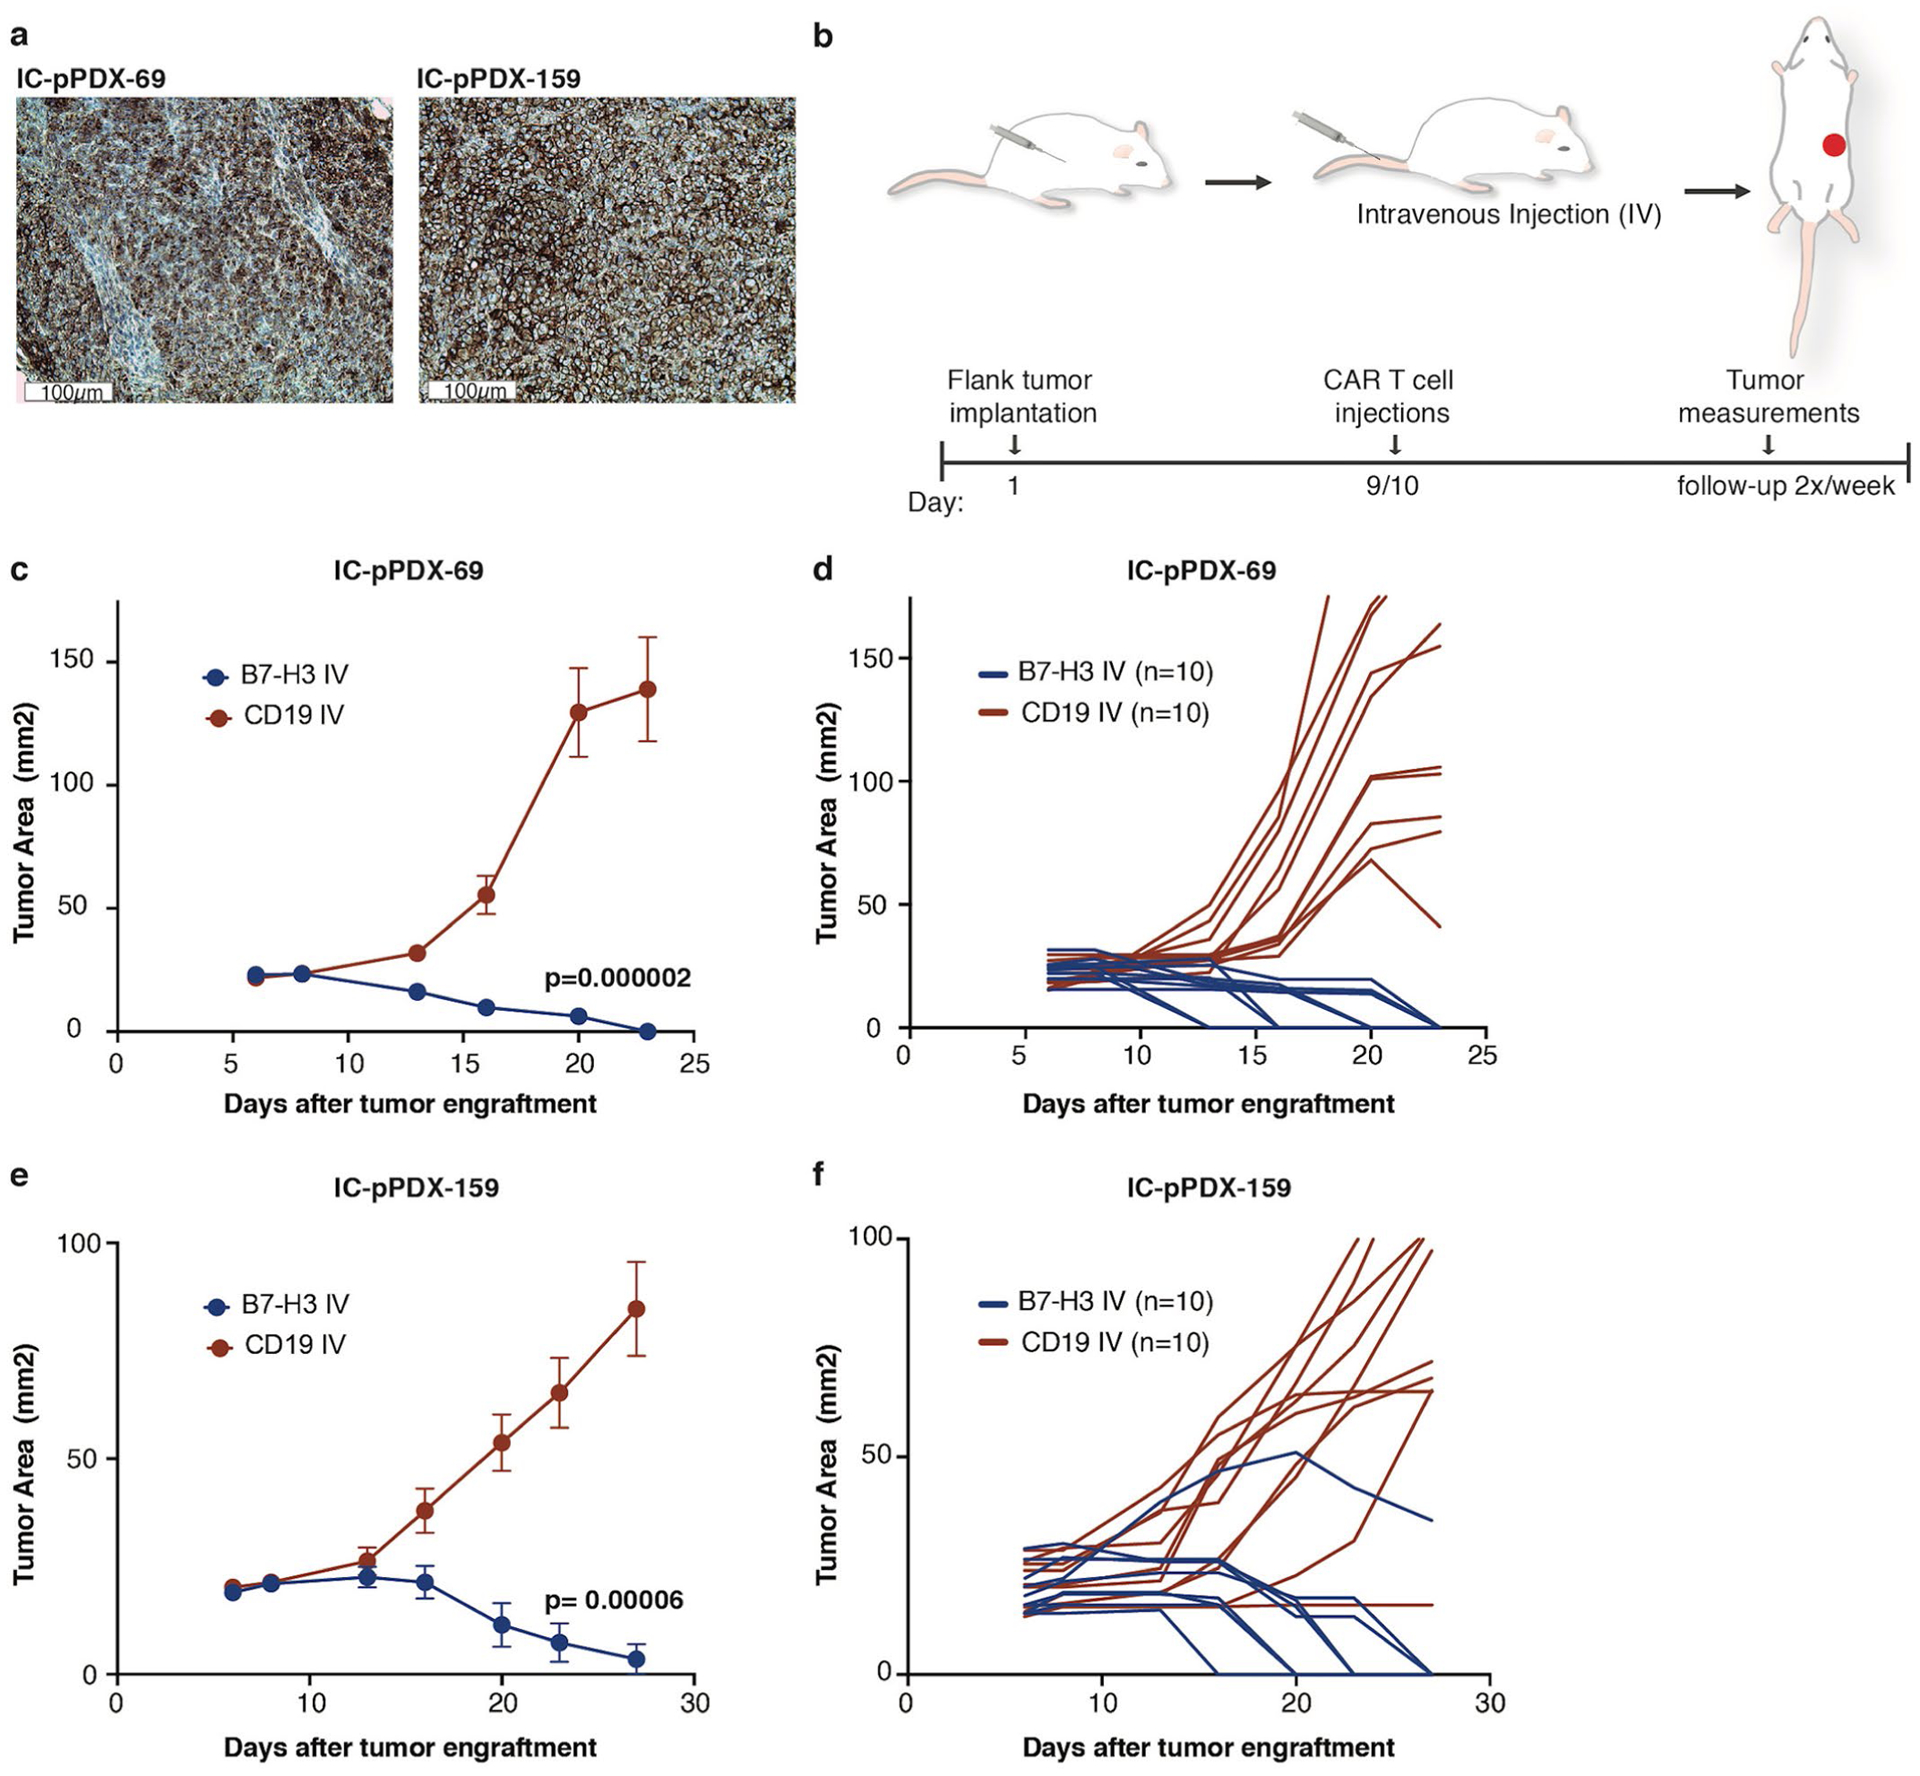
a, Representative IHC image of B7-H3 staining of IC-pPDX-69 and IC-pPDX-159 ATRT PDX after engraftment (IC-pPDX-69: H Score 210 and IC-pPDX-159: H score 210). Staining was performed one time. b, Experimental overview for the evaluation of in vivo efficacy of B7-H3 CAR T cells against IC-pPDX-69 c,d, and IC-pPDX-159 e,f, Summary (c,e) and individual (d,f) tumor measurements after 10×106 B7-H3 CAR T cells or CD19 CAR T cells (control) (c) p = 2×10⁻⁶; (e) p = 6×10⁻⁵ (Two-way Anova). All data are means ± s.e.m. Experiment has been performed one time (n = 10 mice per group).
Extended Data Fig. 4 |. Locoregionally administered B7-H3 CAR T cells are highly potent against orthotopic ATRT xenografts in vivo.
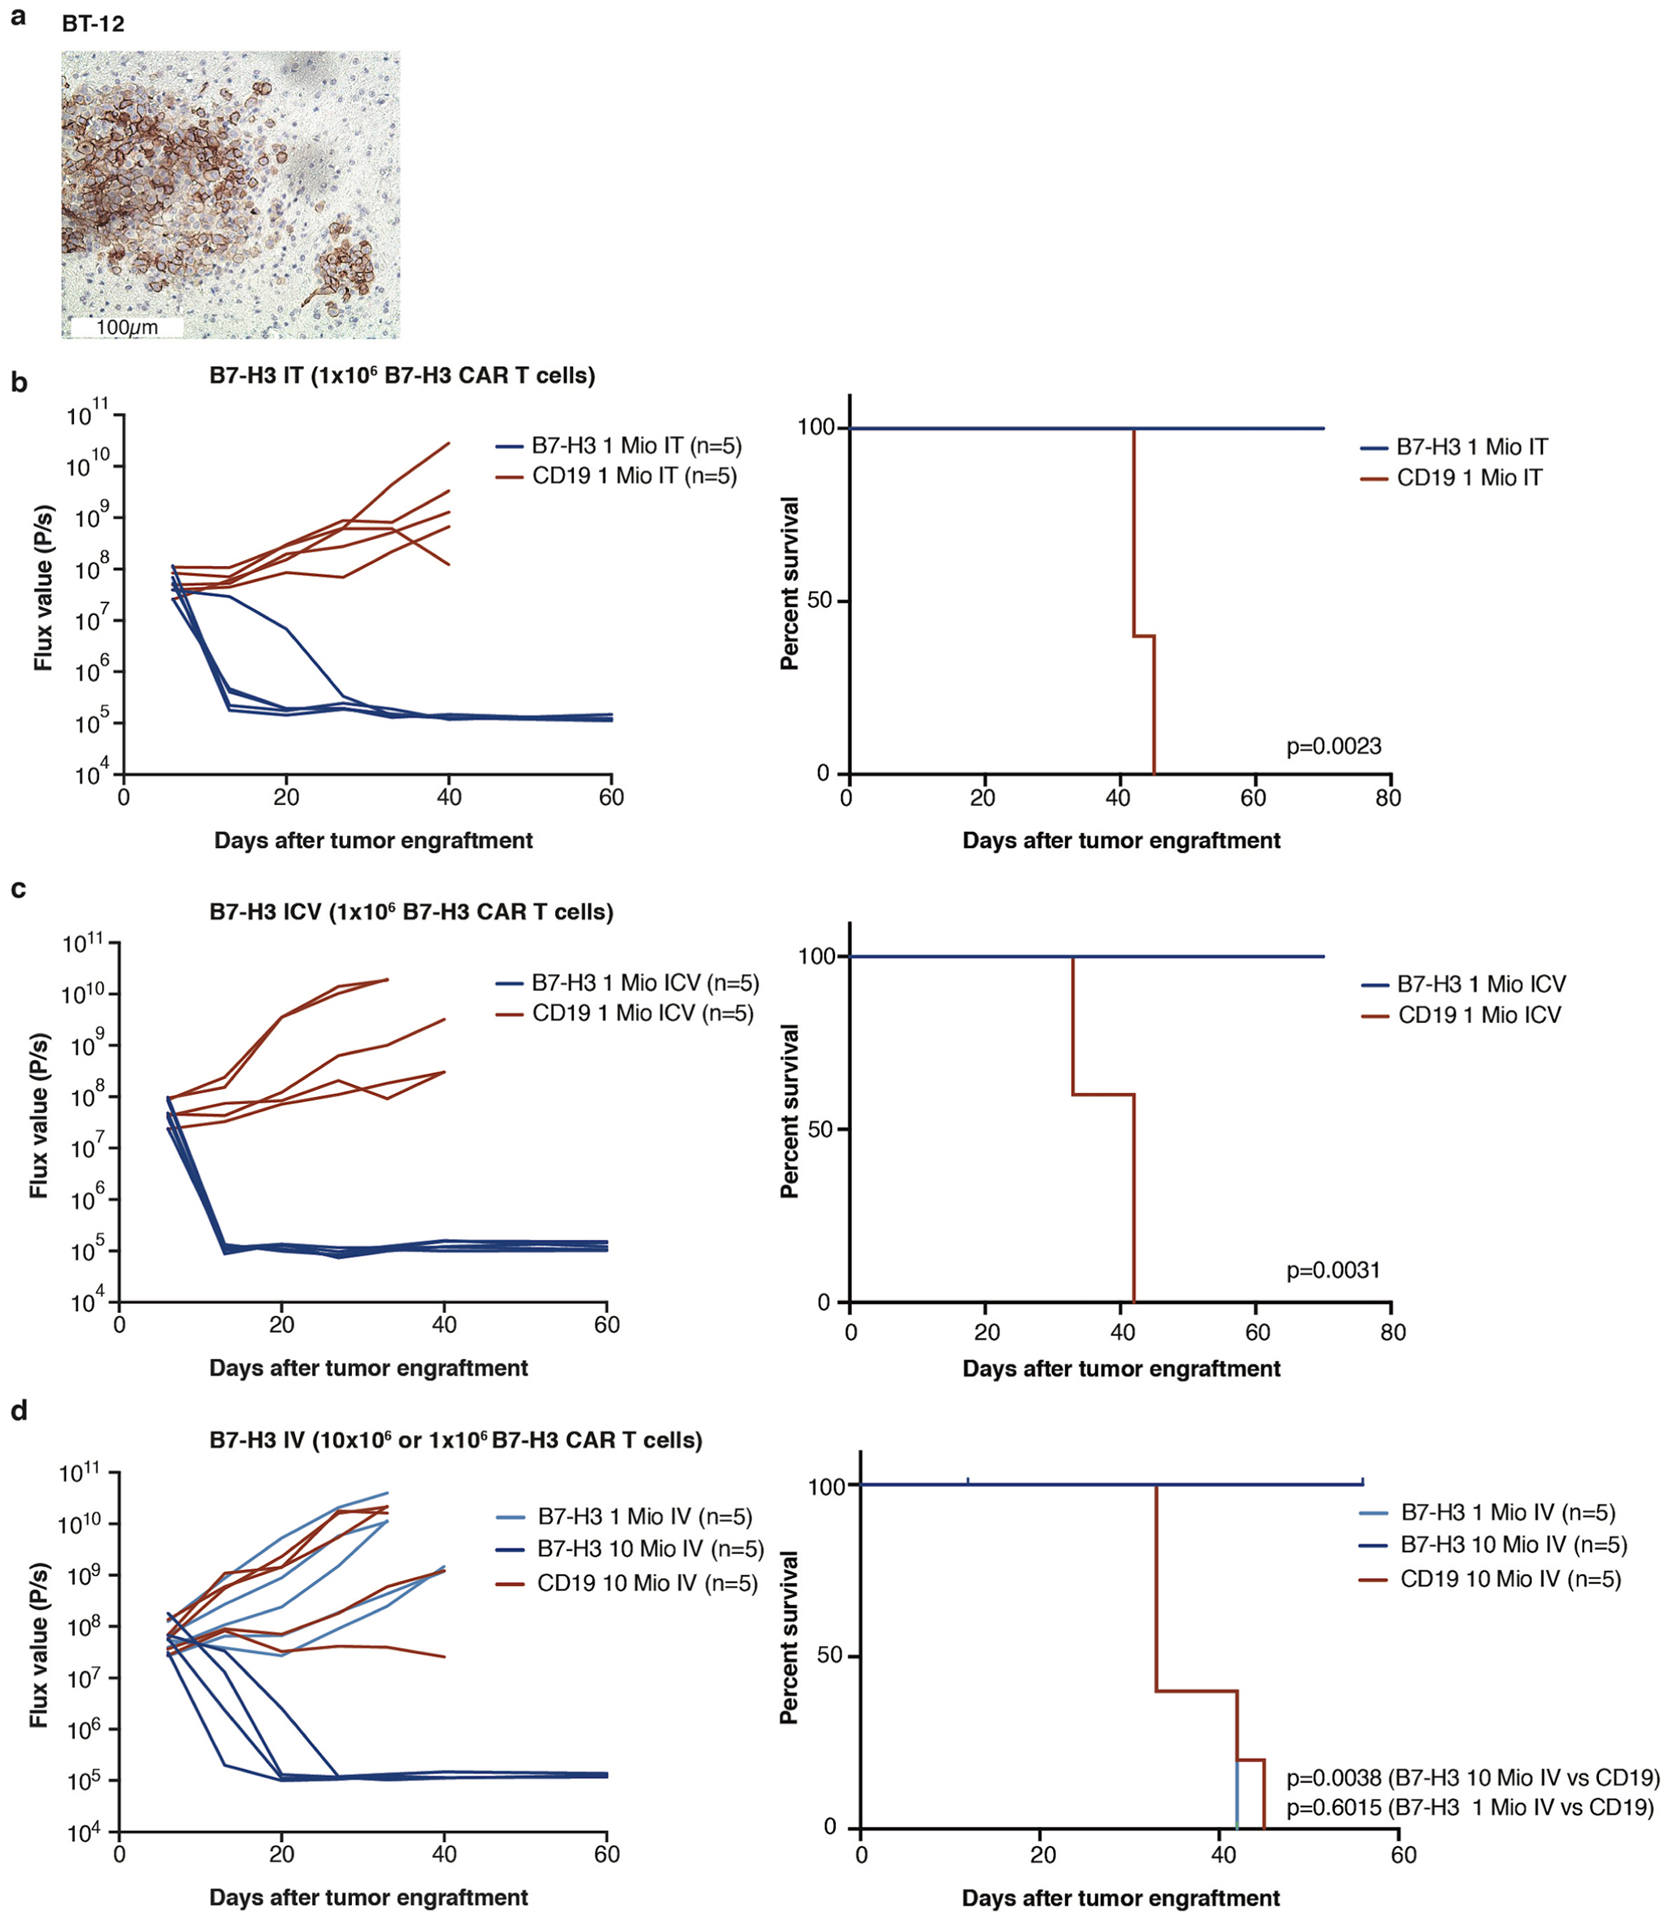
a, Representative IHC image of B7-H3 staining of BT12 ATRT xenograft (H Score: 270). Staining was performed one time. b, IT Group (B7-H3 (1×10⁶) and CD19 (1×10⁶) CAR T cells), c, ICV Group (B7-H3 (1×10⁶) and CD19 (1×10⁶) CAR T cells), d, IV Group (1×10⁶ or 10×106) B7-H3 and CD19 (10×106) CAR T cells). (c-e) Bioluminescence (BLI) was obtained serially and flux curve for individual mice are shown. Kaplan-Meier analysis (n = 1) of B7-H3 or CD19 (control) CAR T cell treated mice (IT p = 0.0023; ICV p = 0.0031); IV (1×10⁶) p = 0.6015; IV (10×106) p = 0.0038). (Log-rank (Mantel-Cox) test, two-tailed). One mouse in the B7-H3 (10×106) IV group died while imaging and was censored from analysis. Mio=million.
Extended Data Fig. 5 |. In vivo dose response testing demonstrates that iCV administered B7-H3 CAR T cells require lower dose for cure than those delivered via iV.
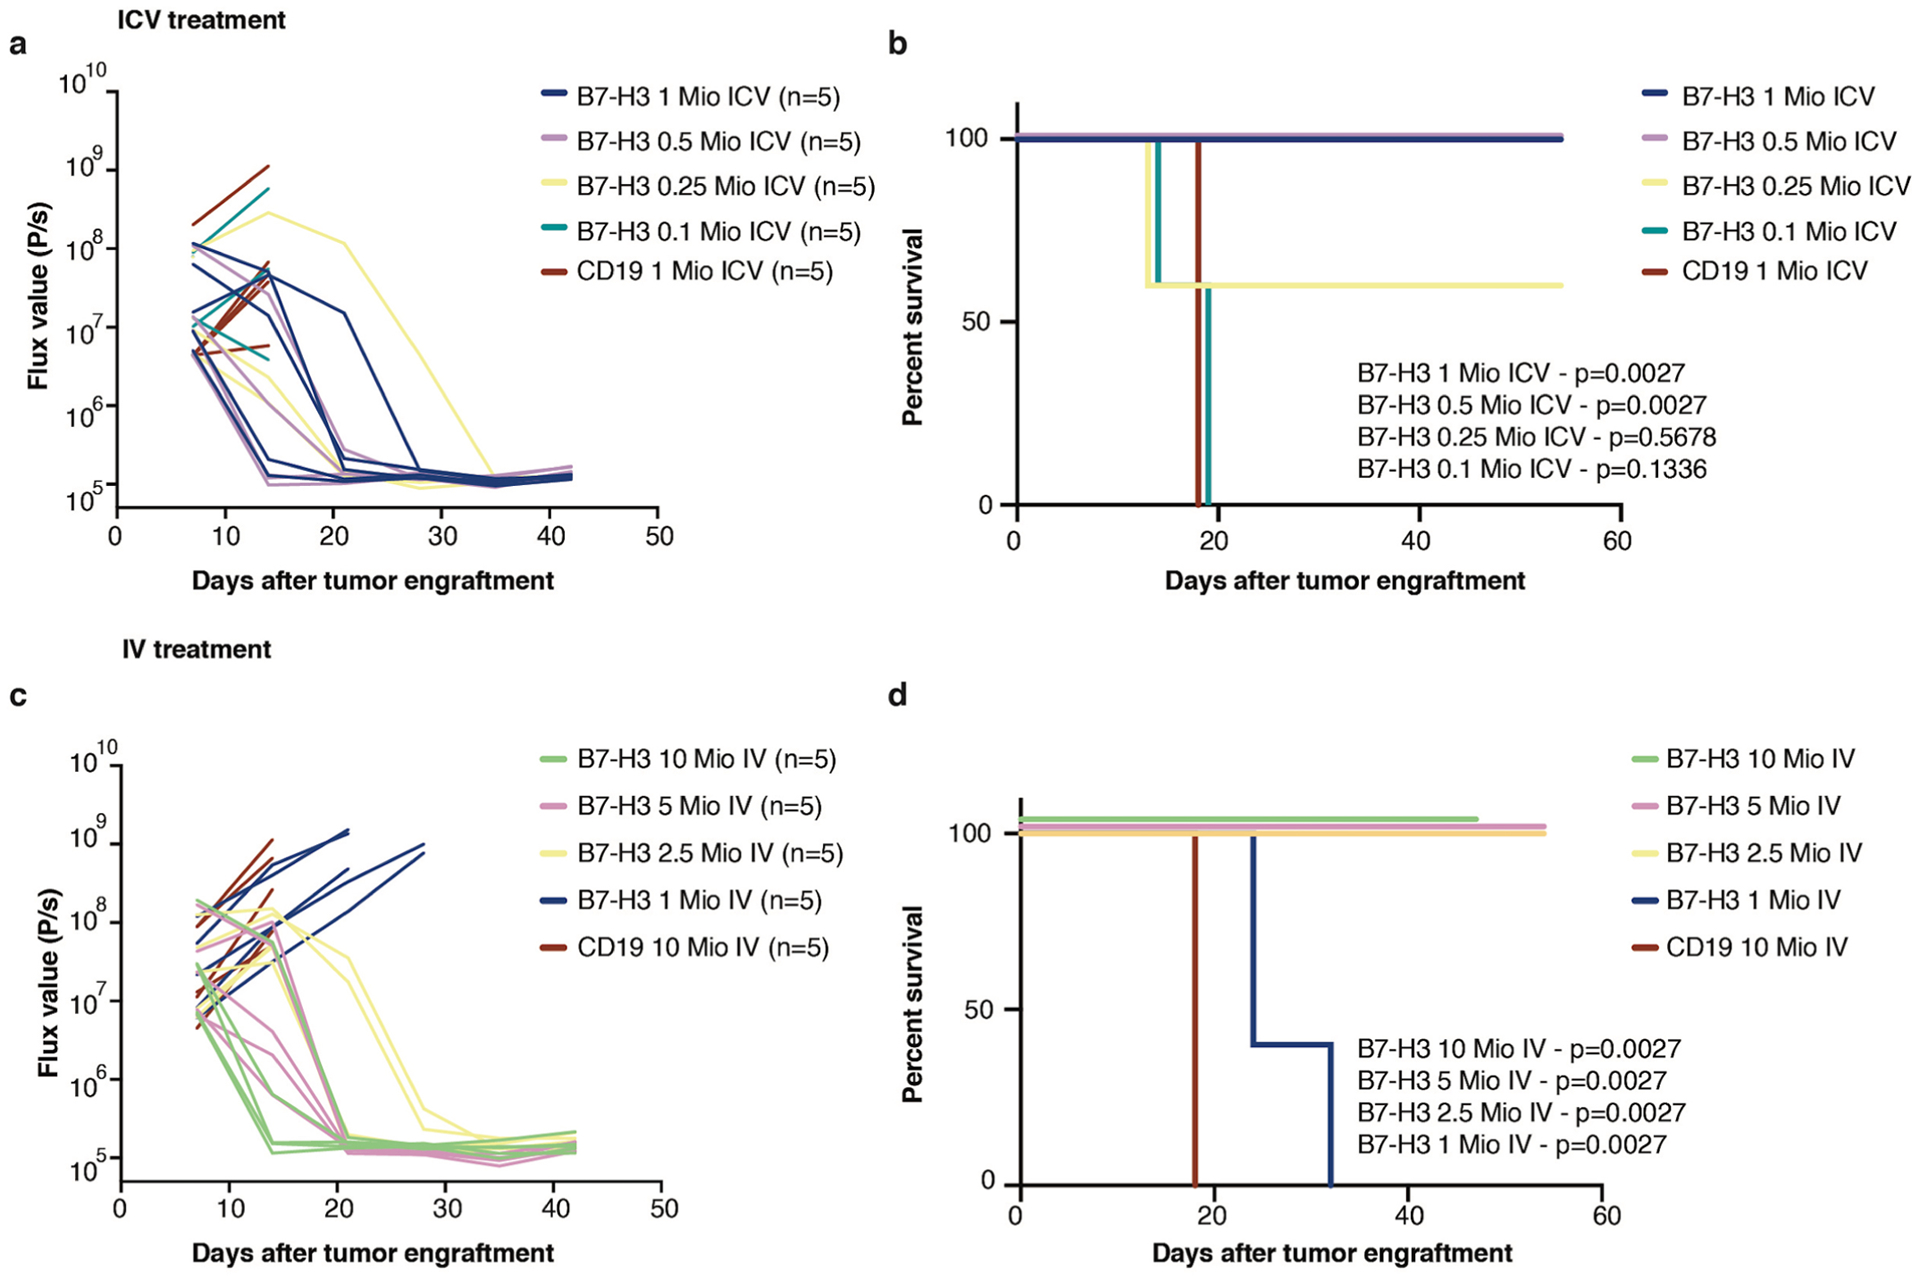
In vivo dose response testing of B7H3 CAR T cells administered ICV (a,b) or IV (c,d). Bioluminescence (BLI) was obtained serially and flux curve for individual mice are shown for ICV (a) or IV (c) treatment. Kaplan-Meier analysis of B7-H3 or CD19 (control) CAR T cell treated mice in ICV (b) or IV (d) treatment. Stated p values are compared to CD19 control. (Log-rank (Mantel-Cox) test, two-tailed) n = 5 biologically independent animals. Experiment has been performed one time. Mio=million.
Extended Data Fig. 6 |. IV Administration of B7-H3 CAR T cells results in higher systemic inflammatory cytokines than iCV or iT administration.
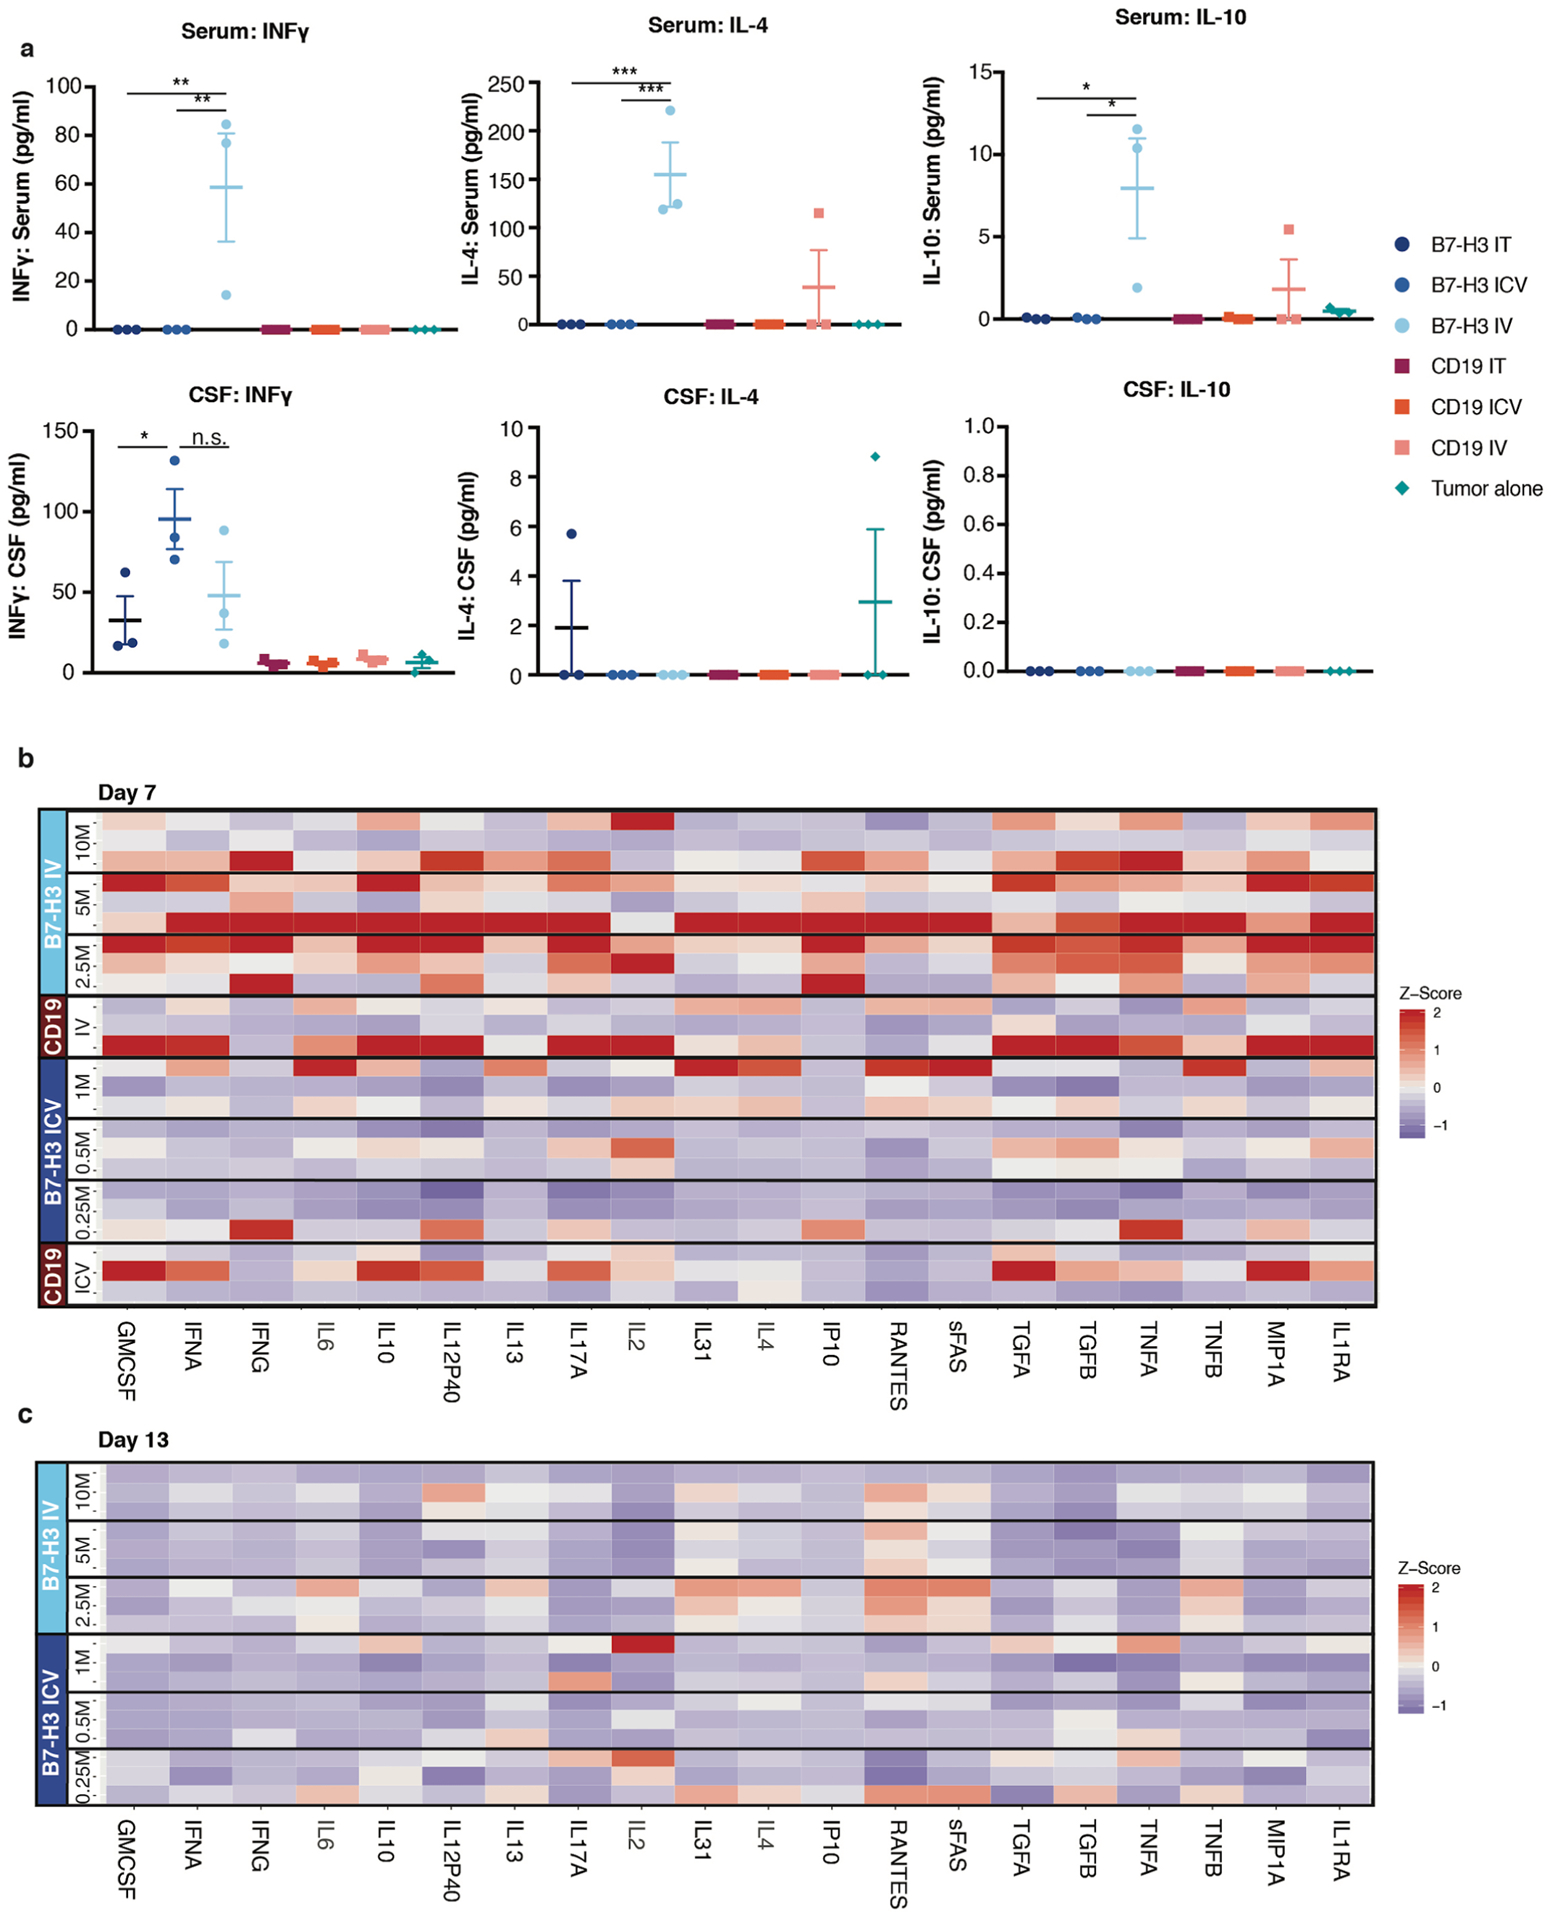
a, INFγ, IL-4, IL-10 levels in serum and CSF from mice 7 days after CAR T cell treatment (For IT and ICV: 1×10⁶ CAR T cells, IV: 10×106 CAR T cells). Significantly higher INFγ, IL-4 and IL-10 concentrations in the serum of the B7-H3 IV group compared to all other groups (Serum INFγ: B7-H3 IV vs. IT **p = 0.0033; B7-H3 IV vs. ICV **p = 0.0033; Serum IL-4: B7-H3 IV vs. IT ***p = 0.0008; B7-H3 IV vs. ICV ***p = 0.0008; Serum IL-10: B7-H3 IV vs. IT *p = 0.01; B7-H3 IV vs. ICV *p = 0.01). No significant differences in the CSF between B7-H3 CAR IV and locoregional treated mice (IT, ICV). (Ordinary one-way Anova). All data are means ± s.e.m. 3 mice per group. Serum from mice 7 days b, and 13 days c, after CAR T cell treatment (at indicated dose levels and CD19 IV 10×106 and ICV 1×10⁶ CAR T cells) demonstrates significantly higher inflammatory cytokines on day7 after CAR T cell administration in B7-H3 IV group compared to B7H3 ICV. Strong reduction of cytokine levels on day 13 after CAR T cell administration. Z score values were calculated for each cytokine across the timepoints day 7 and day 13/all samples; for better visualization purposes z score was limited to 2 SD; 3 mice per group. Statistics were calculated using box plots. (Overall cytokine secretion in serum: Day7: Least curative CAR T cell dose: B7-H3 2.5×10⁶ IV vs B7-H3 0.5 ×10⁶ ICV p = 3×10⁻¹³; B7-H3 2.5×10⁶ IV vs B7-H3 0.25 ×10⁶ ICV p = 2×10⁻¹³; Day 7 vs. Day13: B7-H3 2.5 ×10⁶ p = 3×10⁻¹¹; B7-H3 0.5 ×10⁶ ICV p = 0.9921, B7-H3 0.25 ×10⁶ ICV p = 0.9957) (Mann-Whitney Test, two-tailed).
Extended Data Fig. 7 |. B7-H3 CARs demonstrate antigen-dependent proliferation and trafficking outside the CNS.
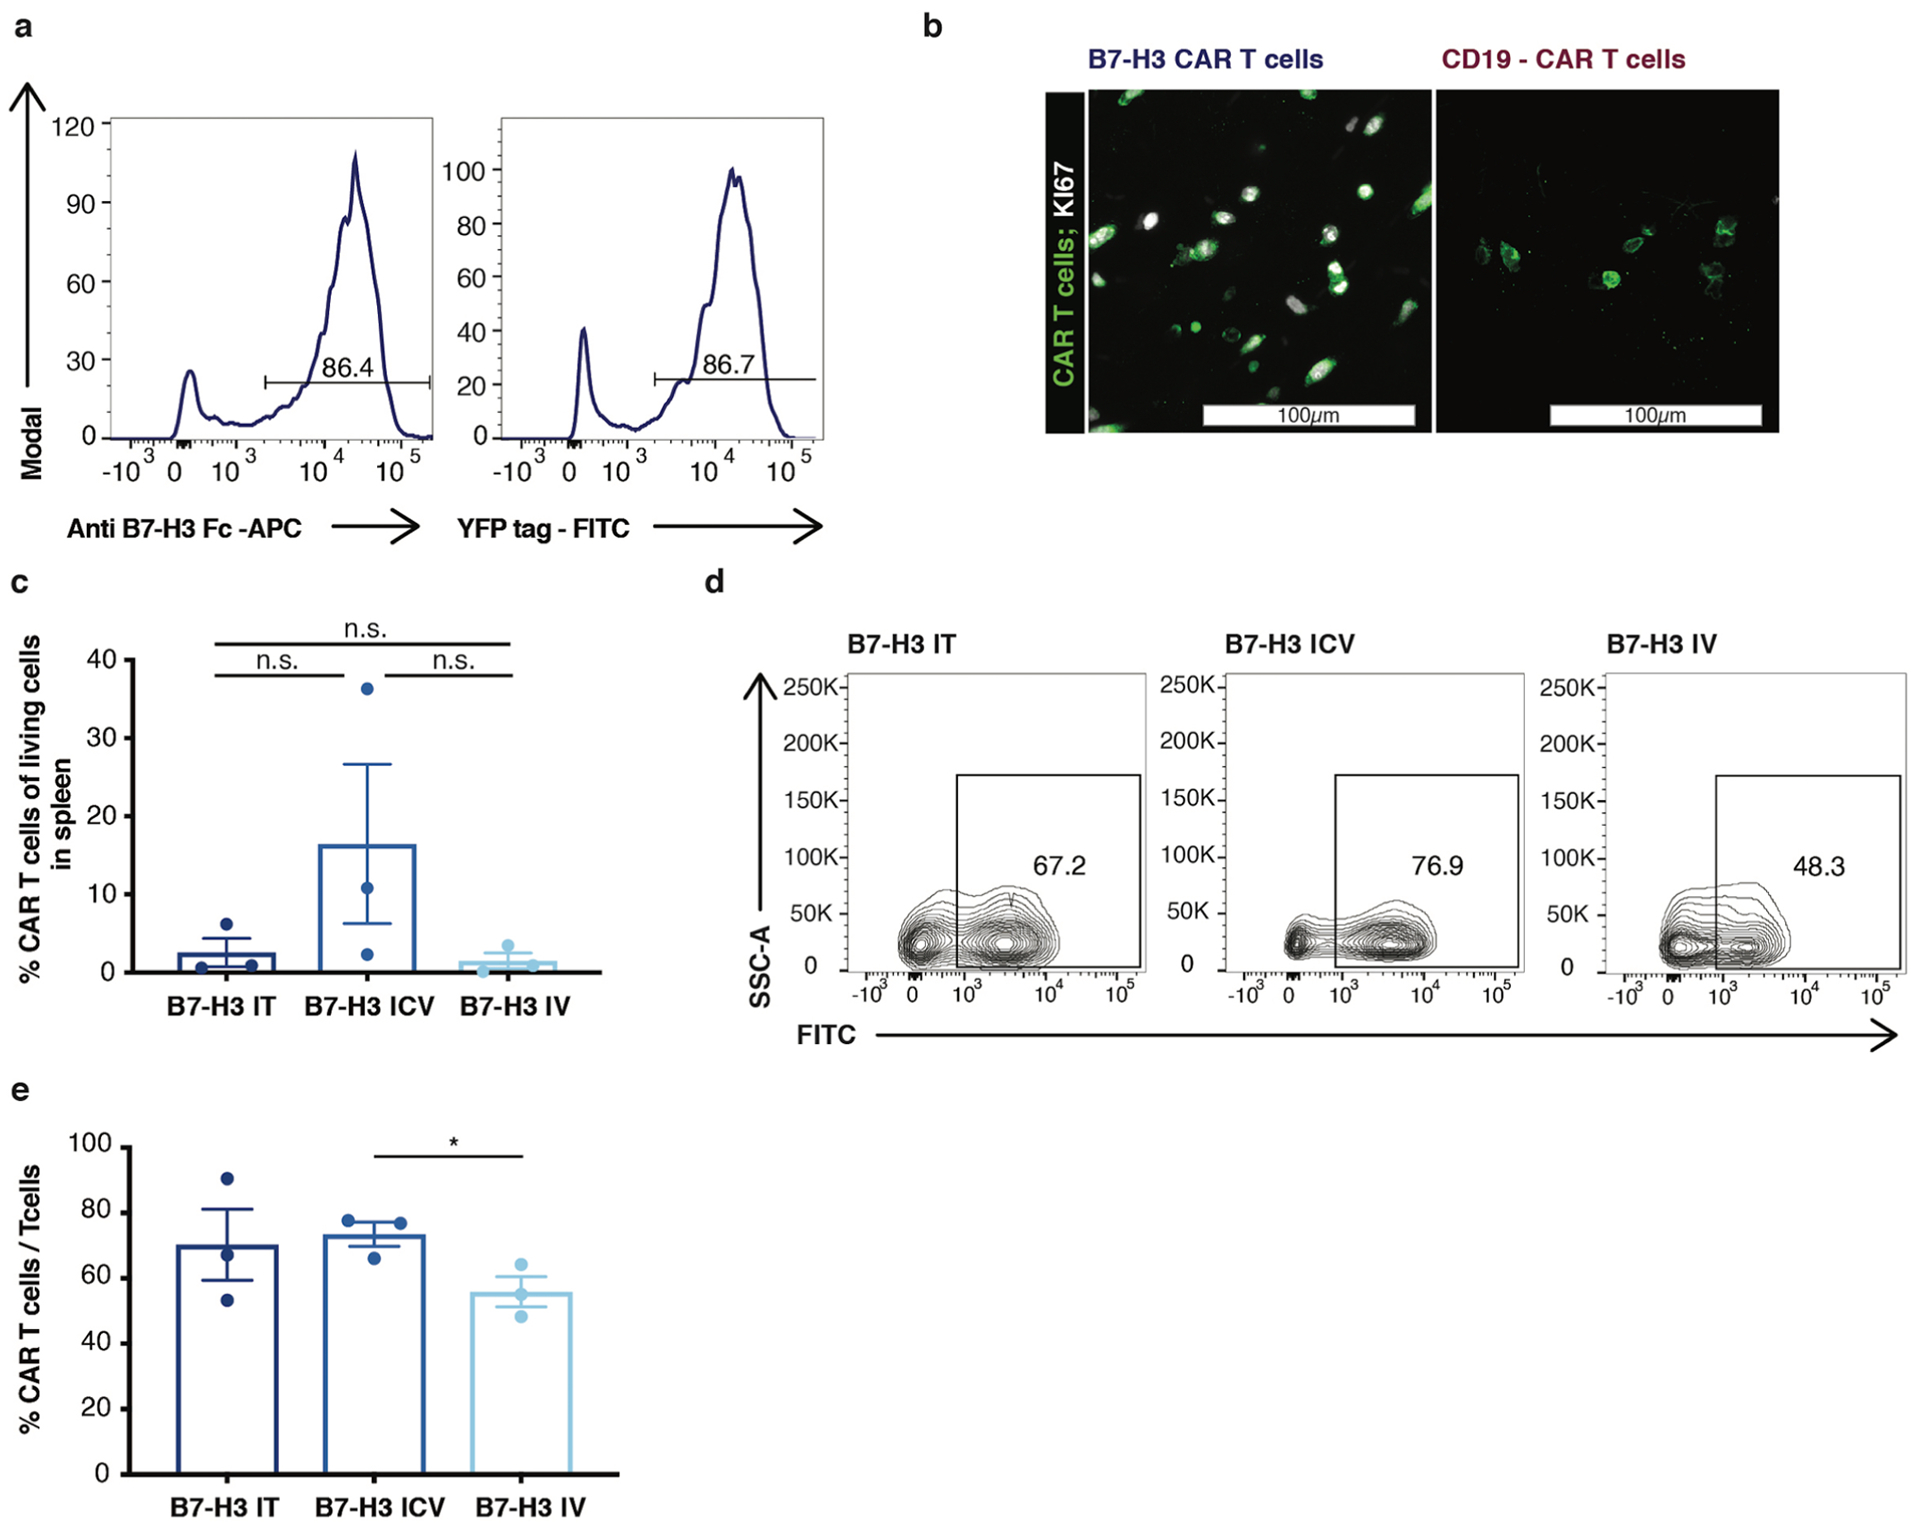
a, Flow cytometry demonstrating that fluorescent protein fused to CAR construct correlated with CAR surface expression. Experiment was performed two times. b, Representative immunofluorescence confocal microscopy of Ki67 staining of B7-H3 or CD19 CAR T cells in the brain. B7-H3 CAR T cells are positive for Ki 67, CD19 CAR T cells are negative. Scanning of 1:12 series from 3 independent mice/group. c, Quantification (n = 3 per group) and d, representative flow cytometry histogram of CAR T cells detected in single cell suspensions from mouse spleens 47 days after one time treatment (IT vs. ICV p = 0.200, IT vs. IV p = 0.800, ICV vs. IV p = 0.200) (Mann-Whitney test, two-tailed). e, Quantification of CAR T cell /T cell ratio in spleen after one time CAR T cell treatment (n = 3 per group) (ICV vs. IV *p = 0.041) (IT vs. IV p = 0.288) (unpaired t-test, two-tailed) All data are means ± s.e.m.
Extended Data Fig. 8 |. CRiSPR/Cas9 Knock out of B7-H3 slightly reduces the proliferation rate of ATRT cell lines in vitro and in vivo.
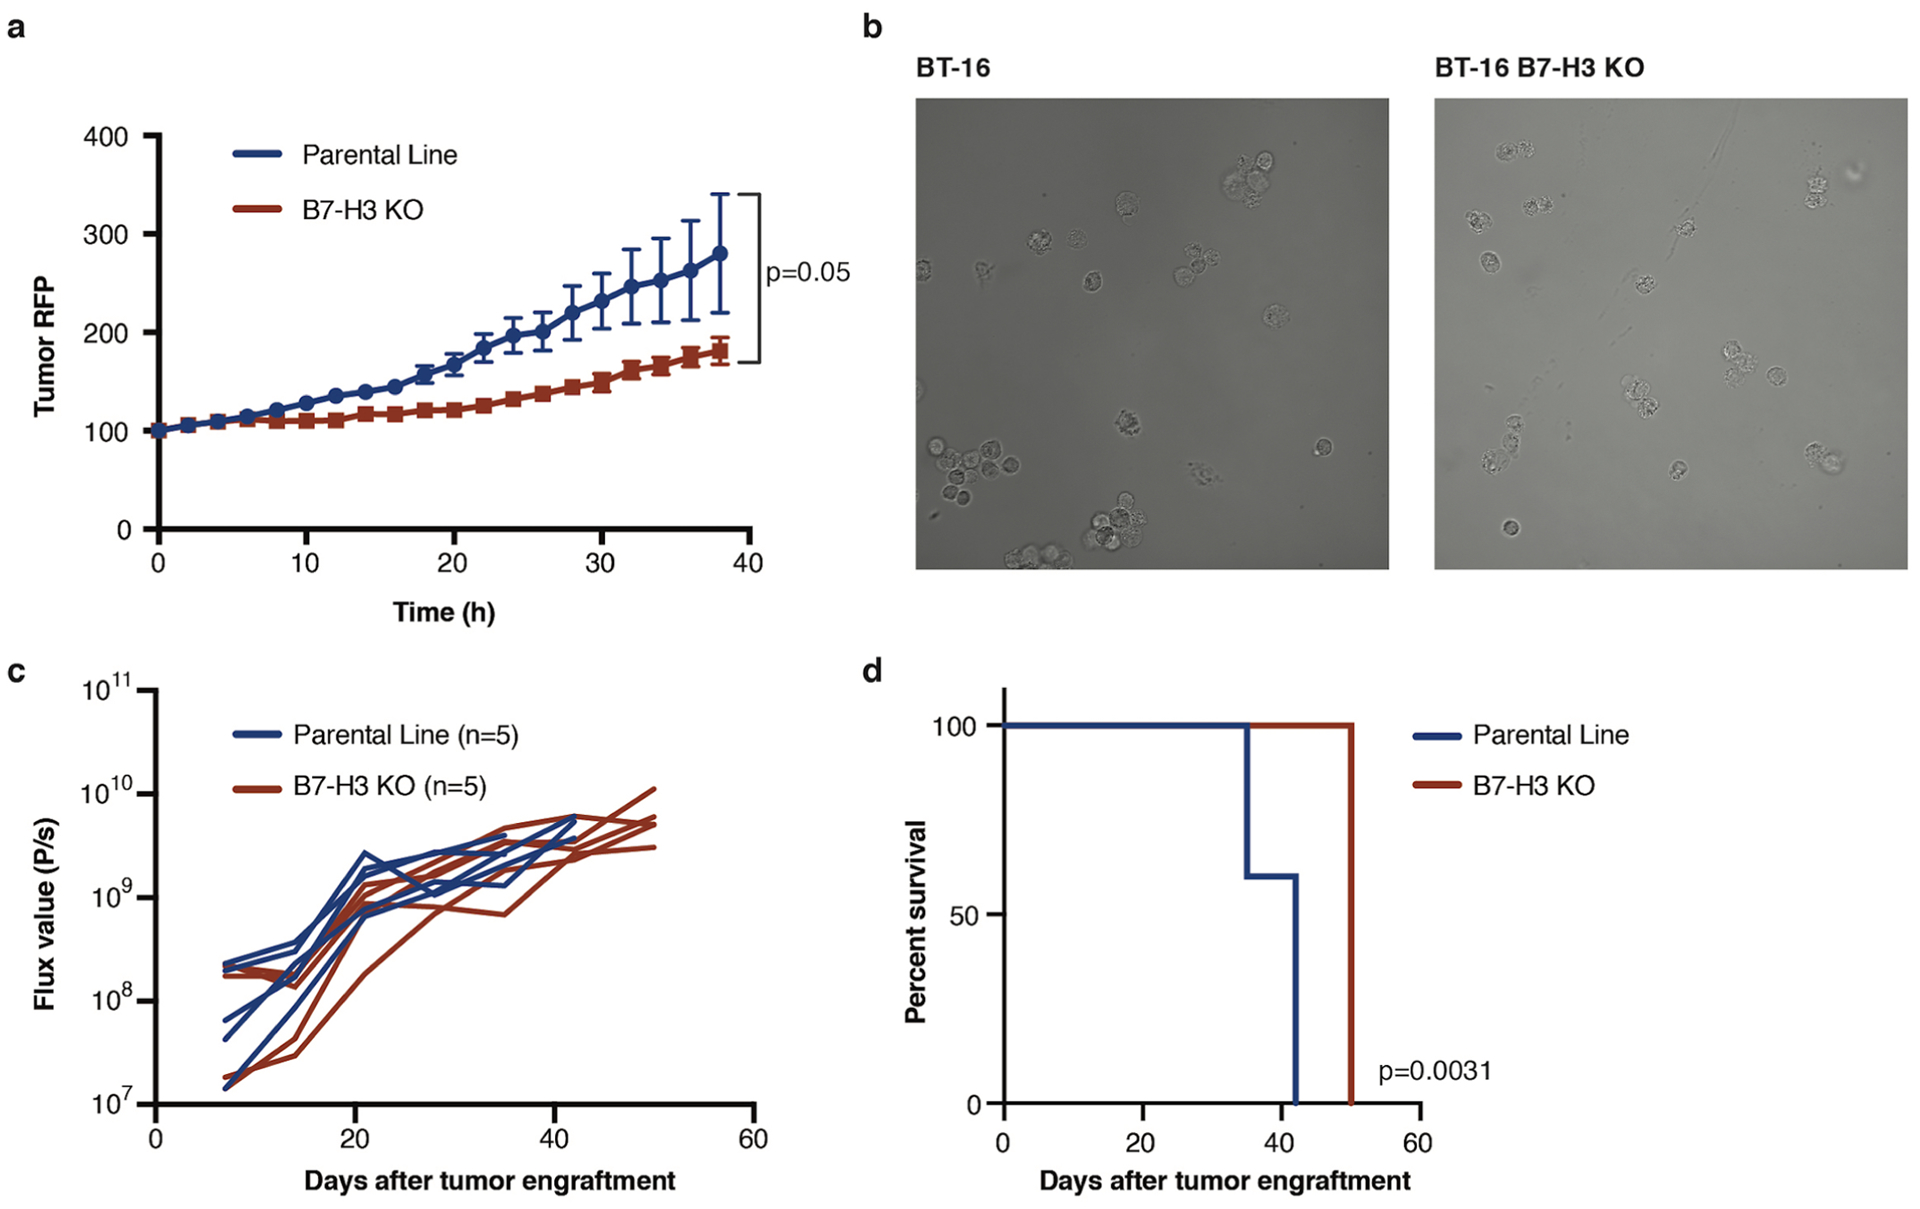
a, Proliferation assay of BT16 vs. B7-H3 KO BT16 tumor cells (p = 0.05) (Two-way Anova) n = 3 independent samples, experiment has been conducted three times. b, Representative images of BT16 and BT16 B7-H3 KO ATRT tumor cells. Experiment has been conducted two times c, Flux curve and survival d, of BT16 vs BT16 B7-H3 KO flank xenografts (p = 0.0031) (n = 5 independent animals) (Log-rank (Mantel-Cox) test, two-tailed). Experiment has been performed one time. All data are means ± s.e.m.
Supplementary Material
Acknowledgements
J.Theruvath is supported by German Cancer Aid (Deutsche Krebshilfe) grant no. P-91650709. This work was supported by a St Baldrick’s/Stand Up To Cancer Pediatric Dream Team Translational Cancer Research Grant (C.L.M., A.D., P.H.S., M.M., R. G.M.). Stand Up To Cancer is a program of the Entertainment Industry Foundation administered by the American Association for Cancer Research. C.L.M. is a member of the Parker Institute for Cancer Immunotherapy, which supports the Stanford University Cancer Immunotherapy Program. The work was also supported by the Virginia and D.K. Ludwig Fund for Cancer Research (C.L.M. and M.M.) and by National Cancer Institute grant no. 5P30CA12443 (C.L.M.). R.G.M. is supported by the Be Brooks Brave Fund St. Baldrick’s Scholar Award. A.L. is supported by the Nuovo-Soldati Foundation and by ITMO Cancer AVIESAN (Alliance Nationale pour les Sciences de la Vie et de la Santé/National Alliance for the Life Sciences and Health) within the framework of the French Cancer Plan. M.A.F. and D.W. receive funding as part of the INSTINCT network program grant, cofunded by The Brain Tumour Charity, Great Ormond Street Hospital Children’s Charity and Children with Cancer UK (16/193). O.D., D.S. and S.Z. are supported by the Ligue Nationale Contre le Cancer (équipe labellisée) and by the following grants: ERA-NET TRANSCAN (JTC 2014, no. TRAN201501238), TRANSCAN JTC 2017 (no.TRANS201801292) and H2020-lMI2-JTl-201 5-07 (116064, ITCC-P4 project). F.B. is supported by the St Baldrick’s Foundation. M.H. is funded by Interdisziplinäre Zentrum für Klinische Forschung Münster (no. Ha3/017/20) and Deutsche Forschungsgemeinschaft (DFG, no. HA 3060/8-1). M.C.F. is funded by DFG no. 1516/4-1. D.W.Y. is supported by the Tashia and John Morgridge Endowed Postdoctoral Fellowship from the Child Health Research Institute at Lucile Packard Children’s Hospital as well as the National Institute of Neurological Disorders and Stroke of the National Institutes of Health under award no. R25NS065741. S.C. was supported by the Ludwig Cancer Center, Department of Neurosurgery at Stanford University, and the Huntsman Cancer Institute, Department of Neurosurgery, University of Utah. He was also supported as the Ty Louis Campbell St. Baldrick’s Foundation Scholar and Kathryn S.R. Lowry Endowed Chari in Neurosurgery. S.C. was also supported by kind gifts from the Victoria and Rider McDowell Family Foundation, Cancer-A-Gogo, J. and C. Fisher, and C. Comey and J. Huang. S.S.M. is supported by the Siebel Scholars Award, The Andrew McDonough B+ (Be Positive) Foundation, The Morgan Adams Brain Tumor Foundation, the American Cancer Society Institutional Research Grant and the Plachy-Rubin foundation. We thank Y.-J. Cho (Oregon Health & Science University) for providing the ATRT-CHB-1 cell line and E. Huellman (Amsterdam University) for providing the VU-397 cell line. We thank J. Huang for assistance with mouse colony maintenance. We thank the Stanford Human Immune Monitoring Center for their support with the Luminex assays. We thank the Stanford Neuropathology Department for their help acquiring tissues. The illustrations for Fig. 2b and Extended Data Fig. 3b were used and modified from Servier Medical ART, licensed under a Creative Commons Attribution 3.0 Generic License (http://smart.servier.com/).
Footnotes
Online content
Any methods, additional references, Nature Research reporting summaries, source data, extended data, supplementary information, acknowledgements, peer review information; details of author contributions and competing interests; and statements of data and code availability are available at https://doi.org/10.1038/s41591-020-0821-8.
Competing interests
R.G.M., L.L. and E.S. hold several patent applications in the area of CAR T cell immunotherapy. C.L.M. is an inventor on a patent application for B7-H3 CAR T cells and holds several patent applications in the area of CAR T cell immunotherapy. C.L.M. is a founder of, holds equity in and receives consulting fees from Lyell Immunopharma. C.L.M. has also received consulting fees from NeoImmune Tech, Nektar Therapeutics and Apricity Health and royalties from Juno Therapeutics for the CD22-CAR. R.G.M, E.S. and L.L. are consultants for Lyell Immunopharma. R.G.M. is a consultant for Xyphos, Illumina Radiopharmaceuticals, GammaDelta Therapeutics and PACT Pharma. J.T. is a consultant for Dorian Therapeutics.
Extended data is available for this paper at https://doi.org/10.1038/s41591-020-0821-8.
Supplementary information is available for this paper at https://doi.org/10.1038/s41591-020-0821-8.
Peer review information Saheli Sadanand was the primary editor on this article and managed its editorial process and peer review in collaboration with the rest of the editorial team.
References
- 1.von Hoff K et al. Frequency, risk-factors and survival of children with atypical teratoid rhabdoid tumors (AT/RT) of the CNS diagnosed between 1988 and 2004, and registered to the German HIT database. Pediatr. Blood Cancer 57, 978–985 (2011). [DOI] [PubMed] [Google Scholar]
- 2.Fischer-Valuck BW et al. Assessment of the treatment approach and survival outcomes in a modern cohort of patients with atypical teratoid rhabdoid tumors using the National Cancer Database. Cancer 123, 682–687 (2017). [DOI] [PubMed] [Google Scholar]
- 3.Ginn KF & Gajjar A Atypical teratoid rhabdoid tumor: current therapy and future directions. Front. Oncol 2, 114 (2012). [DOI] [PMC free article] [PubMed] [Google Scholar]
- 4.Biegel JA et al. Germ-line and acquired mutations of INI1 in atypical teratoid and rhabdoid tumors. Cancer Res. 59, 74–79 (1999). [PubMed] [Google Scholar]
- 5.Pfister SM et al. Molecular diagnostics of CNS embryonal tumors. Acta Neuropathol. 120, 553–566 (2010). [DOI] [PMC free article] [PubMed] [Google Scholar]
- 6.Han Z-Y et al. The occurrence of intracranial rhabdoid tumours in mice depends on temporal control of Smarcb1 inactivation. Nat. Commun 7, 10421 (2016). [DOI] [PMC free article] [PubMed] [Google Scholar]
- 7.Du H et al. Antitumor responses in the absence of toxicity in solid tumors by targeting B7-H3 via chimeric antigen receptor T cells. Cancer Cell 35, 221–237.e8 (2019). [DOI] [PMC free article] [PubMed] [Google Scholar]
- 8.Majzner RG et al. CAR T cells targeting B7-H3, a pan-cancer antigen, demonstrate potent preclinical activity against pediatric solid tumors and brain tumors. Clin. Cancer Res 25, 2560–2574 (2019). [DOI] [PMC free article] [PubMed] [Google Scholar]
- 9.Kramer K et al. Compartmental intrathecal radioimmunotherapy: results for treatment for metastatic CNS neuroblastoma. J. Neurooncol 97, 409–418 (2010). [DOI] [PMC free article] [PubMed] [Google Scholar]
- 10.Walker AJ et al. Tumor antigen and receptor densities regulate efficacy of a chimeric antigen receptor targeting anaplastic lymphoma kinase. Mol. Ther 25, 2189–2201 (2017). [DOI] [PMC free article] [PubMed] [Google Scholar]
- 11.Majzner RG & Mackall CL Tumor antigen escape from CAR T-cell therapy. Cancer Discov. 8, 1219–1226 (2018). [DOI] [PubMed] [Google Scholar]
- 12.Fry TJ et al. CD22-targeted CAR T cells induce remission in B-ALL that is naive or resistant to CD19-targeted CAR immunotherapy. Nat. Med 24, 20–28 (2018). [DOI] [PMC free article] [PubMed] [Google Scholar]
- 13.O’Rourke DM et al. A single dose of peripherally infused EGFRvIII-directed CAR T cells mediates antigen loss and induces adaptive resistance in patients with recurrent glioblastoma. Sci. Transl. Med 9, eaaa0984 (2017). [DOI] [PMC free article] [PubMed] [Google Scholar]
- 14.Hegde M et al. Tandem CAR T cells targeting HER2 and IL13Rα2 mitigate tumor antigen escape. J. Clin. Invest 126, 3036–3052 (2016). [DOI] [PMC free article] [PubMed] [Google Scholar]
- 15.Krenciute G et al. Transgenic expression of IL15 improves antiglioma activity of IL13Rα2-CAR T cells but results in antigen loss variants. Cancer Immunol. Res 5, 571–581 (2017). [DOI] [PMC free article] [PubMed] [Google Scholar]
- 16.Brown CE et al. Regression of glioblastoma after chimeric antigen receptor T-cell therapy. N. Engl. J. Med 375, 2561–2569 (2016). [DOI] [PMC free article] [PubMed] [Google Scholar]
- 17.Johann PD et al. Atypical teratoid/rhabdoid tumors are comprised of three epigenetic subgroups with distinct enhancer landscapes. Cancer Cell 29, 379–393 (2016). [DOI] [PubMed] [Google Scholar]
- 18.Torchia J et al. Integrated (epi)-genomic analyses identify subgroup-specific therapeutic targets in CNS rhabdoid tumors. Cancer Cell 30, 891–908 (2016). [DOI] [PMC free article] [PubMed] [Google Scholar]
- 19.Lawrence MS et al. Mutational heterogeneity in cancer and the search for new cancer-associated genes. Nature 499, 214–218 (2013). [DOI] [PMC free article] [PubMed] [Google Scholar]
- 20.Lee RS et al. A remarkably simple genome underlies highly malignant pediatric rhabdoid cancers. J. Clin. Invest 122, 2983–2988 (2012). [DOI] [PMC free article] [PubMed] [Google Scholar]
- 21.Hasselblatt M et al. High-resolution genomic analysis suggests the absence of recurrent genomic alterations other than SMARCB1 aberrations in atypical teratoid/rhabdoid tumors. Genes Chromosomes Cancer 52, 185–190 (2013). [DOI] [PubMed] [Google Scholar]
- 22.Chauvin C et al. High-throughput drug screening identifies pazopanib and clofilium tosylate as promising treatments for malignant rhabdoid tumors. Cell Rep. 21, 1737–1745 (2017). [DOI] [PubMed] [Google Scholar]
- 23.Erkek S et al. Comprehensive analysis of chromatin states in atypical teratoid/rhabdoid tumor identifies diverging roles for SWI/SNF and polycomb in gene regulation. Cancer Cell 35, 95–110.e8 (2019). [DOI] [PMC free article] [PubMed] [Google Scholar]
- 24.Seaman S et al. Eradication of tumors through simultaneous ablation of CD276/B7-H3-positive tumor cells and tumor vasculature. Cancer Cell 31, 501–515.e8 (2017). [DOI] [PMC free article] [PubMed] [Google Scholar]
- 25.Cardoso-Moreira M et al. Gene expression across mammalian organ development. Nature 571, 505–509 (2019). [DOI] [PMC free article] [PubMed] [Google Scholar]
- 26.Miller JA et al. Transcriptional landscape of the prenatal human brain. Nature 508, 199–206 (2014). [DOI] [PMC free article] [PubMed] [Google Scholar]
- 27.Xu H, Cheung IY, Guo H-F & Cheung N-KV MicroRNA miR-29 modulates expression of immunoinhibitory molecule B7-H3: potential implications for immune based therapy of human solid tumors. Cancer Res. 69, 6275–6281 (2009). [DOI] [PMC free article] [PubMed] [Google Scholar]
- 28.Vladoiu MC et al. Childhood cerebellar tumours mirror conserved fetal transcriptional programs. Nature 572, 67–73 (2019). [DOI] [PMC free article] [PubMed] [Google Scholar]
- 29.Loo D et al. Development of an Fc-enhanced anti-B7-H3 monoclonal antibody with potent antitumor activity. Clin. Cancer Res 18, 3834–3845 (2012). [DOI] [PubMed] [Google Scholar]
- 30.Hashizume R et al. Morphologic and molecular characterization of ATRT xenografts adapted for orthotopic therapeutic testing. Neuro. Oncol 12, 366–376 (2010). [DOI] [PMC free article] [PubMed] [Google Scholar]
- 31.D’Cunja J et al. Antisense treatment of IGF-IR induces apoptosis and enhances chemosensitivity in central nervous system atypical teratoid/rhabdoid tumours cells. Eur. J. Cancer 43, 1581–1589 (2007). [DOI] [PubMed] [Google Scholar]
- 32.Hay KA et al. Kinetics and biomarkers of severe cytokine release syndrome after CD19 chimeric antigen receptor-modified T-cell therapy. Blood 130, 2295–2306 (2017). [DOI] [PMC free article] [PubMed] [Google Scholar]
- 33.Gust J et al. Endothelial activation and blood–brain barrier disruption in neurotoxicity after adoptive immunotherapy with CD19 CAR-T Cells. Cancer Discov. 7, 1404–1419 (2017). [DOI] [PMC free article] [PubMed] [Google Scholar]
- 34.Lee DW et al. T cells expressing CD19 chimeric antigen receptors for acute lymphoblastic leukaemia in children and young adults: a phase 1 dose-escalation trial. Lancet 385, 517–528 (2015). [DOI] [PMC free article] [PubMed] [Google Scholar]
- 35.Taraseviciute A et al. Chimeric antigen receptor T cell-mediated neurotoxicity in nonhuman primates. Cancer Discov. 8, 750–763 (2018). [DOI] [PMC free article] [PubMed] [Google Scholar]
- 36.D’Aloia MM, Zizzari IG, Sacchetti B, Pierelli L & Alimandi M CAR-T cells: the long and winding road to solid tumors. Cell Death Dis. 9, 282 (2018). [DOI] [PMC free article] [PubMed] [Google Scholar]
- 37.Priceman SJ et al. Regional delivery of chimeric antigen receptor-engineered T cells effectively targets HER2+ breast cancer metastasis to the brain. Clin. Cancer Res 24, 95–105 (2018). [DOI] [PMC free article] [PubMed] [Google Scholar]
- 38.Mount CW et al. Potent antitumor efficacy of anti-GD2 CAR T cells in H3-K27M+ diffuse midline gliomas. Nat. Med 24, 572–579 (2018). [DOI] [PMC free article] [PubMed] [Google Scholar]
- 39.Seeringer A et al. Synchronous congenital malignant rhabdoid tumor of the orbit and atypical teratoid/rhabdoid tumor—feasibility and efficacy of multimodal therapy in a long-term survivor. Cancer Genet. 207, 429–433 (2014). [DOI] [PubMed] [Google Scholar]
- 40.Frühwald MC, Biegel JA, Bourdeaut F, Roberts CWM & Chi SN Atypical teratoid/rhabdoid tumors—current concepts, advances in biology, and potential future therapies. Neuro. Oncol 18, 764–778 (2016). [DOI] [PMC free article] [PubMed] [Google Scholar]
- 41.Majzner RG & Mackall CL Clinical lessons learned from the first leg of the CAR T cell journey. Nat. Med 25, 1341–1355 (2019). [DOI] [PubMed] [Google Scholar]
- 42.Sun M et al. Characterization of mouse and human B7-H3 genes. J. Immunol 168, 6294–6297 (2002). [DOI] [PubMed] [Google Scholar]
- 43.Hofmeyer KA, Ray A & Zang X The contrasting role of B7-H3. Proc. Natl Acad. Sci. USA 105, 10277–10278 (2008). [DOI] [PMC free article] [PubMed] [Google Scholar]
- 44.Gholamin S et al. Disrupting the CD47-SIRPα anti-phagocytic axis by a humanized anti-CD47 antibody is an efficacious treatment for malignant pediatric brain tumors. Sci. Transl. Med 9, eaaf2968 (2017). [DOI] [PubMed] [Google Scholar]
- 45.Kochenderfer JN et al. Construction and preclinical evaluation of an anti-CD19 chimeric antigen receptor. J. Immunother 32, 689–702 (2009). [DOI] [PMC free article] [PubMed] [Google Scholar]
- 46.Kremers GJ, Goedhart J, van Munster EB & Gadella TW Jr. Cyan and yellow super fluorescent proteins with improved brightness, protein folding, and FRET Förster radius. Biochemistry 45, 6570–6580 (2006). [DOI] [PubMed] [Google Scholar]
- 47.Kim JH et al. High cleavage efficiency of a 2A peptide derived from porcine teschovirus-1 in human cell lines, zebrafish and mice. PLoS ONE 6, e18556 (2011). [DOI] [PMC free article] [PubMed] [Google Scholar]
- 48.Hall MP et al. Engineered luciferase reporter from a deep sea shrimp utilizing a novel imidazopyrazinone substrate. ACS Chem. Biol 7, 1848–1857 (2012). [DOI] [PMC free article] [PubMed] [Google Scholar]
- 49.Liu L, Herukka S-K, Minkeviciene R, van Groen T & Tanila H Longitudinal observation on CSF Aβ42 levels in young to middle-aged amyloid precursor protein/presenilin-1 doubly transgenic mice. Neurobiol. Dis 17, 516–523 (2004). [DOI] [PubMed] [Google Scholar]
Associated Data
This section collects any data citations, data availability statements, or supplementary materials included in this article.
Supplementary Materials
Data Availability Statement
All unprocessed western blot images and statistics are supplied as Source Data. All source data for Figs. 1–4 and Extended Data Figs. 1–8 are supplied in the Supplementary Dataset.