Abstract
The coronavirus disease 2019 (COVID-19) pandemic is a global health care emergency. Although reverse-transcription polymerase chain reaction testing is the reference standard method to identify patients with COVID-19 infection, chest radiography and CT play a vital role in the detection and management of these patients. Prediction models for COVID-19 imaging are rapidly being developed to support medical decision making. However, inadequate availability of a diverse annotated data set has limited the performance and generalizability of existing models. To address this unmet need, the RSNA and Society of Thoracic Radiology collaborated to develop the RSNA International COVID-19 Open Radiology Database (RICORD). This database is the first multi-institutional, multinational, expert-annotated COVID-19 imaging data set. It is made freely available to the machine learning community as a research and educational resource for COVID-19 chest imaging. Pixel-level volumetric segmentation with clinical annotations was performed by thoracic radiology subspecialists for all COVID-19–positive thoracic CT scans. The labeling schema was coordinated with other international consensus panels and COVID-19 data annotation efforts, the European Society of Medical Imaging Informatics, the American College of Radiology, and the American Association of Physicists in Medicine. Study-level COVID-19 classification labels for chest radiographs were annotated by three radiologists, with majority vote adjudication by board-certified radiologists. RICORD consists of 240 thoracic CT scans and 1000 chest radiographs contributed from four international sites. It is anticipated that RICORD will ideally lead to prediction models that can demonstrate sustained performance across populations and health care systems.
© RSNA, 2021
Online supplemental material is available for this article.
See also the editorial by Bai and Thomasian in this issue.
Summary
The RSNA International COVID-19 Open Radiology Database, or RICORD, is the first multi-institutional, multinational, expert-annotated coronavirus disease 2019 imaging data set made freely available and designed for the machine learning community.
Key Results
■ The RSNA International COVID-19 Open Radiology Database (RICORD) is a multi-institutional, multinational, expert-annotated coronavirus disease 2019 (COVID-19) imaging data set made openly available to the research community.
■ In RICORD, pixel-level volumetric segmentation with clinical annotations was performed by thoracic radiology subspecialists for all COVID-19–positive thoracic CT imaging studies, and COVID-19 classification labeling for chest radiographs was performed by three board-certified radiologists.
■ At this time, RICORD consists of 240 thoracic CT images and 1000 chest radiographs.
Introduction
Despite widespread utilization of infection control measures, severe acute respiratory syndrome coronavirus 2 continues to cause frequent recurring outbreaks of coronavirus disease 2019 (COVID-19) throughout the world (1,2). To date, COVID-19 remains clinically unpredictable, demonstrating significant potential to rapidly overwhelm health care infrastructure (1,2). The inability to quickly detect outbreaks, mobilize testing and medical care resources, and guide treatment—including predicting which patients will experience a mild course and which patients will require advanced life support—remains a major challenge for health care systems worldwide (1,3). Investments into infrastructure capable of maximizing the data and information generated by practice-based evidence for COVID-19 detection, prognostication, and management, including diagnostic imaging, will be critical to optimize the use of limited resources and guide global strategy (4).
Chest imaging, including both radiography and CT, is a vital tool for the detection, quantification, and clinical management of COVID-19 (5–7). At the same time, the field of machine learning has demonstrated potential value for rapid medical imaging analysis in COVID-19 (8), leveraging imaging data biomarkers to help diagnose, quantify, and predict disease severity in patients with COVID-19 (9–11). Although routine screening by means of chest imaging alone for the identification of COVID-19 is not recommended by most radiology societies (12), its frequent use in practice for both patients with respiratory symptoms or persons under investigation for COVID-19 and in management of those confirmed to have the infection has nonetheless increased worldwide (13). In addition, given the prevalence of asymptomatic and presymptomatic infection, as well as early evidence for limited immunity in exposed populations, COVID-19 is likely to be a globally endemic disease in the future. This underscores the importance of identifying outbreaks and public health planning, particularly as patients will have incidentally detected findings at routine imaging that could be attributable to COVID-19 pneumonia and could expose others in the health care system, especially vulnerable populations (1).
Since the outbreak of the virus, there have been many publications related to COVID-19 (14), including dozens of automated imaging analysis models; however, the majority have underperformed in validation experiments (15,16). This failure to generalize to new data sets is often multifactorial, owing in part to limited single-site data, lack of expert annotation, and heterogeneous or inconsistent labeling schemas (15,16). The shortcomings of these early efforts highlight the importance of shared research and education resources for COVID-19. Large data sharing collaborations are an effective strategy to pool medical data to address shortcomings related to data availability, generalization, and coordinating annotation frameworks (17,18). Unfortunately, even in the face of a health care crisis, incentives for collecting, annotating, and sharing medical data, especially imaging data, are not well established. Prior experience curating large, annotated, multisite medical imaging data sets has been related primarily to hosting machine learning challenges or as part of clinical trials or individual institution efforts (19–23). New initiatives are needed that can better operationalize the collection, preparation, annotation, and access to large medical imaging data sets to address public health crises.
The purpose of this work is to describe the RSNA International COVID-19 Open Radiology Database (RICORD) data set as the first multinational, multimodality, expert-annotated open medical imaging data set for COVID-19 thoracic imaging made available initially through The Cancer Imaging Archive (TCIA). Additional data will continue to be collected, annotated, and shared, including additional imaging modalities and accompanying clinical data, as part of an expanded effort collaboration with the American College of Radiology and the American Association of Physicists in Medicine to create a new Medical Imaging and Data Resource Center. These data will continue to be made freely available for general research and education.
Materials and Methods
The primary goal of creating the RICORD data set was to achieve a large and heterogeneous database focused on COVID-19 chest imaging that represents a diversity of variables across patient populations, imaging equipment, and protocols, which introduced many regulatory and logistical challenges. A second goal was to focus on streamlining imaging data de-identification and transmission such that data aggregation was possible. These goals required custom-built open-source engineering tools to facilitate the process toward successful uniform Digital Imaging and Communications in Medicine (DICOM) study de-identification and submission to a central resource.
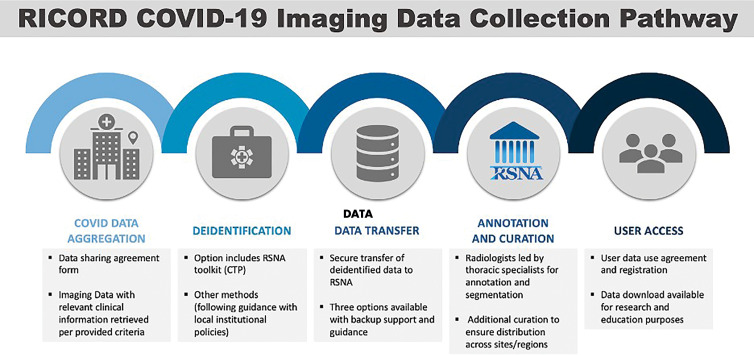
A third goal of the RICORD data set was to include multimodal imaging, both planar imaging in the form of chest radiography and volumetric data (CT image series). Multimodal images were collected along with relevant clinical and demographic data, presenting unique challenges due to data set complexity. In RICORD, we sought to include expert annotation in the setting of a new disease, with many available and nascent classification schemas requiring both education and several rounds of consensus and coordination with similar data annotation efforts by other large organizations around the world. Moreover, the size and complexity of the data set and use of image series required assembling, coordinating, training, and monitoring a dedicated group of expert annotators to complete the project in a short time frame. Finally, data set hosting and data vending required infrastructure capable of handling large volumes of imaging studies, including experience with public data sets and requisite privacy and security mechanisms. An international task force composed of imaging, biostatistical, and data science experts was assembled to create a staged deployment approach (Fig 1) completed in a relatively short time frame to provide value during the ongoing pandemic.
Figure 1:
Stepwise pathway for coronavirus disease 2019 (COVID-19) imaging data contribution. CTP = clinical trials processor, RICORD = RSNA International COVID-19 Open Radiology Database.
Data Inclusion Criteria
An international call for COVID-19 medical imaging data submission was issued by means of an open survey by the RSNA in April 2020. More than 200 individual responses from 20 countries were received. As part of an aggressive release timeline, four initial sites from four countries were selected for this first release of RICORD based on the availability of curated COVID-19 data and presence of existing data sharing agreements with the RSNA. As of this writing, dozens of additional sites are engaged in active data use agreement review with the RSNA. International laws, institutional regulations and permissions, ethics review, and the availability of access to curated COVID-19 imaging data serve as ongoing barriers that require time to resolve.
Institutional review board (ethics committee) approval was obtained from all four sites for this retrospective study. For the United States site, a waiver of informed consent was obtained, and processes were compliant with the Health Insurance Portability and Accountability Act. Selection criteria included (a) patients at least 18 years of age who underwent chest imaging (CT and/or radiography) for suspected COVID-19 infection (eg, International Classification of Diseases, 10th Revision, Clinical Modification code U07.1 among discharge diagnosis) and (b) positive infection confirmed with one or more of the following: reverse-transcription polymerase chain reaction test, immunoglobulin M antibody test, or clinical diagnosis using hospital-specific criteria. For the purposes of this data set, criteria for positive infection encompassed patients who were diagnosed before hospitalization but remained symptomatic during the hospitalization, patients with a positive test or diagnosis during hospital admission, and patients who were symptomatic during the hospitalization and had a confirmed test available after hospital discharge.
For chest CT examinations, the axial series was requested with a section thickness of 2.5–5.0 mm and any protocol or kernel, with preference for soft-tissue kernel. The section thickness was set partly to facilitate the section-by-section segmentation and annotation of data. Prior studies have successfully used varied section thicknesses to train machine learning models (24). For chest radiography, any frontal radiograph and method of acquisition (portable, anteroposterior, posteroanterior) was accepted. The following data elements were obtained for each examination: (a) Unique Patient identifier, (b) Unique Imaging Examination identifier, (c) age, (d) sex, and (e) COVID-19 testing method (polymerase chain reaction, serological, clinical). These data elements were standardized with the de-identification tool (see following section). In the frequent case that a given patient underwent multiple thoracic imaging examinations, relative time of acquisition was maintained with the de-identification to enable timeline preservation in the aggregate data set. COVID-19 testing methods and other supporting clinical information, if available, were provided in a spreadsheet and linked with the patient-unique identification number and imaging study identification number.
De-Identification
Contributing sites were responsible for de-identifying imaging examinations and associated clinical information for inclusion in RICORD with expectations for use as a public research and educational database (noncommercial use). Although all sites followed their institutional policies and procedures, adhering to locally applicable regulations and best practices, there was a need to homogenize the de-identification approach as a way to mitigate problematic heterogeneity in de-identification methodologies. Unique pseudonymous identifiers are created for each patient such that subsequent imaging studies for the same patient could be assigned to the same anonymous patient identification number.
A customized, free, open-source DICOM de-identification software solution named DICOM Anonymizer was created by experienced DICOM experts at the RSNA based on recognized standards and best practices implementing the RICORD Data De-identification Protocol. The anonymizer generates a unique numeric site identification parameter, or SITEID, as a way to distinguish data sets contributed by different sites without exposing the actual identity of the contributing site. The specific elements modified in the anonymizer script and selected relevant sections of the DICOM standard can be found here: https://www.rsna.org/-/media/Files/RSNA/Covid-19/RICORD/RSNA-Covid-19-Deidentification-Protocol.pdf.
To facilitate multiple workflows, three options were set up to import DICOM objects into DICOM Anonymizer, including (a) importing from a local storage location, (b) direct picture archiving and communication system query (through a DICOM C-MOVE transfer), and (c) the use of accession numbers to allow a user to enter a list of accession numbers by hand, copy and paste a list, or open a text file containing a list and then start the DICOM import process. Each participating site was provided with documentation on how to install and use the DICOM Anonymizer to prepare DICOM objects for submission to RICORD. Although successful use of the DICOM Anonymizer required technical knowledge of the configuration of the picture archiving and communication system and local networks, a webinar was hosted by members of the RSNA COVID-19 task force as a technical walkthrough demonstration format followed by an open question session from the audience. A discussion board for users was also made available so that troubleshooting and guidance could be more easily accessed by participating sites with asynchronous interactions from RSNA technical staff and volunteers.
Data Use Agreement and Hosting
Over the course of several iterations, a data submission agreement was crafted with the intent of setting the terms by which the RSNA would collect and submit anonymized imaging data from medical centers and research institutions. The agreement describes the collaboration with existing National Institutes of Health resources through TCIA to facilitate the submission, processing, and publication of data. The agreement outlines the process for data set review, confirmation of de-identification, and encrypted transmission. Housed within the National Institutes of Health, TCIA is a service that de-identifies and hosts a large archive of medical images accessible for public download. The data are organized as collections, typically images related by a common disease (eg, lung cancer), image modality or type (MRI, CT, digital histopathologic examination, etc), and/or research focus. DICOM is the primary file format used by TCIA for medical imaging. A DICOM file stores the digital image along with a series of tags that contain metadata about the image, such as patient identification number, study identification number, patient weight, and anatomic site. More information about DICOM is available at http://medical.nema.org. Supporting data related to the images, such as patient outcomes, treatment details, genomics, and expert analyses, are also provided when available. This public-facing data hosting and vending workflow enables the wide distribution and use of this imaging resource, and RICORD will be listed as a unique collection within TCIA infrastructure. Any potential user can then access TCIA to search for and download images and associated annotation files.
The terms outline that ownership of the submitted data is retained by the submitting institution and, in agreeing to participate, the submitting organization grants the RSNA a nonexclusive, royalty-free, sublicensable, worldwide, perpetual, irrevocable license to the submitted data available for commercial, scientific, and educational purposes, including rights necessary for the RSNA to make the Curated Submission Data available to the public pursuant to the Creative Commons Attribution 4.0 International License. Each submitting center must attest that they have the authority and rights to grant the RSNA a license to publish and otherwise use the Submission Data and Curated Submission Data in accordance with the terms of the agreement. A fully executed signed agreement was required of all participating sites prior to data submission and can be found in its entirety at the link included here: https://www.rsna.org/-/media/Files/RSNA/Covid-19/RICORD/RSNA-Data-Submission-Agreement-Form.pdf.
Annotation
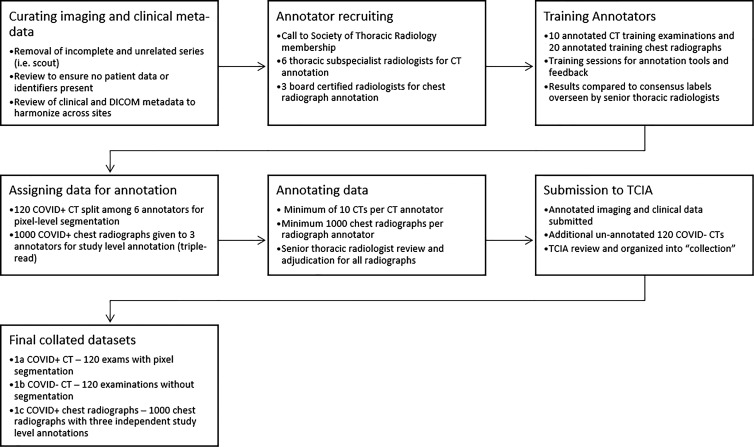
The annotation strategy was focused on balancing the richness of the annotations with the effort required to perform annotations. In aggregate for RICORD, 240 unique chest CT scans and 1000 unique chest radiographs were selected from the initial contributing institutions. The entire process from data solicitation to collation of the final data set is summarized in the workflow diagram (Fig 2).
Figure 2:
Pathway for the annotation and curation for the RSNA International COVID-19 Open Radiology Database. COVID-19 = coronavirus disease 2019, DICOM = Digital Imaging and Communications in Medicine, TCIA = The Cancer Imaging Archive.
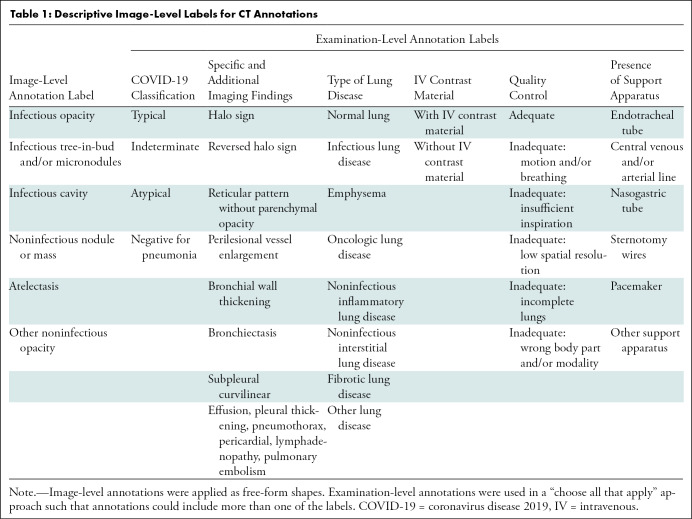
Chest CT scan annotation.—For the chest CT segmentation task, a small portion of each data set from contributing institutions was identified for full hand segmentation and annotation by six subspecialist thoracic radiologists (average experience, 6 years). The annotation schema was designed in coordination with Society of Thoracic Radiology and European Society of Medical Imaging Informatics leadership to ensure consistency. Annotation was focused on current understanding and guidance in reporting chest imaging findings potentially attributable to COVID-19 pneumonia, including standardized study-level annotation to reduce variability. This multisociety, international, expert annotation consensus will help detail the imaging appearance of COVID-19 pneumonia and aid in further data set enrichment and curation as well as model development across data sets. Examination-level binary annotations were performed to indicate the presence of a support apparatus (endotracheal tube, central venous catheter, pacemaker, feeding tube) as well as to describe global study image quality (adequate, motion artifact, incomplete). Each examination was classified as having typical, indeterminate, atypical, or negative appearance for COVID-19 pneumonia based on the RSNA consensus statement (25) (Fig 3). Table 1 describes the image-level and examination-level annotation labels. Examples of possible image-level and examination-level annotations are shown in Figure 4 and Figure 5, respectively.
Figure 3a:
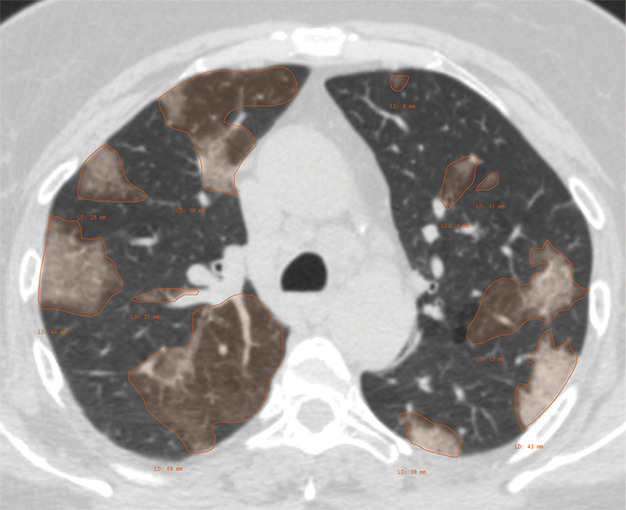
Example of CT scans and chest radiographs in the RSNA International COVID-19 Open Radiology Database. (a) Annotated axial CT image shows segmentation of characteristic bilateral multifocal ground-glass opacities in predominantly peripheral distribution (orange regions of interest). The CT image was classified as having typical appearance of coronavirus disease 2019 (COVID-19) pneumonia. (b) Annotated axial CT image shows segmentation of bilateral multifocal ground-glass opacities with diffuse distribution (orange regions of interest). The CT image was classified as having indeterminate appearance of COVID-19 pneumonia. (c) Thoracic CT image shows bilateral nodular and patchy opacities with peripheral and lower lung predominance involving four lung zones, annotated as typical for COVID-19 with moderate severity. (d) Thoracic CT image shows bilateral nodular and patchy opacities with peripheral and lower lung predominance involving more than four lung zones, annotated as typical appearance for COVID-19 and severe lung involvement. (e) Bedside chest radiograph with bilateral patchy and nodular opacities (arrows) with upper lung predominance involving more than four lung zones, annotated as indeterminate appearance for COVID-19 and severe lung involvement. (f) Bedside chest radiograph shows left lower lobe opacities (arrows) with small left pleural effusion involving a single lung zone, annotated as atypical appearance for COVID-19 and mild lung involvement. (g) Bedside chest radiograph shows bilateral patchy and nodular opacities (arrows) with upper lung predominance involving more than four lung zones, annotated as indeterminate appearance for COVID-19 and severe lung involvement. (h) Bedside chest radiograph shows left lower lobe opacity (arrow) with small left pleural effusion involving a single lung zone, annotated as atypical appearance for COVID-19 and mild lung involvement.
Table 1:
Descriptive Image-Level Labels for CT Annotations
Figure 4a:
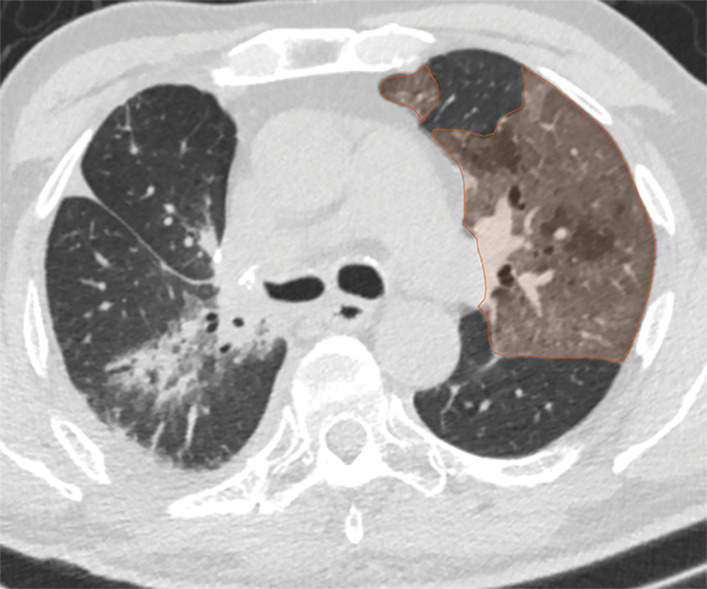
Examples of image-level annotations on axial CT images indicated with orange regions of interest. (a) Infectious opacity segmented in the left upper lobe. (b) Infectious tree-in-bud and/or micronodules segmented in the right lower lobe. (c) Infectious cavity segmented in the right upper lobe. (d) Noninfectious nodule or mass segmented in the posterior left pleura. (e) Atelectasis segmented in the left lower lobe. (f) Other noninfectious opacity segmented in the right lower lobe.
Figure 5a:
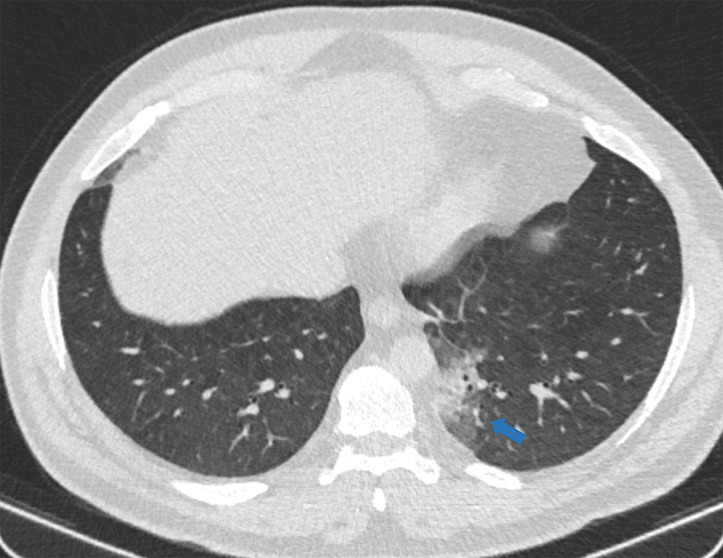
Examples of examination-level annotations on axial CT images. (a) Ground-glass opacities surrounding a nodular opacity (arrow) in the left lower lobe (halo sign). (b) Bilateral ground-glass opacities (arrows) with central clearing (reversed halo sign). (c) Reticular pattern without parenchymal opacity in the left upper lobe (arrows). (d) Perilesional vessel enlargement associated with bilateral ground-glass opacities (arrows). (e) Bronchial wall thickening most evident in the right lung (arrows). (f) Bronchiectasis in the left upper lobe (arrows). (g) Bilateral subpleural curvilinear lines (arrows). (h) Small bilateral pleural effusions (arrows). (i) Right pleural thickening (arrows). (j) Right pneumothorax (arrows). (k) Pericardial effusion (arrow). (l) Mediastinal lymphadenopathy (arrows) in the prevascular and bilateral lower paratracheal stations. (m) Pulmonary emboli (arrows) in the right lower and middle lobar pulmonary arteries.
Figure 3b:
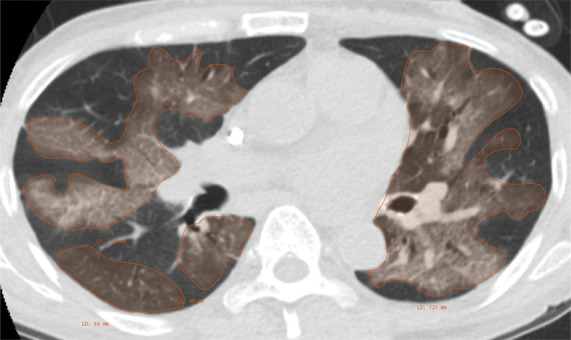
Example of CT scans and chest radiographs in the RSNA International COVID-19 Open Radiology Database. (a) Annotated axial CT image shows segmentation of characteristic bilateral multifocal ground-glass opacities in predominantly peripheral distribution (orange regions of interest). The CT image was classified as having typical appearance of coronavirus disease 2019 (COVID-19) pneumonia. (b) Annotated axial CT image shows segmentation of bilateral multifocal ground-glass opacities with diffuse distribution (orange regions of interest). The CT image was classified as having indeterminate appearance of COVID-19 pneumonia. (c) Thoracic CT image shows bilateral nodular and patchy opacities with peripheral and lower lung predominance involving four lung zones, annotated as typical for COVID-19 with moderate severity. (d) Thoracic CT image shows bilateral nodular and patchy opacities with peripheral and lower lung predominance involving more than four lung zones, annotated as typical appearance for COVID-19 and severe lung involvement. (e) Bedside chest radiograph with bilateral patchy and nodular opacities (arrows) with upper lung predominance involving more than four lung zones, annotated as indeterminate appearance for COVID-19 and severe lung involvement. (f) Bedside chest radiograph shows left lower lobe opacities (arrows) with small left pleural effusion involving a single lung zone, annotated as atypical appearance for COVID-19 and mild lung involvement. (g) Bedside chest radiograph shows bilateral patchy and nodular opacities (arrows) with upper lung predominance involving more than four lung zones, annotated as indeterminate appearance for COVID-19 and severe lung involvement. (h) Bedside chest radiograph shows left lower lobe opacity (arrow) with small left pleural effusion involving a single lung zone, annotated as atypical appearance for COVID-19 and mild lung involvement.
Figure 3c:
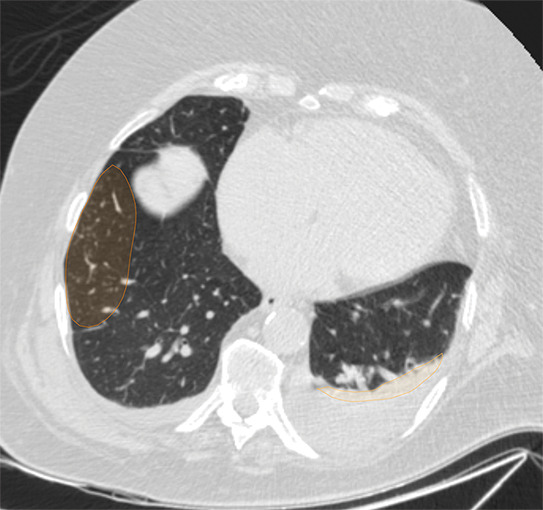
Example of CT scans and chest radiographs in the RSNA International COVID-19 Open Radiology Database. (a) Annotated axial CT image shows segmentation of characteristic bilateral multifocal ground-glass opacities in predominantly peripheral distribution (orange regions of interest). The CT image was classified as having typical appearance of coronavirus disease 2019 (COVID-19) pneumonia. (b) Annotated axial CT image shows segmentation of bilateral multifocal ground-glass opacities with diffuse distribution (orange regions of interest). The CT image was classified as having indeterminate appearance of COVID-19 pneumonia. (c) Thoracic CT image shows bilateral nodular and patchy opacities with peripheral and lower lung predominance involving four lung zones, annotated as typical for COVID-19 with moderate severity. (d) Thoracic CT image shows bilateral nodular and patchy opacities with peripheral and lower lung predominance involving more than four lung zones, annotated as typical appearance for COVID-19 and severe lung involvement. (e) Bedside chest radiograph with bilateral patchy and nodular opacities (arrows) with upper lung predominance involving more than four lung zones, annotated as indeterminate appearance for COVID-19 and severe lung involvement. (f) Bedside chest radiograph shows left lower lobe opacities (arrows) with small left pleural effusion involving a single lung zone, annotated as atypical appearance for COVID-19 and mild lung involvement. (g) Bedside chest radiograph shows bilateral patchy and nodular opacities (arrows) with upper lung predominance involving more than four lung zones, annotated as indeterminate appearance for COVID-19 and severe lung involvement. (h) Bedside chest radiograph shows left lower lobe opacity (arrow) with small left pleural effusion involving a single lung zone, annotated as atypical appearance for COVID-19 and mild lung involvement.
Figure 3d:
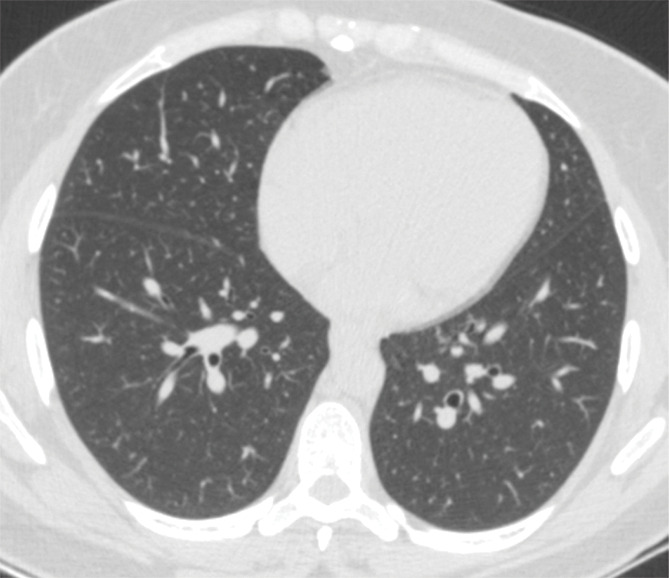
Example of CT scans and chest radiographs in the RSNA International COVID-19 Open Radiology Database. (a) Annotated axial CT image shows segmentation of characteristic bilateral multifocal ground-glass opacities in predominantly peripheral distribution (orange regions of interest). The CT image was classified as having typical appearance of coronavirus disease 2019 (COVID-19) pneumonia. (b) Annotated axial CT image shows segmentation of bilateral multifocal ground-glass opacities with diffuse distribution (orange regions of interest). The CT image was classified as having indeterminate appearance of COVID-19 pneumonia. (c) Thoracic CT image shows bilateral nodular and patchy opacities with peripheral and lower lung predominance involving four lung zones, annotated as typical for COVID-19 with moderate severity. (d) Thoracic CT image shows bilateral nodular and patchy opacities with peripheral and lower lung predominance involving more than four lung zones, annotated as typical appearance for COVID-19 and severe lung involvement. (e) Bedside chest radiograph with bilateral patchy and nodular opacities (arrows) with upper lung predominance involving more than four lung zones, annotated as indeterminate appearance for COVID-19 and severe lung involvement. (f) Bedside chest radiograph shows left lower lobe opacities (arrows) with small left pleural effusion involving a single lung zone, annotated as atypical appearance for COVID-19 and mild lung involvement. (g) Bedside chest radiograph shows bilateral patchy and nodular opacities (arrows) with upper lung predominance involving more than four lung zones, annotated as indeterminate appearance for COVID-19 and severe lung involvement. (h) Bedside chest radiograph shows left lower lobe opacity (arrow) with small left pleural effusion involving a single lung zone, annotated as atypical appearance for COVID-19 and mild lung involvement.
Figure 3e:
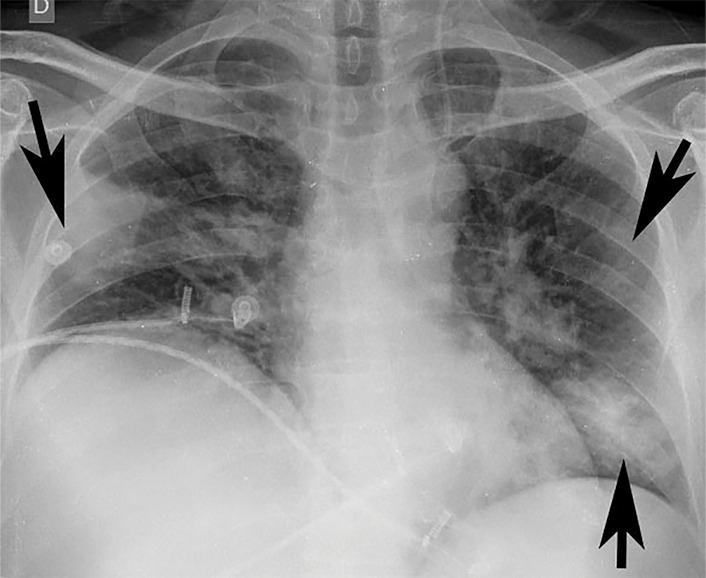
Example of CT scans and chest radiographs in the RSNA International COVID-19 Open Radiology Database. (a) Annotated axial CT image shows segmentation of characteristic bilateral multifocal ground-glass opacities in predominantly peripheral distribution (orange regions of interest). The CT image was classified as having typical appearance of coronavirus disease 2019 (COVID-19) pneumonia. (b) Annotated axial CT image shows segmentation of bilateral multifocal ground-glass opacities with diffuse distribution (orange regions of interest). The CT image was classified as having indeterminate appearance of COVID-19 pneumonia. (c) Thoracic CT image shows bilateral nodular and patchy opacities with peripheral and lower lung predominance involving four lung zones, annotated as typical for COVID-19 with moderate severity. (d) Thoracic CT image shows bilateral nodular and patchy opacities with peripheral and lower lung predominance involving more than four lung zones, annotated as typical appearance for COVID-19 and severe lung involvement. (e) Bedside chest radiograph with bilateral patchy and nodular opacities (arrows) with upper lung predominance involving more than four lung zones, annotated as indeterminate appearance for COVID-19 and severe lung involvement. (f) Bedside chest radiograph shows left lower lobe opacities (arrows) with small left pleural effusion involving a single lung zone, annotated as atypical appearance for COVID-19 and mild lung involvement. (g) Bedside chest radiograph shows bilateral patchy and nodular opacities (arrows) with upper lung predominance involving more than four lung zones, annotated as indeterminate appearance for COVID-19 and severe lung involvement. (h) Bedside chest radiograph shows left lower lobe opacity (arrow) with small left pleural effusion involving a single lung zone, annotated as atypical appearance for COVID-19 and mild lung involvement.
Figure 3f:
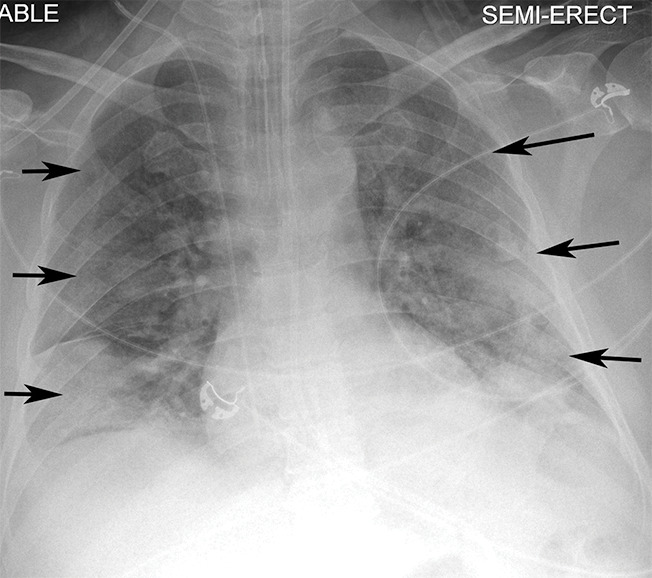
Example of CT scans and chest radiographs in the RSNA International COVID-19 Open Radiology Database. (a) Annotated axial CT image shows segmentation of characteristic bilateral multifocal ground-glass opacities in predominantly peripheral distribution (orange regions of interest). The CT image was classified as having typical appearance of coronavirus disease 2019 (COVID-19) pneumonia. (b) Annotated axial CT image shows segmentation of bilateral multifocal ground-glass opacities with diffuse distribution (orange regions of interest). The CT image was classified as having indeterminate appearance of COVID-19 pneumonia. (c) Thoracic CT image shows bilateral nodular and patchy opacities with peripheral and lower lung predominance involving four lung zones, annotated as typical for COVID-19 with moderate severity. (d) Thoracic CT image shows bilateral nodular and patchy opacities with peripheral and lower lung predominance involving more than four lung zones, annotated as typical appearance for COVID-19 and severe lung involvement. (e) Bedside chest radiograph with bilateral patchy and nodular opacities (arrows) with upper lung predominance involving more than four lung zones, annotated as indeterminate appearance for COVID-19 and severe lung involvement. (f) Bedside chest radiograph shows left lower lobe opacities (arrows) with small left pleural effusion involving a single lung zone, annotated as atypical appearance for COVID-19 and mild lung involvement. (g) Bedside chest radiograph shows bilateral patchy and nodular opacities (arrows) with upper lung predominance involving more than four lung zones, annotated as indeterminate appearance for COVID-19 and severe lung involvement. (h) Bedside chest radiograph shows left lower lobe opacity (arrow) with small left pleural effusion involving a single lung zone, annotated as atypical appearance for COVID-19 and mild lung involvement.
Figure 3g:
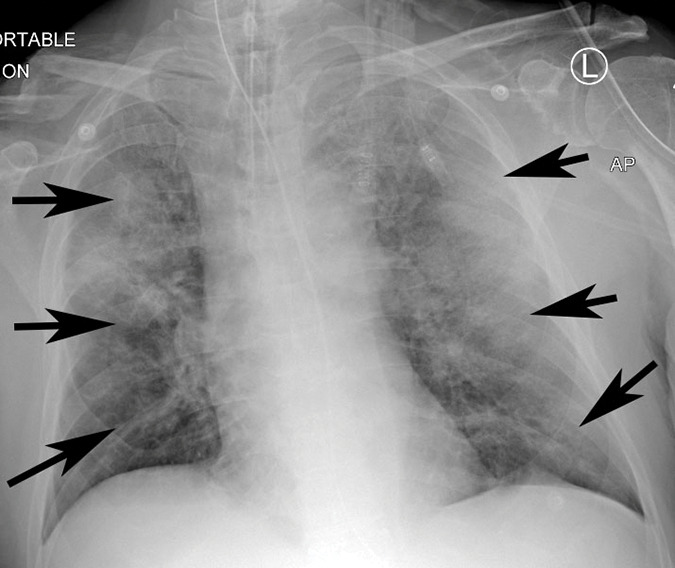
Example of CT scans and chest radiographs in the RSNA International COVID-19 Open Radiology Database. (a) Annotated axial CT image shows segmentation of characteristic bilateral multifocal ground-glass opacities in predominantly peripheral distribution (orange regions of interest). The CT image was classified as having typical appearance of coronavirus disease 2019 (COVID-19) pneumonia. (b) Annotated axial CT image shows segmentation of bilateral multifocal ground-glass opacities with diffuse distribution (orange regions of interest). The CT image was classified as having indeterminate appearance of COVID-19 pneumonia. (c) Thoracic CT image shows bilateral nodular and patchy opacities with peripheral and lower lung predominance involving four lung zones, annotated as typical for COVID-19 with moderate severity. (d) Thoracic CT image shows bilateral nodular and patchy opacities with peripheral and lower lung predominance involving more than four lung zones, annotated as typical appearance for COVID-19 and severe lung involvement. (e) Bedside chest radiograph with bilateral patchy and nodular opacities (arrows) with upper lung predominance involving more than four lung zones, annotated as indeterminate appearance for COVID-19 and severe lung involvement. (f) Bedside chest radiograph shows left lower lobe opacities (arrows) with small left pleural effusion involving a single lung zone, annotated as atypical appearance for COVID-19 and mild lung involvement. (g) Bedside chest radiograph shows bilateral patchy and nodular opacities (arrows) with upper lung predominance involving more than four lung zones, annotated as indeterminate appearance for COVID-19 and severe lung involvement. (h) Bedside chest radiograph shows left lower lobe opacity (arrow) with small left pleural effusion involving a single lung zone, annotated as atypical appearance for COVID-19 and mild lung involvement.
Figure 3h:
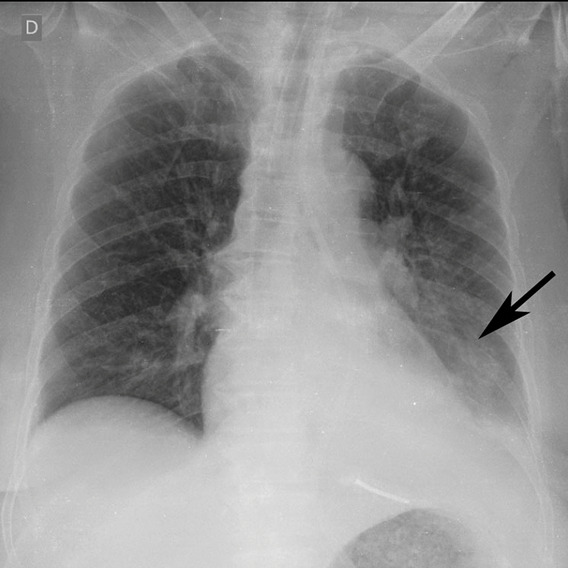
Example of CT scans and chest radiographs in the RSNA International COVID-19 Open Radiology Database. (a) Annotated axial CT image shows segmentation of characteristic bilateral multifocal ground-glass opacities in predominantly peripheral distribution (orange regions of interest). The CT image was classified as having typical appearance of coronavirus disease 2019 (COVID-19) pneumonia. (b) Annotated axial CT image shows segmentation of bilateral multifocal ground-glass opacities with diffuse distribution (orange regions of interest). The CT image was classified as having indeterminate appearance of COVID-19 pneumonia. (c) Thoracic CT image shows bilateral nodular and patchy opacities with peripheral and lower lung predominance involving four lung zones, annotated as typical for COVID-19 with moderate severity. (d) Thoracic CT image shows bilateral nodular and patchy opacities with peripheral and lower lung predominance involving more than four lung zones, annotated as typical appearance for COVID-19 and severe lung involvement. (e) Bedside chest radiograph with bilateral patchy and nodular opacities (arrows) with upper lung predominance involving more than four lung zones, annotated as indeterminate appearance for COVID-19 and severe lung involvement. (f) Bedside chest radiograph shows left lower lobe opacities (arrows) with small left pleural effusion involving a single lung zone, annotated as atypical appearance for COVID-19 and mild lung involvement. (g) Bedside chest radiograph shows bilateral patchy and nodular opacities (arrows) with upper lung predominance involving more than four lung zones, annotated as indeterminate appearance for COVID-19 and severe lung involvement. (h) Bedside chest radiograph shows left lower lobe opacity (arrow) with small left pleural effusion involving a single lung zone, annotated as atypical appearance for COVID-19 and mild lung involvement.
Figure 4b:
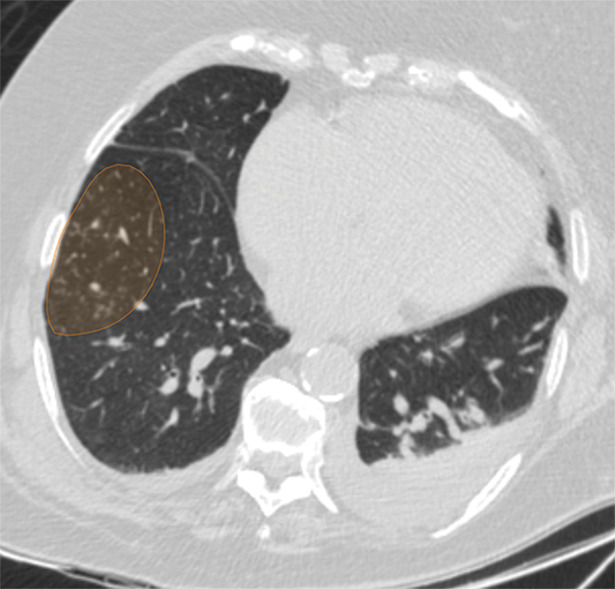
Examples of image-level annotations on axial CT images indicated with orange regions of interest. (a) Infectious opacity segmented in the left upper lobe. (b) Infectious tree-in-bud and/or micronodules segmented in the right lower lobe. (c) Infectious cavity segmented in the right upper lobe. (d) Noninfectious nodule or mass segmented in the posterior left pleura. (e) Atelectasis segmented in the left lower lobe. (f) Other noninfectious opacity segmented in the right lower lobe.
Figure 4c:
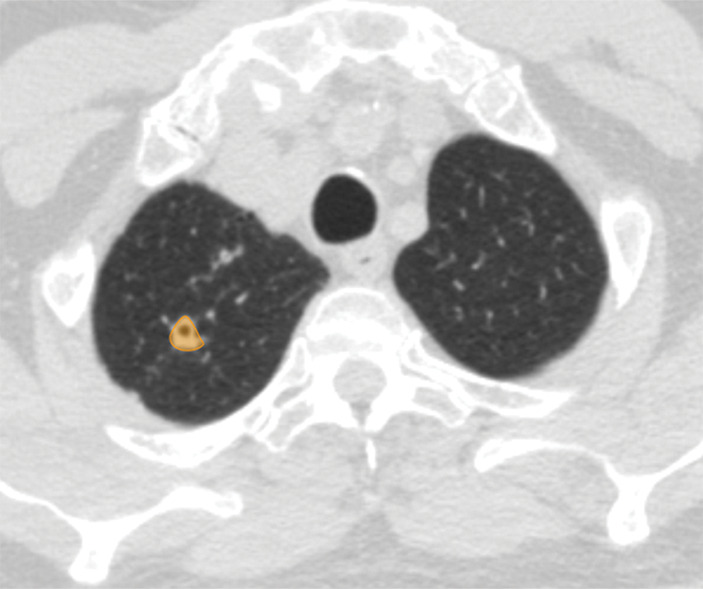
Examples of image-level annotations on axial CT images indicated with orange regions of interest. (a) Infectious opacity segmented in the left upper lobe. (b) Infectious tree-in-bud and/or micronodules segmented in the right lower lobe. (c) Infectious cavity segmented in the right upper lobe. (d) Noninfectious nodule or mass segmented in the posterior left pleura. (e) Atelectasis segmented in the left lower lobe. (f) Other noninfectious opacity segmented in the right lower lobe.
Figure 4d:
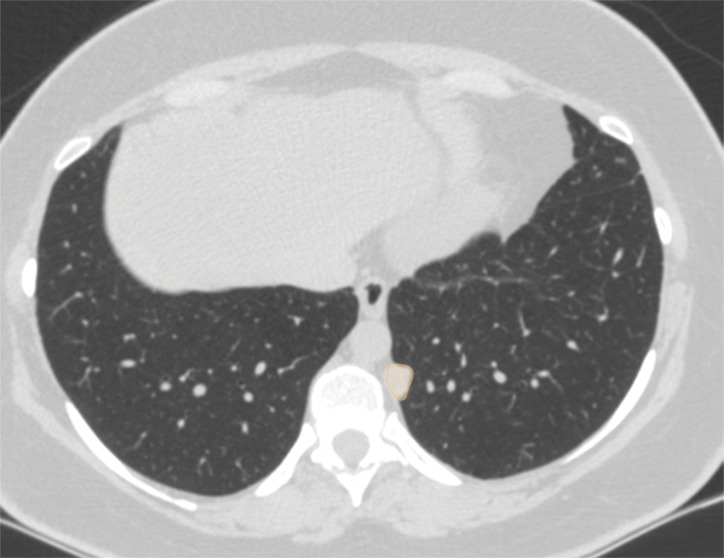
Examples of image-level annotations on axial CT images indicated with orange regions of interest. (a) Infectious opacity segmented in the left upper lobe. (b) Infectious tree-in-bud and/or micronodules segmented in the right lower lobe. (c) Infectious cavity segmented in the right upper lobe. (d) Noninfectious nodule or mass segmented in the posterior left pleura. (e) Atelectasis segmented in the left lower lobe. (f) Other noninfectious opacity segmented in the right lower lobe.
Figure 4e:
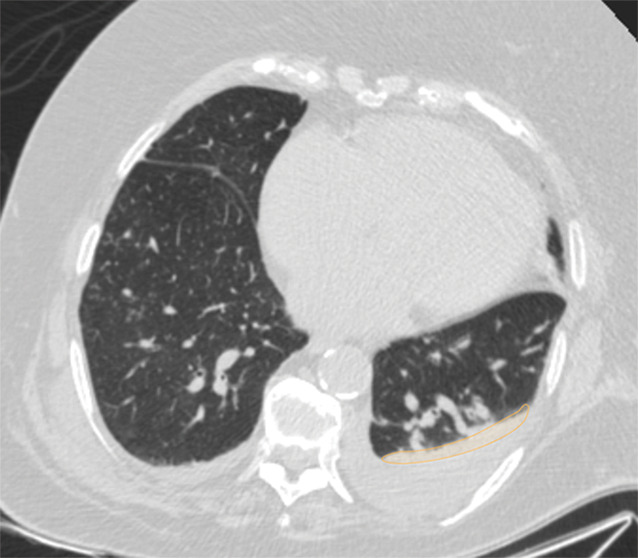
Examples of image-level annotations on axial CT images indicated with orange regions of interest. (a) Infectious opacity segmented in the left upper lobe. (b) Infectious tree-in-bud and/or micronodules segmented in the right lower lobe. (c) Infectious cavity segmented in the right upper lobe. (d) Noninfectious nodule or mass segmented in the posterior left pleura. (e) Atelectasis segmented in the left lower lobe. (f) Other noninfectious opacity segmented in the right lower lobe.
Figure 4f:
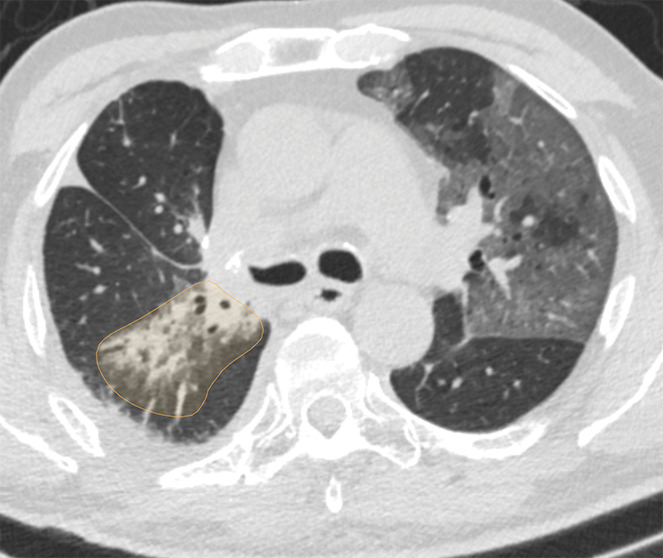
Examples of image-level annotations on axial CT images indicated with orange regions of interest. (a) Infectious opacity segmented in the left upper lobe. (b) Infectious tree-in-bud and/or micronodules segmented in the right lower lobe. (c) Infectious cavity segmented in the right upper lobe. (d) Noninfectious nodule or mass segmented in the posterior left pleura. (e) Atelectasis segmented in the left lower lobe. (f) Other noninfectious opacity segmented in the right lower lobe.
Figure 5b:
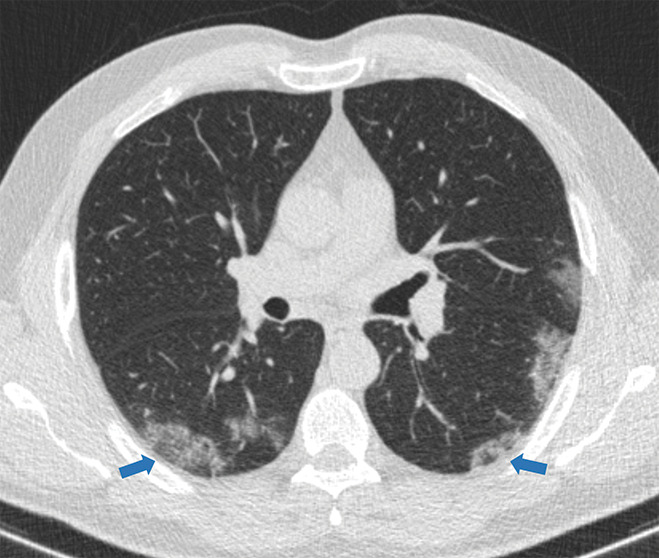
Examples of examination-level annotations on axial CT images. (a) Ground-glass opacities surrounding a nodular opacity (arrow) in the left lower lobe (halo sign). (b) Bilateral ground-glass opacities (arrows) with central clearing (reversed halo sign). (c) Reticular pattern without parenchymal opacity in the left upper lobe (arrows). (d) Perilesional vessel enlargement associated with bilateral ground-glass opacities (arrows). (e) Bronchial wall thickening most evident in the right lung (arrows). (f) Bronchiectasis in the left upper lobe (arrows). (g) Bilateral subpleural curvilinear lines (arrows). (h) Small bilateral pleural effusions (arrows). (i) Right pleural thickening (arrows). (j) Right pneumothorax (arrows). (k) Pericardial effusion (arrow). (l) Mediastinal lymphadenopathy (arrows) in the prevascular and bilateral lower paratracheal stations. (m) Pulmonary emboli (arrows) in the right lower and middle lobar pulmonary arteries.
Figure 5c:
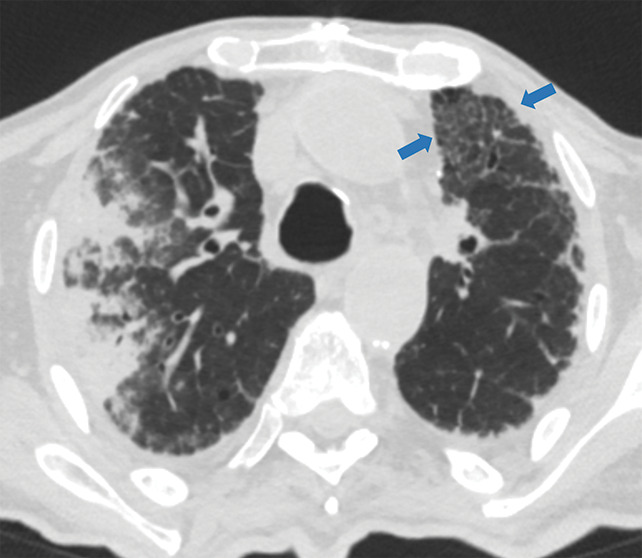
Examples of examination-level annotations on axial CT images. (a) Ground-glass opacities surrounding a nodular opacity (arrow) in the left lower lobe (halo sign). (b) Bilateral ground-glass opacities (arrows) with central clearing (reversed halo sign). (c) Reticular pattern without parenchymal opacity in the left upper lobe (arrows). (d) Perilesional vessel enlargement associated with bilateral ground-glass opacities (arrows). (e) Bronchial wall thickening most evident in the right lung (arrows). (f) Bronchiectasis in the left upper lobe (arrows). (g) Bilateral subpleural curvilinear lines (arrows). (h) Small bilateral pleural effusions (arrows). (i) Right pleural thickening (arrows). (j) Right pneumothorax (arrows). (k) Pericardial effusion (arrow). (l) Mediastinal lymphadenopathy (arrows) in the prevascular and bilateral lower paratracheal stations. (m) Pulmonary emboli (arrows) in the right lower and middle lobar pulmonary arteries.
Figure 5d:
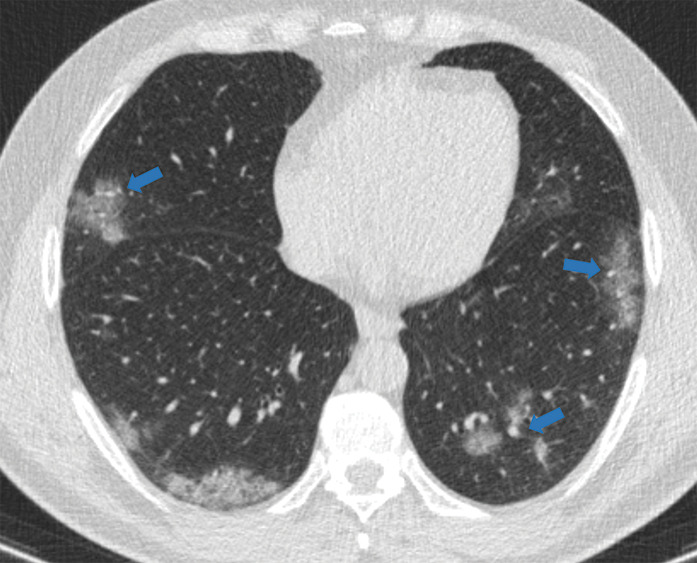
Examples of examination-level annotations on axial CT images. (a) Ground-glass opacities surrounding a nodular opacity (arrow) in the left lower lobe (halo sign). (b) Bilateral ground-glass opacities (arrows) with central clearing (reversed halo sign). (c) Reticular pattern without parenchymal opacity in the left upper lobe (arrows). (d) Perilesional vessel enlargement associated with bilateral ground-glass opacities (arrows). (e) Bronchial wall thickening most evident in the right lung (arrows). (f) Bronchiectasis in the left upper lobe (arrows). (g) Bilateral subpleural curvilinear lines (arrows). (h) Small bilateral pleural effusions (arrows). (i) Right pleural thickening (arrows). (j) Right pneumothorax (arrows). (k) Pericardial effusion (arrow). (l) Mediastinal lymphadenopathy (arrows) in the prevascular and bilateral lower paratracheal stations. (m) Pulmonary emboli (arrows) in the right lower and middle lobar pulmonary arteries.
Figure 5e:
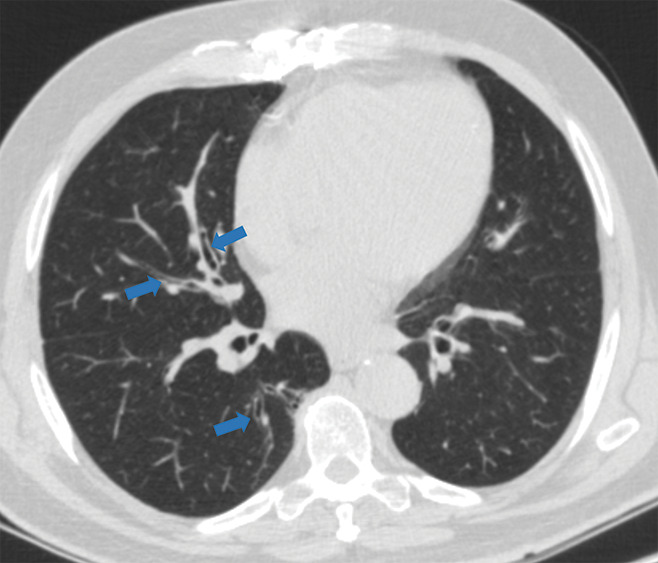
Examples of examination-level annotations on axial CT images. (a) Ground-glass opacities surrounding a nodular opacity (arrow) in the left lower lobe (halo sign). (b) Bilateral ground-glass opacities (arrows) with central clearing (reversed halo sign). (c) Reticular pattern without parenchymal opacity in the left upper lobe (arrows). (d) Perilesional vessel enlargement associated with bilateral ground-glass opacities (arrows). (e) Bronchial wall thickening most evident in the right lung (arrows). (f) Bronchiectasis in the left upper lobe (arrows). (g) Bilateral subpleural curvilinear lines (arrows). (h) Small bilateral pleural effusions (arrows). (i) Right pleural thickening (arrows). (j) Right pneumothorax (arrows). (k) Pericardial effusion (arrow). (l) Mediastinal lymphadenopathy (arrows) in the prevascular and bilateral lower paratracheal stations. (m) Pulmonary emboli (arrows) in the right lower and middle lobar pulmonary arteries.
Figure 5f:
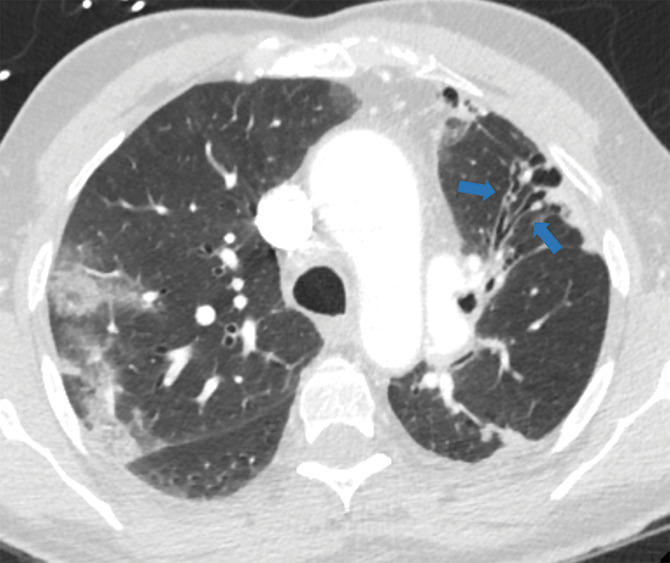
Examples of examination-level annotations on axial CT images. (a) Ground-glass opacities surrounding a nodular opacity (arrow) in the left lower lobe (halo sign). (b) Bilateral ground-glass opacities (arrows) with central clearing (reversed halo sign). (c) Reticular pattern without parenchymal opacity in the left upper lobe (arrows). (d) Perilesional vessel enlargement associated with bilateral ground-glass opacities (arrows). (e) Bronchial wall thickening most evident in the right lung (arrows). (f) Bronchiectasis in the left upper lobe (arrows). (g) Bilateral subpleural curvilinear lines (arrows). (h) Small bilateral pleural effusions (arrows). (i) Right pleural thickening (arrows). (j) Right pneumothorax (arrows). (k) Pericardial effusion (arrow). (l) Mediastinal lymphadenopathy (arrows) in the prevascular and bilateral lower paratracheal stations. (m) Pulmonary emboli (arrows) in the right lower and middle lobar pulmonary arteries.
Figure 5g:
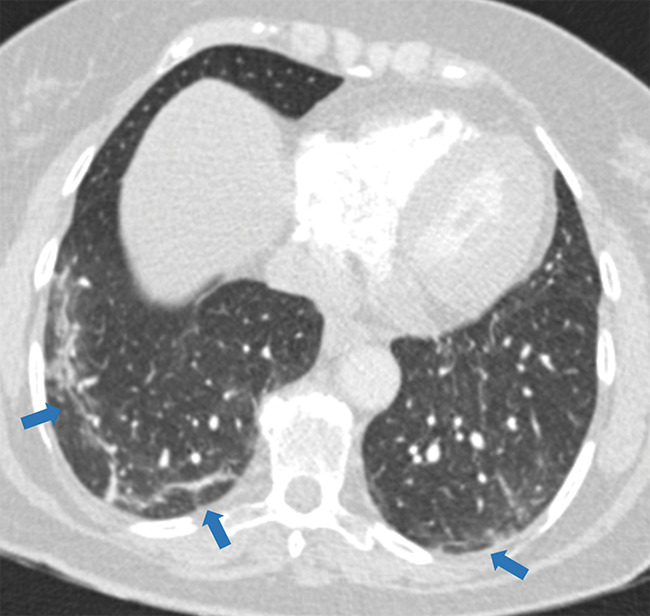
Examples of examination-level annotations on axial CT images. (a) Ground-glass opacities surrounding a nodular opacity (arrow) in the left lower lobe (halo sign). (b) Bilateral ground-glass opacities (arrows) with central clearing (reversed halo sign). (c) Reticular pattern without parenchymal opacity in the left upper lobe (arrows). (d) Perilesional vessel enlargement associated with bilateral ground-glass opacities (arrows). (e) Bronchial wall thickening most evident in the right lung (arrows). (f) Bronchiectasis in the left upper lobe (arrows). (g) Bilateral subpleural curvilinear lines (arrows). (h) Small bilateral pleural effusions (arrows). (i) Right pleural thickening (arrows). (j) Right pneumothorax (arrows). (k) Pericardial effusion (arrow). (l) Mediastinal lymphadenopathy (arrows) in the prevascular and bilateral lower paratracheal stations. (m) Pulmonary emboli (arrows) in the right lower and middle lobar pulmonary arteries.
Figure 5h:
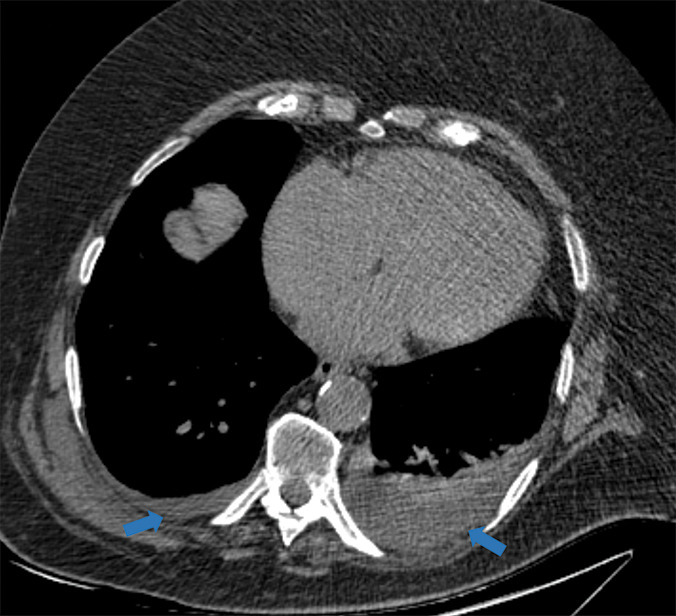
Examples of examination-level annotations on axial CT images. (a) Ground-glass opacities surrounding a nodular opacity (arrow) in the left lower lobe (halo sign). (b) Bilateral ground-glass opacities (arrows) with central clearing (reversed halo sign). (c) Reticular pattern without parenchymal opacity in the left upper lobe (arrows). (d) Perilesional vessel enlargement associated with bilateral ground-glass opacities (arrows). (e) Bronchial wall thickening most evident in the right lung (arrows). (f) Bronchiectasis in the left upper lobe (arrows). (g) Bilateral subpleural curvilinear lines (arrows). (h) Small bilateral pleural effusions (arrows). (i) Right pleural thickening (arrows). (j) Right pneumothorax (arrows). (k) Pericardial effusion (arrow). (l) Mediastinal lymphadenopathy (arrows) in the prevascular and bilateral lower paratracheal stations. (m) Pulmonary emboli (arrows) in the right lower and middle lobar pulmonary arteries.
Figure 5i:
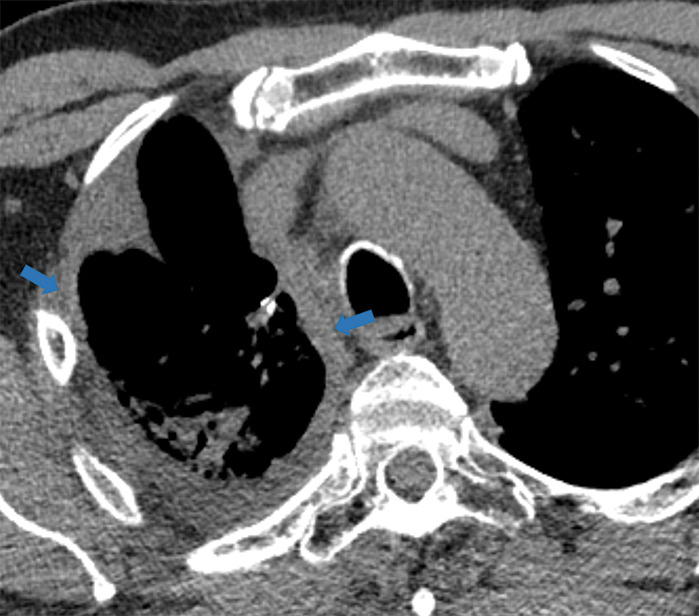
Examples of examination-level annotations on axial CT images. (a) Ground-glass opacities surrounding a nodular opacity (arrow) in the left lower lobe (halo sign). (b) Bilateral ground-glass opacities (arrows) with central clearing (reversed halo sign). (c) Reticular pattern without parenchymal opacity in the left upper lobe (arrows). (d) Perilesional vessel enlargement associated with bilateral ground-glass opacities (arrows). (e) Bronchial wall thickening most evident in the right lung (arrows). (f) Bronchiectasis in the left upper lobe (arrows). (g) Bilateral subpleural curvilinear lines (arrows). (h) Small bilateral pleural effusions (arrows). (i) Right pleural thickening (arrows). (j) Right pneumothorax (arrows). (k) Pericardial effusion (arrow). (l) Mediastinal lymphadenopathy (arrows) in the prevascular and bilateral lower paratracheal stations. (m) Pulmonary emboli (arrows) in the right lower and middle lobar pulmonary arteries.
Figure 5j:
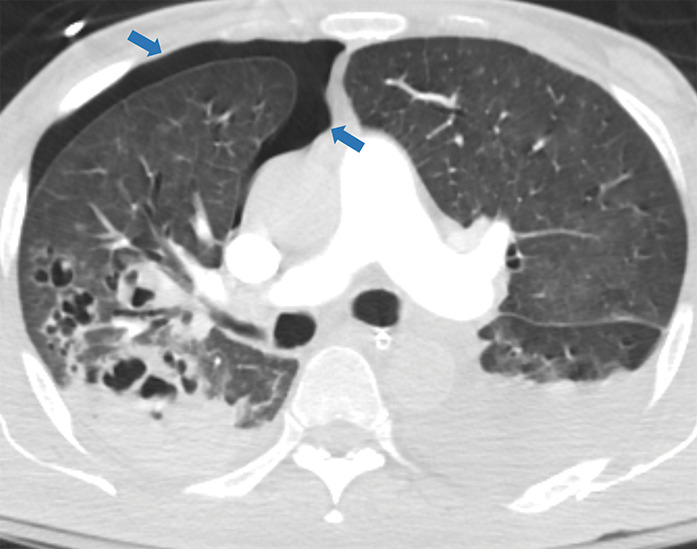
Examples of examination-level annotations on axial CT images. (a) Ground-glass opacities surrounding a nodular opacity (arrow) in the left lower lobe (halo sign). (b) Bilateral ground-glass opacities (arrows) with central clearing (reversed halo sign). (c) Reticular pattern without parenchymal opacity in the left upper lobe (arrows). (d) Perilesional vessel enlargement associated with bilateral ground-glass opacities (arrows). (e) Bronchial wall thickening most evident in the right lung (arrows). (f) Bronchiectasis in the left upper lobe (arrows). (g) Bilateral subpleural curvilinear lines (arrows). (h) Small bilateral pleural effusions (arrows). (i) Right pleural thickening (arrows). (j) Right pneumothorax (arrows). (k) Pericardial effusion (arrow). (l) Mediastinal lymphadenopathy (arrows) in the prevascular and bilateral lower paratracheal stations. (m) Pulmonary emboli (arrows) in the right lower and middle lobar pulmonary arteries.
Figure 5k:
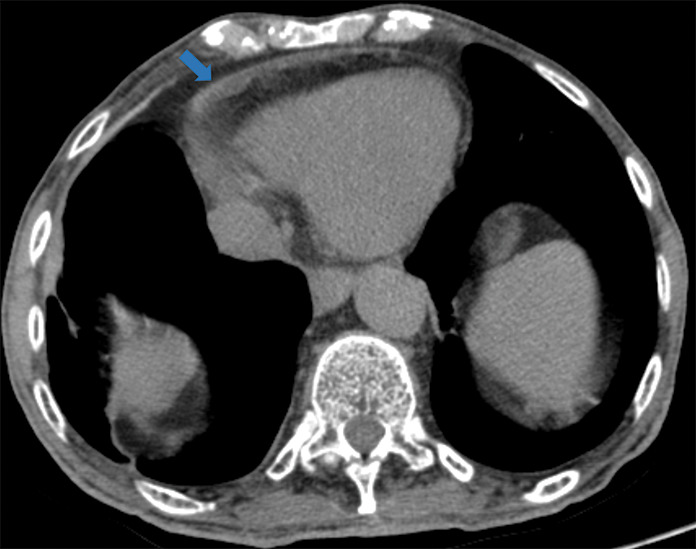
Examples of examination-level annotations on axial CT images. (a) Ground-glass opacities surrounding a nodular opacity (arrow) in the left lower lobe (halo sign). (b) Bilateral ground-glass opacities (arrows) with central clearing (reversed halo sign). (c) Reticular pattern without parenchymal opacity in the left upper lobe (arrows). (d) Perilesional vessel enlargement associated with bilateral ground-glass opacities (arrows). (e) Bronchial wall thickening most evident in the right lung (arrows). (f) Bronchiectasis in the left upper lobe (arrows). (g) Bilateral subpleural curvilinear lines (arrows). (h) Small bilateral pleural effusions (arrows). (i) Right pleural thickening (arrows). (j) Right pneumothorax (arrows). (k) Pericardial effusion (arrow). (l) Mediastinal lymphadenopathy (arrows) in the prevascular and bilateral lower paratracheal stations. (m) Pulmonary emboli (arrows) in the right lower and middle lobar pulmonary arteries.
Figure 5l:
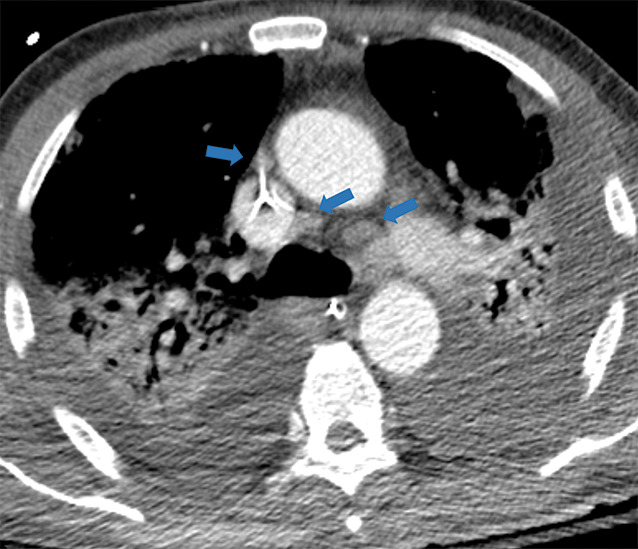
Examples of examination-level annotations on axial CT images. (a) Ground-glass opacities surrounding a nodular opacity (arrow) in the left lower lobe (halo sign). (b) Bilateral ground-glass opacities (arrows) with central clearing (reversed halo sign). (c) Reticular pattern without parenchymal opacity in the left upper lobe (arrows). (d) Perilesional vessel enlargement associated with bilateral ground-glass opacities (arrows). (e) Bronchial wall thickening most evident in the right lung (arrows). (f) Bronchiectasis in the left upper lobe (arrows). (g) Bilateral subpleural curvilinear lines (arrows). (h) Small bilateral pleural effusions (arrows). (i) Right pleural thickening (arrows). (j) Right pneumothorax (arrows). (k) Pericardial effusion (arrow). (l) Mediastinal lymphadenopathy (arrows) in the prevascular and bilateral lower paratracheal stations. (m) Pulmonary emboli (arrows) in the right lower and middle lobar pulmonary arteries.
Figure 5m:
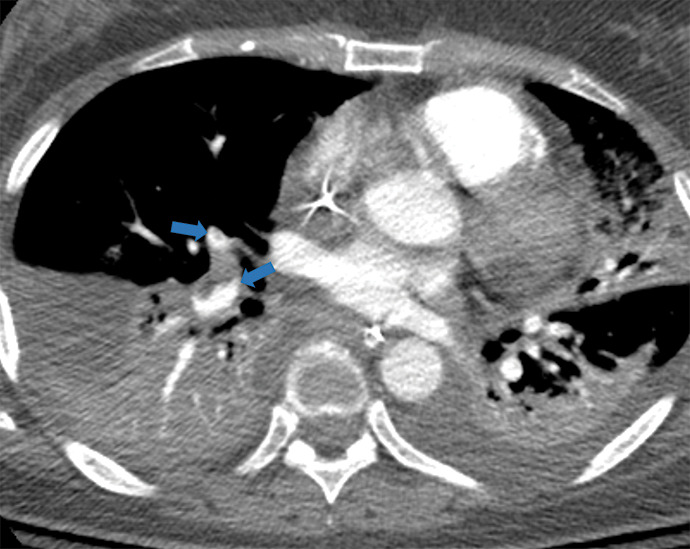
Examples of examination-level annotations on axial CT images. (a) Ground-glass opacities surrounding a nodular opacity (arrow) in the left lower lobe (halo sign). (b) Bilateral ground-glass opacities (arrows) with central clearing (reversed halo sign). (c) Reticular pattern without parenchymal opacity in the left upper lobe (arrows). (d) Perilesional vessel enlargement associated with bilateral ground-glass opacities (arrows). (e) Bronchial wall thickening most evident in the right lung (arrows). (f) Bronchiectasis in the left upper lobe (arrows). (g) Bilateral subpleural curvilinear lines (arrows). (h) Small bilateral pleural effusions (arrows). (i) Right pleural thickening (arrows). (j) Right pneumothorax (arrows). (k) Pericardial effusion (arrow). (l) Mediastinal lymphadenopathy (arrows) in the prevascular and bilateral lower paratracheal stations. (m) Pulmonary emboli (arrows) in the right lower and middle lobar pulmonary arteries.
Several decisions among a panel of five senior thoracic radiologists (J.P.K., C.C.W., E.B.T., S.S., and G.S.; average experience, 15 years) were made in developing the annotation schema around specific findings and coordinated with leadership in other similar international parallel efforts. Only opacities and nodules greater than 1 cm were annotated, and clinical judgment as to whether a nodule or mass was infectious was made by the annotating specialist radiologist and annotated as “infectious opacity.” For infectious micronodules and tree-in-bud, a region of interest was added that encompassed the entire region of nodularity rather than as individual nodules. In studies where atelectasis was associated with infectious opacities, atelectasis was annotated as an “infectious opacity.” Alveolar edema was labeled as “other noninfectious opacity.” Lymphadenopathy, regardless of location, was defined as lymph nodes larger than 1 cm short axis. Multiple examination-level labels for type of lung disease were allowed if deemed appropriate to provide a differential diagnosis based on clinical judgment.
Chest radiograph annotation.—Selection of the annotation schema for chest radiographs was based on a study-level scoring system and suggested reporting language developed by subspecialist thoracic radiologists (J.P.K. and C.C.W.) (26). Each chest radiograph was classified as typical, indeterminate, atypical, or negative for findings of COVID-19 pneumonia. In all except the negative cases, the number of regions with abnormal opacities were assessed and classified as showing mild, moderate, or severe disease. As there is subjectivity in this labeling schema, triple annotation was performed, and majority consensus was selected as the final label when at least two of three annotators selected the same classifications. In cases without a majority consensus, final adjudication was performed by one of two experienced subspecialist thoracic radiologists (average experience, 15 years). Annotation was performed using a commercial browser-based application (MD.ai). Annotators were solicited from membership of the Society of Thoracic Radiology and the RSNA, and three (J.S., P.R., and M. Hafez, with 5, 7, and 8 years of experience, respectively) were selected based on their performance on previous chest imaging annotation exercises conducted by these organizations. Each of the three annotators were blinded to each other but were able to work on the data at the same time. Adjudicators (J.P.K. and C.C.W.) were able to view the annotations from the three initial readers.
Data Set Description
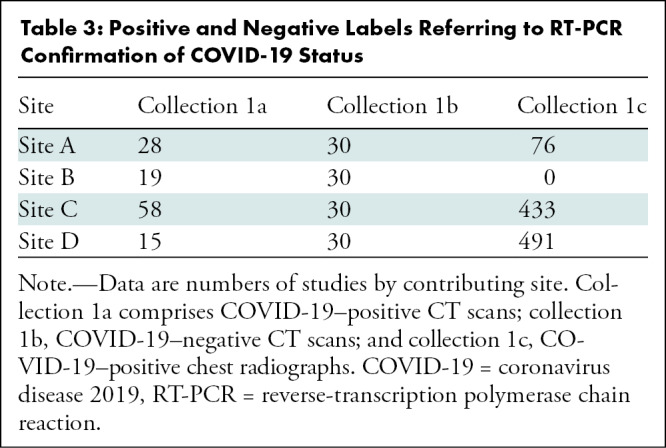
The RICORD data set is composed of 240 thoracic CT scans and 1000 chest radiographs contributed from four international sites (details in Appendix E1 [online]). Care was taken to curate a balanced data set across the contributing sites. Patient demographics collected included sex, age, and COVID-19 testing status and method. Both CT scan and chest radiograph data included multiple studies for some patients, with a higher prevalence of such studies in the chest radiography data set. Date of study was randomized, but intervals between studies for a given patient were maintained. Descriptive statistics and demographics are listed in Tables 2 and 3.
Table 2:
Descriptive Demographic Information for RICORD Studies by Collection
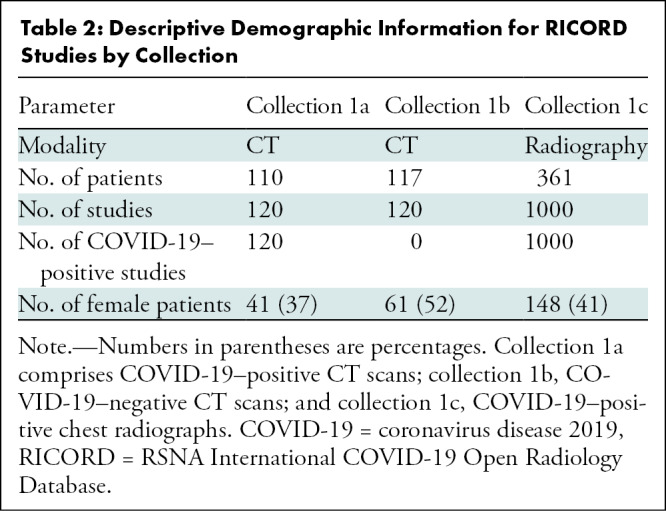
Table 3:
Positive and Negative Labels Referring to RT-PCR Confirmation of COVID-19 Status
Discussion
The RSNA International COVID-19 Open Radiology Database is the largest publicly available expert-annotated data set of chest CT scans and chest radiographs formatted in accordance with the Digital Imaging and Communications in Medicine standard. The data sets were acquired from institutions in four countries, representing diverse patient populations and heterogeneous imaging protocols and vendors. The radiologic examinations were performed for various clinical indications related to coronavirus disease 2019 (COVID-19): to obtain diagnostic criteria for COVID-19, to determine disease severity, or to assess treatment response. Hundreds of hours were spent by volunteer radiologists to compile, curate, and annotate this initial working data set, which is made available through The Cancer Imaging Archive, a service sponsored by the National Institutes of Health that hosts a large archive of medical images accessible for public download.
Because this is a public data set, RICORD is available for noncommercial use (and further enrichment) by research and education communities, which may include the development of educational resources for COVID-19 and use of RICORD to create artificial intelligence systems for diagnosis and quantification, benchmarking performance for existing solutions, exploration of distributed and/or federated learning, further annotation or data augmentation efforts, and evaluation of the examinations for disease entities beyond COVID-19 pneumonia. Deliberate consideration of the detailed annotation schema, demographic characteristics, and other included metadata will be critical when generating cohorts with RICORD, particularly as additional public COVID-19 imaging data sets are made available through complementary and parallel efforts. It is important to emphasize that there are limitations to the clinical ground truth, as severe acute respiratory syndrome coronavirus 2 reverse-transcription polymerase chain reaction tests have widely documented limitations and are subject to both false-negative and false-positive results (1,4), which impacts the distribution of the included imaging data and may have led to an unknown epidemiologic distortion of patients based on the inclusion criteria. These limitations notwithstanding, RICORD has achieved the stated objectives for data complexity, heterogeneity, and high-quality expert annotations as a comprehensive COVID-19 thoracic imaging data resource.
The 240 CT scans and 1000 radiographs represent a subset of images uploaded by the contributing sites. Because of human resource limitations and time constraints, annotation was limited to 120 COVID-19–positive CT scans and 1000 COVID-19–positive chest radiographs. Cases were randomly selected from each site. Additional data from these sites and other contributing sites will be included in subsequent releases. Because making COVID-19–related cases available quickly was a high priority, and because several public chest radiograph data sets providing cases of non–COVID-19 pneumonia and other conditions for differential analysis are already available, only COVID-19–positive chest radiography studies have been published initially. There are plans to supplement these with COVID-19–negative chest radiography cases from contributing sites. Users could also train their model on the 2018 RSNA Pneumonia Challenge data set (27). Finally, the Medical Imaging and Data Resource Center project achieved its target goal of providing 10 000 COVID-19–related studies before the end of 2020.
This initial RSNA International COVID-19 Open Radiology Database (RICORD) data set is the first of a larger coordinated effort called the Medical Imaging and Data Resource Center, which is an open-source medical imaging database and machine learning effort co-led by the RSNA, the American College of Radiology, the American Association of Physicists in Medicine, and the National Institute of Biomedical Imaging and Bioengineering at the National Institutes of Health. The Medical Imaging and Data Resource Center will create a separate platform to collect, annotate, store, and share coronavirus disease 2019–related medical images via open-access Gen3 data commons, beginning with RICORD. Engagement with multiple subspecialty societies to leverage their unique expertise in developing clinical use cases and high-quality annotated data sets is an effective and useful model to follow for future collaborations. This joint effort will allow streamlining and consistency in methods of data collection and provide broader aggregation, better organization, and more convenient access to data for researchers and educators.
APPENDIX
Acknowledgments
Acknowledgments
The authors extend their immense gratitude to the following contributors without whom this work would not have been possible: Chris Carr, RSNA; John Perry, RSNA; Hakan Dogan, MD, Koç University Hospital, Istanbul, Turkey; Hui-Ming Lin, Unity Health Toronto, Toronto, Canada; Hojjat Salehinejad, Unity Health Toronto, Toronto, Canada; Nitamar Abdala, the Federal University of São Paulo (UNIFESP); Henrique Carrete Jr, UNIFESP; Ernandez Santos, UNIFESP; Henrique Souza Alves, UNIFESP; Natalia Dutra Cavalcante, UNIFESP.
E.B.T. and S.S. contributed equally to this work.
Disclosures of Conflicts of Interest: E.B.T. disclosed no relevant relationships. S.S. disclosed no relevant relationships. M.P.L. Activities related to the present article: disclosed no relevant relationships. Activities not related to the present article: received compensation for board membership from Nines Radiology, Segmed, BunkerHill, and Carestream; received compensation from Bayer for consulting work; has stock or stock options in Nines Radiology, Segmed, BunkerHill, and Centaur. Other relationships: disclosed no relevant relationships. M. Hershman disclosed no relevant relationships. L.R. disclosed no relevant relationships. E.C. disclosed no relevant relationships. B.J.E. disclosed no relevant relationships. G.S. Activities related to the present article: disclosed no relevant relationships. Activities not related to the present article: is a board member and consultant for MD.ai (no compensation received to date); has stock or stock options in MD.ai. Other relationships: disclosed no relevant relationships. A.S. disclosed no relevant relationships. J.K.C. Activities related to the present article: institution received a grant from the National Institutes of Health. Activities not related to the present article: institution received or will receive grants from the National Institutes of Health, National Science Foundation, and GE; received reimbursement for travel and meeting expenses from IBM; serves as deputy editor of Radiology: Artificial Intelligence. Other relationships: disclosed no relevant relationships. J.S. disclosed no relevant relationships. M. Hafez disclosed no relevant relationships. S.J. disclosed no relevant relationships. P.R. Activities related to the present article: disclosed no relevant relationships. Activities not related to the present article: receives royalties from Elsevier/Amirsys. Other relationships: disclosed no relevant relationships. B.P.P. disclosed no relevant relationships. J.M. Activities related to the present article: disclosed no relevant relationships. Activities not related to the present article: institution received or will receive grants from GE and Nuance. Other relationships: disclosed no relevant relationships. E.A. disclosed no relevant relationships. E.R.R. disclosed no relevant relationships. F.C.K. Activities related to the present article: disclosed no relevant relationships. Activities not related to the present article: received compensation from MD.ai for consulting; is employed by Diagnósticos da América. Other relationships: disclosed no relevant relationships. L.T. disclosed no relevant relationships. L.M. Activities related to the present article: disclosed no relevant relationships. Activities not related to the present article: received compensation from Lunit and iCAD for board membership; institution received or will receive grant(s) from Siemens; has stock or stock options in Lunit. Other relationships: disclosed no relevant relationships. J.P.K. Activities related to the present article: disclosed no relevant relationships. Activities not related to the present article: received compensation from Parexel International for consulting. Other relationships: disclosed no relevant relationships. C.C.W. Activities related to the present article: disclosed no relevant relationships. Activities not related to the present article: institution received or will receive grants. Other relationships: disclosed no relevant relationships.
Abbreviations:
- COVID-19
- coronavirus disease 2019
- DICOM
- Digital Imaging and Communications in Medicine
- RICORD
- RSNA International COVID-19 Open Radiology Database
- TCIA
- The Cancer Imaging Archive
References
- 1.Wiersinga WJ, Rhodes A, Cheng AC, Peacock SJ, Prescott HC. Pathophysiology, Transmission, Diagnosis, and Treatment of Coronavirus Disease 2019 (COVID-19): A Review. JAMA 2020;324(8):782–793. [DOI] [PubMed] [Google Scholar]
- 2.Nadkarni GN. An ounce of public health for COVID-19? Sci Transl Med 2020;12(541):eabb5675. [Google Scholar]
- 3.Black A, MacCannell DR, Sibley TR, Bedford T. Ten recommendations for supporting open pathogen genomic analysis in public health. Nat Med 2020;26(6):832–841. [DOI] [PMC free article] [PubMed] [Google Scholar]
- 4.Tromberg BJ, Schwetz TA, Pérez-Stable EJ, et al. Rapid Scaling Up of Covid-19 Diagnostic Testing in the United States - The NIH RADx Initiative. N Engl J Med 2020;383(11):1071–1077. [DOI] [PMC free article] [PubMed] [Google Scholar]
- 5.Bernheim A, Mei X, Huang M, et al. Chest CT Findings in Coronavirus Disease-19 (COVID-19): Relationship to Duration of Infection. Radiology 2020;295(3):200463. [DOI] [PMC free article] [PubMed] [Google Scholar]
- 6.Pan F, Ye T, Sun P, et al. Time Course of Lung Changes at Chest CT during Recovery from Coronavirus Disease 2019 (COVID-19). Radiology 2020;295(3):715–721. [DOI] [PMC free article] [PubMed] [Google Scholar]
- 7.Chung M, Bernheim A, Mei X, et al. CT Imaging Features of 2019 Novel Coronavirus (2019-nCoV). Radiology 2020;295(1):202–207. [DOI] [PMC free article] [PubMed] [Google Scholar]
- 8.Mei X, Lee HC, Diao KY, et al. Artificial intelligence-enabled rapid diagnosis of patients with COVID-19. Nat Med 2020;26(8):1224–1228. [DOI] [PMC free article] [PubMed] [Google Scholar]
- 9.Ai T, Yang Z, Hou H, et al. Correlation of Chest CT and RT-PCR Testing for Coronavirus Disease 2019 (COVID-19) in China: A Report of 1014 Cases. Radiology 2020;296(2):E32–E40. [DOI] [PMC free article] [PubMed] [Google Scholar]
- 10.Li L, Qin L, Xu Z, et al. Using Artificial Intelligence to Detect COVID-19 and Community-acquired Pneumonia Based on Pulmonary CT: Evaluation of the Diagnostic Accuracy. Radiology 2020;296(2):E65–E71. [DOI] [PMC free article] [PubMed] [Google Scholar]
- 11.Liu Z, Jin C, Wu CC, et al. Association between Initial Chest CT or Clinical Features and Clinical Course in Patients with Coronavirus Disease 2019 Pneumonia. Korean J Radiol 2020;21(6):736–745. [DOI] [PMC free article] [PubMed] [Google Scholar]
- 12.Rubin GD, Ryerson CJ, Haramati LB, et al. The Role of Chest Imaging in Patient Management during the COVID-19 Pandemic: A Multinational Consensus Statement from the Fleischner Society. Radiology 2020;296(1):172–180. [DOI] [PMC free article] [PubMed] [Google Scholar]
- 13.Wan Y-L, Schoepf UJ, Wu CC, et al. Preparedness and Best Practice in Radiology Department for COVID-19 and Other Future Pandemics of Severe Acute Respiratory Infection. J Thorac Imaging 2020;35(4):239–245. [DOI] [PubMed] [Google Scholar]
- 14.Chen Q, Allot A, Lu Z. Keep up with the latest coronavirus research. Nature 2020;579(7798):193. [DOI] [PubMed] [Google Scholar]
- 15.Wynants L, Van Calster B, Collins GS, et al. Prediction models for diagnosis and prognosis of covid-19 infection: systematic review and critical appraisal. BMJ 2020;369:m1328 [Published correction appears in BMJ 2020;369:m2204.]. [DOI] [PMC free article] [PubMed] [Google Scholar]
- 16.Suchá D, van Hamersvelt RW, van den Hoven AF, de Jong PA, Verkooijen HM. Suboptimal Quality and High Risk of Bias in Diagnostic Test Accuracy Studies on Chest Radiography and Computed Tomography in the Acute Setting of the COVID-19 Pandemic: A Systematic Review. Radiol Cardiothorac Imaging 2020;2(4):e200342. [DOI] [PMC free article] [PubMed] [Google Scholar]
- 17.Cosgriff CV, Ebner DK, Celi LA. Data sharing in the era of COVID-19. Lancet Digit Health 2020;2(5):e224. [DOI] [PMC free article] [PubMed] [Google Scholar]
- 18.Gates B. Responding to Covid-19 - A Once-in-a-Century Pandemic? N Engl J Med 2020;382(18):1677–1679. [DOI] [PubMed] [Google Scholar]
- 19.Flanders AE, et al. Construction of a Machine Learning Dataset through Collaboration: The RSNA 2019 Brain CT Hemorrhage Challenge. Radiol Artif Intell 2020;2(3):e190211. [DOI] [PMC free article] [PubMed] [Google Scholar]
- 20.Halabi SS, Prevedello LM, Kalpathy-Cramer J, et al. The RSNA Pediatric Bone Age Machine Learning Challenge. Radiology 2019;290(2):498–503. [DOI] [PMC free article] [PubMed] [Google Scholar]
- 21.Prevedello LM, et al. Challenges Related to Artificial Intelligence Research in Medical Imaging and the Importance of Image Analysis Competitions. Radiol Artif Intell 2019;1(1):e180031 10.1148/ryai.2019180031. [DOI] [PMC free article] [PubMed] [Google Scholar]
- 22.Prior FW, Clark K, Commean M, et al. TCIA: An information resource to enable open science. In: 2013 35th Annual International Conference of the IEEE Engineering in Medicine and Biology Society (EMBC), Osaka, Japan, July 3–7, 2013. Piscataway, NJ: IEEE, 2013; 1282–1285. [DOI] [PMC free article] [PubMed] [Google Scholar]
- 23.Irvin J, Rajpurkar P, Ko M, et al. CheXpert: A Large Chest Radiograph Dataset with Uncertainty Labels and Expert Comparison. In: Proceedings of the AAAI Conference on Artificial Intelligence 2019;33(1):590–597. [Google Scholar]
- 24.Lin Li, Lixin Qin, Zeguo Xu, et al. Using Artificial Intelligence to Detect COVID-19 and Community-acquired Pneumonia Based on Pulmonary CT: Evaluation of the Diagnostic Accuracy. Radiology 2020;296(2):E65–E71. [DOI] [PMC free article] [PubMed] [Google Scholar]
- 25.Simpson S, Kay FU, Abbara S, et al. Radiological Society of North America Expert Consensus Statement on Reporting Chest CT Findings Related to COVID-19. Endorsed by the Society of Thoracic Radiology, the American College of Radiology, and RSNA - Secondary Publication. J Thorac Imaging 2020;35(4):219–227. [DOI] [PMC free article] [PubMed] [Google Scholar]
- 26.Litmanovich DE, Chung M, Kirkbride RR, Kicska G, Kanne JP. Review of Chest Radiograph Findings of COVID-19 Pneumonia and Suggested Reporting Language. J Thorac Imaging 2020. 10.1097/RTI.0000000000000541. Published online June 9, 2020. [DOI] [PubMed] [Google Scholar]
- 27.Shih G, Wu CC, Halabi SS, et al. Augmenting the National Institutes of Health Chest Radiograph Dataset with Expert Annotations of Possible Pneumonia. Radiol Artif Intell 2019;1(1):e180041. [DOI] [PMC free article] [PubMed] [Google Scholar]
Associated Data
This section collects any data citations, data availability statements, or supplementary materials included in this article.


