Abstract
Background:
Pulmonary artery hypertension (PAH) is a complex disorder that can lead to right heart failure. The generation of caveolin-1 deficient mice (CAV-1−/−) has provided an alternative genetic model to study the mechanisms of pulmonary hypertension. However, the vascular adaptations in these mice have not been characterized.
Objective:
To determine the histological and functional changes in the pulmonary and carotid arteries in CAV-1−/− induced PAH.
Methods:
Pulmonary and carotid arteries of young (4-6 months old) and mature (9-12 months old) CAV-1−/− mice were tested and compared to normal wild type mice.
Results:
Artery stiffness increases in CAV-1−/− mice, especially the circumferential stiffness of the pulmonary arteries. Increases in stiffness were quantified by a decrease in circumferential stretch and transition strain, increases in elastic moduli, and an increase in total strain energy at physiologic strains. Changes in mechanical properties for the pulmonary artery correlated with increased collagen content while carotid artery mechanical properties correlated with decreased elastin content.
Conclusions:
We demonstrated that an increase in artery stiffness is associated with CAV-1 deficiency-induced pulmonary hypertension. These results improve our understanding of artery remodeling in PAH.
Keywords: Pulmonary hypertension, mechanical stiffness, arteries, caveolin-1 deficiency, mice
INTRODUCTION
Pulmonary artery hypertension (PAH) is a complex disorder characterized by a sustained elevation in mean pulmonary artery pressure (MPAP> 25 mm Hg) due to increased pulmonary resistance, ultimately leading to right ventricle hypertrophy and failure [1, 2]. The hypertensive pressure in pulmonary arteries results in artery stiffening which contributes to an increased ventricular after-load and right ventricular hypertrophy [3]. Pulmonary vascular remodeling in PAH is characterized by vessel wall thickening due to hypertrophy and/or hyperplasia of the vascular cells (fibroblasts and smooth muscle cells) and an increased extracellular matrix (ECM, collagen, elastin and fibronectin) [4–6]. Clinical studies have demonstrated that large pulmonary artery (PA) stiffening is a predictor of patient mortality in PAH [7–9]. Therefore, it is important to understand the change in pulmonary artery stiffness in PAH.
A variety of experimental models in both large and small animals have been utilized to elucidate the pathological mechanisms of PAH [10, 11]. The most common models are the chronic hypoxia and the monocrotaline injury rodent models [11–15]. However, the vascular remodeling that results from hypoxia is variable and reversible upon return to ambient conditions [16–18], similar to human who develops PAH at a high altitude but then reversed upon return to low altitudes [19, 20]. These shortcomings may limit the relevancy of hypoxic models to human pathology. The use of transgenic or knockout mice has been proposed as an alternative model in the study of PAH, which includes the CAV-1 deficient mice (CAV-1−/−) model [21, 22]. In patients with severe PAH, CAV-1 expression is decreased in plexiform lesions in lung tissue and in plasma [23, 24]. When compared to the chronic hypoxia models, the CAV-1−/− mouse more closely mimics the irreversible and slow onset phenotype seen in patients [21]. In addition, restoration of CAV-1 activity alone rescues the remodeling phenotype of heart and lung reported in CAV-1−/− mice [25, 26]. However, progressive vascular changes in the CAV-1−/− mouse model have not been characterized.
Accordingly, the objective of this study was to determine the changes in the mechanical properties and their correlation with ECM composition of the pulmonary arteries in the CAV-1−/− mouse model. These results will enhance our understanding of the biomechanical changes in CAV-1−/− mice during the development of PAH and provide baseline for using the CAV-1−/− mice model to assess the effectiveness of new intervenes and therapies.
MATERIALS AND METHODS
Specimen preparation
CAV-1−/− and wild type (WT) C57BL/6J male mice were purchased from Jackson Laboratory at 2 months of age. Mice were kept in our facility until they reach the appropriate age. We studied the pulmonary arteries (PA) and the common carotid arteries (CCA) of these mice at the age of 4-6 months old and 9-12 months old. The use of mice and the protocol were approved by the Institutional Animal Care and Use Committee (IACUC) of the University of Texas Health Science Center at San Antonio and tissue use was approve by the Institutional Biosafety Committee (IBC) of the University of Texas at San Antonio.
Briefly, mice were euthanized by an overdose of potassium chloride injected into the right ventricle, followed by flushing with sodium nitroprusside solution to fully relax the heart and arteries. Intact heart, lungs, and common carotid arteries were then excised and placed in PBS (Dulbecco’s phosphate buffered saline, Sigma Chemical, St. Louis, MO) filled tubes. Main pulmonary arteries (PAs) and common carotid arteries (CCAs) were cleared of surrounding tissue and isolated under a microscope. Left PAs and carotid were used for mechanical testing while right PAs and CCAs were fixed for histology. All testing was completed within 48 hours of initial surgery, which is before the storage time would alter passive mechanical behavior [27].
Artery Mechanical Tests
To determine the passive mechanical properties, PAs and CCAs were tested through pressurized inflation tests [28, 29]. Isolated vessel segments were mounted on stainless steel cannulas in a vessel chamber (Living System Instrumentation (LSI), Burlington, VT) filled with PBS at room temperature. Gravity effect was minimized by using saline for filling while the vessel floats in a saline bath. PAs and CCA were stretched to ~150% and 170% of their free lengths (which are approximately the in vivo axial stretch ratio [30, 31]), respectively, for fixed length inflation test to avoid buckling [16, 28, 32]. They were pressurized through the proximal cannula by a 1 ml syringe while the distal cannula was closed off (Figure 1A). The lumen pressure was measured by a pressure gauge (Ashcroft D1005PS) connected between the syringe and vessel chamber while the vessel deformation was acquired by a camera (Lumenera Infinity 1) through a microscope (Olympus SZ61).
Figure 1.
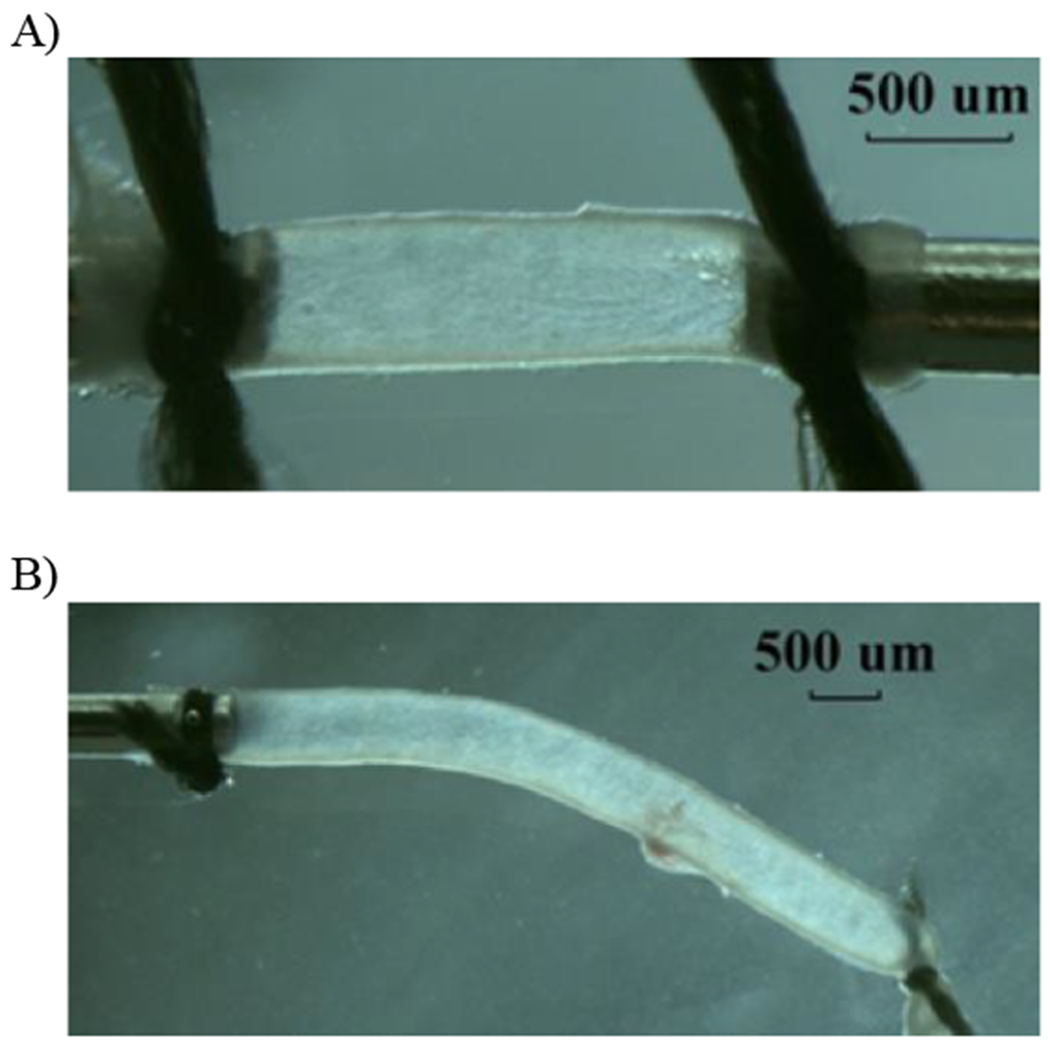
Photographs illustrating a representative pulmonary artery (A: fix-ends test) and a carotid artery (B: free-end test) under lumen pressure.
The specimens were first loaded and unloaded for three to five cycles at approximately 1 mmHg/second for preconditioning to achieve repeatable loading-unloading curves. The loading range for PAs was 0 to 60 mmHg in 5 mmHg steps while CCAs were pressurized to 150 mmHg in 10 mmHg steps. After preconditioning, the final loading curves were recorded and used for stress and strain analysis. Vessel diameter and axial length from suture to suture were measured from the images using Image-Pro Plus® to calculate the strains (no markers were used).
Since the LSI vessel chamber has no capability of measuring axial force in the vessel, we further tested PAs and CCAs using a “free-end inflation test” as previously described [28] to better characterize both circumferential and axial behavior of the vessels. Briefly, arteries were mounted similarly except that one end was tied off and free to move axially when the arteries were being pressurized (Figure 1B). Axial length was measured as the distance between the sutures at both ends. The same preconditioning load and data acquisition procedures were employed as described above for the fix length inflation testing.
Determination of Artery Mechanical Properties
The pressure-diameter and pressure-axial length relationships were plotted to illustrate the mechanical behavior (vessel compliance) of the PA and CCA. The data were further normalized to characterize the mechanical properties of the wall material by determining the stress-strain relationship [29, 33]. To this end, the initial inner radius Ri and wall thickness T were measured at a pressure of 2 mmHg [34] and used as reference dimension to calculate deformed inner radius ri and wall thickness t for entire pressure range assuming incompressibility of the wall:
| (1) |
| (2) |
Where subscript e and i define the outer and inner radii, R and L are the initial radius and length, and r and l are the deformed radius and length, respectively.
The non-dimensional circumferential and axial stretch ratios were determined as the ratio of the deformed dimensions to the initial dimensions:
| (3) |
Note that λz is constant under all pressures in the fix-end testing, but it changes with increasing pressure in the free-end testing. The corresponding Green strains are
| (4) |
Using the data obtained in free-end tests, the mean circumferential and axial Cauchy stresses were determined based on the Laplace’s law:
| (5) |
where P is the applied transmural pressure.
The stress-strain relationships of the arteries are nonlinear, and relatively linear at low strains, but becomes increasingly nonlinear at larger strains, due to increased collagen fiber engagement. The strain at which collagen fiber engagement begins, as indicated by an increased curvature of the stress-strain graph, is known as the transition strain [14, 35]. To calculate the transition strain, linear best fit trend lines were drawn at the low and high strain regions of the stress-strain curves. The strain at which the two trend lines intersect was taken as the transition strain. Accordingly, elastic moduli at low and high strain ranges (Elow and Ehigh) were determined to describe the material properties of the nonlinear arterial wall following the approach used by the Chesler group in studies of the PA of hypoxia mice [14–16]. These two moduli reflect the stiffness of the artery in deformation ranges dominated by elastin and collagen contributions, respectively. Since the change in stretch ratio (and strain) in vivo under lumen pressures is largely in the circumferential direction [15, 36] and the circumferential modulus is of more clinical interest, we focused on the Elow and Ehigh for the circumferential deformation. From inspection of the circumferential stress-strain curve, we determined a low Elow and high Ehigh strain modulus at Green strains of 0.4 and 0.8 for the PA and 0.25 and 0.5 for the CCA, respectively.
In addition, the stress strain relations of the PA and CCA were also described in a two-dimensional fashion using Fung’s exponential strain energy function as previously described [33,37]
| (6) |
where b0, b1, b2, and b4 are unknown material constants. Accordingly, the Cauchy stresses are given by
| (7a) |
| (7b) |
Material constants were obtained by performing a nonlinear regression least-squares algorithm in MATLAB [33]. Material constants were constrained by an upper bound of 500 and a lower bound of .001 to ensure stability. Additionally, convexity was satisfied by restricting [38, 39]. An iterative optimization, minimizing the difference between experimentally and theoretically calculated stresses, was achieved by minimizing the error.
| (8) |
Where m is the number of data points, subscript exp represents the experimental mean stresses defined by Equation (5), and subscript t represents the theoretical stresses determined by Equations (7) [28, 29].
Histology
After mechanical testing, arteries were fixed, processed and paraffin-embedded. Five-micrometer thick sections were stained using picrosirius red (PSR) to quantify collagen deposition, Verhoeff Van Geisen (VVG) to quantify elastin, and hematoxylin and eosin (HE) for wall thickness measurements (Figure 2). The area positive for elastin or collagen was identified by image thresholding in ImageJ and compared to total tissue area to obtain percent protein contents (collagen and elastin content densities) in the artery wall. In addition, collagen and elastin thickness were computed as the percent protein multiplied by the average wall thickness for each vessel to represent the total protein amount.
Figure 2.
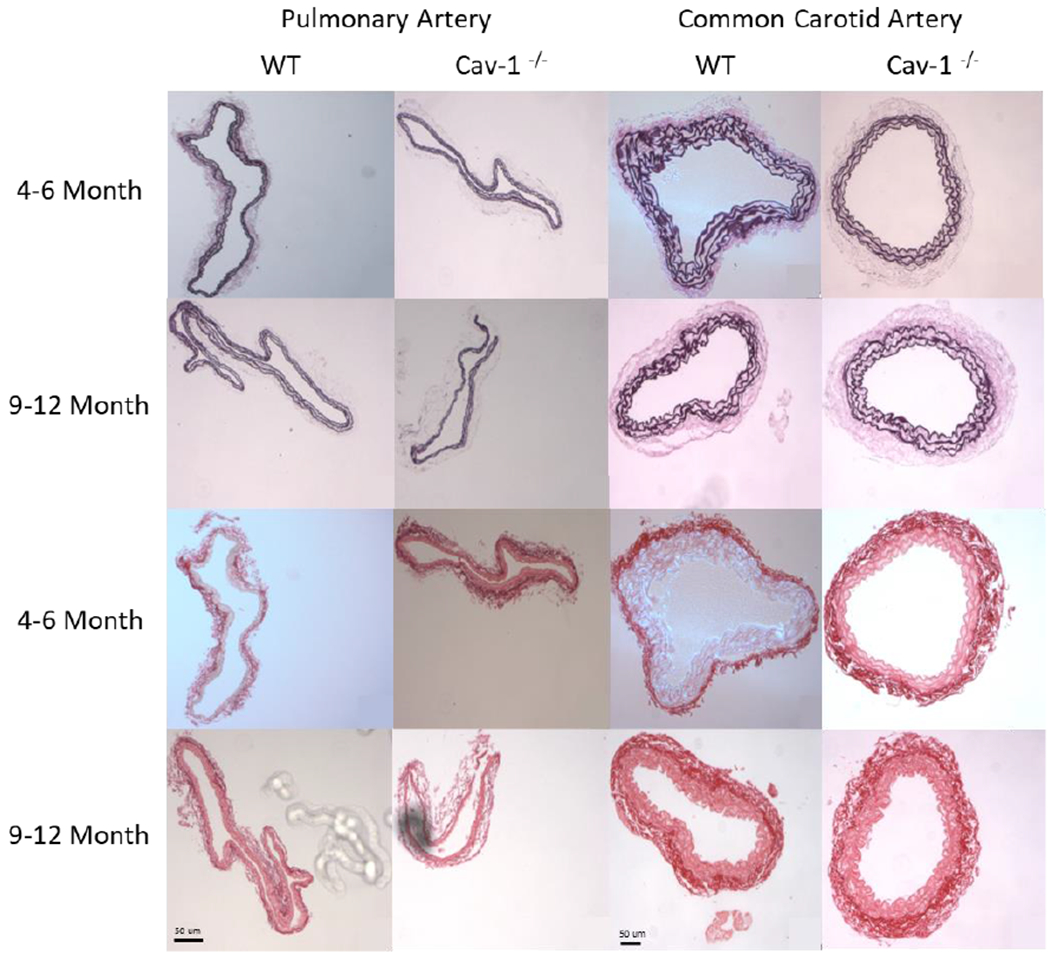
Representative PAs and CCAs for 4-6 and 9-12 month groups stained with Verhoff Van Geisen (VVG, top two rows) and picro-sirius red (SR, bottom two rows). Collagen appears red with SR while elastin is stained black with VVG. Scale bar is 50μm for all images.
Furthermore, in order to find the relationship between mechanical properties and structural components, vessel specific correlations were made between mechanical properties and collagen and elastin contents. Specifically, circumferential Ehigh and transition strain were plotted against collagen content while Elow and transition strain were plotted against elastin content, since the circumferential direction is the dominating direction for fiber alignment in arteries [40, 41].
Statistical Analysis
All results are presented as mean ± standard deviation. Comparisons between strains for calculated mechanical properties were made by analysis of variance (ANOVA) with Tukey’s multiple comparisons. Correlations for mechanical properties and collagen and elastin contents were determined using Spearman’s rank correlation coefficient (ρ) and its associated p-value. All statistical analyses were done using JMP 9 with p<0.05 being considered significant for all results.
RESULTS
Changes in artery mechanical properties
Average unloaded outer diameter and wall thickness values along with biaxial stretch ratios computed at mean arterial pressures for PAs and CCAs are listed in Table 1. There are slight decreases in the stretch ratios at mean arterial pressure in the CAV-1−/− group but the difference was statistically insignificant.
Table 1:
Unloaded outer diameter and wall thickness along with circumferential (λθ) and axial (λz) stretch at mean arterial pressure (WT; PA: 20mmHg CCA: 100mmHg CAV-1−/− PA: 25mmHg CCA: 120mmHg, these pressure value was determined based on our measurement and reports in the literature [21, 26]). 4-6 months groups. Values are ± SD; N=6-7 per group.
| Group | Outer Diameter (μm) | Wall Thickness (μm) | λθ | λz | |
|---|---|---|---|---|---|
| PA | WT | 585.4 ± 52.5 | 26.4 ± 5.6 | 1.66 ± .07 | 1.37 ± .09 |
| Cav-1 −/− | 552.2 ± 41.4 | 25.9 ± 4.9 | 1.55 ± .14 | 1.32 ± .08 | |
| CCA | WT | 400.9 ± 27.7 | 51.5 ± 4.7 | 1.62 ± .04 | 1.42 ± .02 |
| Cav-1−/− | 424.8 ± 43.9 | 45.7 ± 6.5 | 1.46 ± .05 | 1.38 ±. 05 | |
All PAs demonstrated nonlinear behavior as stretch ratios increase with increasing pressure (Figures 3 & 4). At any given pressure (at fixed length or free axial inflation), the circumferential stretch ratio in the PAs of the CAV-1−/− groups are smaller than that of the WT groups, suggesting that the PAs in the CAV-1−/− groups are stiffer than the PAs in the WT groups. This trend is similar in both the 4 - 6 and 9–12 months groups (Figure 3A). Thus, we focused on the 4 – 6 months groups below. Comparing the circumferential and axial stretch ratio versus pressure curves for young CAV-1−/− and WT PAs indicated that the CAV-1−/− groups have higher wall stiffness compared to the WT groups under the same pressures (Figure 4A). While the downward shifting of the circumferential curve (reduction in stretch ratio) was statistically significant, the shifting is moderate in the axial direction primarily in the lower pressure range (10-30 mmHg). In addition, PAs under fix-end testing demonstrated a decreased circumferential stretch ratio, beginning at 10 mmHg, for CAV-1−/− mice compared WT. At 25 mmHg CAV-1−/− PAs had a 12.6% decrease in circumferential stretch compared to WT and an 11.5% decrease at the highest pressure (p<0.05) (data not shown). On the other hand, the free end tests showed that CCAs of CAV-1−/− group were stiffer than the WT in both circumferential and axial directions for the entire tested pressure range (Figure 4B).
Figure 3.
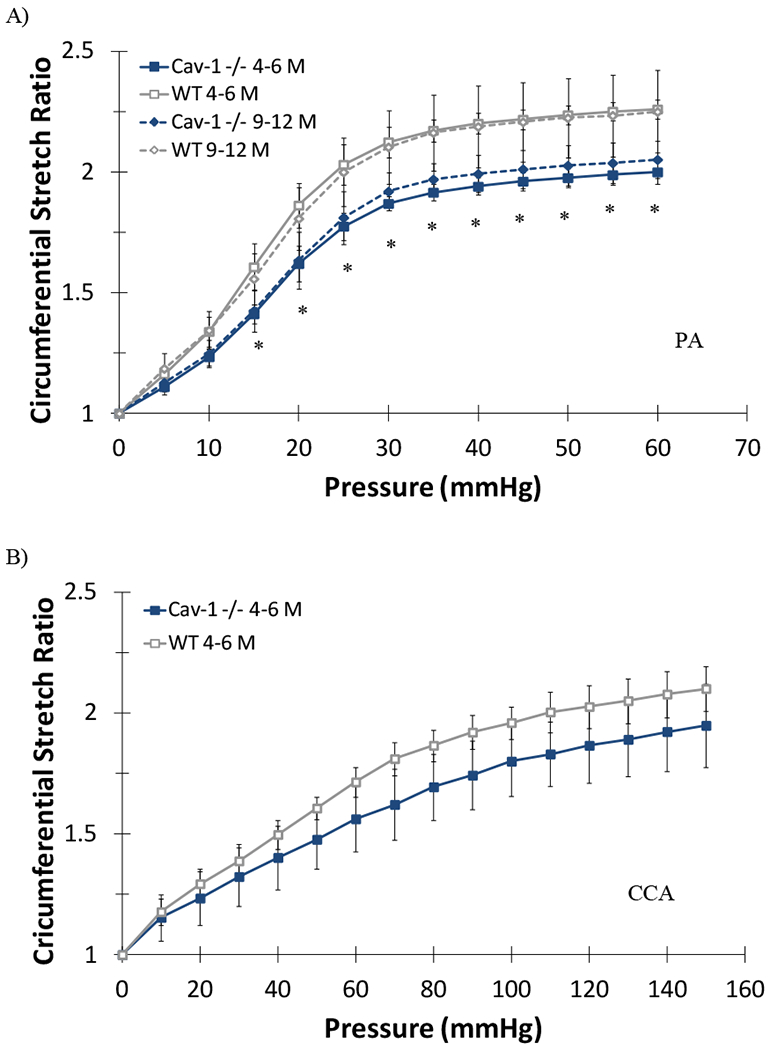
Circumferential stretch ratios plotted as functions of lumen pressure for the 4-6 and 9-12 months CAV-1−/− and WT mice PAs (A) and CCAs (B) tested at fixed length. (*) indicate P<.05 for age matched CAV-1−/− compared to WT. Values are mean ± SD; N=6-7 per group for PAs, N=4-5 per group for CCAs. Data for the 9-12 months group CCAs were not available.
Figure 4.
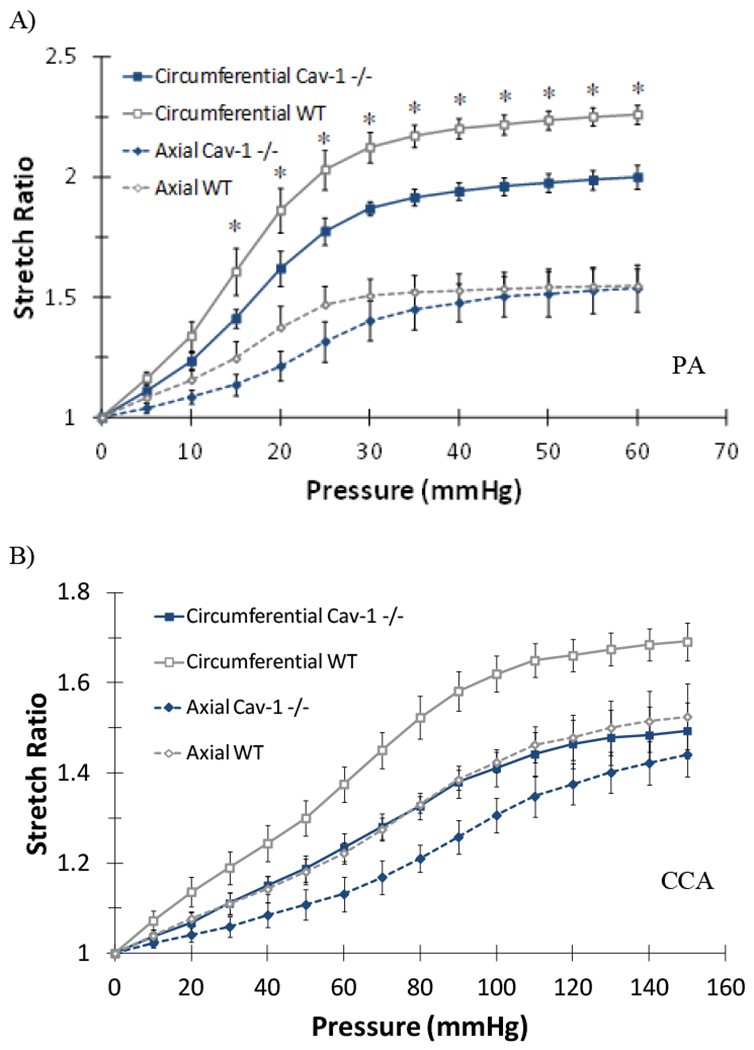
Comparison of pulmonary arteries (PA, A) and common carotid arteries (CCA, B) circumferential and axial stretch ratios plotted as function of lumen pressure of CAV-1−/− and WT 4-6 months groups. Free-end testing. Values are mean ± SD; N=6-7 for PAs and 4-5 for CCAs. For PAs (*) indicate P<.05. For CCAs differences were significant (P<.05) for entire pressure range tested.
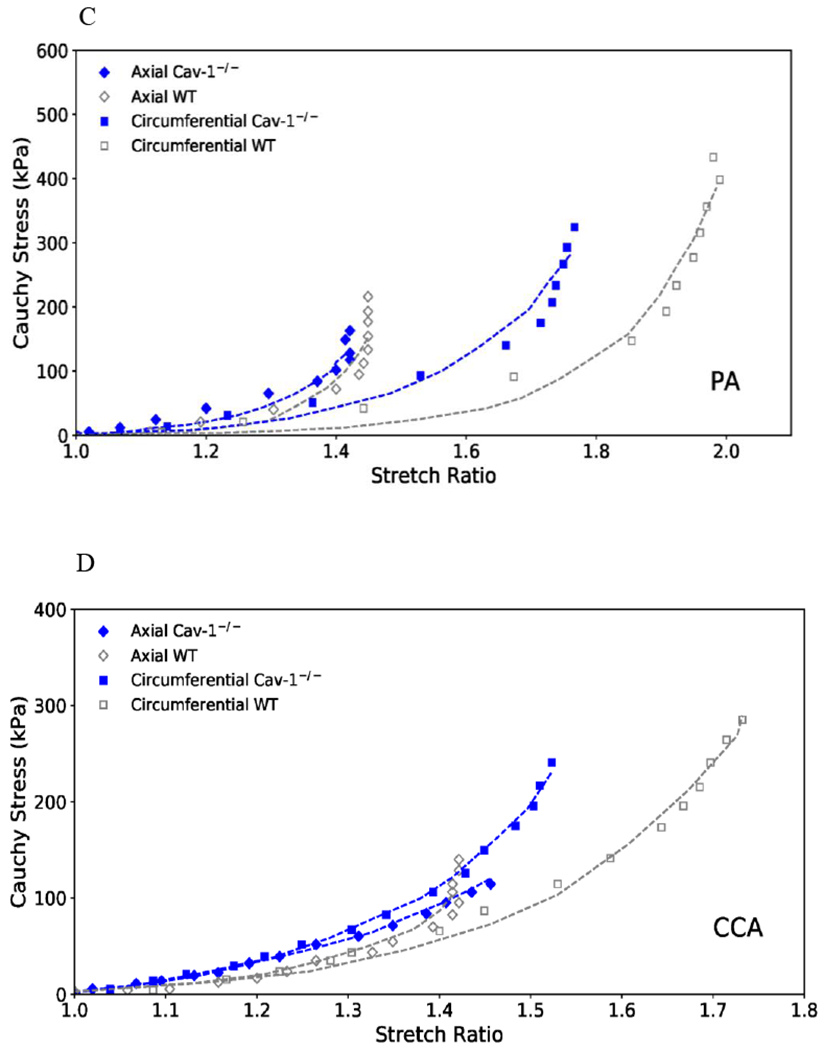
The stress-strain curves for the PAs and CCAs are illustrated in Figure 5. It is seen that the circumferential curves for both the PA and CCA of CAV-1−/− group shifted leftward as compared to the WT group, indicating stiffening of the arteries (Figure 5 A&B). Meanwhile, axial stress-strain curves of both PA and CCA of the CAV-1−/− group showed little differences from WT group. Comparison of representative stress-strain curves obtained from experimental and theoretical results using Fung strain energy are illustrated in Figure 5C and 5D, respectively. The corresponding PA and CCA material constants for individual arteries obtained for the Fung two-dimensional strain energy equation are presented in Table 2. CAV-1−/− arteries tended to have higher values of b0 compared to WT for both the PA and CCA.
Figure 5.
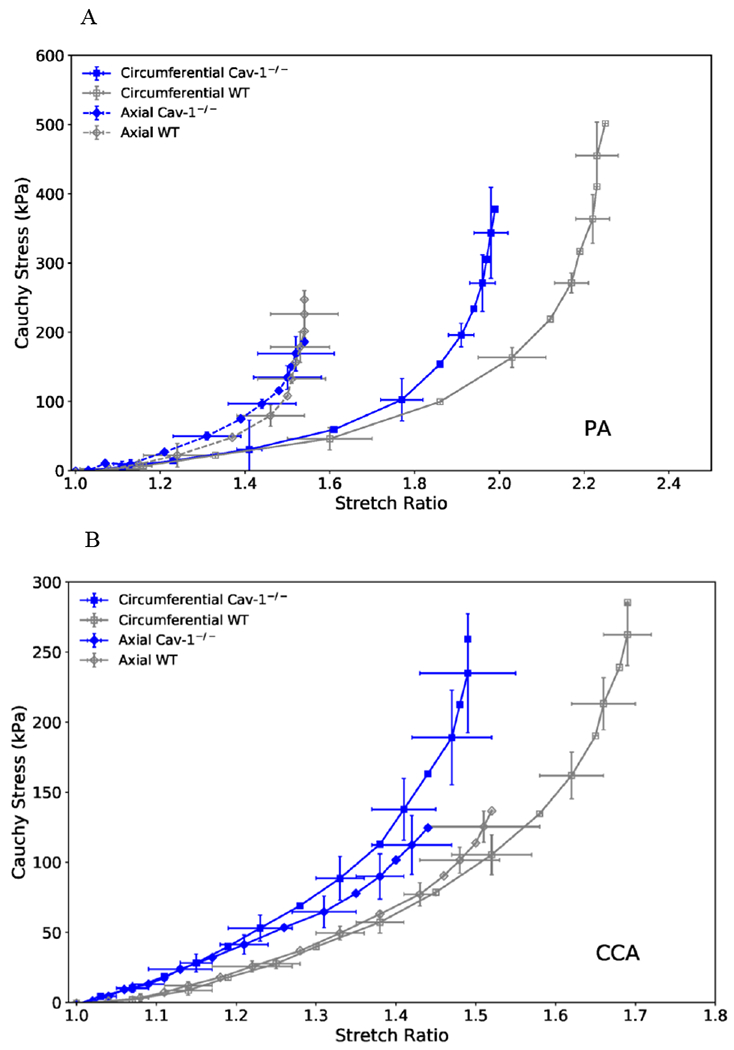
(A& B): Circumferential (squares) and axial (diamonds) stress plotted as functions of stretch ratio for CAV-1−/− and WT PAs (A) and CCAs (B) of the 4-6 months groups. Free-end testing. Values are mean ± SD; N=6-7 per group. SD is only shown at every other point for clarity.
(C & D): Representative circumferential (square) and axial (diamond) stress-strain relationships of CAV-1−/− (solid blue) and WT (hollow gray) PAs (C) and CCAs (D) of the 4-6 months groups, plotting along with predicted values determined from the Fung two-dimensional strain energy equation (dotted curves). The circumferential curves of CAV-1−/− vessels demonstrated a leftward shift from the WT, indicating increased PA stiffness.
Table 2:
PA and CCA best-fit two-dimensional material constants from the Fung strain energy equation for WT and CAV-1−/− groups. 4-6 months groups.
| Pulmonary Artery | ||||||||||
|---|---|---|---|---|---|---|---|---|---|---|
| WT (ID) | b0 (kPa) | b1 | b2 | b4 | Cav-1 −/− (ID) | b0 (kPa) | b1 | b2 | b4 | |
| 1 | 24.19 | 0.62 | 1.12 | 0.02 | 1 | 102.05 | 0.45 | 0.48 | 0.05 | |
| 2 | 110.53 | 0.33 | 0.43 | 0.01 | 2 | 131.58 | 0.39 | 0.37 | 0.05 | |
| 3 | 55.41 | 0.33 | 0.69 | 0.01 | 3 | 55.31 | 0.72 | 0.36 | 0.06 | |
| 4 | 11.66 | 0.54 | 0.69 | 0.11 | 4 | 74.59 | 0.49 | 0.63 | 0.08 | |
| 5 | 8.02 | 0.65 | 1.20 | 0.07 | 5 | 42.60 | 0.42 | 0.71 | 0.05 | |
| 6 | 18.05 | 0.50 | 0.61 | 0.32 | 6 | 109.17 | 0.43 | 0.58 | 0.05 | |
| 7 | 23.98 | 0.39 | 1.21 | 0.04 | ||||||
| Common Carotid Artery | ||||||||||
| WT (ID) | b0 (kPa) | b1 | b2 | b4 | Cav-1 −/− (ID) | b0 (kPa) | b1 | b2 | b4 | |
| 1 | 124.07 | 0.47 | 0.26 | 0.05 | 1 | 102.05 | 0.45 | 0.48 | 0.05 | |
| 2 | 65.93 | 0.65 | 0.47 | 0.04 | 2 | 131.58 | 0.39 | 0.37 | 0.05 | |
| 3 | 83.95 | 0.54 | 0.63 | 0.02 | 3 | 55.31 | 0.72 | 0.36 | 0.06 | |
| 4 | 149.86 | 0.25 | 0.10 | 0.15 | 4 | 74.59 | 0.49 | 0.63 | 0.08 | |
| 5 | 60.13 | 0.61 | 0.68 | 0.02 | 5 | 42.60 | 0.42 | 0.71 | 0.05 | |
| 6 | 141.88 | 0.42 | 0.24 | 0.11 | 6 | 109.17 | 0.43 | 0.58 | 0.05 | |
The transition strain from the circumferential stress-strain curve was calculated to determine whether artery stiffening influenced the strain of collagen fiber engagement. Our results showed that the transition strain of both PA and CCA of CAV-1−/− group are significantly lower than the corresponding values of the WT group (Figure 6, p<0.05). The CAV-1−/−ΡΑ had a 28% decrease in transition strain compared to WT, while the CAV-1−/− CCA had a 37% decrease in transition strain of compared to WT. Decreases in transition strain suggest hypertension results in collagen fiber engagement at lower strains and an increased mechanical load on collagen fibers.
Figure 6.
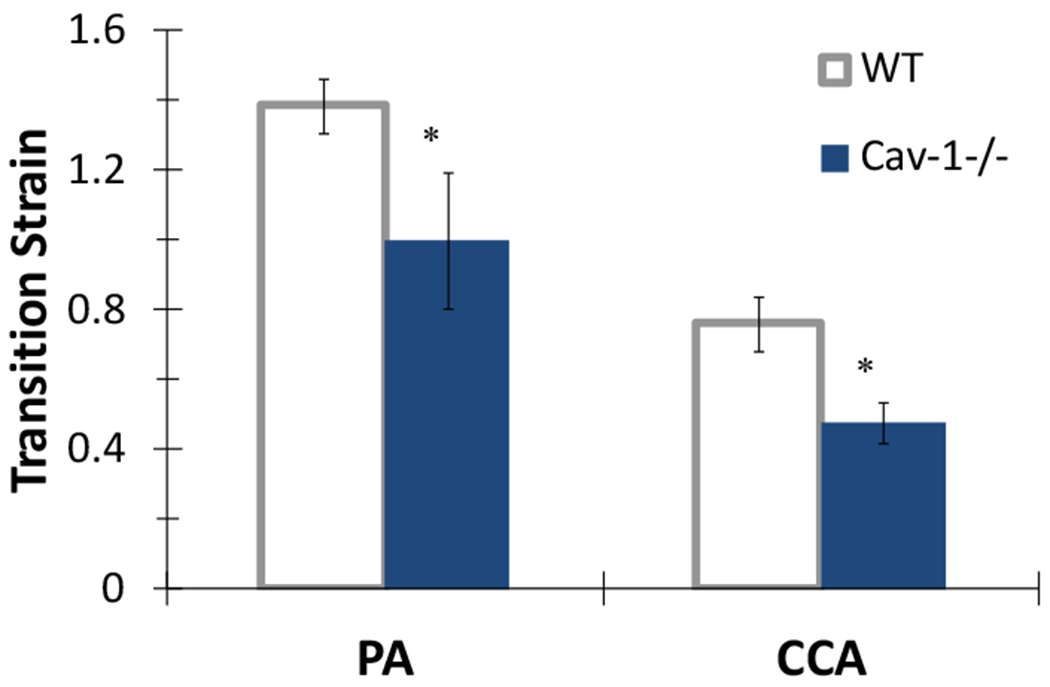
PA and CCA transition strains obtained from circumferential stress-strain curves for 4-6 month CAV-1−/− and WT 4-6 months groups. (*) p<.05 CAV-1−/− vs. WT. Free-end testing. Values are ± SD; N=6-7 per group.
In addition, significant changes in Elow and Ehigh were observed between CAV-1−/− and WT groups for both PAs and CCAs (Table 3). No statistical difference was seen in the Elow and Ehigh in the axial direction between CAV-1−/− and WT groups for both PAs and CCAs.
Table 3:
Elastic moduli obtained from the circumferential and axial stress-strain curves at fixed strain values.
| Group | Elow (kPa) | Ehigh (kPa) | |
|---|---|---|---|
| PA | Circumferential WT | 115 ± 31 | 166 ± 34 |
| Circumferential CAV-1−/− | 154 ± 23* | 271 ± 76* | |
| Axial WT | 76 ± 31 | 184 ± 163 | |
| Axial CAV-1−/− | 116 ± 33 | 363 ± 122 | |
| CCA | Circumferential WT | 151 ± 23 | 209 ± 49 |
| Circumferential CAV-1−/− | 245 ± 64* | 651 ± 265* | |
| Axial WT | 126 ± 54 | 286 ± 133 | |
| Axial CAV-1−/− | 185 ± 48 | 381 ± 136 | |
p<.05 for CAV-1−/− vs. WT. 4-6 months groups. Values are ± SD; N=6-7 per group
Stored strain energy at working load was also calculated to further compare the nonlinear behavior of the arteries, since it has been shown recently that the strain energy simplifies the comparisons of mechanical properties for a highly nonlinear model [38]. The strain energy was calculated at biaxial strains generated by the normotensive (NT) pressures for arteries in WT mice or generated by both normotensive (NT) and hypertensive (HT) pressures in CAV-1−/− mice according to the values given in Table 1. CAV-1−/− PAs and CCAs demonstrated a significant increase in strain energy when evaluated at normotensive strains (Figure 7). Interestingly, when evaluated at in vivo hypertensive strains CAV-1−/− arteries stored about the same amount of strain energy as WT arteries. This finding is in part the result of the decreased biaxial strains experienced by CAV-1−/− arteries in vivo compared to WT. Taken together, these results demonstrated that CAV-1−/− arteries are stiffer at higher strains but they deformed with approximately the same amount of energy under in vivo conditions.
Figure 7.
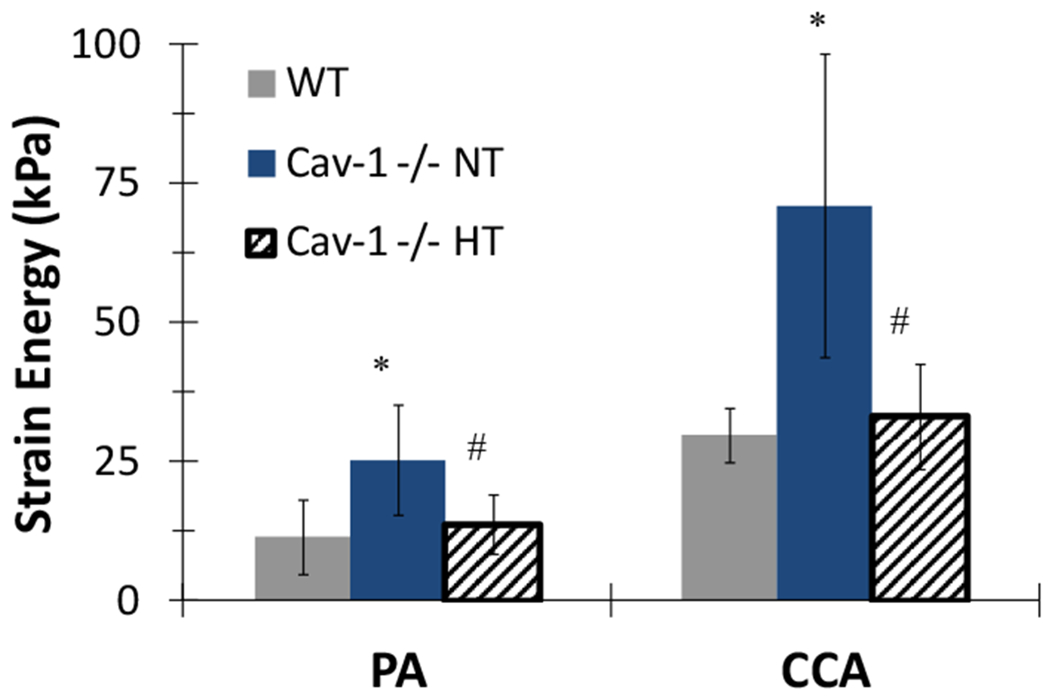
Total strain energy in PAs and CCAs in CAV-1−/− and WT mice. Strain energy was evaluated at strains generated at both normotensive (NT) and hypertensive (FIT) pressures for CAV-1−/− mice, but was only for normotensive (NT) pressure for WT mice (see Table 1). Free-end testing. (*) p<.05 for CAV-1−/− NT vs. WT (#) p<.05 for CAV-1−/− HT vs. CAV-1−/− NT. Values are ± SD; N = 6-7 per group.
Histology and Mechanical-Structural Correlations
Collagen and elastin contents in PAs of CAV-1−/− significantly increased compared to in PAs of WT (Figure 8). Collagen content in CCAs demonstrated no difference between CAV-1−/− and WT while elastin content in CCA significantly decreased in CAV-1−/− group compared to WT. Interestingly, the collagen to elastin ratio in PA slightly reduced from 1.8 in WT to 1.36 in CAV-1−/− mice but the ratio in CCA was increased from 0.85 in WT to 1.57 in CAV-1−/−.
Figure 8.
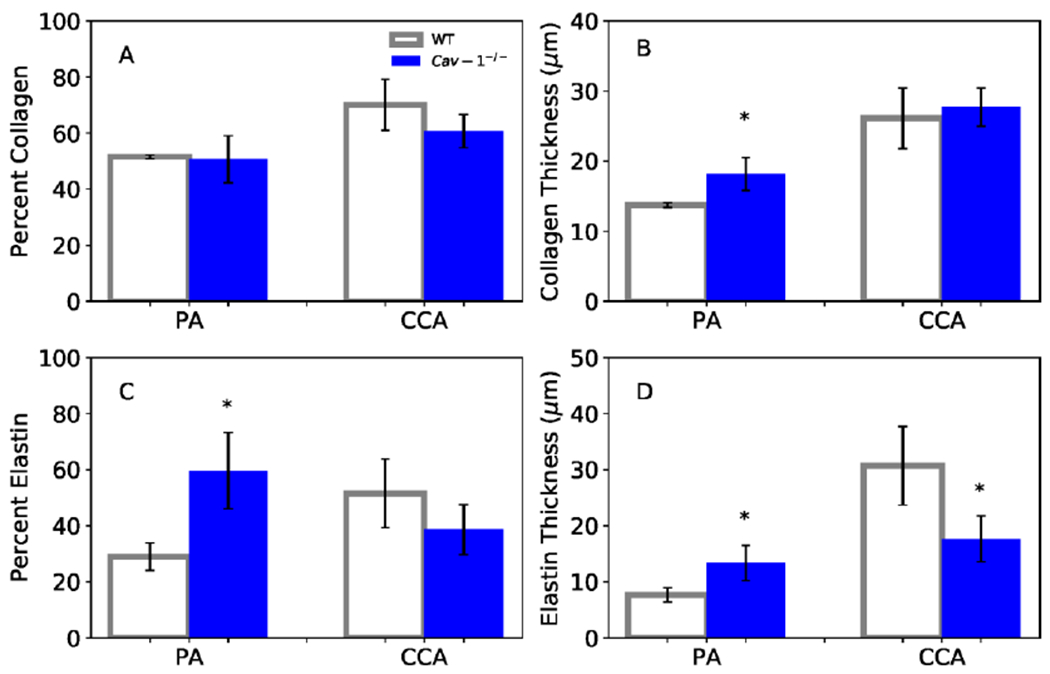
Collagen and elastin contents (A & C: area ratios; B & D: total amount) for PAs and CCAs at 4-6 months. (*) p<.05 for CAV-1−/− compared to WT. Values are ± SD; N = 5-6 per group.
To evaluate hypothesized structural-functional relationships, vessel-specific correlations were performed between mechanical properties and collagen and elastin contents (Figure 9). Linear regression analysis for PAs showed that collagen content had a significant positive correlation with Ehigh (ρ =0.75) and a significant negative correlation with transition strain (ρ = −0.63). Elastin content had no correlation with Elow (ρ = 0.17) and a moderate, although not significant, negative correlation with transition strain (ρ = −0.65). CCAs showed weaker correlation overall compared to PA. There is no correlation for collagen content to either Ehigh (ρ = 0.42) or transition strain (ρ = −0.55). In contrast, elastin content had a significant negative correlation with Elow (ρ = −0.82) and a significant positive correlation with transition strain (ρ = 0.68).
Figure 9.
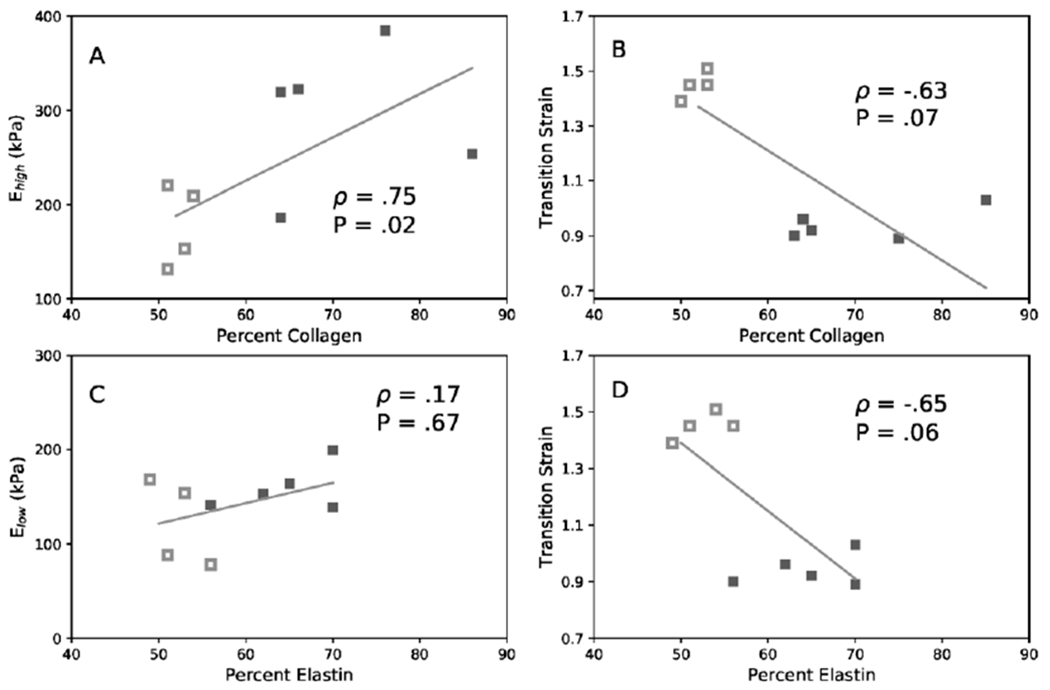
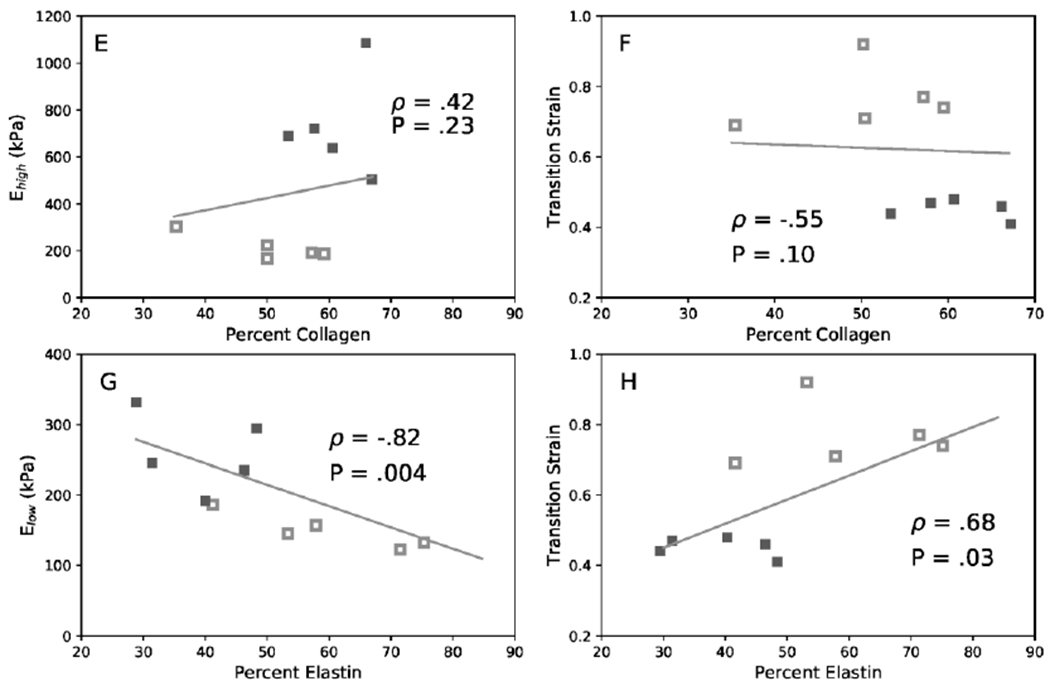
Linear correlations among collagen content, elastin content, moduli Ehigh, and Elow. of PA (A, B, C, D) and CCA (E, F, G, H). (A & E) Ehigh versus collagen content, (B & F) transition strain versus collagen content, (C & G) Elow versus elastin content, and (D & H) transition strain versus elastin content. Data include both CAV-1−/− (filled) and WT (hollow) groups. Correlation is given by Spearman’s coefficient (ρ) and associated P value when significant. 4-6 months groups.
DISCUSSION
The mechanical behavior and wall remodeling of the pulmonary and carotid arteries of the caveolin-1 deficiency mice were evaluated in this study. Our results showed that the stiffness of the pulmonary and carotid arteries of CAV-1−/− mice increased comparing to the wild type controls, as indicated by the increase in modulus in low and high strain ranges, the increase in total strain energy, the decrease in transition strain, and the shift of the pressure versus stretch ratio curve and the stress versus strain curves. The increase in stiffness is associated with increased collagen contents in the pulmonary arteries.
In this study, we focused on the passive properties of the arterial wall to understand its remodeling as the decrease in active contractile function of CAV-1−/− mice has been documented [42–45]. Our results are consistent with previous studies that showed decreased lung compliance and PA remodeling in CAV-1−/− mice around 4 months [22]. While there have been a rich set of data documenting the changes in arteries as a result of hypertension, here we have offered the first mechanical analysis of the pulmonary and carotid arteries for CAV-1 deficiency-induced hypertension. The material constants we have obtained for the Fung two-dimensional strain-energy equation will be useful for modeling hypertensive artery behavior in advanced computational analysis.
Our results are consistent with many data reported in the literature. We did not observed any difference in body weight between CAV-1−/− and the WT mice which is consistent with previous reports [21, 43]. We showed that PAs and CCAs from CAV-1−/− mice both demonstrated a leftward shift in their circumferential stress-strain curves indicating increased stiffness. This shift is consistent with previous results of PAs in hypoxia-induced PAH [15, 16, 46] and of CCA in aortic banding-induced hypertension [31], respectively. The decrease in circumferential stretch in PAs for the CAV-1−/− compared to WT (12.6% decrease at 25 mmHg) is similar to the level (11.7% decrease) reported in hypoxia-induced PAH [46]. The decrease in circumferential stretch in CCAs (12.9% decrease at 100 mmHg) is similar to the level (11% decrease) reported in hypertensive mice [31]. However, we found very little change in axial stiffness in PA between CAV-1−/− and WT, which is different from PA in canine model of chronic thromboembolic PAH [47]. In addition, PAs and CCAs in CAV-1−/− mice demonstrated significant decreases in transition strain compared to WT, though the 28% decrease in PA transition strain was smaller than the 55% decrease reported in hypoxia [14], A decrease in transition strain suggests collagen fiber engagement at lower strains and an increased mechanical load on collagen fibers. Furthermore, CAV-1−/− mice demonstrated increases in elastic moduli Elow and Ehigh in both the PA and CCA. This trend is also consistent with previous report for hypoxia-induced PAH [15, 46], While it was expected that significant changes would be found in Ehigh since elastin is relatively stable and artery stiffening in hypertension is commonly attributed to increases in collagen content [14], increases in Elow attributed to increased elastin stiffness have also been demonstrated in PA in hypoxic calves [35].
For PAs, our results demonstrated strong correlations between Ehigh and transition strain with collagen content but less strong correlations between Elow and transition strain with elastin content. This is in agreement with previous studies that have attributed PA stiffening to collagen accumulation with elastin having little or no impact in hypoxia-induced PAH [14, 46], While both collagen and elastin contents increased significantly, the collagen to elastin ratio slightly decreased. In most animal models of hypertension, elastin expression is only minimally increased compared to collagen resulting in an increase in collagen to elastin ratio. However, it has been reported that increases in elastin content may occur without proper assembly of elastin fibers [48], The incomplete assembly of elastin fibers could be a possible explanation for the decreased transition strain and weaker correlation between elastin and modulus Elow.
For CCA, however, the correlations between Ehigh and transition strain with collagen content are generally weak but the correlations between Elow and transition strain with elastin content are stronger. The elastin content in CCA decreased significantly in CAV-1−/− mice (though the decrease was insignificant in terms of density percentage) while the collagen content slightly increased, thus the collagen to elastin ratio increased. The underlying mechanism is unclear and needs further study. Decrease in transition strain has been shown to correlate well with decrease in collagen to elastin ratio either through increased collagen deposition or increased elastin fragmentation in hypoxia-induced PAH [14], Similarly, the transition strain decreased with elastin degradation in elastase treated carotid arteries [49], The negative correlation between elastin content and Elow is in agreement with previous studies on systemic hypertension which have shown artery stiffness to be inversely related to elastin content [31,50].
Generally, the elastic modulus at low and high strains, Elow and Ehigh, reflect the behavior of elastin and collagen, respectively. Both elastin and collagen total contents as well as their ratio affect the arterial wall stiffness, and the effects are stronger in the circumferential direction than in the axial direction due to fiber alignment [15, 16, 28, 51, 52], In addition, the mechanical stiffness of the arterial wall could have been affected by changes in collagen orientation [40, 41, 53] and cross-linking [14] that need to be investigated in future studies. Furthermore, the amount of smooth muscle cells in the media, which was not measured in this study, could affect the wall stiffness and needs further study.
Previous reports have shown that CAV-1−/− mice have elevated pulmonary pressure but not necessarily the systemic pressure. In fact, more reports showed unchanged systemic pressure rather than an elevated pressure [54, 55]. This difference in pressure change may be the reason that PA and CCA demonstrated some difference in the extracellular matrix remodeling.
There are a few limitations in this study. First, the mechanical property calculations were made under the assumption that vessels were thin, incompressible, and homogenous cylindrical tubes. The arterial wall of the PA can be considered thin enough that circumferential stress variation across the wall are negligible, but this may not be the case for the CCA. Secondly, we ignored the residual stress in the vessels and used the unloaded state as reference state. Our preliminary data showed no difference in the zero-stress state of PAs and CCAs of the CAV-1−/− and WT mice [29]. So, it is expected that the effects of these factors are small [56]. Third, the same axial stretch ratios were used in the fix-length mechanical testing for arteries from CAV-1−/− and WT. While it is possible that CAV-1 deficiency may affect the in vivo axial stretch ratio, measurement has shown no difference between the in vivo axial stretch ratio in PA of normal and hypoxic rats [57]. In addition, even though we did not report data of arterial pressure, the PA hypertension has been well documented in CAV-1−/− mice [21, 26]. Further studies are needed to measure other parameters such as ventricle mass and size, ejection fraction, and cardiac index, which would provide insight into ventricle function and its relationship to artery stiffness.
In conclusion, we have demonstrated the changes in pulmonary arterial wall structure and mechanical properties in PAH in CAV-1−/− mice. We conclude that substantial stiffening of artery wall resulting from hypertensive artery pressures occurred in CAV-1−/− mice of 4-6 months and 9-12 months of age. Changes in material properties of CAV-1−/− pulmonary and carotid arteries included a decrease in transition strain, increases in elastic moduli and total strain energy when evaluated at normal biaxial strains. Some changes in PA and CCA mechanical properties are correlated with collagen and elastin contents. These correlations are consistent with previous studies on the effects of hypertensive pressures on proximal arteries in the pulmonary and systemic circulation. These results provide the first insight into the mechanical and structural changes in the vasculature as a result of CAV-1 deficiency-induced pulmonary hypertension. These results improve our understanding of artery remodeling and the process for the development of ventricular failure in PAH.
ACKNOWLEDGMENTS
This work was partially supported by the National Institutes of Health HL095852 (HCH), NHLBI HHSN 268201000036C (N01-HV-00244) for the UTHSCSA Cardiovascular Proteomics Center, and the Janey Briscoe Center of Excellence in Cardiovascular Research (CJLS).
Footnotes
Compliance with Ethical Standards
All authors have not conflict of interest. This study did not involve any human subject and the use of lab animal followed a protocol which minimized the use of animal and fully considered the welfare of the animal was approved by IACUC.
LITERATURE
- 1.Dodson MW, Brown LM, and Elliott CG, Pulmonary Arterial Hypertension. Heart Fail Clin, 2018. 14(3): p. 255–269. [DOI] [PubMed] [Google Scholar]
- 2.McLaughlin, ACCF/AHA 2009 Expert Consensus Document on Pulmonary Hypertension: A Report of the American College of Cardiology Foundation Task Force on Expert Consensus Documents and the American Heart Association (vol 119, pg 2250, 2009). Circulation, 2009. 120(2): p. E13–E13. [DOI] [PubMed] [Google Scholar]
- 3.Wang Z and Chesler NC, Pulmonary vascular wall stiffness: An important contributor to the increased right ventricular afterload with pulmonary hypertension. Pulm Circ, 2011. 1(2): p. 212–23. [DOI] [PMC free article] [PubMed] [Google Scholar]
- 4.Thenappan T, Chan SY, and Weir EK, Role of extracellular matrix in the pathogenesis of pulmonary arterial hypertension. Am J Physiol Heart Circ Physiol, 2018. 315(5): p. H1322–H1331. [DOI] [PMC free article] [PubMed] [Google Scholar]
- 5.Hoffmann J, Marsh LM, Pieper M, Stacher E, Ghanim B, Kovacs G, Konig P, Wilkens H, Haitchi HM, Hoefler G, Klepetko W, Olschewski H, Olschewski A, and Kwapiszewska G, Compartment-specific expression of collagens and their processing enzymes in intrapulmonary arteries of IPAH patients. Am J Physiol Lung Cell Mol Physiol, 2015. 308(10): p. L1002–13. [DOI] [PMC free article] [PubMed] [Google Scholar]
- 6.Wilson JL, Yu J, Taylor L, and Polgar P, Hyperplastic Growth of Pulmonary Artery Smooth Muscle Cells from Subjects with Pulmonary Arterial Hypertension Is Activated through JNK and p38 MAPK. PLoS One, 2015. 10(4): p. e0123662. [DOI] [PMC free article] [PubMed] [Google Scholar]
- 7.Gan CTJ, Lankhaar JW, Westerhof N, Marcus JT, Becker A, Twisk JWR, Boonstra A, Postmus PE, and Vonk-Noordegraaf A, Noninvasively assessed pulmonary artery stiffness predicts mortality in pulmonary arterial hypertension. Chest, 2007. 132(6): p. 1906–1912. [DOI] [PubMed] [Google Scholar]
- 8.Stevens GR, Garcia-Alvarez A, Sahni S, Garcia MJ, Fuster V, and Sanz J, RV dysfunction in pulmonary hypertension is independently related to pulmonary artery stiffness. JACC Cardiovasc Imaging, 2012. 5(4): p. 378–87. [DOI] [PubMed] [Google Scholar]
- 9.Tan W, Madhavan K, Hunter KS, Park D, and Stenmark KR, Vascular stiffening in pulmonary hypertension: cause or consequence? (2013 Grover Conference series). Pulm Circ, 2014. 4(4): p. 560–80. [DOI] [PMC free article] [PubMed] [Google Scholar]
- 10.Morimatsu Y, Sakashita N, Komohara Y, Ohnishi K, Masuda H, Dahan D, Takeya M, Guibert C, and Marthan R, Development and characterization of an animal model of severe pulmonary arterial hypertension. J Vasc Res, 2012. 49(1): p. 33–42. [DOI] [PubMed] [Google Scholar]
- 11.Stenmark KR, Meyrick B, Galie N, Mooi WJ, and McMurtry IF, Animal models of pulmonary arterial hypertension: the hope for etiological discovery and pharmacological cure. American Journal of Physiology-Lung Cellular and Molecular Physiology, 2009. 297(6): p. L1013–L1032. [DOI] [PubMed] [Google Scholar]
- 12.Fung YC and Liu SQ, Changes of zero-stress state of rat pulmonary arteries in hypoxic hypertension. J Appl Physiol (1985), 1991. 70(6): p. 2455–70. [DOI] [PubMed] [Google Scholar]
- 13.Chen L, Nakano K, Kimura S, Matoba T, Iwata E, Miyagawa M, Tsujimoto H, Nagaoka K, Kishimoto J, Sunagawa K, and Egashira K, Nanoparticle-mediated delivery of pitavastatin into lungs ameliorates the development and induces regression of monocrotaline-inducedpulmonary artery hypertension. Hypertension, 2011. 57(2): p. 343–50. [DOI] [PubMed] [Google Scholar]
- 14.Wang ZJ and Chesler NC, Role of collagen content and cross-linking in large pulmonary arterial stiffening after chronic hypoxia. Biomechanics and Modeling in Mechanobiology, 2012. 11(1-2): p. 279–289. [DOI] [PMC free article] [PubMed] [Google Scholar]
- 15.Kobs RW and Chesler NC, The mechanobiology of pulmonary vascular remodeling in the congenital absence of eNOS. Biomech Model Mechanobiol, 2006. 5(4): p. 217–25. [DOI] [PubMed] [Google Scholar]
- 16.Ooi CY, Wang ZJ, Tabima DM, Eickhoff JC, and Chesler NC, The role of collagen in extralobar pulmonary artery stiffening in response to hypoxia-induced pulmonary hypertension. American Journal of Physiology-Heart and Circulatory Physiology, 2010. 299(6): p. H1823–H1831. [DOI] [PMC free article] [PubMed] [Google Scholar]
- 17.Li Z, Huang W, Jiang ZL, Gregersen H, and Fung YC, Tissue remodeling of rat pulmonary arteries in recovery from hypoxic hypertension. Proc Natl Acad Sci U S A, 2004. 101(31): p. 11488–93. [DOI] [PMC free article] [PubMed] [Google Scholar]
- 18.Liu SQ, Regression of hypoxic hypertension-induced changes in the elastic laminae of rat pulmonary arteries. J Appl Physiol (1985), 1997. 82(5): p. 1677–84. [DOI] [PubMed] [Google Scholar]
- 19.Palasiewicz G, Usupbaeva DA, Le Roux H, Sarybayev AS, Plywaczewski R, Mirrakhimov MM, and Zielinski J, [Three week stay at a height of 3700-4200 m. causes mild pulmonary hypertension in healthy men]. Pneumonol Alergol Pol, 1998. 66(11-12): p. 545–50. [PubMed] [Google Scholar]
- 20.Zhou Q, Yang S, Luo Y, Qi Y, Yan Z, Shi Z, and Fan Y, A randomly-controlled study on the cardiac function at the early stage of return to the plains after short-term exposure to high altitude. PLoS One, 2012. 7(2): p. e31097. [DOI] [PMC free article] [PubMed] [Google Scholar]
- 21.Zhao YY, Liu Y, Stan RV, Fan L, Gu Y, Dalton N, Chu PH, Peterson K, Ross J Jr., and Chien KR, Defects in caveolin-1 cause dilated cardiomyopathy and pulmonary hypertension in knockout mice. Proc Natl Acad Sci U S A, 2002. 99(17): p. 11375–80. [DOI] [PMC free article] [PubMed] [Google Scholar]
- 22.Le Saux O, Teeters K, Miyasato S, Choi J, Nakamatsu G, Richardson JA, Starcher B, Davis EC, Tam EK, and Jourdan-Le Saux C, The role of caveolin-1 in pulmonary matrix remodeling and mechanical properties. Am J Physiol Lung Cell Mol Physiol, 2008. 295(6): p. L1007–17. [DOI] [PMC free article] [PubMed] [Google Scholar]
- 23.Achcar RO, Demura Y, Rai PR, Taraseviciene-Stewart L, Kasper M, Voelkel NF, and Cool CD, Loss of caveolin and heme oxygenase expression in severe pulmonary hypertension. Chest, 2006. 129(3): p. 696–705. [DOI] [PubMed] [Google Scholar]
- 24.Wang K-Y, Lee M-F, Ho H-C, Liang K-W, Liu C-C, Tsai W-J, and Lin W-W, Serum Caveolin-1 as a Novel Biomarker in Idiopathic Pulmonary Artery Hypertension. BioMed Research International, 2015. 2015: p. 173970. [DOI] [PMC free article] [PubMed] [Google Scholar]
- 25.Jasmin JF, Mercier I, Dupuis J, Tanowitz HB, and Lisanti MP, Short-term administration of a cell-permeable caveolin-1 peptide prevents the development of monocrotaline-induced pulmonary hypertension and right ventricular hypertrophy. Circulation, 2006. 114(9): p. 912–20. [DOI] [PubMed] [Google Scholar]
- 26.Wunderlich C, Schmeisser A, Heerwagen C, Ebner B, Schober K, Braun-Dullaeus RC, Schwencke C, Kasper M, Morawietz H, and Strasser RH, Chronic NOS inhibition prevents adverse lung remodeling and pulmonary arterial hypertension in caveolin-1 knockout mice. Pulmonary Pharmacology & Therapeutics, 2008. 21(3): p. 507–515. [DOI] [PubMed] [Google Scholar]
- 27.Amin M, Kunkel AG, Le VP, and Wagenseil JE, Effect of Storage Duration on the Mechanical Behavior of Mouse Carotid Artery. Journal of Biomechanical Engineering-Transactions of the Asme, 2011. 133(7). [DOI] [PMC free article] [PubMed] [Google Scholar]
- 28.Lee AY, Han B, Lamm SD, Fierro CA, and Han HC, Effects of elastin degradation and surrounding matrix support on artery stability. Am J Physiol Heart Circ Physiol, 2012. 302(4): p. H873–84. [DOI] [PMC free article] [PubMed] [Google Scholar]
- 29.Moreno J, The Effect of Pulmonary Hypertension on the Mechanical Properties of Arteries in Caveolin-1 knockout Mice, in Mechanical Eng. 2012, University of Texas at San Antonio: San Antonio, TX. [Google Scholar]
- 30.Ramachandra AB and Humphrey JD, Biomechanical characterization of murine pulmonary arteries. J Biomech, 2019. 84: p. 18–26. [DOI] [PMC free article] [PubMed] [Google Scholar]
- 31.Eberth JF, Cardamone L, and Humphrey JD, Evolving biaxial mechanical properties of mouse carotid arteries in hypertension. Journal of Biomechanics, 2011. 44(14): p. 2532–2537. [DOI] [PMC free article] [PubMed] [Google Scholar]
- 32.Han HC, The mechanical buckling of curved arteries. Mol Cell Biomech, 2009. 6(2): p. 93–9. [PubMed] [Google Scholar]
- 33.Lee AY and Han HC, A Nonlinear Thin-Wall Model for Vein Buckling. Cardiovasc Eng, 2010. 1(4): p. 282–289. [DOI] [PMC free article] [PubMed] [Google Scholar]
- 34.Chesler NC, Thompson-Figueroa J, and Millburne K, Measurements of mouse pulmonary artery biomechanics. J Biomech Eng, 2004. 126(2): p. 309–14. [DOI] [PubMed] [Google Scholar]
- 35.Lammers SR, Kao PH, Qi HJ, Hunter K, Lanning C, Albietz J, Hofmeister S, Mecham R, Stenmark KR, and Shandas R, Changes in the structure-function relationship of elastin and its impact on the proximal pulmonary arterial mechanics of hypertensive calves. American Journal of Physiology-Heart and Circulatory Physiology, 2008. 295(4): p. H1451–H1459. [DOI] [PMC free article] [PubMed] [Google Scholar]
- 36.Bellofiore A, Henningsen J, Lepak CG, Tian L, Roldan-Alzate A, Kellihan HB, Consigny DW, Francois CJ, and Chesler NC, A novel in vivo approach to assess radial and axial distensibility of large and intermediate pulmonary artery branches. J Biomech Eng, 2015. 137(4): p. 044501. [DOI] [PMC free article] [PubMed] [Google Scholar]
- 37.Fung YC, Biomechanics : mechanical properties of living tissues. 1981, New York: Springer-Verlag. xii, 433 p. [Google Scholar]
- 38.Hu JJ, Baek S, and Humphrey JD, Stress-strain behavior of the passive basilar artery in normotension and hypertension. Journal of Biomechanics, 2007. 40(11): p. 2559–2563. [DOI] [PubMed] [Google Scholar]
- 39.Garcia JR, Lamm SD, and Han HC, Twist buckling behavior of arteries. Biomech Model Mechanobiol, 2013. 12(5): p. 915–27. [DOI] [PMC free article] [PubMed] [Google Scholar]
- 40.Qi N, Gao H, Ogden RW, Hill NA, Holzapfel GA, Han HC, and Luo X, Investigation of the optimal collagen fibre orientation in human iliac arteries. J Mech Behav Biomed Mater, 2015. 52: p. 108–19. [DOI] [PMC free article] [PubMed] [Google Scholar]
- 41.Wagenseil JE and Mecham RP, Vascular extracellular matrix and arterial mechanics. Physiol Rev, 2009. 89(3): p. 957–89. [DOI] [PMC free article] [PubMed] [Google Scholar]
- 42.Albinsson S, Shakirova Y, Rippe A, Baumgarten M, Rosengren BI, Rippe C, Hallmann R, Hellstrand P, Rippe B, and Sward K, Arterial remodeling and plasma volume expansion in caveolin-1-deficient mice. Am J Physiol Regul Integr Comp Physiol, 2007. 293(3): p. R1222–31. [DOI] [PubMed] [Google Scholar]
- 43.Murata T, Lin MI, Huang Y, Yu J, Bauer PM, Giordano FJ, and Sessa WC, Reexpression of caveolin-1 in endothelium rescues the vascular, cardiac, and pulmonary defects in global caveolin-1 knockout mice. J Exp Med, 2007. 204(10): p. 2373–82. [DOI] [PMC free article] [PubMed] [Google Scholar]
- 44.Drab M, Verkade P, Elger M, Kasper M, Lohn M, Lauterbach B, Menne J, Lindschau C, Mende F, Luft FC, Schedl A, Haller H, and Kurzchalia TV, Loss of caveolae, vascular dysfunction, and pulmonary defects in caveolin-1 gene-disrupted mice. Science, 2001. 293(5539): p. 2449–52. [DOI] [PubMed] [Google Scholar]
- 45.Tabima DM and Chesler NC, The effects of vasoactivity and hypoxic pulmonary hypertension on extralobar pulmonary artery biomechanics. Journal of Biomechanics, 2010. 43(10): p. 1864–1869. [DOI] [PMC free article] [PubMed] [Google Scholar]
- 46.Kobs RW, Muvarak NE, Eickhoff JC, and Chesler NC, Linked mechanical and biological aspects of remodeling in mouse pulmonary arteries with hypoxia-induced hypertension. American Journal of Physiology-Heart and Circulatory Physiology, 2005. 288(3): p. H1209–H1217. [DOI] [PubMed] [Google Scholar]
- 47.Golob MJ, Tabima DM, Wolf GD, Johnston JL, Forouzan O, Mulchrone AM, Kellihan HB, Bates ML, and Chesler NC, Pulmonary arterial strain- and remodeling-induced stiffening are differentiated in a chronic model of pulmonary hypertension. J Biomech, 2017. 55: p. 92–98. [DOI] [PMC free article] [PubMed] [Google Scholar]
- 48.Todorovich-Hunter L, Johnson DJ, Ranger P, Keeley FW, and Rabinovitch M, Altered elastin and collagen synthesis associated with progressive pulmonary hypertension induced by monocrotaline. A biochemical and ultrastructural study. Lab Invest, 1988. 58(2): p. 184–95. [PubMed] [Google Scholar]
- 49.Fonck E, Prod’hom G, Roy S, Augsburger L, Rufenacht DA, and Stergiopulos N, Effect of elastin degradation on carotid wall mechanics as assessed by a constituent-based biomechanical model. American Journal of Physiology-Heart and Circulatory Physiology, 2007. 292(6): p. H2754–H2763. [DOI] [PubMed] [Google Scholar]
- 50.Wagenseil JE and Mecham RP, Elastin in Large Artery Stiffness and Hypertension. J Cardiovasc Transl Res, 2012. [DOI] [PMC free article] [PubMed] [Google Scholar]
- 51.Martinez R and Han HC, The effect of collagenase on the critical buckling pressure of arteries. Mol Cell Biomech, 2012. 9(1): p. 55–75. [PMC free article] [PubMed] [Google Scholar]
- 52.Collins MJ, Eberth JF, Wilson E, and Humphrey JD, Acute mechanical effects of elastase on the infrarenal mouse aorta: implications for models of aneurysms. J Biomech, 2012. 45(4): p. 660–5. [DOI] [PMC free article] [PubMed] [Google Scholar]
- 53.Wang GL, Wang LY, Yang SX, Zhang P, Chen XH, Yao QP, Gong XB, Qi YX, Jiang ZL, and Han HC, Arterial wall remodeling under sustained axial twisting in rats. J Biomech, 2017. 60: p. 124–133. [DOI] [PMC free article] [PubMed] [Google Scholar]
- 54.Rahman A and Sward K, The role of caveolin-1 in cardiovascular regulation. Acta Physiol (Oxf), 2009. 195(2): p. 231–45. [DOI] [PubMed] [Google Scholar]
- 55.Sward K, Albinsson S, and Rippe C, Arterial dysfunction but maintained systemic blood pressure in cavin-1-deficient mice. PLoS One, 2014. 9(3): p. e92428. [DOI] [PMC free article] [PubMed] [Google Scholar]
- 56.Han HC, Nonlinear buckling of blood vessels: a theoretical study. J Biomech, 2008. 41(12): p. 2708–13. [DOI] [PubMed] [Google Scholar]
- 57.Huang W, Delgado-West D, Wu JT, and Fung YC, Tissue remodeling of rat pulmonary artery in hypoxic breathing. II. Course of change of mechanical properties. Ann Biomed Eng, 2001. 29(7): p. 552–62. [DOI] [PubMed] [Google Scholar]


