Figure 4.
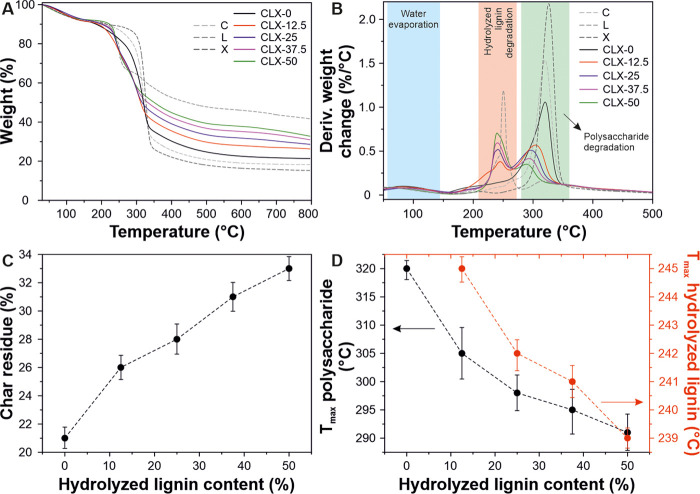
(A, B) TGA thermograms and derivative thermogravimetric curves of lignin-based samples (CLX-0, CLX-12.5, CLX-25, CLX-37.5, and CLX-50) and control samples (C, X, and L). (C) Char residue of the lignin-based samples after 800 °C as a function of hydrolyzed lignin content. (D) Shift of the temperature of the maximum mass loss rate related to lignin (red) and polysaccharide (black) degradations with respect to the hydrolyzed lignin content.

