
Figure 2: Model of deep population relationships.
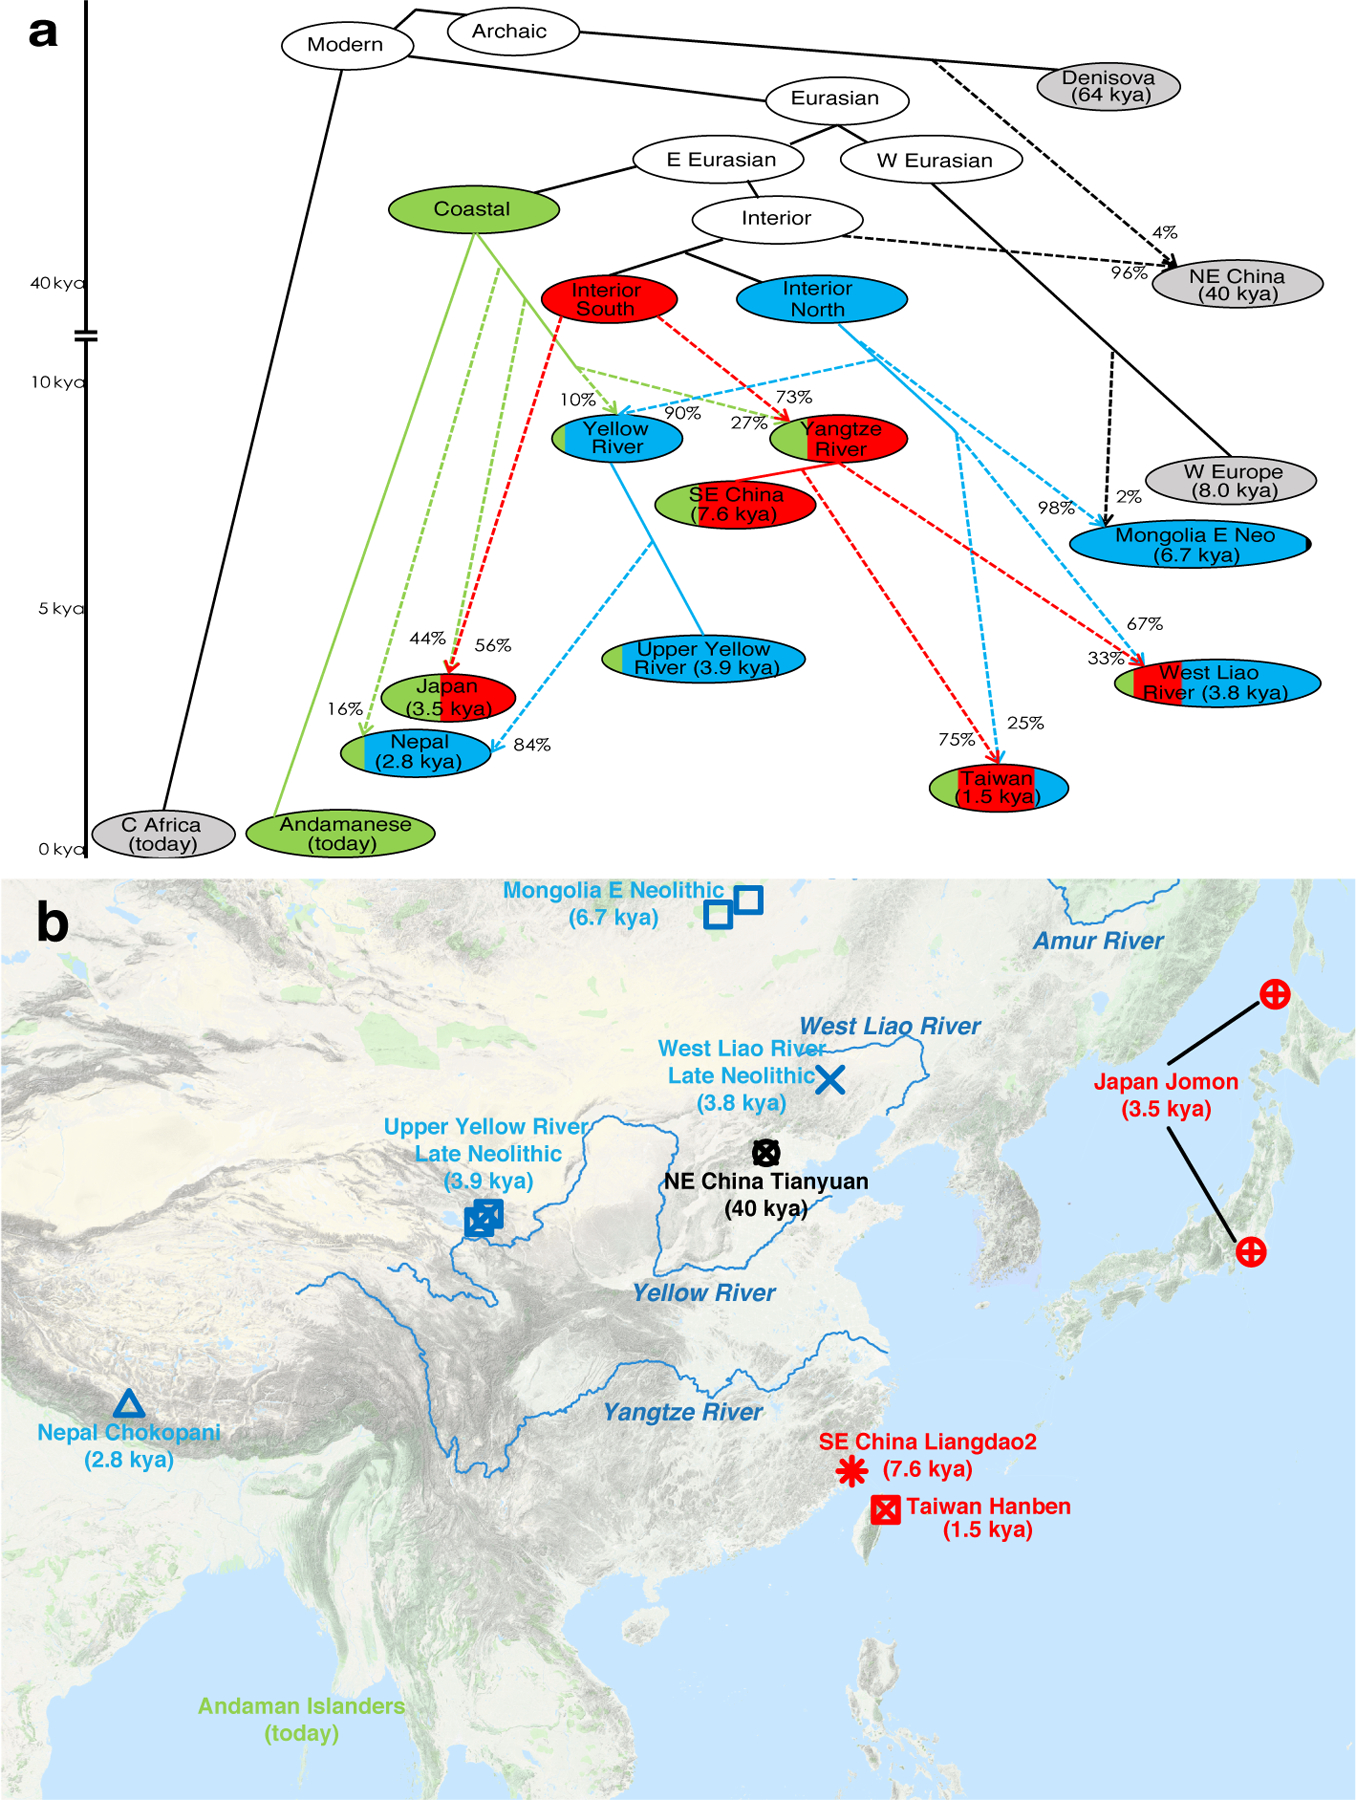
We start with a skeleton tree with one admixture event that when run on all SNPs fits the data for Denisova, Mbuti, Onge, Tianyuan and Loschbour according to qpGraph. We grafted on Mongolia East Neolithic, Upper Yellow River Late Neolithic farmers, Liangdao2, Japan Jomon, Nepal Chokhopani, Taiwan Hanben, and West Liao River Late Neolithic farmers, adding them consecutively to all possible edges and retaining only graphs that provided no differences of |Z|<3 between fitted and estimated statistics (maximum |Z|=2.95 here). We used MSMC and MSMC2 relative population split time estimates to constrain models. (a) We colour lineages modelled as from the hypothesized coastal expansion (green), interior southern expansion (red), or interior northern expansion (blue), and populations according to ancestry proportions. Dashed lines represent admixture (proportions marked). (b) Locations and dates of East Asians used in model fitting, with colours indicating the majority ancestry source, are plotted using the “Google Map Layer” from ArcGIS Online Basemaps (Map data ©2020 Google).