
Extended Data Figure 5|. Estimates of population split times.
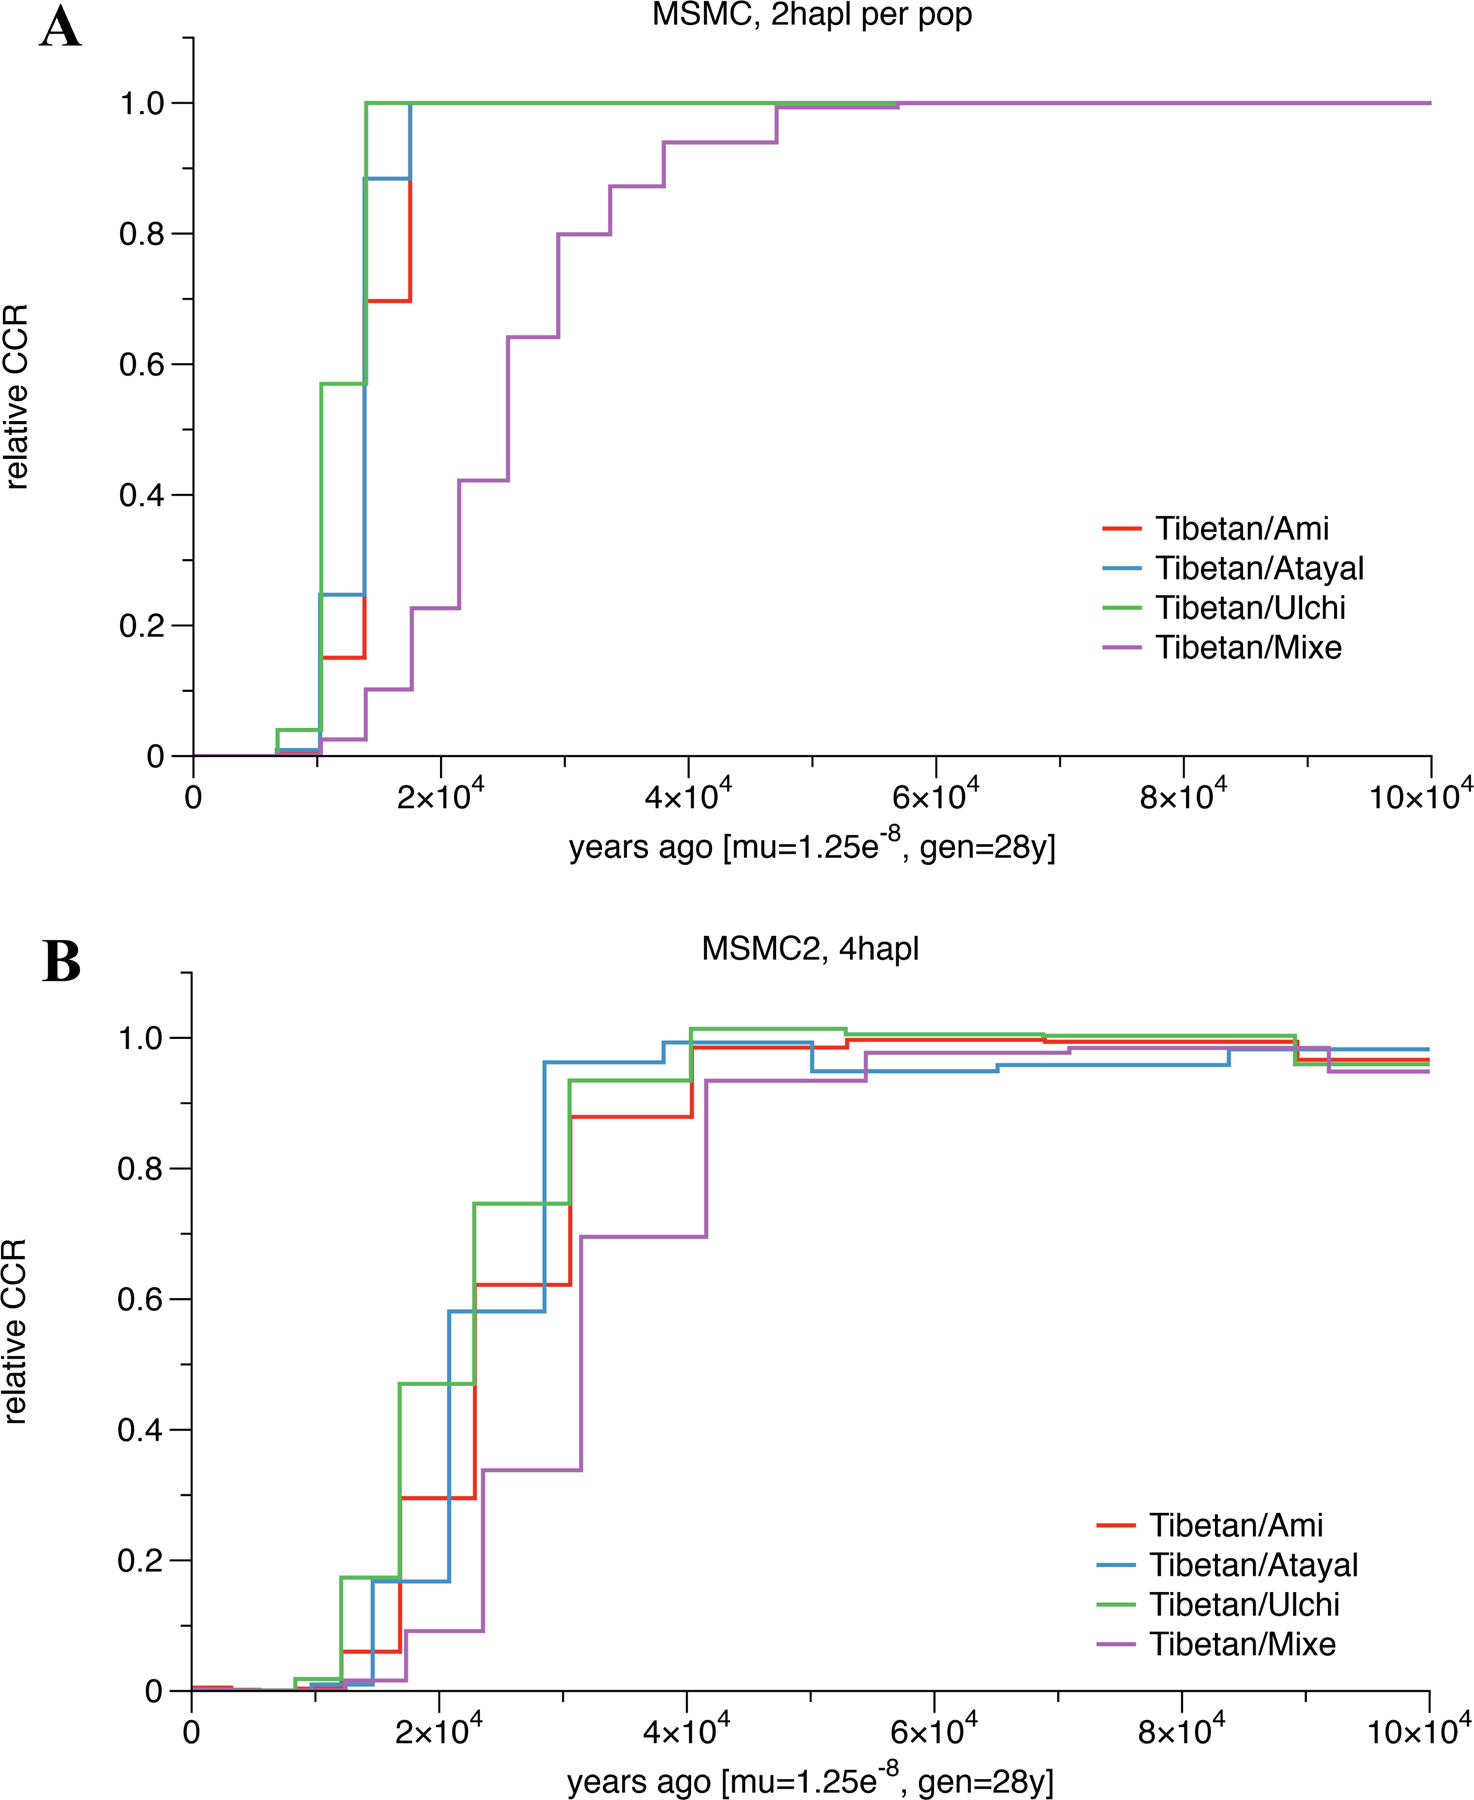
(A) Cross-coalescence rates for selected population pairs. We ran MSMC for four pairs of populations: Tibetan-Ami, Tibetan-Atayal, Tibetan-Ulchi and Tibetan-Mixe. We used one individuals from each population in this analysis. The modern genomic data for those individuals are from the Simons Genome Diversity Project. The times are calculated based on the mutation rate and generation time specified on the x-axis. (B) Cross-coalescence rates for selected population pairs. Same analysis as in Figure SI3–1, but using MSMC2 instead of MSMC, and using two individuals per population except for the Tibetan-Atayal pair, where we used only one.