

Supplemental Digital Content is available in the text.
Key Words: clinical laboratory data, machine learning, mortality prediction, thrombocytopenia
Abstract
Background:
Clinical laboratories have traditionally used a single critical value for thrombocytopenic events. This system, however, could lead to inaccuracies and inefficiencies, causing alarm fatigue and compromised patient safety.
Objectives:
This study shows how machine learning (ML) models can provide auxiliary information for more accurate identification of critical thrombocytopenic patients when compared with the traditional notification system.
Research Design:
A total of 50,505 patients’ platelet count and other 26 additional laboratory datasets of each thrombocytopenic event were used to build prediction models. Conventional logistic regression and ML methods, including random forest (RF), artificial neural network, stochastic gradient descent (SGD), naive Bayes, support vector machine, and decision tree, were applied to build different models and evaluated.
Results:
Models using logistic regression [area under the curve (AUC)=0.842], RF (AUC=0.859), artificial neural network (AUC=0.867), or SGD (AUC=0.826) achieved the desired average AUC>0.80. The highest positive predictive value was obtained by the SGD model in the testing data (72.2%), whereas overall, the RF model showed higher sensitivity and total positive predictions in both the training and testing data and outperformed other models. The positive 2-day mortality predictive rate of RF methods is as high as 46.1%—significantly higher than using the traditional notification system at only 14.8% [χ2(1)=81.66, P<0.001].
Conclusions:
This study demonstrates a data-driven ML approach showing a significantly more accurate 2-day mortality prediction after a critical thrombocytopenic event, which can reinforce the accuracy of the traditional notification system.
As a rule, laboratories are required to issue urgent notifications to physicians to initiate prompt response management. This requirement gave rise to the term “critical value,” which was initially used by Lundberg1,2 in 1972 to describe the imminent danger faced by patients needing appropriate therapy. In the following years, the Joint Commission on Accreditation of Healthcare Organizations and the College of American Pathologists required clinical laboratories to issue notifications based on critical values as part of their accreditation criteria.3,4 Since then, a single critical value notification system based on individual clinical tests5,6 has been prevalent; however, critical laboratory tests and their values are mostly defined without consensus and evidence.7
Because of this lack of consensus, the majority of laboratories established the critical value of platelet count for thrombocytopenic events between 5000 and 50,000/mL.7,8 However, this wide range remains questionable because recent literature has also pointed out that platelet quality is more critical than platelet quantity in determining bleeding severity.9 Moreover, because clinical laboratories serve a wide array of patient populations with different underlying diseases, a universal value for all patients can be deemed insufficient.7 To accurately identify high-risk patients and reduce alarm fatigue, a combination of the use of additional patient laboratory data and advanced modern information technology may increase positive predictive value (PPV) and reduce false notifications.10,11
Numerous studies use multiple data—not exclusively from laboratories—with logistic regression (LR) or other simple calculation methods to improve prognostic performance or increase the triage acuity level of patients.12–20 As machine learning (ML) has been adopted in the fields of mortality or disease prediction and demonstrated superior performance in classification and prediction based on extensive data,21–26 the implementation of ML in the field of critical notification is highly likely to help solve current challenges in clinical laboratories.21,22 However, there is a scarcity of related literature regarding the use of ML techniques to predict the short-term mortality of thrombocytopenic patients based on their clinical laboratory data, and this is a gap that needs to be addressed.
Thus, this paper aims to address the ongoing dilemma related to critical value establishment and implement an ML model based on evidence and real-world clinical laboratory data used in predicting the 2-day mortality of critical thrombocytopenic patients by answering the following research questions (RQs).
RQ1: Which ML method is most capable of identifying the 2-day mortality of thrombocytopenic patients based on clinical laboratory data?
RQ2: Will the selected ML method give a significantly more accurate 2-day mortality prediction (ie, higher PPV) than the traditional notification system?
METHODS
Study Population
This study was conducted as a retrospective study for which 266,110 consecutive platelet counts of adult patients (aged 20 y old or above) were collected from January 1, 2016 to June 30, 2017, at the Linkou Chang Gung Memorial Hospital (CGMH) in Taiwan, a 3400-bed tertiary medical center that cares for patients with significantly high severity of comorbidities.27
Of the obtained platelet counts, 71,759 thrombocytopenic events had <150,000/mL of mean platelet counts of the day (Fig. 1); 150,000 (not 50,000) was set as the criterion because having counts in between might require a warrant of critical status occasionally. Data from patients with thrombocytopenia were used, wherein a total of 63,131 (88%) thrombocytopenic events were included from 71,759 after excluding those without complete blood count or differential count data, to build this study’s ML models. Of those events, 80% (50,505) were used as the training dataset, and the remaining 20% (12,626) were retained as the testing dataset for studying the comparative performance of ML methods, as indicated in RQ1.
FIGURE 1.
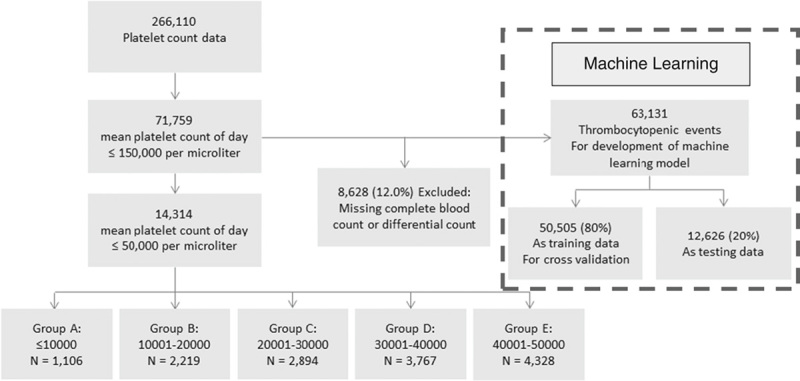
Study population and research framework.
As stated earlier, by tradition, a majority of laboratories have established the critical value of platelet count for thrombocytopenic events as <50,000/mL. This arbitrarily selected value was used as a threshold to trigger critical notifications by individual hospital. This study then performed a descriptive analysis of cases with a platelet count of <50,000/mL (the upper range usually adopted by laboratories) and identified 14,314 cases, which were broken down into 5 groups by an interval of 10,000/mL to allow individual hospitals to compare and evaluate their data with those of this study. The relevant patient characteristics and 2-day mortality of these 5 groups are presented in Table 1. In CGMH, the traditional universal value notification was based on the results of clinical laboratory tests, which used the criterion of a platelet count lower than 10,000/mL, white blood cell count >50,000 or <1000/mL, hemoglobin >19 or <6 g/dL, or blast cell existence. Thus, the comparative performance of the ML method with the traditional notification system, as indicated in RQ2, was evaluated based on the PPVs of the 2 approaches. In the traditional system, CGMH initiated a total of 583 critical notifications to thrombocytopenic cases in the testing dataset (n=12,626) and yielded 86 correct 2-day mortality predictions in this study period. The Institutional Review Board of CGMH (IRB No.: 201701296B0) approved the study and waived informed consent because data were entirely anonymized and delinked.
TABLE 1.
Patient Characteristics and 2-Day Mortality of Thrombocytopenic Events With Platelet Value ≤50,000/mL
| Group* | A | B | C | D | E |
|---|---|---|---|---|---|
| No. laboratory tests† | 1106 | 2219 | 2894 | 3767 | 4328 |
| No. patients | 519 | 1008 | 1291 | 1708 | 2149 |
| Age (mean±SD) | 58.4±15.7 | 58.0±14.4 | 58.6±14.2 | 59.3±13.8 | 59.6±14.0 |
| Sex | |||||
| Male | 612 | 1293 | 1754 | 2305 | 2660 |
| Female | 494 | 926 | 1140 | 1462 | 1668 |
| 2-d mortality (%) | 210 (18.99) | 335 (15.10) | 324 (11.20) | 309 (8.20) | 343 (7.93) |
The 5 groups by platelet count are: A=≤10,000, B=10,001–20,000, C=20,001–30,000, D=30,001–40,000, and E=40,001–50,000/mL.
A patient might take multiple tests.
Machine Learning Methods and Clinical Laboratory Data
The study obtained data from 27 laboratory tests (ie, mean platelet count, basophil, eosinophil, monocyte, lymphocyte, segmented neutrophil, abnormal monocyte, red cell distribution width, mean corpuscular hemoglobin, mean corpuscular hemoglobin concentration, mean corpuscular volume, red blood cell, white blood cell, band, meta-myelocyte, myelocyte, atypical lymphocyte, reticulocyte, promyelocyte, blast cell, promonocyte, megakaryocyte, abnormal lymphocyte, plasma cell, hematocrit, hemoglobin, and nucleated red blood cell; see Supplementary Table 1, Supplemental Digital Content 1, http://links.lww.com/MLR/C114) on the same day of each thrombocytopenic event to further train, validate, and test the ML models.7 Because coding the data of patients who had more than 2 tests on a specific day as multiple separate records is improper given that the multiple sets of predictor variables corresponded to only 1 outcome variable (ie, 2-d mortality), possibly resulting in unreasonable relative weights in ML models compared with other patients, this study, instead, used the average value of each test in those reports to represent the general condition of the specific day. Multiple reports for a patient on the same day accounted for only 0.67% of total data; therefore, using the average value did not considerably twist the overall model while still ensuring simplified data and results processing.
The additional laboratory data and the mean platelet count were combined into a new vector of 27 elements, generating an array containing 63,131 records of 27 elements, with each record representing a thrombocytopenic event. All cases of patients who died within the next 2 days after the thrombocytopenic event were labeled as positive in the training of ML models. In addition, all datasets used their continuous values and kept their time sequence to ensure the developed model can more closely represent, and be used to make, predictions in real clinical settings.
ML methods used in this study to build different models were selected based on previous relevant literature and are as follows: LR, random forest (RF), artificial neural network (ANN), stochastic gradient descent (SGD), naive Bayes (NB), support vector machine (SVM), and decision tree (DT; see Supplementary Table 2, Supplemental Digital Content 2, http://links.lww.com/MLR/C115).21–25
Performance Evaluation
In addressing RQ1 and comparing the methods’ relative performance, the ML methods were evaluated with the following metrics: sensitivity, specificity, PPV, negative predictive value (NPV), total positive predictions, and area under the curve (AUC). Five-fold cross-validation was performed to guarantee the models’ robustness.28 The AUC of the receiver operating characteristic curve was set to be >0.80, which represents an excellent discrimination power,29 thus being considered a satisfactory ML model in this study. Achieving the least average PPV of 50% in cross-validation was set as the minimum cutoff of prediction probability or decision score to eliminate excessive false alarms. Performance metrics by 5-fold cross-validation were then calculated using the training data. The ML model established from the last iteration when the 5-fold cross-validation met the cutoff criteria was used for the preserved 20% test data.
To answer RQ2, based on data from patients in the same test data group (ie, 12,626 cases, as shown in Fig. 1), the PPV obtained from an ML method with the best performance based on metrics in RQ1 was used for comparison with that of the traditional notification system. The study then adopted a χ2 independent test to evaluate the PPVs between the 2 approaches to reveal their comparative accuracy in making the notification.
If a significant difference in the χ2 test had been observed, it might suggest that the criteria that triggered the notification in both approaches were different. Thus, the feature (or variable) importance30 of the selected machine model is measured to reveal the differences between the final selected ML model and the traditional system.
All ML models and calculations, including the AUC and other metrics, were performed using the “sklearn” package in Python 3.4 (https://www.python.org/). Statistical analyses of the analysis of variance, χ2 test, or Fisher exact test were executed in SPSS (IBM SPSS Statistics 19, Chicago, IL).
RESULTS
Representing the common selected criteria used in different hospitals, the descriptive statistics of the 5 groups of platelet counts, including distribution and 2-day mortality, are shown in Table 1. The highest 2-day mortality rate in group A (18.99%) and the lowest in group E (7.93%) were within the study’s expectations. The overall mortality rate in these critical groups was 10.63%.
In addressing RQ1, the performance metrics of ML models were used for performance comparison, and results are as shown in Table 2. Performance metrics, including sensitivity, specificity, PPV, NPV, the total number of positive predictions, and AUC, were calculated for the 5-fold cross-validation and the testing data. Models using LR, RF, ANN, SGD, and NB achieved an average AUC>0.80 in the 5-fold cross-validation, whereas SVM and DT failed to reach 0.80 and were excluded from further analysis. The cutoff value for each model was set as the minimum value to reach the least PPV>50% in the 5-fold cross-validation, thus excluding the NB model with only 28.4% PPV.
TABLE 2.
Performance Metrics of Machine Learning Models
| Model | Dataset | Sensitivity (%) | Specificity (%) | PPV (%) | NPV (%) | TPP (n) | AUC |
|---|---|---|---|---|---|---|---|
| LR | Training* | 7.2±0.7 | 99.6±0.1 | 50.2±7.4 | 95.4±0.2 | 73.6±16.5 | 0.842±0.011 |
| Testing | 9.7 | 99.6 | 53.3 | 95.7 | 107 | 0.836 | |
| RF | Training | 15.0±0.8 | 99.2±0.1 | 50.3±2.6 | 95.7±0.2 | 149.6±13.0 | 0.859±0.007 |
| Testing | 15.1 | 99.1 | 46.1 | 96.0 | 193 | 0.848 | |
| ANN | Training | 18.8±10.2 | 98.9±0.8 | 50.0±7.3 | 95.9±0.6 | 202.8±121.6 | 0.867±0.005 |
| Testing | 3.6 | 99.9 | 53.8 | 95.5 | 39 | 0.845 | |
| SGD | Training | 4.2±2.5 | 99.8±0.2 | 50.0±7.2 | 95.2±0.4 | 43.0±26.3 | 0.826±0.010 |
| Testing | 2.2 | 100.0 | 72.2 | 95.4 | 18 | 0.819 | |
| NB | Training | 8.5±1.3 | 98.9±0.3 | 28.4±3.4 | 95.4±0.2 | 151.8±33.5 | 0.824±0.011 |
| Testing | 8.3 | 98.5 | 21.0 | 95.6 | 223 | 0.800 | |
| SVM | Training | 0.1±0.1 | 100±0.0 | 16.7±21.1 | 95.1±0.3 | 1.6±0.8 | 0.755±0.010 |
| Testing | 0.2 | 100 | 25 | 95.3 | 4 | 0.729 | |
| DT | Training | 24.2±1.5 | 95.0±0.3 | 20.1±0.9 | 96.0±0.3 | 600.4±37.0 | 0.596±0.008 |
| Testing | 24.9 | 94.6 | 18.5 | 96.3 | 793 | 0.598 |
Data are presented as mean±SD unless indicated otherwise.
Performance metrics are obtained from 5-fold cross-validation.
ANN indicates artificial neural network; AUC, area under the receiver operating characteristic curve; DT, decision tree; LR, logistic regression; NB, naive Bayes; NPV, negative predictive value; PPV, positive predictive value; RF, random forest; SGD, stochastic gradient descent; SVM, support vector machine; TPP (n), total positive prediction number.
As for the remaining 4 models (LR, RF, ANN, and SGD), all were capable of obtaining a PPV>50% at a fair number of total positive predictions. However, ANN and SGD failed to perform consistently in the testing data, and they presented a relatively low and unsatisfactory sensitivity of 3.6% and 2.2%, respectively. The remaining LR and RF models showed similar robustness and repeatability (higher validation). Notably, this study’s goal is to notify the maximal critical events with an acceptable PPV of at least 50%. In comparison with the LR model, the RF model showed higher sensitivity (15.0% and 15.1% for the training and testing data, respectively) and more total positive predictions (149.6 and 193 for the training and testing data, respectively) than the LF model for both the training and testing data. The RF model also demonstrated better consistent results between the cross-validation and training/testing datasets, which shows its superiority over other ML methods in this study for identifying the 2-day mortality of thrombocytopenic patients based on clinical laboratory data.
In addressing RQ2, the present study compared the performance of the traditional notification system with that of the RF model, which was selected in RQ1 (Fig. 2). The traditional system triggered 583 critical notifications, but its PPV of the 2-day mortality was very low at 14.8% (n=86). In contrast, the RF model displayed a much higher PPV (46.1%) of the 2-day mortality (n=89), while only triggering 193 notification events, and showed a significantly higher PPV than when using the traditional system (χ2(1)=81.66, P<0.001). This result indicates that the ML method was more likely than the traditional system to predict a 2-day mortality event correctly. Moreover, it is notable that only a small fraction (31.4%, 27 of 86 positive predictive patients) received notifications from both approaches. These significantly lowered the PPV in the traditional system, and the low prediction overlap further revealed the unsatisfactory condition of the traditional notification and the potent supplementary information that ML can offer.
FIGURE 2.
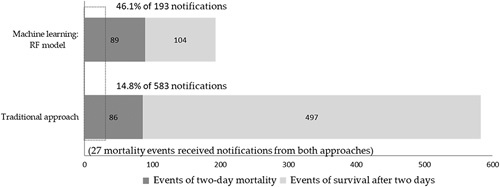
Performance of critical notification of machine learning methods (random forest model) and traditional notification system.
The feature importance of the final RF model is plotted in Figure 3. The white blood cell had the greatest feature importance of 0.084, whereas the plasma cell had the lowest score at 6.38E−05 (average importance score is 0.037). A total of 14 items ranking above average had relatively similar levels of contribution, except the drastic large importance of the white blood count. A gap of importance drops (about 0.02) between the 14th (band) and the 15th (meta-myelocyte) features.
FIGURE 3.
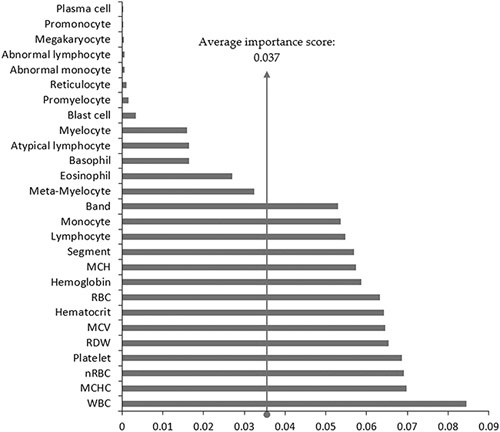
Feature importance of the final random forest model. MCH indicates mean corpuscular hemoglobin; MCHC, mean corpuscular hemoglobin concentration; MCV, mean corpuscular volume; nRBC, nucleated red blood cell; RBC, red blood cell; RDW, red cell distribution width; WBC, white blood cell.
DISCUSSION
Previous studies have shown the insufficiency of evidence and lack of consensus in establishing critical values, especially for hematology tests, as well as in using universal prophylactic transfusions.5–8,31–34 This study focuses on the more accurate prediction of the 2-day mortality of thrombocytopenic patients with the use of ML models based on clinical laboratory data when compared with that of the traditional notification system.
In addressing RQ1, this study adopted ML techniques to explore patients’ biomedical laboratory data, with which a total of 7 ML methods were tested. With the evaluation process, including desired criteria (ie, AUC>0.80 and PPV>50%), this study further examined performance metrics of sensitivity, specificity, PPV, NPV, the total number of positive predictions, and AUC. The RF model, with its advantages of handling complex relationships without the need to make assumptions and of having a low risk of overfitting, demonstrated its superiority in this prediction. Although a previous synthesis study reported that some ML predictions (RF, ANN, NB, etc.) showed no performance benefit over the LR model,35 the results of the present study were consistent with some of the findings of previous research in that it described that nonparametric classifiers (eg, RF) might perform better than more traditional classifiers (eg, LR).22,36 However, it should be noted that such results may depend on the variables, feature scaling, and/or dataset size that a study uses.
In addressing RQ2, the RF model had a significantly higher PPV compared with the traditional notification system’s low PPV, as shown in Figure 2. The high rate of false alarms caused by the low PPV in the traditional notification system could result in alarm fatigue, which may then affect how health care givers prioritize patients, compromising patient safety.11 This study’s ML approach demonstrated an accessible and implementable supplementary system that is capable of significantly improving the PPV. The model successfully reduced the number of false alarms while barely sacrificing the necessary critical notifications for patients who most probably need intensive care. These findings are consistent with those of previous studies in that it showed how ML techniques tend to enhance the performance of traditional predictions.22,26 Moreover, this present study adds to the understanding of how and to what extent the ML approach can improve the performance of predicting patients’ 2-day mortality of thrombocytopenic patients.
Furthermore, the study notes that only 27 mortality events received notifications from both approaches (Fig. 2). The feature importance of the final RF model was taken into consideration to elaborate on the results, as shown in Figure 3. A total of 14 laboratory tests had an above-average feature importance score (0.037), which also seems to have a relatively even and higher contribution in importance than the remaining 13 tests. Traditional critical values only include white blood count, platelet count, and hemoglobin individually. These 3 features merely ranked first, fourth, and seventh in the model, respectively. By including additional features, such as mean corpuscular hemoglobin concentration, nucleated red blood cell, red cell distribution width, and mean corpuscular volume, ranking second, third, fifth, and sixth, the traditional notification system may take more information into account and would likely achieve more accurate identification. Further research to enhance the prediction performance with the emphasis of more features, especially those with above-average feature importance, may be useful.
With the low PPV of the traditional system and the medium PPV of the RF model, results suggest that although ML techniques might not be powerful enough to replace the traditional routine, it may indeed provide a more accurate prediction for decision-makers and practitioners in hospitals through auxiliary highlighted notifications to patients who need intensive care. With further practical application, hospitals may consider relying more on ML prediction and less on the use of traditional notification criteria to decrease false alarms and optimize a more accurate notification routine based on different institutional contexts.
Despite this study success in using the ML model to predict the 2-day mortality for thrombocytopenic patients and substantially improve notification accuracy, the work has several limitations. First, its retrospective design presented the likelihood of deviating from prospective data. However, this limitation was softened by organizing the data by date and splitting the data into training and testing datasets to mimic actual circumstances. Second, the study used clinical laboratory data based on a single date of a thrombocytopenic event. In the future, including data on changes37–40 or vital signs and other comorbid conditions may further improve prediction accuracy. Third, this study did not include the patients’ electronic medical records and did not review the possibility of treatment after the thrombocytopenic event. These 2 parameters should be considered in further prospective trials to provide more precise instructions for physicians. Fourth, this study was not able to compare the performance of ML models with the traditional model by group (eg, groups A-E). For this, a larger dataset may be needed to reach more reliable results, which could be considered for further research. Fifth and last, the study was performed in a tertiary medical center that may have specific patient characteristics. However, because this study’s approach is based on an organization’s previous data, it implies that any health care organization with sufficient medical data can train a model for their patient population despite differing characteristics and requirements.
In conclusion, this study demonstrated that the performance of traditional instruction using low platelet quantity or another traditional notification system approach alone is insufficient to predict the critical status of thrombocytopenic patients. Instead, a data-driven ML approach presents a significantly more precise way to target 2-day mortality after a critical thrombocytopenic event. Although this study’s ML model cannot serve as a precise way to identify the cause of mortality and replace the traditional notification system, its application may provide significantly precise information that will make the traditional notification system more accurate.
Supplementary Material
Supplemental Digital Content is available for this article. Direct URL citations appear in the printed text and are provided in the HTML and PDF versions of this article on the journal's website, www.lww-medicalcare.com.
Footnotes
Supported by the Chang Gung Memorial Hospital grants CORPG3H0441 & CMRPG3J0441 to Y.-H.W. and CMRPVVK0051 to T.-S.C.
The authors declare no conflict of interest.
REFERENCES
- 1.Lundberg GD. When to panic over abnormal values. Med Lab Obs. 1972;4:47–54. [Google Scholar]
- 2.Dighe AS, Rao A, Coakley AB, et al. Analysis of laboratory critical value reporting at a large academic medical center. Am J Clin Pathol. 2006;125:758–764. [DOI] [PubMed] [Google Scholar]
- 3.The Joint Commission. National patient safety goals effective. 2015. Available at: http://www.jointcommission.org/assets/1/6/2015_NPSG_HAP.pdf. Accessed January 14, 2020.
- 4.College of American Pathology. Laboratory general checklist: CAP accreditation program. 2014. Available at: http://webapps.cap.org/apps/docs/education/OnlineCourseContent/2014/TLTM/GEN04212014.PDF. Accessed January 14, 2020.
- 5.Mayo Clinic Laboratories. Mayo Clinic Laboratories critical values/critical results list. 2019. Available at: https://www.mayocliniclabs.com/it-mmfiles/DLMP_Critical_Values_-_Critical_Results_List.pdf. Accessed January 14, 2020.
- 6.Stanford Health Care. Laboratory critical/panic value list. 2019. Available at: https://stanfordhealthcare.org/health-care-professionals/laboratory-critical-value-list.html. Accessed January 14, 2020.
- 7.Campbell CA, Georgiou A, Westbrook JI, et al. What alert thresholds should be used to identify critical risk results: a systematic review of the evidence. Clin Chem. 2016;62:1445–1457. [DOI] [PubMed] [Google Scholar]
- 8.McFarlane A, Aslan B, Raby A, et al. Critical values in hematology. Int J Lab Hematol. 2015;37:36–43. [DOI] [PubMed] [Google Scholar]
- 9.Frelinger AL, III, Grace RF, Gerrits AJ, et al. Platelet function tests, independent of platelet count, are associated with bleeding severity in ITP. Blood. 2015;126:873–879. [DOI] [PMC free article] [PubMed] [Google Scholar]
- 10.Winters BD, Cvach MM, Bonafide CP, et al. Technological distractions (part 2): a summary of approaches to manage clinical alarms with intent to reduce alarm fatigue. Crit Care Med. 2018;46:130–137. [DOI] [PubMed] [Google Scholar]
- 11.Ruskin KJ, Hueske-Kraus D. Alarm fatigue: impacts on patient safety. Curr Opin Anaesthesiol. 2015;28:685–690. [DOI] [PubMed] [Google Scholar]
- 12.Shann F, Pearson G, Slater A, et al. Paediatric index of mortality (PIM): a mortality prediction model for children in intensive care. Intensive Care Med. 1997;23:201–207. [DOI] [PubMed] [Google Scholar]
- 13.Kamath PS, Wiesner RH, Malinchoc M, et al. A model to predict survival in patients with end-stage liver disease. Hepatology. 2001;33:464–470. [DOI] [PubMed] [Google Scholar]
- 14.Wiesner R, Edwards E, Freeman R, et al. Model for end-stage liver disease (MELD) and allocation of donor livers. Gastroenterology. 2003;124:91–96. [DOI] [PubMed] [Google Scholar]
- 15.Dunn W, Jamil LH, Brown LS, et al. MELD accurately predicts mortality in patients with alcoholic hepatitis. Hepatology. 2005;41:353–358. [DOI] [PubMed] [Google Scholar]
- 16.Horne BD, May HT, Muhlestein JB, et al. Exceptional mortality prediction by risk scores from common laboratory tests. Am J Med. 2009;122:550–558. [DOI] [PubMed] [Google Scholar]
- 17.Loke YK, Kwok CS, Niruban A, et al. Value of severity scales in predicting mortality from community-acquired pneumonia: systematic review and meta-analysis. Thorax. 2010;65:884–890. [DOI] [PubMed] [Google Scholar]
- 18.Steer J, Gibson J, Bourke SC. The DECAF score: predicting hospital mortality in exacerbations of chronic obstructive pulmonary disease. Thorax. 2012;67:970–976. [DOI] [PubMed] [Google Scholar]
- 19.Simard M, Sirois C, Candas B. Validation of the combined comorbidity index of Charlson and Elixhauser to predict 30-day mortality across ICD-9 and ICD-10. Med Care. 2018;56:441–447. [DOI] [PubMed] [Google Scholar]
- 20.Bannay A, Chaignot C, Blotière PO, et al. The best use of the Charlson Comorbidity Index with electronic health care database to predict mortality. Med Care. 2016;54:188–194. [DOI] [PubMed] [Google Scholar]
- 21.Rose S. Mortality risk score prediction in an elderly population using machine learning. Am J Epidemiol. 2013;177:443–452. [DOI] [PubMed] [Google Scholar]
- 22.Taylor RA, Pare JR, Venkatesh AK, et al. Prediction of in-hospital mortality in emergency department patients with sepsis: a local big data-driven, machine learning approach. Acad Emerg Med. 2016;23:269–278. [DOI] [PMC free article] [PubMed] [Google Scholar]
- 23.Lorenzoni G, Santo Sabato S, Lanera C, et al. Comparison of machine learning techniques for prediction of hospitalization in heart failure patients. J Clin Med. 2019;8:1298. [DOI] [PMC free article] [PubMed] [Google Scholar]
- 24.Rau CS, Wu SC, Chuang JF, et al. Machine learning models of survival prediction in trauma patients. J Clin Med. 2019;8:pii:E799. [DOI] [PMC free article] [PubMed] [Google Scholar]
- 25.Delahanty RJ, Kaufman D, Jones SS. Development and evaluation of an automated machine learning algorithm for in-hospital mortality risk adjustment among critical care patients. Crit Care Med. 2018;46:e481–e488. [DOI] [PubMed] [Google Scholar]
- 26.Fleuren LM, Klausch TLT, Zwager CL, et al. Machine learning for the prediction of sepsis: a systematic review and meta-analysis of diagnostic test accuracy. Intensive Care Med. 2020;46:383–400. [DOI] [PMC free article] [PubMed] [Google Scholar]
- 27.Tsai M-S, Lin MH, Lee C-P, et al. Chang Gung Research Database: a multi-institutional database consisting of original medical records. Biomed J. 2017;40:263–269. [DOI] [PMC free article] [PubMed] [Google Scholar]
- 28.Zhang P. Model selection via multifold cross validation. Ann Stat. 1993;21:299–313. [Google Scholar]
- 29.Hosmer DW, Lemeshow S, Sturdivant RX. Applied Logistic Regression, 3rd ed. Hoboken, NJ: Wiley; 2013:173–182. [Google Scholar]
- 30.Stijven S, Minnebo W, Vladislavleva K.Gustafson S, Vladislavleva E. Separating the wheat from the chaff: on feature selection and feature importance in regression random forests and symbolic regression. 3rd Symbolic Regression and Modeling Workshop for GECCO 2011. Dublin, Ireland: ACM; 2011:623–630. [Google Scholar]
- 31.Heckman KD, Weiner GJ, Davis CS, et al. Randomized study of prophylactic platelet transfusion threshold during induction therapy for adult acute leukemia: 10,000/microL versus 20,000/microL. J Clin Oncol. 1997;15:1143–1149. [DOI] [PubMed] [Google Scholar]
- 32.Rebulla P, Finazzi G, Marangoni F, et al. The threshold for prophylactic platelet transfusions in adults with acute myeloid leukemia. Gruppo Italiano Malattie Ematologiche Maligne dell’Adulto. N Engl J Med. 1997;337:1870–1875. [DOI] [PubMed] [Google Scholar]
- 33.Schiffer CA, Anderson KC, Bennett CL, et al. Platelet transfusion for patients with cancer: clinical practice guidelines of the American Society of Clinical Oncology. J Clin Oncol. 2001;19:1519–1538. [DOI] [PubMed] [Google Scholar]
- 34.Schiffer CA, Bohlke K, Delaney M, et al. Platelet transfusion for patients with cancer: American Society of Clinical Oncology Clinical practice guideline update. J Clin Oncol. 2018;36:283–299. [DOI] [PubMed] [Google Scholar]
- 35.Christodoulou E, Ma J, Collins GS, et al. A systematic review shows no performance benefit of machine learning over logistic regression for clinical prediction models. J Clin Epidemiol. 2019;110:12–22. [DOI] [PubMed] [Google Scholar]
- 36.Maroco J, Silva D, Rodrigues A, et al. Data mining methods in the prediction of dementia: a real-data comparison of the accuracy, sensitivity and specificity of linear discriminant analysis, logistic regression, neural networks, support vector machines, classification trees and random forests. BMC Res Notes. 2011;4:299. [DOI] [PMC free article] [PubMed] [Google Scholar]
- 37.Akca S, Haji-Michael P, de Mendonca A, et al. Time course of platelet counts in critically ill patients. Crit Care Med. 2002;30:753–756. [DOI] [PubMed] [Google Scholar]
- 38.Prytherch DR, Sirl JS, Schmidt P, et al. The use of routine laboratory data to predict in-hospital death in medical admissions. Resuscitation. 2005;66:203–207. [DOI] [PubMed] [Google Scholar]
- 39.Xue Y, Clopton P, Peacock WF, et al. Serial changes in high-sensitive troponin I predict outcome in patients with decompensated heart failure. Eur J Heart Fail. 2011;13:37–42. [DOI] [PubMed] [Google Scholar]
- 40.Wu BU, Johannes RS, Sun X, et al. Early changes in blood urea nitrogen predict mortality in acute pancreatitis. Gastroenterology. 2009;137:129–135. [DOI] [PubMed] [Google Scholar]
Associated Data
This section collects any data citations, data availability statements, or supplementary materials included in this article.
Supplementary Materials
Supplemental Digital Content is available for this article. Direct URL citations appear in the printed text and are provided in the HTML and PDF versions of this article on the journal's website, www.lww-medicalcare.com.