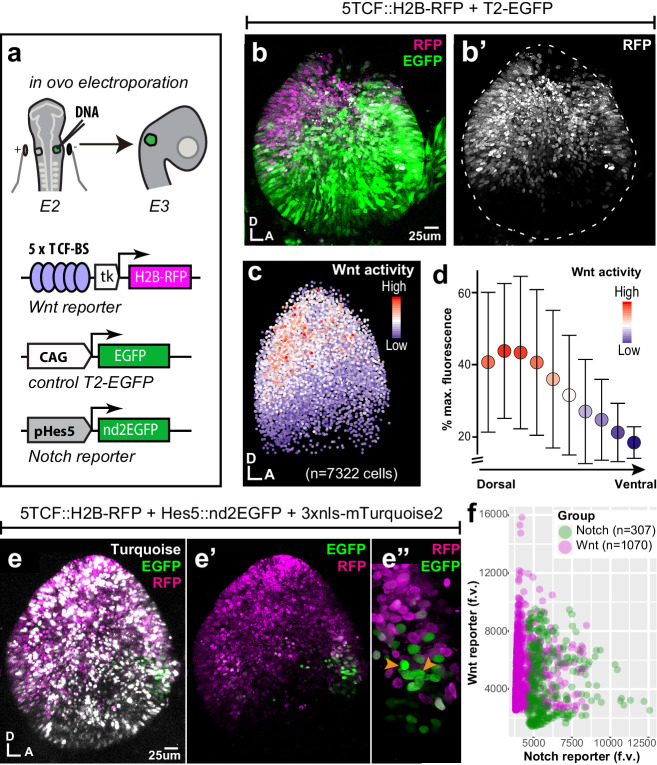
Figure 1. Spatial pattern of Wnt activity in the E3 chicken otocyst.
In all panels, dorsal (D) is up and anterior (A) is right. (a) E2 chicken embryos were co-electroporated either with Wnt reporter and a control plasmid T2-EGFP or Wnt reporter together with a Notch reporter and collected at E3. The Wnt reporter (5TCF::H2B-RFP) contains 5 TCF/LEF binding sites regulating an H2B-RFP fusion protein. In the Notch reporter (T2-Hes5::nd2EGFP), the mouse Hes5 promoter regulates expression of a nuclear destabilised EGFP. The control vector drives constitutive expression of EGFP. (b–b') Whole-mount view of an E3 otocyst electroporated with the Wnt reporter and a control plasmid. Wnt-responsive cells (b') are detected in the dorsal 2/3 of the otocyst. (c) Quantification of Wnt reporter fluorescent levels in individual cells from seven otocysts transfected with the Wnt reporter (see Materials and methods). A decreasing gradient of Wnt reporter fluorescence is observed along the dorso-ventral and postero-anterior axis of the otocyst. (d) Plot of the normalised median fluorescence levels of cells as a function of their position along the dorso-ventral axis of the otocyst. The standard deviation bars reflect variability in fluorescent intensity along the anterio-posterior axis. (e–e”) E3 chicken otocyst co-electroporated with the Wnt and Notch reporters and a control plasmid. The Notch reporter marks the prosensory cells in the antero-ventral prosensory domain (e”). (f) A representative scatter plot of the mean fluorescence values (f.v.) for Wnt (5TCF::H2B-RFP) and Notch (T2-Hes5::nd2EGFP) reporters in individual cells of the anterior prosensory domain. The two groups correspond to cells segmented using either the Notch (green) or Wnt (magenta) reporter fluorescence signal. The cells with high Notch activity tend to have low levels of Wnt activity, and cells with high Wnt activity have low levels of Notch activity, but there is no inverse correlation between the reporters activities at intermediate fluorescence intensity values.

