. 2021 Mar 11;10:e59540. doi: 10.7554/eLife.59540

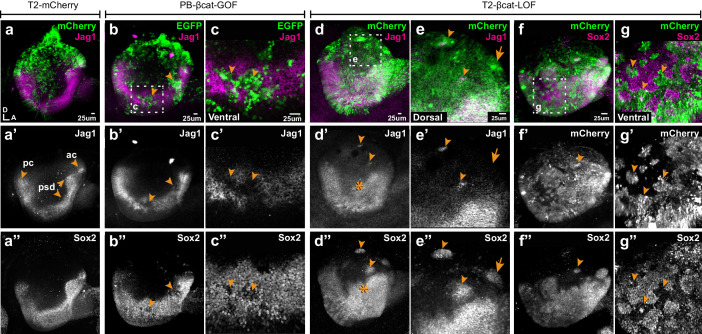
Figure 3. Wnt signalling antagonises prosensory specification.

Whole-mount views of E4 chicken otocysts electroporated at E2 and immunostained for Jag1 and Sox2 expression. (a–a”) Control sample electroporated with T2-mCherry. Jag1 and Sox2 are expressed in a U-shaped ventral common prosensory-competent domain (psd) and prospective prosensory domains (pc = posterior crista; ac=anterior crista). (b–c”) βcat-GOF overexpression induces a mosaic down-regulation of Sox2 and Jag1 expression (arrowheads) in the ventral half of the otocyst. High magnification views of transfected cells (arrowheads in c–c’’) and analysis of mean fluorescence values of Sox2 and βcat-GOF (Figure 3—figure supplement 1a–e) show that this effect is cell-autonomous. (d–g”) Otocysts transfected with T2-βcat-LOF exhibit a dorsal expansion of Jag1 and Sox2 expression (star in d’–d’’) and ectopic prosensory patches dorsally (arrowheads in d’–d’’, f’’) and high magnification views in (e–e’’). Note that some ectopic Sox2-positive patches are Jag1-negative (arrows in e’–e’’). The prosensory effects of βcat-LOF were dependent on Notch activity (Figure 3—figure supplement 2a–b’”). In contrast, in the ventral-most aspect of the otocyst, βcat-LOF overexpressing cells exhibit reduced Sox2 expression (arrowheads in high magnification views g–g’’). Overexpression of βcat-LOF elicits the formation of ectopic Islet-1 expressing otic neurons in the posterior and dorsal aspect of the otocyst (Figure 3—figure supplement 3).

Figure 3.

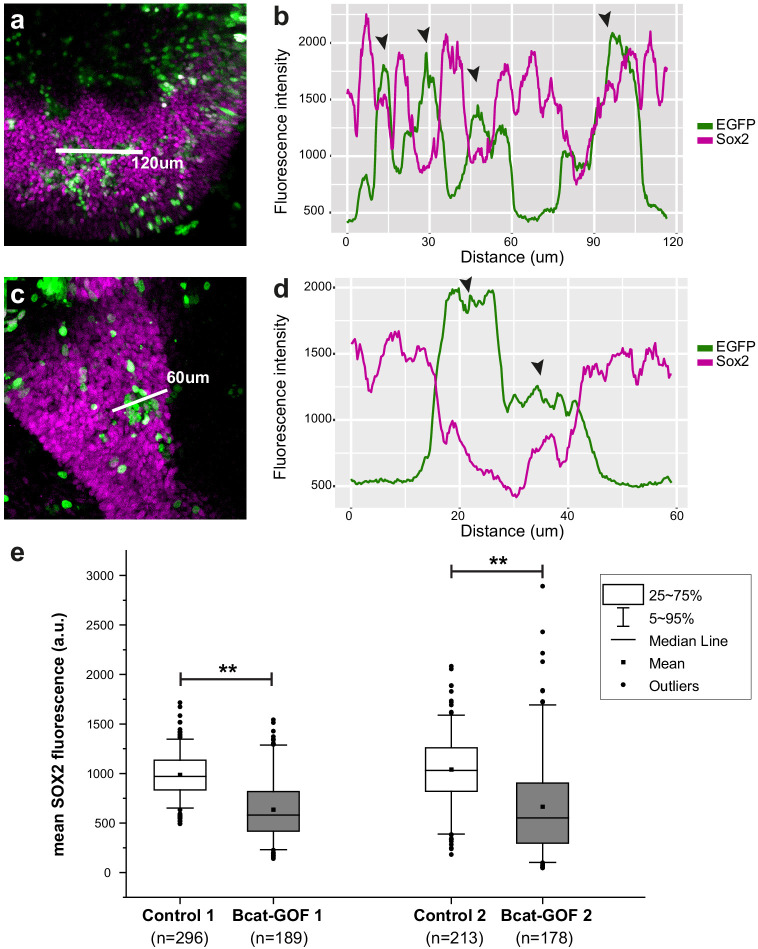
Figure 3—figure supplement 1. Analyses of Sox2 (magenta) and βcat-GOF (EGFP, green) fluorescence intensity levels in transfected prosensory regions.

Figure 3—figure supplement 1.

In figures (a) and (c) the white line indicates the line selected for the profile plots shown in (b) and (d). The line profile plots (b and d) show that transfected cells with high levels of EGFP fluorescence (black arrowhead) have in general lower levels of Sox2 expression than untransfected cells. (e) Box plots of the average Sox2 fluorescence intensity within individual nuclei of untransfected (control) versus βcat-GOF transfected cells selected from two samples. Statistical analyses show a significant reduction in the levels of Sox2 expression in βcat-GOF transfected cells (p<0.01; Mann–Whitney U = 46,503 and U = 28,973 for respectively samples 1 and 2).
Figure 3—figure supplement 2. Effects of simultaneous loss of Wnt and Notch activity on prosensory specification.
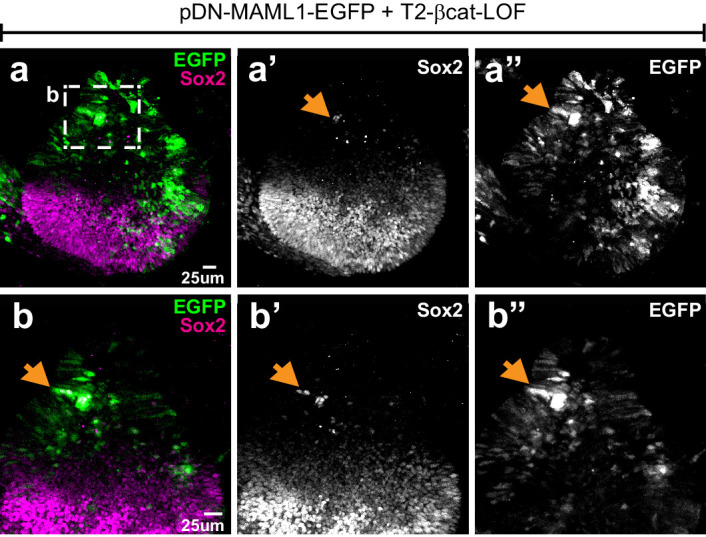
Figure 3—figure supplement 2.

Whole mount of an E4 otocyst co-electroporated with T2-βcat-LOF and a dominant-negative form of Maml1 (pDN-MAML1-EGFP) and immunostained for Sox2. (a–a’’) Sox2-expressing cells occupy the ventral half of the otocyst. There is no noticeable dorsal expansion of Sox2 expression (compare with Figure 3) and only a very limited number of EGFP-positive cells with ectopic Sox2 expression (arrows and high magnification views in b–b’”) are present in the dorsal half of the otocyst.
Figure 3—figure supplement 3. Blocking Wnt signalling triggers ectopic neurogenesis.
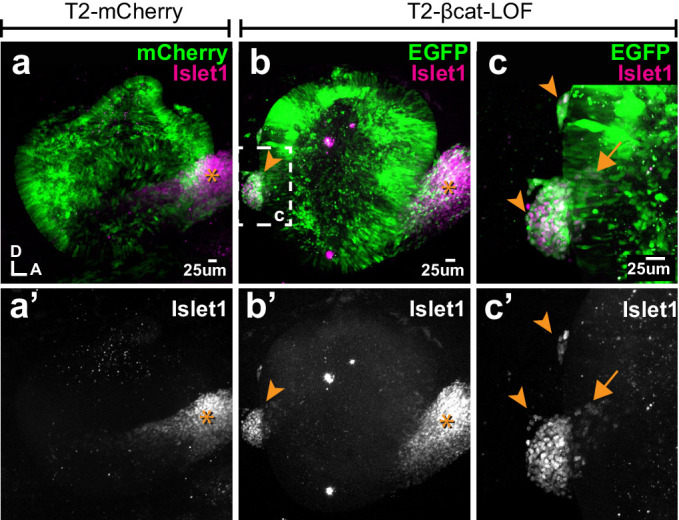
Figure 3—figure supplement 3.

(a–a’) Whole-mount views of an E4 otocyst electroporated at E2 with a control T2-mCherry vector and immunostained for the otic neuronal marker Islet1. The cochleo-vestibular ganglion (star) is on the anterior side of the otocyst. (b–c’) In the T2-βcat-LOF transfected otocyst, ganglion-like clusters of Islet1-expressing cells are present in posterior and dorsal locations (arrowheads). (c–c’) A higher magnification view of the posterior region of the otocyst shown in (b). Note the presence of Islet1-positive cells within the epithelial lining of the otocyst itself (arrow).