. 2021 Feb 11;10:e61408. doi: 10.7554/eLife.61408

Figure 7. 3D reconstructed atlas validation in wild-type mouse brains at cellular resolution.

(A) Example of the original (mirrored, left) and smoothed (edge-aware, right) E18.5 atlases registered to a representative cleared, optically-sectioned P0 wild-type mouse brain. Edge distances between the registered labels and the brain’s own anatomical edge map are reduced for this example brain, shown by the color gradient for each edge (bottom). (B) Label alignment at higher resolution. The top row depicts the registered original (mirrored) atlas at 20x and 100x around a region of interest highlighted by a yellow box. This same brain region is depicted in the bottom row, but overlaid with the refined atlas registered using identical transformations as in the original atlas. (C) Summation of the edge distances across all 15 wild-type brains with color gradient showing the edge distances with the original (top) and smoothed (bottom) labels. (D) Total edge distance at the whole-brain level before and after atlas refinement for each of these brains. (E) Density-based nuclei clustering within each label. Many of the isolated nuclei that could not be clustered in the original labels were clustered in the refined labels, with differences in unclustered nuclei shown from 16 regions selected across the hierarchy of labels from the grossest (neural plate, L0, left) to the finest (e.g. dorsal pallidum, L7, right). Error bars represent 95% confidence intervals. (F) The differences between the original and refined labels’ unclustered nuclei are depicted on an anatomical map showing this metric as a color gradient across all the sublevel labels present in a cross section. Improvements with the refined atlas are colored in blue, while red represents better performance with the original atlas. A complete list of differences for each metric in each label is provided in Supplementary file 2.

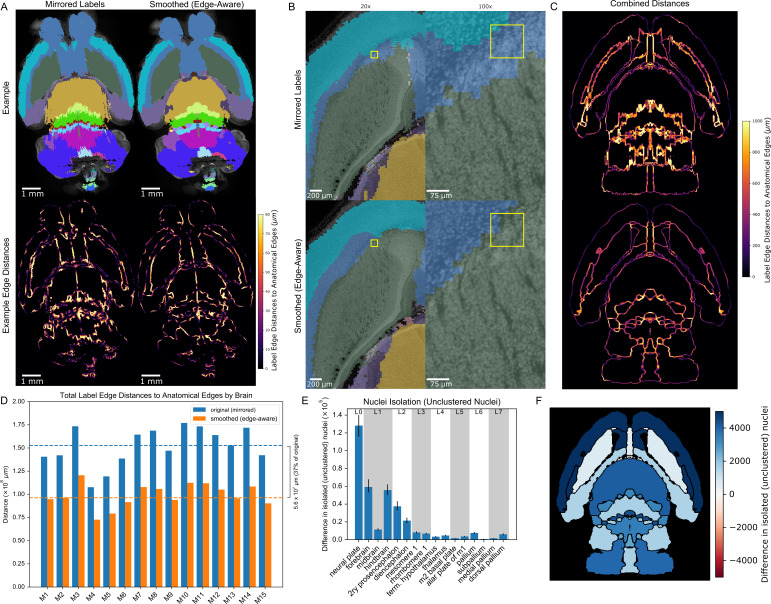
Figure 7.

Figure 7—figure supplement 1. Region homogeneity in wild-type brains based on the original vs.refined atlases.

Figure 7—figure supplement 1.

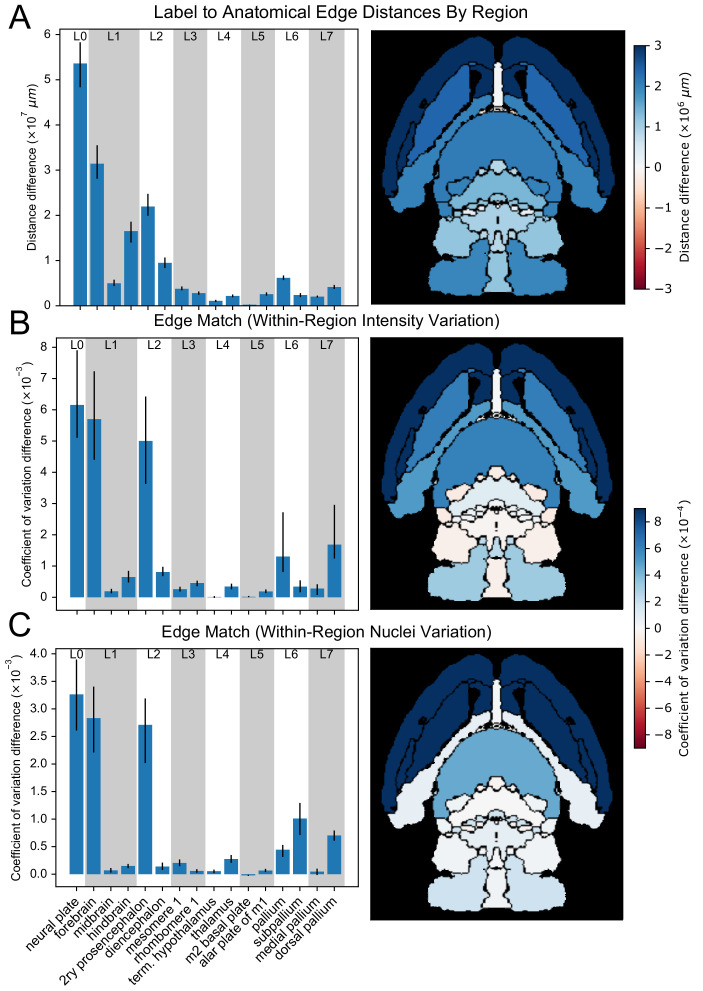
(A) The differences between the original (mirrored) and smoothed (edge-aware) labels’ edge distance sum and (B) intensity and (C) nuclei density coefficients of variation as reflections of region homogeneity are quantified with bar plots (left) for selected regions across the hierarchy of labels. Error bars represent 95% confidence intervals. Anatomical maps depict these metrics as a color gradient across all of the finest labels present in a cross section (right). Increases in a metric with the original atlas are colored in blue, while red represents increases with the refined atlas.
Figure 7—figure supplement 2. Changes in volumes, nuclei, and densities across wild-type brains based on atlas labels.

Figure 7—figure supplement 2.

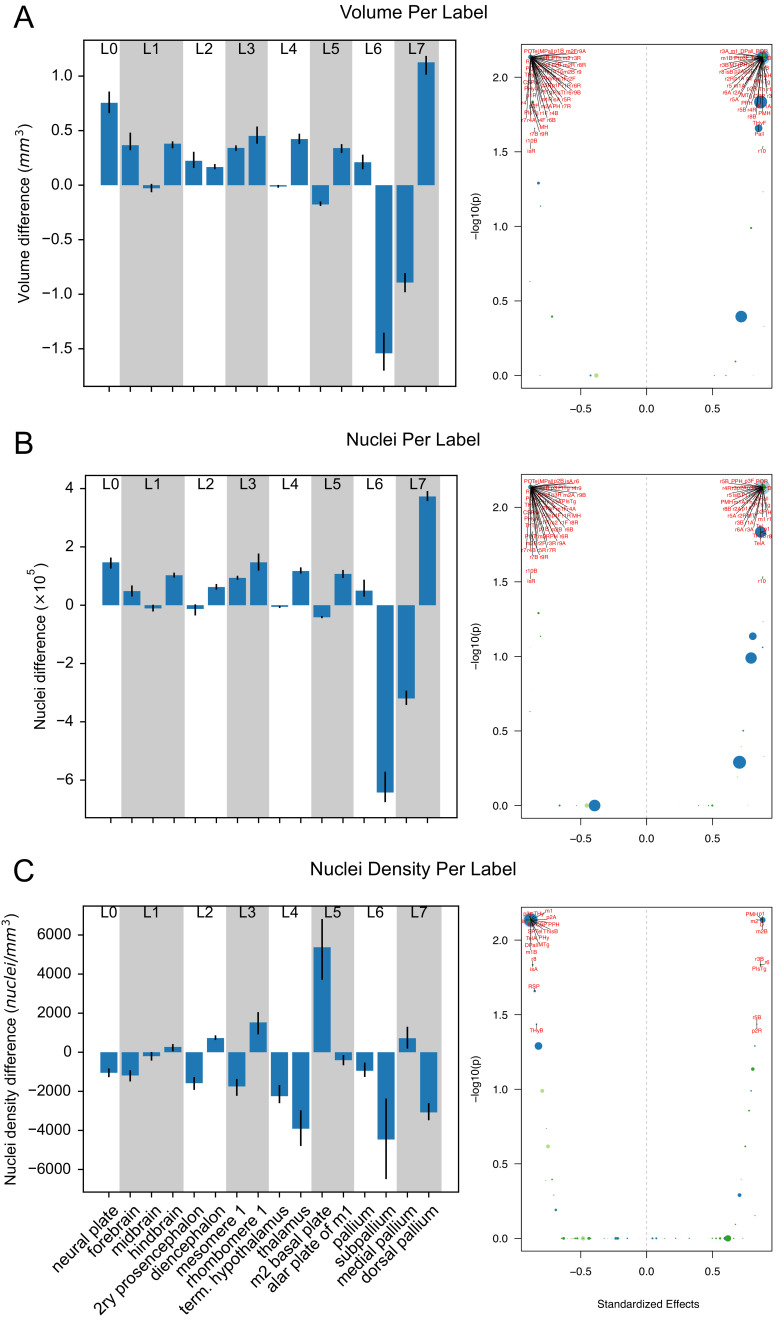
(A) The differences between the original (mirrored) and smoothed (edge-aware) labels’ volume, (B) nuclei, and (C) nuclei densities (bottom) are quantified with bar (right) and volcano (left) plots. Selected regions are shown across the hierarchy of labels from the grossest (neural plate, L0, left) to the finest (e.g. dorsal pallium, L7, right). Positive values indicate decreased size in the refined atlas. Error bars represent 95% confidence intervals. Volcano plots depict each label as a separate point with point size correlating with label size and colors corresponding to major parent structure (neural plate = light blue, forebrain = dark blue, midbrain = light green, hindbrain = dark green). Points higher and farther from 0 have stronger statistical significance and effect size, respectively. p-Values are calculated by the WSRT, Bonferroni corrected for all 120 labels within each measurement. Effect sizes are standardized based on the WSRT Z-statistic.
Figure 7—figure supplement 3. Nuclei clustering in the original vs. refined atlases.

Figure 7—figure supplement 3.

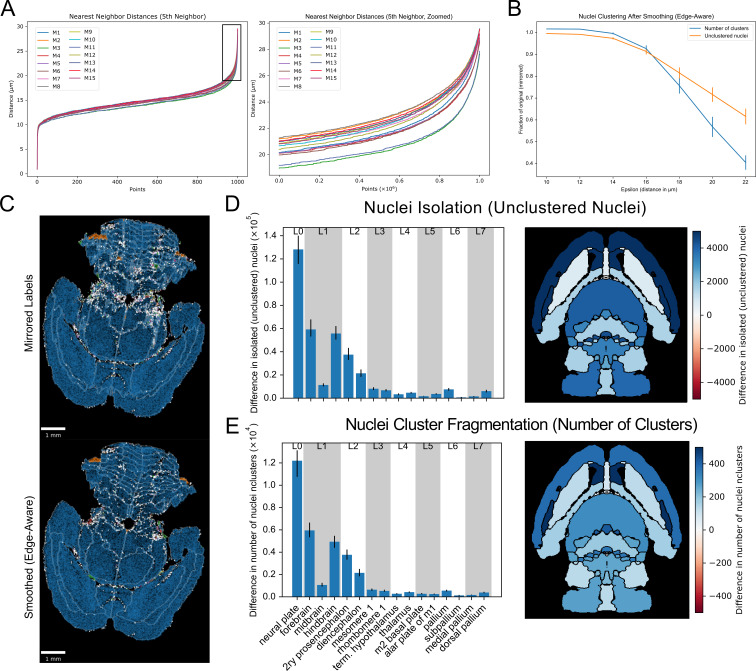
(A-B) To determine the appropriate cluster neighborhood distance parameter, the fifth nearest neighbor distances for all nuclei in each wild-type brain are plotted in ascending order (right), following the convention in DBSCAN of taking the 2·ndim−1th neighbor (Schubert et al., 2017). (left) The zoomed view allows identification of the distance at the ‘elbow’ or ‘knee,’ or maximum curvature, typically at 20 µm or higher. (C) Nuclei clustering within each label in the smoothed (edge-aware) atlas as a fraction of that of the original (mirrored) atlas across a range of distance values. The number of isolated, unclustered nuclei and total clusters, indicative of nuclei isolation and cluster fragmentation, respectively, decreased in the smoothed atlas relative to the original atlas, starting even prior to the minimum distance based on the max curvature seen in part ‘B.’ (E) Example using a conservative neighbor distance of 20 µm for clustering in a brain before (top) and after (bottom) label refinement. Light gray lines show label boundaries. Unclustered nuclei are depicted as white points. All other points are clustered nuclei. Within each region, nuclei are colored by cluster size, where blue represents nuclei in the largest cluster, followed by orange, green, and red for the next successively smaller clusters. (D) Differences in unclustered nuclei and (E) number of clusters by region across all wild-type brains with this distance setting for selected regions across label hierarchies in bar plots (left) and as color gradients on an anatomical map (right).
Figure 7—figure supplement 4. MagellanMapper software GUI screenshots.

Figure 7—figure supplement 4.

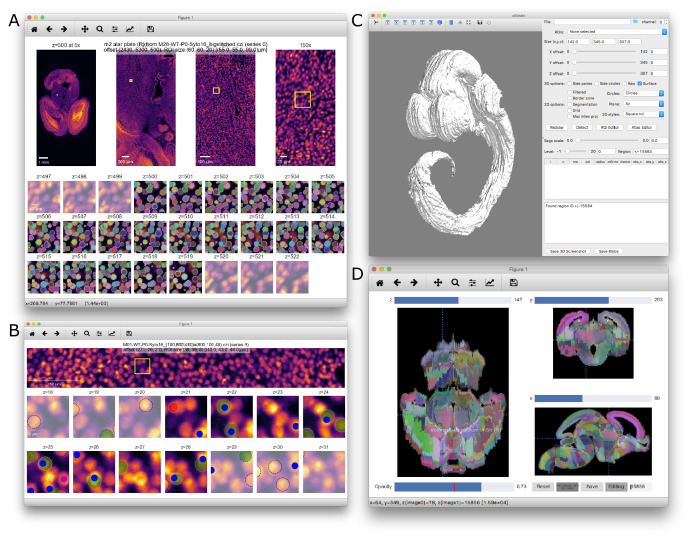
(A) ROI serial 2D viewer and annotation editor GUI. The viewer provides overview images at increasing magnifications, zooming into the ROI outlined in yellow. Overview images are scrollable to show how the z-planes change through the ROI in place. Sequential z-planes of the ROI alone depict the original 2D images side-by-side through the entire 3D ROI, with a few additional opacified planes shown above and below the ROI for context. Overlaid labels show an example of automated nuclei segmentation. (B) Another example of the ROI viewer, here in nuclei annotation and verification mode. Automated nuclei centroid ‘blob detections’ are depicted as interactive circles corresponding to blob positions and radii. For building truth sets, circles provide drag-n-drop and copy-paste controls to reposition, add, or subtract these detections for accuracy. Green and red flags allow scoring for detection correctness. To compare with truth sets, blue and purple dots depict previously annotated nuclei positions pulled in from a database. Automated verification of current blob detections against the truth set shows blue dots as correctly detected truth blobs, purple as missed truth blobs, green circles as correct detections based on a matched truth blob, and red as incorrect detections (no remaining truth blob matches). (C) ROI selector and 3D visualization GUI. The right panel displays ROI offset and size controls, 2D and 3D display options, label controls including ontology depth, and an editable blob table. The left panel shows an example whole atlas 3D visualization using the ADMBA E11.5 atlas. (D) Atlas editor GUI. The GUI provides simultaneous orthogonal views in all three dimensions, with planes corresponding to the crosshairs. With ‘Editing’ selected, labels can be painted into adjacent labels as shown in the intermediate stratum of Str label in the left hemisphere of the z-plane. Editing a second, non-contiguous z-plane in the same label will enable the ‘Fill’ button to perform edge interpolation for this label through all intervening planes.