

The original version of this article contained mistakes, which have no influence on the final findings and conclusions, and the authors hereby publishing these corrections.
The detailed corrections were shown as followed:
Both in Figures 3A and 5D (lower), they made the similar errors for posted the inaccurately photos from the wrong folders in 20 μM and 10 μM groups, respectively. The revised Figures 3A and 5D (lower) are shown below.
Figure 3.
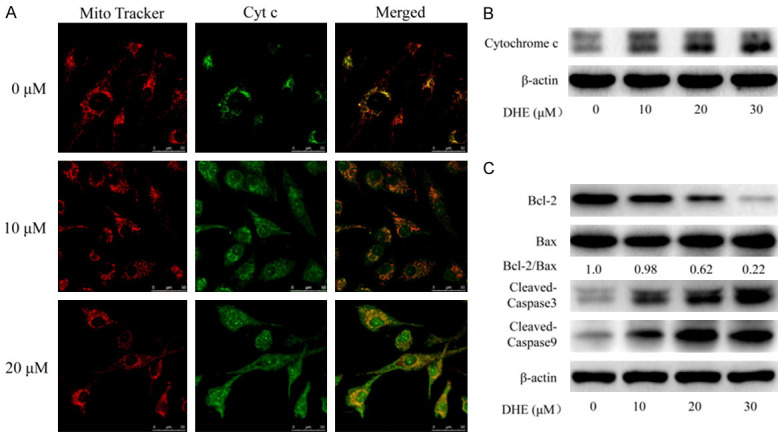
DHE induced apoptosis through mitochondrial pathway in U87 cells. U87 cells treated with DHE at the indicated concentrations for 48 h. A. Laser scanning confocal microscope immunofluorescence analysis of cytochrome c (green) and mitochondria (red) co-localization in U87 cells. B. Cytoplasmic protein were extracted from the U87 cells and subjected to western blot analysis for cytochrome c and β-actin. C. And the levels of Bcl-2, BAX and cleaved caspase-3/9 proteins in total cell lysates from U87 cells were evaluated by western blot. The β-actin served as the protein loading control. Densitometric ratios of Bcl-2 and BAX proteins were quantified by Image J software.
Figure 5.
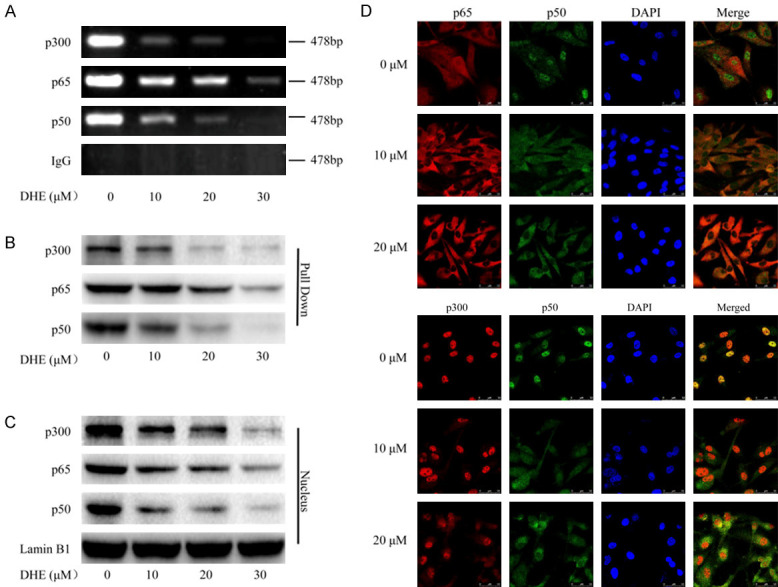
DHE inhibited transcriptional activation of COX-2 by effect on p300 recruitments and p50/p65 NF-κB nuclear translocation. The U87 cells were treated with DHE at the indicated concentrations for 48 h. A. The nuclear extracts were harvested for ChIP assay by using specific antibodies directed against p300, p65 and p50 to immunoprecipitate formaldehyde-fixed chromatin, followed by regular PCR with COX-2 primers. Normal IgG served as a negative control. B. The binding activities of p300, p65 and p50 to COX-2 promoter were analyzed by streptavidin-agrose pulldown assay. C. The total nuclear extracts were subjected to western blot analysis for p300, p65 and p50. The Lamin B1 used as a loading control. D. Laser scanning confocal microscope immunofluorescence assay was performed to detect the subcellular localization of p65, p50 and p300 and the co-localization of p50 with p65 or p300 by using specific antibodies against p65 (red), p50 (green) and p300 (red). And the typical morphology of cells was presented in the above.
Similarly, in Figure 7D, the picture of COX-2 staining in the 20 mg/kg group was presented came from the wrong folder. The amended Figure 7D is shown below.
Figure 7.
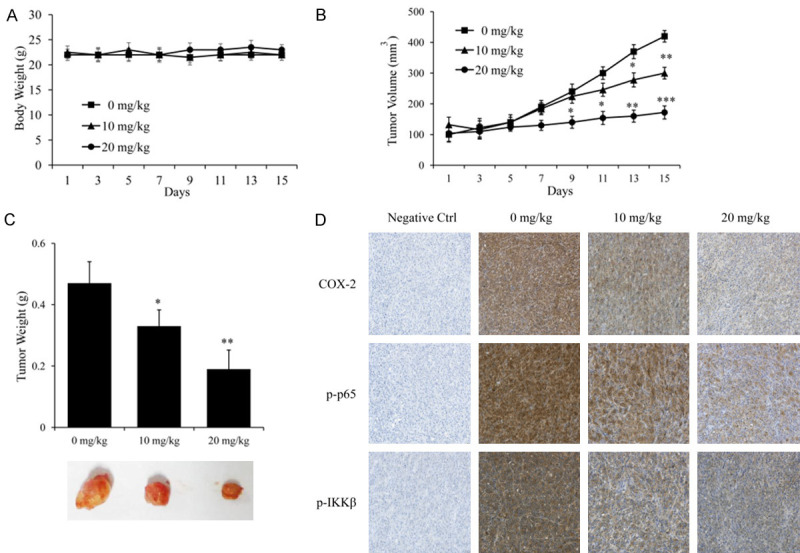
In vivo antitumor efficacy of DHE in U87 tumor xenograft model. Body weights (A) and tumor volumes (B) were recorded every 2 days during the experiment. All mice were euthanized on day 30. (C) The implanted tumors were excised and weighed, and representative tumor photographs of each group were shown. (D) The expression of COX-2, p-p65 and p-IKKβ in implanted tumors was detected by immunohistochemical staining. Representative images of each group were shown. The results are represented as means ± SD (n = 6). (*P<0.05, **P<0.01 and ***P<0.001 as compared with the control group).
The authors express regrets for these mistakes.