

Abstract
Aberrant iron homeostasis is a typical characteristic of Hepatocellular carcinoma (HCC), and perturbation of iron metabolism is an effective strategy for HCC therapy. However, there are few safe and effective targeting agents available in clinical practices. The artemisinin and its derivatives have shown potential anti-cancer activity by disturbing cellular iron homeostasis, but the specific mechanism is still unclear. In this study, we demonstrate that Artesunate (ART), a water-soluble anti-malaria agent in clinical use, can regulate the labile iron pool (LIP) and effectively induce ROS-dependent cell death in multiple HCC cells. Mechanistically, ART increases the LIP by promoting lysosomal degradation of iron-storage protein ferritin through acidizing lysosomes. Then the accumulation of labile iron in the endoplasmic reticulum (ER) promotes excessive reactive oxygen species (ROS) production and severe ER disruption, which leads to cell death. Our results provide a new understanding of how ART modulates iron metabolism in HCC cells at the subcellular level, demonstrate the significance of endoplasmic reticulum as iron-vulnerability of HCC cells. More importantly, our findings suggest ART is a safe and potential anti-HCC agent via disturbing iron homeostasis.
Keywords: Artesunate, endoplasmic reticulum, labile iron pool, reactive oxygen species, hepatocellular carcinoma
Introduction
Hepatocellular carcinoma (HCC) is one of the most lethal and prevalent cancers worldwide, but few therapeutic options are available. Aberrant iron homeostasis has been implicated in the pathogenesis of HCC [1-3], and considered as a potential target for HCC therapy. Labile iron pool (LIP) is a pool of charitable and redox-active iron and severs as a crossroad of cellular iron metabolism [4]. Compared to normal cells [5], high LIP level is important substance and metabolic basic for abnormal proliferation, drugs resistance, cancer stem cell maintenance in cancer cells [6]. Recently, iron metabolism has been considered a potential target for cancer therapy [7,8]. Currently, there are several FDA-approved agents targeting cellular LIP, such as erastin and Deferoxamine mesylate salt (DFO) [9]. However, the unsatisfactory chemical characteristics (highly hydrophilic, orally inactive, poor membrane permeability, a short plasma half-life) [10], severe adverse effects [11,12], and poor tumor-targeting property limit their clinical application [13].
Artemisinin and its derivatives are originally identified as potent anti-malarial drugs and have recently shown potential toxicity in multiple tumor cells [14-16]. Although several mechanisms and various cell death types have been reported to involve in the anti-cancer effects of artemisinin and its derivatives, the ROS and Fe2+ are two of the important elements [17-21]. In addition, Dihydroartemisinin (DAT), an artemisinin-derived compound is reported to disturb cellular iron homeostasis and induce iron-dependent cell death [22,23]. However, the specific mechanism of artemisinin in regulating iron metabolism, especially labile iron content and distribution, cancer cells death remains elusive.
Artesunate (ART), an FDA-approved artemisinin derivative, which is widely used clinically because of excellent water solubility, high bio-availability and strong activity [24,25]. In this study, our results indicated that ART could disturb iron homeostasis by increasing cellular labile iron, and induce distribution of labile iron in ER, finally resulting in ROS-dependent cell death in multiple HCC cells in vivo and in vitro. Our findings suggest ART could serve as a potential anti-HCC agent by modulating iron metabolism.
Materials and methods
Cell culture and chemicals treatment
Cell lines including LO2, LM3, Hep3B, HepG2, Huh7 and SMMC7721 cells were a gift from Jin Chai (Cholestatic Liver Diseases Center and Department of Gastroenterology, Southwest Hospital, Third Military Medical University). Cells were maintained in a humidified incubator with 5% CO2 at 37°C, cultured in the recommended medium and confirmed to be free of Mycoplasma. Artesunate (ART) was purchased from Sigma Aldrich (A3731), the purity (Titration by NaOH) is ≥ 98%. ART (50 μM, unless specified otherwise) was co-incubated for indicated time after cells after cell attachment. DFO (200 μM) (D9533, Sigma Aldrich), 4-phenylbutyrate (4-PBA) (1 mM) (S4125, Selleck), bafilomycin A1 (bafA1) (1 nM) (S1413, Selleck), Liproxstatin-1 (1 μM) (S7699, Selleck), Ferrostatin-1 (1 μM) (S7243, Selleck), Z-VAD-FMK (10 μM) (S7023, Selleck), were pre-incubated 4 hours and then removed before ART treatment. N-acetylcysteine (NAC) (5 mM) (S1623, Selleck) and Mitoquinone (MitoQ) (5 μM) (HY100116, MCE) were pre-incubated 2 hours and then removed before ART treatment.
Cell proliferation assay
The cell growth was assessed via cell viability using the Cell Counting Kit-8 (ck04, Dojindo Molecular, Japan) as previously described [26]. Briefly, 5000 cells per well were seeded in a 96-well plate, and the adherent cells were cultured with the specified concentration of above different inhibitors and ART. At the endpoint, added 10 µL of detection solution to each well and incubated for 2 hours at 37°C, then the absorbance measured at 450 nm was used to assess the cell viability.
Colony formation
1000 cells per well were seeded in 6-well plates, and the fresh medium was changed every 3 days until colonies were clearly visible. Then the colonies were washed with PBS, fixed, stained with crystal violet (Beyotime, Shanghai, China) for 15 minutes, and then counted (at least 50 cells for a colony).
Hematoxylin and eosin (H&E) staining
Mice were euthanized with CO2 gas. The tissues of mice were collected and fixed in 4% formaldehyde, dehydrated, embedded in paraffin, cut into 5 μm thick sections, deparaffinized and rehydrated. Then, the sections were stained by H&E Staining Kit according to the manufacturer’s protocol.
Western blotting
As described previously [26], cells were lysed in RIPA Buffer containing protease inhibitors on ice for 30 min, and then centrifuged at 12000 × g for 10 min at 4°C. The concentrations were detected using the BCA Protein Assay Kit. The sample was subjected to SDS-PAGE with loading buffer, transferred to a PVDF membrane, blocked for 1 hour, immunoblotted with primary antibodies (1:1000) overnight at 4°C, washed with Tris-buffered saline with Tween (TBST) buffer three times (5 minutes once), then incubated with secondary antibodies anti-Human P53 (ab131442, Abcam), anti-Human TFRC1 (ab38171, Abcam), anti-Human Ferritin (ab75973, Abcam), anti-Human IRP1 (ab126595, Abcam), anti-Human IRP2 (NB100-1798, Novus Biologicals), anti-Human DMT1 (ab55735, Abcam), anti-Human ZIP14 (ab10658, Abcam), anti-Human LC3 (3868, CST), anti-Human Caspase-9 (9502, CST), anti-Human Caspase-3 (14420, CST), anti-Human SLC7A11 (12691, CST), anti-Human PARP (9542, CST), ER Stress Antibody Sampler Kit (9956, CST), anti-Human GPX4 (A5569, Bimake) for 1 hour. After washing three times, the intensity of bands was determined using an enhanced chemiluminescence detection system (Bio-Rad Laboratories) by an ECL kit (Thermo Scientific, Waltham, USA). β-Actin (Cell Signaling Technology, USA) was used as the loading control.
Xenotransplantation assays
Five- to six-week-old athymic male nude mice were purchased from Huafukang Bioscience (Beijing, China). Animal protocols were followed by the Animal Care and Use Committee Guidelines of the Third Military Medical University. A total of 5.0 × 10⁶ HCC cells in PBS were subcutaneously injected at one dorsal site. Palpable tumors were observed after a week. Mice were randomly divided into groups and then treated daily with ART (50 mg.kg-1) or PBS twice a week through intraperitoneal injection. The xenograft tumor size and body weight were measured every week using sliding calipers, and the volume was estimated using the formula: volume (mm3) = (length × width2)/2. At the endpoint, mice were euthanized and the xenografts were photographed and weighed.
Cell death assay
Cell death was assessed using Annexin V-FITC/PI Apoptosis Detection Kit (BD Bioscience, USA) according to the manufacturer’s protocol. Briefly, cells were first co-incubated with ART, washed twice in PBS after 24 or 48 hours, then harvested and stained at room temperature in the dark for 15 min, finally subjected to flow cytometry (Accuri C6, BD Biosciences).
Lysosomes pH detection
Lysosomes pH was assessed using Lyso-Sensor Yellow/Blue according to the manufacturer’s protocol (Thermo Fisher, USA). Briefly, cells were incubated with 1 μM stain solution for 1 min and measured using a fluorescent microplate reader (Ex 329 nm; Em 440 nm) (Varioskan LUX, Thermo Scientific).
LIP assessment
As described by Uchiyama [27], the total of LIP was assessed by calcein-AM (Dojindo Molecular, Japan) (Ex 488 nm; Em 518 nm). Briefly, cells were incubated with 0.15 μM calcein-AM for 10-30 min at 37°C in serum-free medium. Then cells were trypsinized, washed and re-suspended in 2.2 ml of serum-free medium, and subjected to confocal microscopy (Carl Zeiss 800, Germany) or flow cytometry (C6, BD Bioscience). Mean fluorescence intensity was used to assess the LIP.
RNA interference
After cells were grown to 30-50% confluence, cells cultured in DMEM reduced serum media were transfected with siRNA oligomers (50 nM) human small interfering si-hepcidin (sense: 5’-UG GUAUUUCCUAGGGUACAdTdT-3’; antisense: 5’-UGUACCCUAGGAAAUACUAdTdT-3’) and si-TFRC1 (sense: 5’-CUCCUGUGAAUGGAUCUAUTT-3’; antisense: 5’-AUAGAUCCAUUCACA GGAGTT-3’) (siRNA, GenePharma), negative control RNA (NC siRNA) with Lipofectamine 3000 (Invitrogen) according to manufacturer’s instructions. Fresh culture medium was added to cultures 6 hours post-transfection. Transfected cells for other experiments were performed 24 hours post-transfection.
ROS and mitochondrial membrane potential (MMP) detection
Total ROS and mitochondrial ROS was measured using DFCH-DA (Beyotime, Shanghai, China), MitoSOX (Thermo Fisher Scientific, USA) and mitochondrial membrane potential were measured using TMRM (Thermo Fisher Scientific, USA), both according to the manufacturer’s instructions. Briefly, cells were first primed with ART for 24 hours, then cells were washed twice in PBS and respectively loaded with 5 µM MitoSOX for 10 min, 100 nM TMRM and 10 μM ROS for 30 min at 37°C, followed by washing twice in PBS before being subjected to flow cytometry.
Confocal microscopy
Cells were cultured on glass coverslips and treated with indicated treatments, stained with organelle-specific trackers according to the manufacturer’s instructions. For ROS staining, cells were incubated with 10 μM ROS indicator (DFCH-DA) for 20 min, then washed three times with serum-free medium. For labile iron (Fe2+) staining, cells were incubated with 10 μM labile iron (Fe2+) indicator Ferrorange and Mito-FerroGreen (Dojindo, Japan). For lipid peroxidation staining, cells were incubated with 5 μM Liperfluo (Dojindo, Japan) for 30 min, then washed with serum-free medium. After staining was completed, images were captured using a fluorescent microscope (Carl Zeiss 800, Germany).
Data and statistical analysis
In this study, the data and statistical analysis comply on experimental design and analysis in pharmacology. Equalization, randomization, and blinding were used for each group in all experiments. In addition, the group size in this study was set as at least three to ensure the implementation of statistical analysis, and no data points were excluded from the statistical analysis in any test. All group sizes represent the numbers of experimental independent biological repeats, and statistical analysis was performed using these independent values Statistical analyses were applied using the unpaired 2-tailed Student’s t-test and oneway analysis of variance with GraphPad Prism 7.04 statistical software (GraphPad, San Diego, USA). In multigroup studies with parametric variables, post hoc tests were conducted only if F in ANOVA (or equivalent) achieved the necessary level of statistical significance (P < 0.05) and there was no significant variance inhomogeneity. The threshold for statistical significance was set at the level of p being 0.05, and in all cases, P < 0.05 was considered statistically significant. In addition, asterisks denote statistical significance (ns, no significance; *, P < 0.05; **, P < 0.01).
Results
ART eradicates HCC cells in a p53-independent manner
It has been reported that ART and its derivatives could selectively inhibit human hepatocellular carcinoma cells growth and their anti-tumor effects were thought to be iron-related [28], but the underlying mechanism remains unclear. Furthermore, feedback loops between P53 and iron metabolism regulators could profoundly impact behaviors of tumor cells including tumors progression [29-31], drug resistance [32], ferroptosis [33], etc. The two paradoxically opposite iron manipulation-strategies for tumor therapy based either on iron chelation or iron overload are all related to p53 [34,35]. In order to assess tumor suppressive effects of ART in liver cancers and to identify whether p53 contributes to the anti-cancer effects, several classical HCC cell lines with different p53 status were used in this study, including Hep3B (p53 null status), SMMC7721 (p53 wild type status, low), and HepG2 (p53 wild type status, median) and Huh7 (p53 mutation status, high) (Figure 1A). Interestingly, HCC cells are much more sensitive to ART compared to human fetal liver cells LO2. The cell viability and clone formation showed that ART induced cytotoxicity to HCC cells in a dose- and time-dependent manner (Figure 1B and 1C), and the various HCC cell lines with different p53 status was not consistent with the inhibition of ART. And the ART induced obvious cell cycle arrest, including G2/M accumulation in Hep3B and SMMC7721, G0/G1 accumulation in HepG2 and huh7 (Figure 1D). Besides, our results also showed that significant cell death was observed after ART treatment (Figure 1E), but the change of P53 expression (upregulation in SMMC7721 and HepG2, downregulation in Huh7) in various HCC cells were also not linearly related to cell death and cell cycle arresting (Figure 1F). However, the iron metabolism related proteins showed a consistent tendency to increase intracellular iron in all HCC cell lines (Figure 1G). Further, we evaluated the anti-tumor effects of ART in vivo with tumor xenografts model established by subcutaneously injecting different HCC cells in nude mice. The Figure S1 showed that intraperitoneal injection of ART (50 mg/kg, twice a week) dramatically suppressed tumor growth compared to the vehicle group. More importantly, ART did not cause obvious visceral organ toxicity and significant loss of body weights. Similarly, there is no significant difference in tumor inhibition efficiency in diverse HCC cells. Besides, we had replenished HCC cell line LM3 (derived from a group of cells with higher metastatic MHC97H), the results showed that under the same dose, the toxicity of ART to LM3 was consistent with that of other HCC cells (Figure S2). These results indicate that ART is a wide-spectrum anti-cancer agent regardless of p53 status in hepatocellular carcinoma cells.
Figure 1.

Cytotoxicity of ART in various HCC cell lines with different p53 status in vitro. A. The various p53 status in hepatocellular carcinoma cells. B. The human HCC cell lines and Human fetal liver cell line LO2 (n=3) were treated with various concentrations of ART for 48 hours and the IC50 values of HCC cells were calculated. C. The cells colonies (n=4) of HCC cells after ART treatment for 24 and 48 hours were counted under inverted microscope. D. The cell (n=3) cycle of various HCC cells after 50 μM ART treatment for 48 hours were examined by flow cytometry. E. After ART treatment for 48 hours, the expression of P53 in various HCC cells was detected using western blot. β-actin was taken as the loading control. F. HCC cells (n=3) were treated with 50 μM ART for 48 hours and stained with Annexin V/PI to detect cell death by flow cytometry. G. After ART treatment for 48 hours, the change of iron metabolism related proteins in various HCC cells were detected using western blot. β-actin was taken as the loading control. Error bars denote mean ± SD. Ns, no significance; *, P < 0.05; **, P < 0.01.
The increase of LIP induced by ART contributes to cell death in HCC cells
It has been previously discovered that ART could disrupt iron metabolism to augment the Fenton reaction to produce excessive ROS [36]. The up-regulation of iron metabolism favoring to increasing cellular iron was discovered in various HCC cells. To study the specific mechanisms of how ART impacts cellular iron homeostasis, the total intracellular Fe2+ and total iron level were detected after ART treatment, but no statistical differences were found in HCC cells (Figure S3A). To further investigate how ART modulate iron metabolism, the siRNA-hepcidin and siRNA-tfrc1 were applied. The results showed that knockdown Hepcidin and TFRC1 induced cell death in HCC cells, respectively. And siRNA-hepcidin and siRNA-tfrc1 did not reduce HCC cell death after ART treated. The results showed included that the transfer and efflux of iron is not responsible to cell death induced by ART (Figure S3). Interestingly, pre-treatment with deferoxamine (DFO), a chelator to labile iron in the cytoplasm, blocked the cell death induced by ART in HCC cells (Figures 2A, S2), suggesting that LIP (LIP), a minor fraction (2%-5%) of the total cellular iron, which is a pool of chelatable and redox-active iron and serves as a crossroad of cellular iron metabolism [37], and of which a large portion is Fe2+ rather than Fe3+ in living cells [38], was responsible for cell death induced by ART. To further verify chelation on cytoplasm LIP of DFO, the intensity of calcein-AM (C-AM) was determined in ART-incubated HCC cells with and without DFO treatment (Figure 2B). The difference of intensity of C-AM fluorescence in four groups displayed that ART significantly reduced fluorescence in HCC cells compared to the control groups, and DFO remarkably blocked the reduction of fluorescence induced by ART in HCC cells (Figure 2C), which indicated that ART increased the content of LIP and DFO reversed this process. These results reveal that ART increases LIP without amplifying total iron content, and LIP is pivotal to cell death induced by ART.
Figure 2.

The increase of LIP induced by ART contributes to cell death in various HCC cells. A. Cells were pre-treated with or without 200 μM DFO for 4 hours, HCC cells (n=3) were treated with 50 μM ART for 48 hours and stained with Annexin V/PI to detect cell death by flow cytometry. All assays were done in triplicate. B. The intensity of calcein-AM (C-AM) of HCC cells (n=3) with or without DFO (200 μM) pre-treated 4 hours before ART for 24 hours and 48 hours were determined by flow cytometry. C. Cells were pre-treated with or without 200 μM DFO for 4 hours before ART treatment for 24 hours, LIP in HCC cells was detected with C-AM by confocal microscope. Error bars denote mean ± SD. Scale bar, 20 μm. Ns, no significance; *, P < 0.05; **, P < 0.01.
ART mobilizes degradation of ferritin by promoting lysosomal acidification which increases the LIP
The LIP could be regulated essentially by iron uptake, storage, utilization, distribution and exportation, respectively [4], it has two main sources, including external intake and internal ferritin degradation, and the major source for increasing LIP by ART is not iron uptake (Figure S3). Ferritin is the major iron storage protein and the degradation of ferritin is the main source of LIP generation in mammal cells [38]. Our results showed that ART reduced the ferritin in a dose-dependent manner (Figure 3A). The lysosomal activity is necessary to degrade ferritin in two known routes, including autophagy-dependent (ferritinophagy) and autophagy-independent mechanisms [39-41]. First, to confirm whether autophagy was involved in ferritin degradation, autophagy inhibitors bafilomycin A1 (bafA1) was applied. The results showed that although bafA1 reversed cytotoxicity of ART which affirmed the critical role of lysosomes in anti-tumor (Figures 3B and S2) and blocked degradation of ferritin in all HCC cells (Figure 3C), the autophagic flux was found only in SMMC7721 and HepG2 and the autophagy blocking of bafA1 were not successful in these two HCC cells (Figure 3C). The acidification is necessary for lysosomes to be activated for not only autophagic degradation [42] but also protease hydrolysis [43] had been proved by treated with bafA1 in some studies. Our results showed that ART acidified lysosomes, which began since 4 hours after drug treatment (Figure 3D) and the lysosomes alkalinization induced by bafA1 was discovered in four kinds of HCC cells (Figure 3E and 3F). And the increased LIP by ART was also eliminated by bafA1 (Figure 3G). These results suggest that ART mobilizes autophagy-independent degradation of ferritin to increase LIP by promoting lysosomal acidification.
Figure 3.

LIP increase due to increased lysosomal acidity is required for cytotoxicity of ART in various HCC cells. A. ART promoted ferritin degradation in various HCC cells in a dose-dependent manner. B. Lysosomal inhibitor bafilomycin A1 (bafA1) reversed growth inhibition induced by ART in HCC cells (n=3). Error bars denote mean ± SD. C. The relationship between ferritin degradation and autophagy induced by ART. D. The continuous changes of pH value were detected in HCC cells treated with ART for 48 hours (n=3). Error bars denote mean ± SD. E. The pH value in various HCC cells treated with ART and/or bafA1 for 24 hours were detected. Error bars denote mean ± SD. F. The fluorescence of lyso-tracker Red (red, Ex/Em: 577/590 nm) in HCC cells treated with ART for 24 hours together with or without bafA1 was detected by confocal microscope. G. Cells were pre-treated with or without 1 nM bafA1 for 4 hours before ART treatment for 24 hours, LIP in HCC cells was indicated with C-AM (green, Ex/Em: 488 nm/500-550 nm) and detected by confocal microscope (ZEISS). Scale bar, 20 μm. Ns, no significance; *, P < 0.05; **, P < 0.01.
ART induced HCC cell death is mediated by lethal ROS accumulation in the endoplasmic reticulum via iron redistribution
Then we investigated the consequences of increased LIP induced by ART via ferritin degradation. The irregular distribution of cellular iron often results in severe cell oxidative damage through aberrant production of highly reactive oxygen species (hROS) via Fenton chemistry, where labile iron could act as a generator of hROS [40] and contribute to ROS-dependent damage and cell death [44]. The total ROS, mitochondrial ROS (Figure 4A and 4B) and labile iron (Fe2+) (Figure 4C) in HCC cells markedly increased compared to the control group and DFO reduced the tendency. As it is reported that mitochondria and ER were two main organelles that consumed labile iron (Fe2+), the ROS indicator, labile iron (Fe2+) indicator and mitochondria and ER indicators were used to investigate the cellular iron distribution and specific subcellular location of lethal ROS. Although, our results showed that ART caused more labile iron (Fe2+) located in the lysosome, endoplasmic reticulum and mitochondria in HCC cells (Figure 5), the ROS induced by ART was mainly in the endoplasmic reticulum (ER) and mitochondria (Figure 6), and no obvious ROS was observed in lysosomes (Figure S4) which may be due to the low pH environment in lysosome inhibiting iron derived ROS production [45,46]. As mitochondria are reported to be the major sources of cellular ROS [47,48], the antioxidant N-acetyl cysteine (NAC) and mitochondria-targeted antioxidant MitoQ were used to study whether ROS, especially mitochondrial ROS, was responsible for ART-induced cell death in HCC cells. The results showed that NAC but not MitoQ relieved cell death induced by ART in HCC cells (Figures 4D, 4E and S2). Besides, although the mitochondrial membrane potential (MMP) reduced in Hep3B, SMMC7721 and Huh7 and increased in HepG2 (Figure S5A) cells, and the significant mitochondrial morphological change from the filament to punctation were found in Hep3B, SMMC7721 and Huh7 cells (Figure S5B) after ART treatment, there was no activated caspase-9 (markers of mitochondrial apoptosis) observed (Figure S5C). These results indicated mitochondria were not the main source of lethal ROS. Thus, the accumulation of labile iron (Fe2+) in the ER and generation of ER-derived ROS in HCC cells hinted that ER may be target organelle for lethal effects induced by ART. In addition, DFO reduced labile iron (Fe2+) and ER-derived ROS (Figure 6) in HCC cells. Hence, ART-induced cell death is ROS-dependent, and the lethal ROS from ER might be attributed to redistribution of labile iron (Fe2+) in the ER. The ROS in ER could also cause ER stress which was also reported to contribute to cell death [49]. Although continued increase of BIP and dose-dependent increase of other ER stress markers (IRE1α, PERK, ATF6) were observed in HCC cells (Figure S6A and S6B), the ER stress inhibitor 4-phenylbutyrate (4-PBA) did not reverse cytotoxicity of ART (Figure S6C). Nevertheless, the result that ART induced obvious lipid peroxidation (LPO) in ER (Figure 7) indicated labile iron (Fe2+) and ER-derived ROS were active at the ER site. And the destruction of the endoplasmic reticulum was observed after ART treatment (Figure 8A). To conclude, endoplasmic reticulum damage is a concomitant phenomenon in ART-induced cell death, and the ER-derived ROS induced by redistribution of labile iron (Fe2+) is predominant for the death process.
Figure 4.

The increased non-mitochondrial ROS by LIP is responsible for cell death induced by ART. HCC cells (n=3) were pre-treated with or without 200 μM DFO for 4 hours, after DFO removed HCC cells were cultured with 50 μM ART for 24 hours. Fluorescence of DCFH-DA (ROS indicator) (A), MitSox (mitochondrial ROS indicator) (B), and intracellular labile iron (Fe2+) indicator ferrorange (C) was detected by flow cytometry. Red dotted lines indicate control values. (D, E) HCC cells (n=3) were pre-incubated with 5 mM general ROS scavenger N-acetyl cysteine (NAC) or 5 μM mitochondrial ROS specific inhibitor MitoQ for 2 hours respectively and after ROS scavengers removed HCC cells were cultured with 50 μM ART for 48 hours and stained with Annexin V/PI to detect cell death by flow cytometry. Error bars denote mean ± SD. Red dotted lines indicate control values. Ns, no significance; *, P < 0.05; **, P < 0.01.
Figure 5.

The subcellular localization of labile iron (Fe2+) in HCC cells after ART. A. 50 μM ART treated with various HCC cells for 24 hours, the subcellular localization of labile iron (Fe2+) was shown with Ferrorange (red, Ex/Em: 561 nm/570-620 nm), lyso-tracker Green (green, Ex/Em: ~504/511 nm), ER-tracker blue (blue, Ex/Em: 374/430-640), Scale bar, 75 μm. B. The distribution of mitochondrial labile iron (Fe2+) in various HCC cells after ART for 24 h. The mitochondrial labile iron (Fe2+) was co-localization with mitochondrial marker Mito-Bright Deep Red (red, Ex/Em: 640 nm/656-700 nm) and Mito-ferro Green (green, Ex/Em: 488 nm/500-550 nm) by confocal microscopy (ZEISS). Scale bar, 20 μm.
Figure 6.

The subcellular localization of ROS in HCC cells after ART. Confocal microscopy images showing the subcellular localization of ART induced ROS in HCC cells treated with 50 μM ART for 24 hours. DCFH-DA (green, Ex/Em: 488 nm/500-550 nm) stains ROS, ER-tracker (red) stains ER and Mitotracker (blue) stains mitochondria. The white arrowheads indicate intracellular ROS aggregation sites. Scale bar, 10 μm.
Figure 7.
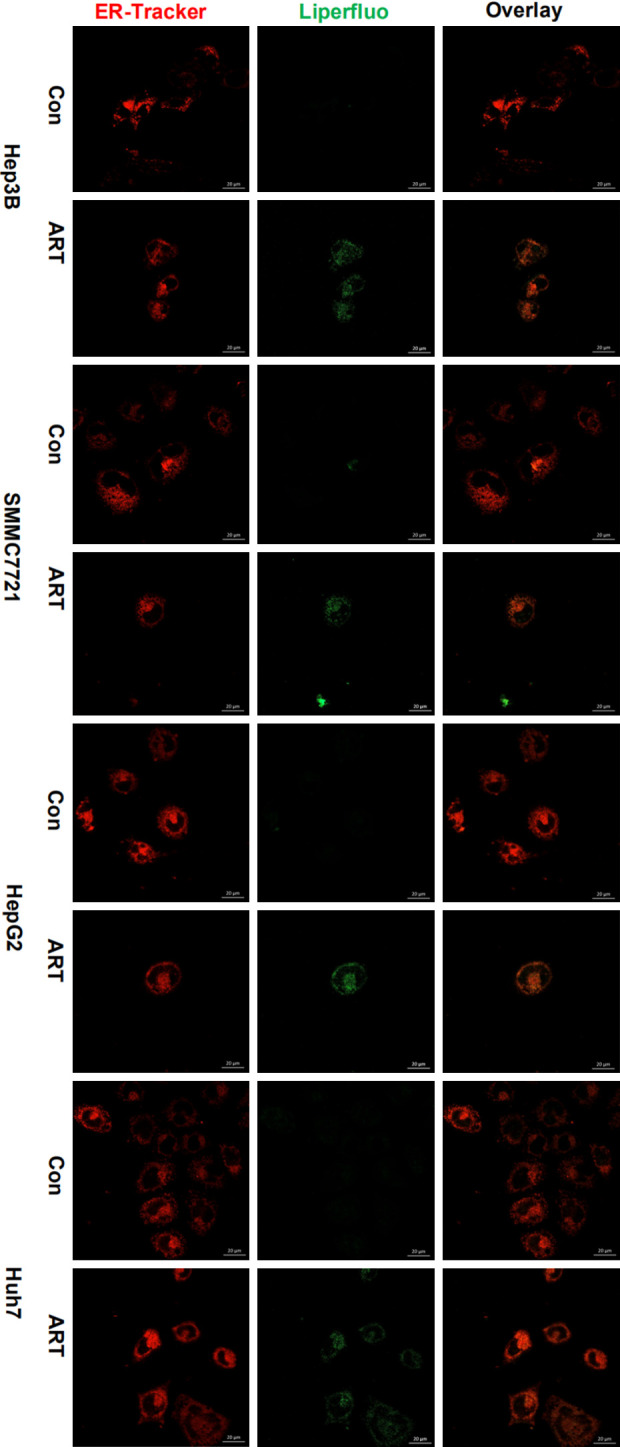
The co-localization of lipid peroxidation and ER in HCC cells after ART. ART treated different HCC cells for 24 hours, the localization of lipid peroxidation in ER was displayed with ER-tracker (red) and Liperfluo (green) by confocal microscopy (ZEISS). Scale bar, 20 μm.
Figure 8.

The lipid peroxidation in ER induced by LIP is contributing to cell death. A. ART treated different HCC cells for 24 hours, the alteration of ER structure was shown with ER-tracker blue (green). Scale bar, 20 μM. B, C. DFO (200 μM) were pre-incubated 4 hours and then removed, cultured with 50 μM ART for 24 hours, lipid peroxidation was shown with Liperfluo (green) by according to confocal microscopy and FCM in HCC cells (n=3). Scale bar, 10 μm. D. 1 μM Fer-1, 1 μM lipr-1, 10 μM pan-caspase inhibitor Z-VAD-FMK were pre-treated for 4 hours, cultured with 50 μM ART for 48 hours, CCK-8 checked reserve effect of different inhibitors on the cytotoxicity of ART on HCC cells (n=3). E. The effect of ART on ferroptosis in HCC cells after ART for 48 h. DFO (200 μM) were pre-incubated 4 hours and then removed, cultured with 50 μM ART for 24 hours. The classic ferroptosis marker proteins, SLC7A11 and GPX4, were tested with Western blot. Error bars denote mean ± SD. Ns, no significance; *, P < 0.05; **, P < 0.01.
Next, we continue to characterize the phenotype of ART induced cell death, we have demonstrated that ART increased LIP in HCC cells, and induced the accumulation of labile iron (Fe2+) in the ER. The accumulation of labile iron (Fe2+) in organelles was reported to contribute to ferroptosis by promoting LPO. Our results showed that ART increased LPO with the LPO indicator (Liperfluo), and DFO reduced fluorescence intensity of LPO indicator (Figure 8B and 8C), suggesting that ART-induced cell death might be ferroptosis. To test this hypothesis, ferroptosis inhibitors DFO, liproxstatin-1 (lipr-1), ferrostatin-1 (fer-1) were applied and the results showed that only DFO could reverse cytotoxicity of ART, while lipr-1 and fer-1 couldn’t block cell death except that fer-1 slightly retarding cell death in HepG2 (Figures 8D and S7A). GPX4-GSH-cysteine axis is the central node of the ferroptotic cell death cascade [50], but increased SLC7A11 and GPX4 expression were detected in HCC cells after ART treatment, suggesting that ART-induced cell death might not be ferroptosis because the anti-lipid-peroxidation system is activated (Figure 8E). ART also has been shown to induce intrinsic apoptosis in HCC cells based on previous reports. And our findings showed that ART induced activation of caspase-3 in Hep3B, SMMC7721, HepG2 and PARP1 in Hep3B, SMMC7721, Huh7 (Figure S7B). However, apoptosis inhibitor (pan-caspase inhibitor, Z-VAD-FMK) did not significantly rescue HCC cells from ART-induced cell death except that Z-VAD-FMK reverse small partial cell death in SMMC7721 (Figure S7A). These results suggest that ferroptosis, apoptosis and ER stress defined by current criteria may not contribute to ART-induced predominantal cell death and the predominant mode of cell death induced by ART needs further investigation. In conclusion, we demonstrate that ART induced HCC cell death is mainly mediated by lethal ROS accumulation in the endoplasmic reticulum via iron redistribution.
Discussion
The iron is a necessary element for cell survival, and the dynamic balance of intracellular LIP is an important way to maintain the physiological function and biochemical response of important organelles in cells [4]. The high metabolic activity of tumor cells requires higher utilization of iron compared to normal cells [51,52], and hyperactive iron metabolism in hepatocellular carcinoma cells are essential for proliferation, metastasis [53]. Besides, in the study of the mechanism of iron metabolism, there are multiple feedback loops between p53 and iron regulators, while difference type and of p53 expression are related to the progression of liver cancer [29-31], drug resistance [32], etc. The two paradoxically opposite iron manipulation-strategies for tumor therapy based either on iron chelation or iron overload to regulate cellular iron metabolism are all related to p53 [34,35]. However, this correlation remains to be further investigated, as iron metabolism intervention in P53-independent manner also was reported in anti-tumor research [54-56].
As highly effective antimalarial drugs approved by FDA, artemisinin and its derivatives have been explored for the treatment of various diseases, and recently demonstrated as remarkable anticancer agents [57,58]. While potent anti-cancer effects have been reported in various solid tumors [59] and hematological neoplasms [60], the underlying molecular basis is still far from clear. Many studies have found that the effects of ART are closely related to iron and it is generally believed that the peroxidative nature of the compounds and their reactivity with intracellular iron are key to their anti-cancer effects [61,62]. It is reported recently that artemisinin and derivatives have a potent ability to promote the degradation of ferritin and increase cytosol LIP [18]. However, this provides important clues for the new understanding of the anti-tumor effect of artemisinin and its derivatives. The mechanisms of disrupting intracellular iron metabolism and the lethality of iron-related tumors remain unclear.
In our study, we first considered the correlation between P53 and iron metabolism in cancer, different P53 of HCC cells were selected. The results showed that different expression of P53 had no direct influence on the killing effects of ART. However, the alteration of iron metabolism to up-regulation cellular LIP was discovered in all HCC cells. The cell death induced by ART was associated with increased LIP, which was derived from the mobilization of ferritin degradation. The ferritin mobilization was dependent on lysosomal acidification but autophagy in different HCC cells. The increased oxidative stress by ART led to cell death has been reported [20].In HCC cells, ART increased lethal ROS which could be suppressed by DFO and general antioxidant NAC, but not blocked by mitochondrial ROS scavenger MitoQ. These results prompted us to further localize ROS and intracellular labile iron (Fe2+). The labile iron (Fe2+) significantly increased in intracellular organelles, involving endoplasmic reticulum, lysosomes, and mitochondria. Interestingly, the labile iron (Fe2+) enrichment in endoplasmic reticulum was responsible for lethal ROS in different HCC cells. While the increased labile iron (Fe2+) and ROS in mitochondria, and imbalance of mitochondrial membrane potential were discovered, the invalid role of MitoQ and unactivated caspase-9 revealed that mitochondria were not directly involved in cell death induced by ART. This is probably due to the ability of ART to induce mitochondrial autophagy [63]. The increasing labile iron (Fe2+) in lysosome indicated that lysosome played a role in promoting degradation of ferritin under ART acidification, consistent with the results of Chen et al. [62]. ART acidifies lysosomes and mobilizes intracellular LIP to accumulate in the endoplasmic reticulum, which increases ROS to promote the death of HCC cells.
Moreover, we also found that ART significantly increased LPO in the endoplasmic reticulum, to explore further cell death mode. The ferroptosis was discussed, but failed to definite typical ferroptosis, as ferroptosis inhibitors Fer-1 and Lipr-1 did not significantly reverse ART cytotoxicity, which may be related to the GPX4-GSH-cysteine axis initiating antagonism to lipid peroxidation. Although we observed the activation of apoptotic pathway protein Caspase-3 and PARP1, apoptosis inhibitor Z-VAD-FMK did not fully reverse cell death induced by ART. As an important target in anti-tumor effect of ART, the destruction of the endoplasmic reticulum (ER) structure is sufficient to cause rapid cell death, and the progression of the apoptotic pathway may be later than it. However, the predominant mode of cell death needs further investigation.
In conclusion, our study indicates that ART enhances mobilization of hepatocellular carcinoma cells’ own iron reserves through lysosome acidification, and further promotes labile iron (Fe2+) redistribution in intracellular organelles and targeted destruction of endoplasmic reticulum integrity to induce cell death (Figure 9). These findings provide a new understanding of how ART eradicates hepatocellular carcinoma at the subcellular level, as well as outlining the potential effects of ART as a novel iron-modulating agent in cancer therapy.
Figure 9.

Modes of ART killing HCC cells. ART induces lysosomal degradation of iron-storage protein ferritin by acidizing lysosomes, thus regulating cellular iron homeostasis, increase endoplasmic reticulum stress in HCC cells by promoting accumulation of labile iron (Fe2+) in ER. Finally, increasing lethal ROS from ER sources disrupts the integrity of the ER structure.
Acknowledgements
This work was supported by University Innovation Team Building Program of Chongqing (CXTDG201602020) and intramural research project grant (2018-JCJQ-ZQ-001).
Disclosure of conflict of interest
None.
Abbreviations
- ART
Artesunate
- BafA1
Bafilomycin A1
- DFO
Deferoxamine mesylate salt
- DMT1
Divalent metal transporter 1
- ER
Endoplasmic reticulum
- fer-1
Ferrostatin-1
- Fe2+
Ferrous
- Fe3+
Ferric
- GPX4
Glutathione peroxidase 4
- IRP1/2
Iron-regulatory protein 1/2
- lipr-1
Liproxstatin-1
- LIP
Labile iron pool
- LOP
Lipid peroxidation
- 4-PBA
4-phenylbutyrate
- NAC
N-acetylcysteine
- MitoQ
Mitoquinone
- ROS
Reactive oxygen species
- TFRC1
Transferrin receptor 1
- TMRM
TetraMethylRhodamine Methyl Ester
- ZIP14
Zinc transporter 14
Supporting Information
References
- 1.Molina-Sanchez P, Lujambio A. Iron overload and liver cancer. J Exp Med. 2019;216:723–724. doi: 10.1084/jem.20190257. [DOI] [PMC free article] [PubMed] [Google Scholar]
- 2.Recalcati S, Correnti M, Gammella E, Raggi C, Invernizzi P, Cairo G. Iron metabolism in liver cancer stem cells. Front Oncol. 2019;9:149. doi: 10.3389/fonc.2019.00149. [DOI] [PMC free article] [PubMed] [Google Scholar]
- 3.McPhail MJW, Khorsandi SE, Abbott L, Al-Kadhimi G, Kane P, Karani J, O’Grady J, Heaton N, Bomford A, Suddle A. Modern outcomes following treatment of hepatocellular carcinoma in hereditary hemochromatosis: a matched cohort study. Am J Clin Oncol. 2019;42:918–923. doi: 10.1097/COC.0000000000000583. [DOI] [PubMed] [Google Scholar]
- 4.Lv H, Shang P. The significance, trafficking and determination of labile iron in cytosol, mitochondria and lysosomes. Metallomics. 2018;10:899–916. doi: 10.1039/c8mt00048d. [DOI] [PubMed] [Google Scholar]
- 5.Torti SV, Torti FM. Iron and cancer: more ore to be mined. Nat Rev Cancer. 2013;13:342–355. doi: 10.1038/nrc3495. [DOI] [PMC free article] [PubMed] [Google Scholar]
- 6.Torti SV, Torti FM. Ironing out cancer. Cancer Res. 2011;71:1511–1514. doi: 10.1158/0008-5472.CAN-10-3614. [DOI] [PMC free article] [PubMed] [Google Scholar]
- 7.Kalinowski DS, Richardson DR. The evolution of iron chelators for the treatment of iron overload disease and cancer. Pharmacol Rev. 2005;57:547–583. doi: 10.1124/pr.57.4.2. [DOI] [PubMed] [Google Scholar]
- 8.Yu Y, Wong J, Lovejoy DB, Kalinowski DS, Richardson DR. Chelators at the cancer coalface: desferrioxamine to Triapine and beyond. Clin Cancer Res. 2006;12:6876–6883. doi: 10.1158/1078-0432.CCR-06-1954. [DOI] [PubMed] [Google Scholar]
- 9.Aron AT, Loehr MO, Bogena J, Chang CJ. An endoperoxide reactivity-based FRET probe for ratiometric fluorescence imaging of labile iron pools in living cells. J Am Chem Soc. 2016;138:14338–14346. doi: 10.1021/jacs.6b08016. [DOI] [PMC free article] [PubMed] [Google Scholar]
- 10.Diaz-Garcia JD, Gallegos-Villalobos A, Gonzalez-Espinoza L, Sanchez-Nino MD, Villarrubia J, Ortiz A. Deferasirox nephrotoxicity-the knowns and unknowns. Nat Rev Nephrol. 2014;10:574–586. doi: 10.1038/nrneph.2014.121. [DOI] [PubMed] [Google Scholar]
- 11.Braga CCB, Benites BD, de Albuquerque DM, Alvarez MC, Seva-Pereira T, Duarte BKL, Costa FF, Gilli SCO, Saad STO. Deferasirox associated with liver failure and death in a sickle cell anemia patient homozygous for the -1774delG polymorphism in the Abcc2 gene. Clin Case Rep. 2017;5:1218–1221. doi: 10.1002/ccr3.1040. [DOI] [PMC free article] [PubMed] [Google Scholar]
- 12.Wang XJ, Yin QS, Wei XD. Deferoxamine-induced interstitial pulmonary injury: a case report and literature review. Zhonghua Xue Ye Xue Za Zhi. 2012;33:872–873. [PubMed] [Google Scholar]
- 13.Porter JB, Rafique R, Srichairatanakool S, Davis BA, Shah FT, Hair T, Evans P. Recent insights into interactions of deferoxamine with cellular and plasma iron pools: implications for clinical use. Ann N Y Acad Sci. 2005;1054:155–168. doi: 10.1196/annals.1345.018. [DOI] [PubMed] [Google Scholar]
- 14.Woerdenbag HJ, Moskal TA, Pras N, Malingre TM, el-Feraly FS, Kampinga HH, Konings AW. Cytotoxicity of artemisinin-related endoperoxides to Ehrlich ascites tumor cells. J Nat Prod. 1993;56:849–856. doi: 10.1021/np50096a007. [DOI] [PubMed] [Google Scholar]
- 15.Slezakova S, Ruda-Kucerova J. Anticancer activity of artemisinin and its derivatives. Anticancer Res. 2017;37:5995–6003. doi: 10.21873/anticanres.12046. [DOI] [PubMed] [Google Scholar]
- 16.Ho WE, Peh HY, Chan TK, Wong WS. Artemisinins: pharmacological actions beyond anti-malarial. Pharmacol Ther. 2014;142:126–139. doi: 10.1016/j.pharmthera.2013.12.001. [DOI] [PubMed] [Google Scholar]
- 17.Ishikawa C, Senba M, Mori N. Evaluation of artesunate for the treatment of adult T-cell leukemia/lymphoma. Eur J Pharmacol. 2020;872:172953. doi: 10.1016/j.ejphar.2020.172953. [DOI] [PubMed] [Google Scholar]
- 18.Li PC, Lam E, Roos WP, Zdzienicka MZ, Kaina B, Efferth T. Artesunate derived from traditional Chinese medicine induces DNA damage and repair. Cancer Res. 2008;68:4347–4351. doi: 10.1158/0008-5472.CAN-07-2970. [DOI] [PubMed] [Google Scholar]
- 19.Kong Z, Liu R, Cheng Y. Artesunate alleviates liver fibrosis by regulating ferroptosis signaling pathway. Biomed Pharmacother. 2019;109:2043–2053. doi: 10.1016/j.biopha.2018.11.030. [DOI] [PubMed] [Google Scholar]
- 20.Kumar VL, Verma S, Das P. Artesunate suppresses inflammation and oxidative stress in a rat model of colorectal cancer. Drug Dev Res. 2019;80:1089–1097. doi: 10.1002/ddr.21590. [DOI] [PubMed] [Google Scholar]
- 21.Efferth T. From ancient herb to modern drug: artemisia annua and artemisinin for cancer therapy. Semin Cancer Biol. 2017;46:65–83. doi: 10.1016/j.semcancer.2017.02.009. [DOI] [PubMed] [Google Scholar]
- 22.Ooko E, Saeed ME, Kadioglu O, Sarvi S, Colak M, Elmasaoudi K, Janah R, Greten HJ, Efferth T. Artemisinin derivatives induce iron-dependent cell death (ferroptosis) in tumor cells. Phytomedicine. 2015;22:1045–1054. doi: 10.1016/j.phymed.2015.08.002. [DOI] [PubMed] [Google Scholar]
- 23.Eling N, Reuter L, Hazin J, Hamacher-Brady A, Brady NR. Identification of artesunate as a specific activator of ferroptosis in pancreatic cancer cells. Oncoscience. 2015;2:517–532. doi: 10.18632/oncoscience.160. [DOI] [PMC free article] [PubMed] [Google Scholar]
- 24.Petherick KJ, Williams AC, Lane JD, Ordonez-Moran P, Huelsken J, Collard TJ, Smartt HJ, Batson J, Malik K, Paraskeva C, Greenhough A. Autolysosomal beta-catenin degradation regulates Wnt-autophagy-p62 crosstalk. EMBO J. 2013;32:1903–1916. doi: 10.1038/emboj.2013.123. [DOI] [PMC free article] [PubMed] [Google Scholar]
- 25.Efferth T, Romero MR, Wolf DG, Stamminger T, Marin JJ, Marschall M. The antiviral activities of artemisinin and artesunate. Clin Infect Dis. 2008;47:804–811. doi: 10.1086/591195. [DOI] [PubMed] [Google Scholar]
- 26.Wang Z, Chen Z, Jiang Z, Luo P, Liu L, Huang Y, Wang H, Wang Y, Long L, Tan X, Liu D, Jin T, Wang Y, Wang Y, Liao F, Zhang C, Chen L, Gan Y, Liu Y, Yang F, Huang C, Miao H, Chen J, Cheng T, Fu X, Shi C. Cordycepin prevents radiation ulcer by inhibiting cell senescence via NRF2 and AMPK in rodents. Nat Commun. 2019;10:2538. doi: 10.1038/s41467-019-10386-8. [DOI] [PMC free article] [PubMed] [Google Scholar]
- 27.Uchiyama A, Kim JS, Kon K, Jaeschke H, Ikejima K, Watanabe S, Lemasters JJ. Translocation of iron from lysosomes into mitochondria is a key event during oxidative stress-induced hepatocellular injury. Hepatology. 2008;48:1644–1654. doi: 10.1002/hep.22498. [DOI] [PMC free article] [PubMed] [Google Scholar]
- 28.Pang Y, Qin G, Wu L, Wang X, Chen T. Artesunate induces ROS-dependent apoptosis via a Bax-mediated intrinsic pathway in Huh-7 and Hep3B cells. Exp Cell Res. 2016;347:251–260. doi: 10.1016/j.yexcr.2016.06.012. [DOI] [PubMed] [Google Scholar]
- 29.Chen SL, Liu LL, Wang CH, Lu SX, Yang X, He YF, Zhang CZ, Yun JP. Loss of RDM1 enhances hepatocellular carcinoma progression via p53 and Ras/Raf/ERK pathways. Mol Oncol. 2020;14:373–386. doi: 10.1002/1878-0261.12593. [DOI] [PMC free article] [PubMed] [Google Scholar]
- 30.Fang SS, Guo JC, Zhang JH, Liu JN, Hong S, Yu B, Gao Y, Hu SP, Liu HZ, Sun L, Zhao Y. A P53-related microRNA model for predicting the prognosis of hepatocellular carcinoma patients. J Cell Physiol. 2020;235:3569–3578. doi: 10.1002/jcp.29245. [DOI] [PubMed] [Google Scholar]
- 31.Chen SL, Zhang CZ, Liu LL, Lu SX, Pan YH, Wang CH, He YF, Lin CS, Yang X, Xie D, Yun JP. A GYS2/p53 negative feedback loop restricts tumor growth in HBV-related hepatocellular carcinoma. Cancer Res. 2019;79:534–545. doi: 10.1158/0008-5472.CAN-18-2357. [DOI] [PubMed] [Google Scholar]
- 32.Chan KT, Lung ML. Mutant p53 expression enhances drug resistance in a hepatocellular carcinoma cell line. Cancer Chemother Pharmacol. 2004;53:519–526. doi: 10.1007/s00280-004-0767-4. [DOI] [PubMed] [Google Scholar]
- 33.Mou Y, Wang J, Wu J, He D, Zhang C, Duan C, Li B. Ferroptosis, a new form of cell death: opportunities and challenges in cancer. J Hematol Oncol. 2019;12:34. doi: 10.1186/s13045-019-0720-y. [DOI] [PMC free article] [PubMed] [Google Scholar]
- 34.Gammella E, Buratti P, Cairo G, Recalcati S. The transferrin receptor: the cellular iron gate. Metallomics. 2017;9:1367–1375. doi: 10.1039/c7mt00143f. [DOI] [PubMed] [Google Scholar]
- 35.Wang SJ, Li D, Ou Y, Jiang L, Chen Y, Zhao Y, Gu W. Acetylation is crucial for p53-mediated ferroptosis and tumor suppression. Cell Rep. 2016;17:366–373. doi: 10.1016/j.celrep.2016.09.022. [DOI] [PMC free article] [PubMed] [Google Scholar]
- 36.Ji P, Huang H, Yuan S, Wang L, Wang S, Chen Y, Feng N, Veroniaina H, Wu Z, Wu Z, Qi X. ROS-mediated apoptosis and anticancer effect achieved by artesunate and auxiliary Fe(II) released from ferriferous oxide-containing recombinant apoferritin. Adv Healthc Mater. 2019;8:e1900911. doi: 10.1002/adhm.201900911. [DOI] [PubMed] [Google Scholar]
- 37.Kruszewski M. Labile iron pool: the main determinant of cellular response to oxidative stress. Mutat Res. 2003;531:81–92. doi: 10.1016/j.mrfmmm.2003.08.004. [DOI] [PubMed] [Google Scholar]
- 38.Hider RC, Kong X. Iron speciation in the cytosol: an overview. Dalton Trans. 2013;42:3220–3229. doi: 10.1039/c2dt32149a. [DOI] [PubMed] [Google Scholar]
- 39.Asano T, Komatsu M, Yamaguchi-Iwai Y, Ishikawa F, Mizushima N, Iwai K. Distinct mechanisms of ferritin delivery to lysosomes in iron-depleted and iron-replete cells. Mol Cell Biol. 2011;31:2040–2052. doi: 10.1128/MCB.01437-10. [DOI] [PMC free article] [PubMed] [Google Scholar]
- 40.Kurz T, Eaton JW, Brunk UT. The role of lysosomes in iron metabolism and recycling. Int J Biochem Cell Biol. 2011;43:1686–1697. doi: 10.1016/j.biocel.2011.08.016. [DOI] [PubMed] [Google Scholar]
- 41.Radisky DC, Kaplan J. Iron in cytosolic ferritin can be recycled through lysosomal degradation in human fibroblasts. Biochem J. 1998;336:201–205. doi: 10.1042/bj3360201. [DOI] [PMC free article] [PubMed] [Google Scholar]
- 42.Yim WW, Mizushima N. Lysosome biology in autophagy. Cell Discov. 2020;6:6. doi: 10.1038/s41421-020-0141-7. [DOI] [PMC free article] [PubMed] [Google Scholar]
- 43.Tresguerres M. Novel and potential physiological roles of vacuolar-type H+-ATPase in marine organisms. J Exp Biol. 2016;219:2088–2097. doi: 10.1242/jeb.128389. [DOI] [PubMed] [Google Scholar]
- 44.Xie C, Zhang N, Zhou H, Li J, Li Q, Zarubin T, Lin SC, Han J. Distinct roles of basal steady-state and induced H-ferritin in tumor necrosis factor-induced death in L929 cells. Mol Cell Biol. 2005;25:6673–6681. doi: 10.1128/MCB.25.15.6673-6681.2005. [DOI] [PMC free article] [PubMed] [Google Scholar]
- 45.Su H, Li Y, Hu D, Xie L, Ke H, Zheng X, Chen W. Procyanidin B2 ameliorates free fatty acids-induced hepatic steatosis through regulating TFEB-mediated lysosomal pathway and redox state. Free Radic Biol Med. 2018;126:269–286. doi: 10.1016/j.freeradbiomed.2018.08.024. [DOI] [PubMed] [Google Scholar]
- 46.Song SB, Hwang ES. High levels of ROS impair lysosomal acidity and autophagy flux in glucose-deprived fibroblasts by activating ATM and erk pathways. Biomolecules. 2020;10:761. doi: 10.3390/biom10050761. [DOI] [PMC free article] [PubMed] [Google Scholar]
- 47.Diebold L, Chandel NS. Mitochondrial ROS regulation of proliferating cells. Free Radic Biol Med. 2016;100:86–93. doi: 10.1016/j.freeradbiomed.2016.04.198. [DOI] [PubMed] [Google Scholar]
- 48.Dan Dunn J, Alvarez LA, Zhang X, Soldati T. Reactive oxygen species and mitochondria: a nexus of cellular homeostasis. Redox Biol. 2015;6:472–485. doi: 10.1016/j.redox.2015.09.005. [DOI] [PMC free article] [PubMed] [Google Scholar]
- 49.Chen H, Tao J, Wang J, Yan L. Artesunate prevents knee intraarticular adhesion via PRKR-like ER kinase (PERK) signal pathway. J Orthop Surg Res. 2019;14:448. doi: 10.1186/s13018-019-1445-x. [DOI] [PMC free article] [PubMed] [Google Scholar]
- 50.Ursini F, Maiorino M. Lipid peroxidation and ferroptosis: the role of GSH and GPx4. Free Radic Biol Med. 2020;152:175–185. doi: 10.1016/j.freeradbiomed.2020.02.027. [DOI] [PubMed] [Google Scholar]
- 51.Wang Y, Yu L, Ding J, Chen Y. Iron metabolism in cancer. Int J Mol Sci. 2018;20:95. doi: 10.3390/ijms20010095. [DOI] [PMC free article] [PubMed] [Google Scholar]
- 52.Chen Y, Fan Z, Yang Y, Gu C. Iron metabolism and its contribution to cancer (Review) Int J Oncol. 2019;54:1143–1154. doi: 10.3892/ijo.2019.4720. [DOI] [PubMed] [Google Scholar]
- 53.Mehta KJ, Farnaud SJ, Sharp PA. Iron and liver fibrosis: mechanistic and clinical aspects. World J Gastroenterol. 2019;25:521–538. doi: 10.3748/wjg.v25.i5.521. [DOI] [PMC free article] [PubMed] [Google Scholar]
- 54.Abeysinghe RD, Greene BT, Haynes R, Willingham MC, Turner J, Planalp RP, Brechbiel MW, Torti FM, Torti SV. p53-independent apoptosis mediated by tachpyridine, an anti-cancer iron chelator. Carcinogenesis. 2001;22:1607–1614. doi: 10.1093/carcin/22.10.1607. [DOI] [PubMed] [Google Scholar]
- 55.Darnell G, Richardson DR. The potential of iron chelators of the pyridoxal isonicotinoyl hydrazone class as effective antiproliferative agents III: the effect of the ligands on molecular targets involved in proliferation. Blood. 1999;94:781–792. [PubMed] [Google Scholar]
- 56.Lee YS, Lee DH, Choudry HA, Bartlett DL, Lee YJ. Ferroptosis-induced endoplasmic reticulum stress: cross-talk between ferroptosis and apoptosis. Mol Cancer Res. 2018;16:1073–1076. doi: 10.1158/1541-7786.MCR-18-0055. [DOI] [PMC free article] [PubMed] [Google Scholar]
- 57.Efferth T. Molecular pharmacology and pharmacogenomics of artemisinin and its derivatives in cancer cells. Curr Drug Targets. 2006;7:407–421. doi: 10.2174/138945006776359412. [DOI] [PubMed] [Google Scholar]
- 58.Chaturvedi D, Goswami A, Saikia PP, Barua NC, Rao PG. Artemisinin and its derivatives: a novel class of anti-malarial and anti-cancer agents. Chem Soc Rev. 2010;39:435–454. doi: 10.1039/b816679j. [DOI] [PubMed] [Google Scholar]
- 59.Yao X, Zhao CR, Yin H, Wang K, Gao JJ. Synergistic antitumor activity of sorafenib and artesunate in hepatocellular carcinoma cells. Acta Pharmacol Sin. 2020;41:1609–1620. doi: 10.1038/s41401-020-0395-5. [DOI] [PMC free article] [PubMed] [Google Scholar]
- 60.Vatsveen TK, Myhre MR, Steen CB, Walchli S, Lingjaerde OC, Bai B, Dillard P, Theodossiou TA, Holien T, Sundan A, Inderberg EM, Smeland EB, Myklebust JH, Oksvold MP. Artesunate shows potent anti-tumor activity in B-cell lymphoma. J Hematol Oncol. 2018;11:23. doi: 10.1186/s13045-018-0561-0. [DOI] [PMC free article] [PubMed] [Google Scholar]
- 61.Yang ND, Tan SH, Ng S, Shi Y, Zhou J, Tan KS, Wong WS, Shen HM. Artesunate induces cell death in human cancer cells via enhancing lysosomal function and lysosomal degradation of ferritin. J Biol Chem. 2014;289:33425–33441. doi: 10.1074/jbc.M114.564567. [DOI] [PMC free article] [PubMed] [Google Scholar]
- 62.Chen GQ, Benthani FA, Wu J, Liang D, Bian ZX, Jiang X. Artemisinin compounds sensitize cancer cells to ferroptosis by regulating iron homeostasis. Cell Death Differ. 2020;27:242–254. doi: 10.1038/s41418-019-0352-3. [DOI] [PMC free article] [PubMed] [Google Scholar]
- 63.Zhang Q, Xiao H, Jin F, Li M, Luo J, Wang G. Cetuximab improves AZD6244 antitumor activity in colorectal cancer HT29 cells in vitro and in nude mice by attenuating HER3/Akt pathway activation. Oncol Lett. 2018;16:326–334. doi: 10.3892/ol.2018.8674. [DOI] [PMC free article] [PubMed] [Google Scholar]
Associated Data
This section collects any data citations, data availability statements, or supplementary materials included in this article.