

Abstract
Background:
Daratumumab-based combination therapies have shown high rates of complete response (CR) and minimal residual disease negativity in patients with multiple myeloma. However, daratumumab, an IgGκ monoclonal antibody, interferes with electrophoretic techniques making it difficult to reliably define residual disease versus CR, especially in patients with IgGκ multiple myeloma.
Methods:
Enrichment with polyclonal sheep antibody-coated magnetic microparticles combined with MALDI-TOF mass spectrometry (MALDI-TOF MS) analysis was used to detect M-proteins in serial samples from newly diagnosed multiple myeloma patients treated with daratumumab-based therapy. The performance of the MALDI-TOF MS assay was compared to that of a routine test panel (serum protein electrophoresis (SPEP), immunofixation (IFE) and serum free light chain (FLC)).
Results:
Comparison of MALDI-TOF MS to SPEP/IFE/FLC showed a concordance of 84.9% (p<0.001). When MALDI-TOF MS and FLC results were combined, the M-protein detection rate was the same or better than the routine test panel. For the 9 patients who obtained CR during follow-up, MALDI-TOF MS detected an M-protein in 46% of subsequent samples. Daratumumab could be distinguished from the M-protein in 215/222 samples.
Conclusion:
MALDI-TOF MS is useful in assessing CR in patients treated with monoclonal antibody-based therapies.
Keywords: multiple myeloma, MALDI-TOF mass spectrometry, M-protein, immunofixation, daratumumab
1. INTRODUCTION
In 2019, the first daratumumab-(CD38-targeted IgGκ monoclonal antibody)-based combination therapies were approved by the FDA for the treatment of newly diagnosed multiple myeloma (MM).[1,2] The second generation daratumumab-based combinations for newly diagnosed MM patients are already being evaluated in clinical trials.[3,4] Early results show unprecedented high complete response (CR) and minimal residual disease (MRD) negativity rates.[3,4] Because the majority of MM patients have an IgG monoclonal protein as the marker for treatment evaluation, the use of monoclonal IgGκ antibodies introduces analytical challenges for the clinical laboratory. They can cause interference on both serum protein electrophoresis (SPEP) and immunofixation (IFE), two assays that are routinely used to monitor the patient’s disease and response to chemotherapy. In addition, SPEP and IFE are integral to the International Myeloma Working Group treatment response criteria.[5] Currently, CR is defined by the elimination of the original, disease-related monoclonal protein in peripheral blood using classical serum electrophoretic techniques (i.e. SPEP and IFE). Therefore, more sensitive and specific methods are needed to monitor the monoclonal protein in peripheral blood in the era of modern therapy.
Mass spectrometry-based methods have been shown to be more sensitive and specific for detecting monoclonal proteins in serum compared to current electrophoretic techniques.[6-10] In particular, matrix-assisted laser desorption/ionization time of flight mass spectrometry (MALDI-TOF MS) has the capacity to replace these techniques for the routine monitoring of MM patients given its relatively high throughput.[6,11] Mass spectrometry techniques are based on the principle that each immunoglobulin has a unique amino acid sequence and, consequently, a unique mass. This patient-specific mass is stable over time and can be used as a disease biomarker.[7] The clinical utility of MALDI-TOF MS has been evaluated in previous studies.[12,13] However, to our knowledge, there has not yet been any prospective, systematic study investigating MALDI-TOF MS in peripheral blood obtained from newly diagnosed MM patients treated with a daratumumab-based combination therapy. Here, we assessed the performance of MALDI-TOF MS compared to SPEP/IFE/FLC in peripheral blood obtained from 23 newly diagnosed MM patients treated with 8 cycles of daratumumab-based quadruplet therapy (carfilzomib-lenalidomide-dexamethasone-daratumumab). The aim of this study was to determine the concordance between MALDI-TOF-MS and the routine SPEP/IFE/FLC strategy, assess the performance of MALDI-TOF MS in differentiating IgGκ monoclonal proteins from daratumumab and to characterize the advantages and limitations in the serial analysis of up to 10 samples per patient.
2. MATERIALS AND METHODS
2.1. Patients
This study was conducted with approval by the Memorial Sloan Kettering Cancer Center (MSKCC) Institutional Review Board in accordance with the Declaration of Helsinki. Our cohort included 23 newly diagnosed MM patients who were treated with 8 cycles of quadruplet daratumumab-based combination therapy (carfilzomib-lenalidomide-dexamethasone-daratumumab; clinicaltrials.gov: NCT03290950; cohort with patients treated with carfilzomib 20/36 mg/m2 twice weekly dosing schedule) and had a median age of 60 years (range 33-79 years). There were 12 males (52%) in the study (Table 1). According to the International Scoring System (ISS), patients were classified in 3 groups: ISS1 (n=17), ISS2 (n=5), ISS3 (n=1). Each patient had serum drawn at 10 time points: baseline, day 15 of cycle 1, the first day of each cycle from cycle 2 to cycle 8, and at the end of treatment (EOT).
Table 1.
Patient characteristics at baseline
| N=23 | ||
|---|---|---|
| Median age, years (range) | 60 (33-79) | |
| Sex, N (%) | ||
| Male | 12 (52) | |
| Female | 11 (48) | |
| Cytogenetic risks per IMWG, N (%) | ||
| High Risk | 4 (17) | |
| Standard Risk | 19 (83) | |
| ISS stage, N (%) | ||
| I | 17 (74) | |
| II | 5 (22) | |
| III | 1 (4) | |
| Isotype, N (%) | ||
| IgAκ | 3 (13) | |
| IgAλ | 2 (9) | |
| IgGκ | 12 (52) | |
| IgGλ | 2 (9) | |
| Free κ | 3 (13) | |
| Free λ | 1 (4) | |
| SPEP, N (%) | + | 21 (91) |
| − | 2 (9) | |
| Size M-spike, median g/dL (range) | 2.97 (0-8.37) | |
| IFE, N (%) | + | 23 (100) |
| − | 0 (0) | |
| Serum FLC, N (%) | Abnormal | 22 (96) |
| normal | 1 (4) | |
| MALDI-TOF-MS, N (%) | + | 23 (100) |
| − | 0 (0) |
IMWG: International Myeloma Working Group, ISS: International Staging System, FLC: free light chain, SPEP: serum protein electrophoresis, IFE: immunofixation electrophoresis, MALDI-TOF MS: Matrix- assisted laser desorption ionization time of flight mass spectrometry
2.2. Routine serum panel (SPEP, IFE, and FLC assays)
SPEP, IFE and FLC measurements were performed for clinical purposes at all time points except for day 15 of cycle 1. Assays were conducted by the Clinical Chemistry Laboratory at MSKCC and reported to the patient’s medical record. SPEP was performed using capillary electrophoresis (Capillarys 3, Sebia Inc., Norcross, GA), IFE was performed on the Hydrasys 2 instrument using the Hydragel 9 IF kit (Sebia Inc.) and the FLC assay was performed on the Optilite automated analyzer using the Freelite™ reagent (The Binding Site, Birmingham, UK). In addition to reporting the κ and λ FLC concentration, the κ/λ ratio was calculated (reference range 0.26-1.65). An abnormal FLC result was defined as an abnormal κ/λ ratio. All assays were performed according to the manufacturer’s instructions. SPEP and IFE results were interpreted by trained staff in Clinical Chemistry.
2.3. MALDI-TOF MS
All available serum samples collected over time for the 23 patients (N=222) were analyzed by MALDI-TOF MS. Prior to mass spectrometric analysis, immunoglobulins were purified using magnetic beads coated with polyclonal sheep antibodies specific for human IgG or IgA heavy chains, or kappa or lambda light chains (The Binding Site). Beads for IgM heavy chains were not used in this study since none of the patients had an IgM M-protein. Briefly, 50 μL of beads were placed in separate wells of a 96-well microplate. One hundred μL of 10% serum diluted with phosphate buffered saline, 0.1% Tween (PBST) was added and the plate was incubated for 15 minutes while shaking. Using a semi-automated plate washer (Biotek Instruments Inc., Winooski, VT) the beads were washed 3 times with 150 μL of PBST and twice with 150 μL of deionized water. Immunoglobulins were eluted from the beads using 30 μL of 5% acetic acid, 20 mM Tris [2-carboxyethyl] phosphine. The purified immunoglobulins were mixed 1:9 (sample:matrix) with 11 mg/mL alpha-cyano-4-hydroxycinnamic acid in 50/50 (v/v) acetonitrile/water with 0.1% trifluoroacetic acid. This mixture was spotted onto a polished stainless steel MALDI plate and allowed to dry. Samples were analyzed using a Microflex LT MALDI-TOF mass spectrometer (Bruker, Billerica, MA) in positive ion mode. Mass spectra were collected from 8000 to 30000 mass to charge ratio (m/z). Five hundred laser shots were taken in a random walk across a sample spot and summed to generate the MALDI-TOF mass spectrum. Pooled normal serum was used as a negative control. As positive control, daratumumab was spiked into pooled normal serum to a final concentration of 0.3 g/dL. Both controls were run on every MALDI-plate. Mass calibration was performed using a mixture (equal parts) of Protein Calibration Standard 1 and Protein Calibration Standard 2 supplied by Bruker. Calibration of the instrument is performed with every run.
Spectra were reviewed using FlexAnalysis software version 3.4 (Bruker). The reviewer was blinded to the patient’s clinical status and SPEP, IFE and FLC results. The +2 charge state of the light chains (m/z range of 10,000-12,500) was used for interpretation. Spectra were visually inspected for the presence of a monoclonal protein, which appears as a sharp spike above the polyclonal background. Baseline samples were used to identify the mass to charge ratio (m/z) of the monoclonal protein which served as a surrogate marker in the analysis of subsequent samples. Based on previous precision studies [14], we considered a peak within 6 units of the expected m/z value to be the same protein. MALDI-TOF MS results were compared to SPEP, IFE and the κ/λ FLC ratio at each time point during follow-up.
2.4. Data Analysis
Patient demographic information, and clinical and laboratory data were subjected to descriptive statistical analysis. χ2 test was used to determine statistical significance of assay concordance.
3. RESULTS
Table 1 shows the patients’ clinical and laboratory characteristics. At baseline, IFE was positive for all 23 patients while SPEP was negative for 2 patients with light chain MM. The following monoclonal protein isotypes were observed: 12 IgGκ, 3 IgGλ, 3 IgAκ, 2 IgAλ, 3 free κ, and 1 free λ. Overall, the κ/λ ratio was abnormal for 22/23 patients. MALDI-TOF MS detected a monoclonal protein at baseline for all 23 patients. Five IgGκ patients had an atypical spectral pattern where multiple spikes at high m/z values were observed (Figure 1). This spectral pattern has been linked to glycosylation of the light chain.[12]
Figure 1: Atypical mass spectrum for a patient with IgG kappa multiple myeloma.
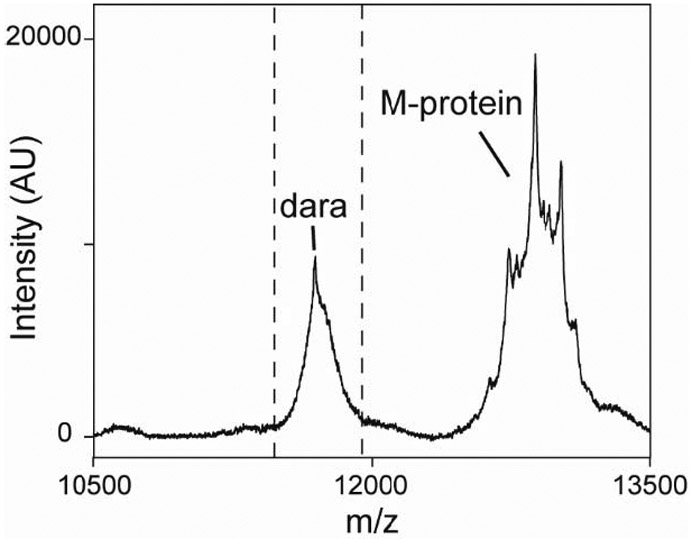
The MALDI-TOF MS spectrum from the kappa-specific purification is shown. The dotted lines indicate the expected m/z range for kappa light chains. Daratumumab (dara) is also visible in the spectrum.
At day 15 of cycle 1, daratumumab was visible in the spectra for 18/23 patients (Figure 2A). In 5/23 patients, a separate peak for daratumumab could not be detected because the IgGκ monoclonal protein was close to the mass of daratumumab and at a high concentration at this time point (Figure 2B). These 5 patients had a m/z value within 30 units of daratumumab. Within this range, the M-protein peak and the daratumumab peak overlap due to the low resolution of the MALDI-TOF mass spectrometer. As the monoclonal protein concentration decreased, separate peaks for daratumumab and the monoclonal protein could be detected. Thus, at cycle 2, only 2 of these 5 patients had an overlap between daratumumab and the monoclonal protein and at cycle 3 and later time points, daratumumab was visible in all samples (Figure 2C).
Figure 2: The ability of MALDI-TOF MS to identify multiple monoclonal proteins depends on mass and relative concentrations.

(A) MALDI-TOF mass spectrum of the cycle 1, day 15 (C1D15) timepoint compared to baseline for a patient with IgGκ multiple myeloma. (B) MALDI-TOF MS spectra of the cycle 1, day 15 timepoint and (C) the cycle 3 timepoint compared to baseline for another patient whose IgGκ M-protein is closer in mass to that of daratumumab. All spectra are from the kappa-specific purifications.
The ability of MALDI-TOF MS to detect monoclonal protein over time was compared to IFE and the routine serum panel for all time points (n=199) where results for the 4 techniques were available (Table 2). Using IFE as the reference, MALDI-TOF MS was concordant in 170 out of 199 samples (85.4%, p<0.001). MALDI was positive for 158 samples (79%) and IFE was positive for 143 samples (72%). There were 7 samples that were positive by IFE but negative by MALDI (Table 2, Figure 3). These samples were from 4 IgGκ patients (P2, P14, P15, P26, Figure 3) and MALDI-TOF MS was negative 1 to 3 time points earlier than IFE. There were 22 time points that were positive by MALDI-TOF MS but negative by IFE. The samples were from 6 patients (P3, P4, P5, P16, P17, P21), including 2 patients with light chain MM and 4 patients with an IgA M-protein.
Table 2.
Concordance of MALDI-TOF MS, IFE and routine serum panel (SPEP, IFE and FLC) (n=199)
| IFE + | IFE − | Routine serum panel + |
Routine serum panel − |
|
|---|---|---|---|---|
| MALDI-TOF MS + | 136 | 22 | 143 | 15 |
| MALDI-TOF MS − | 7 | 34 | 15 | 26 |
SPEP: serum protein electrophoresis, IFE: immunofixation electrophoresis, FLC: free light chain, MALDI-TOF MS: Matrix- assisted laser desorption ionization time of flight mass spectrometry
Figure 3: Patients with discordant results between MALDI-TOF MS and the routine serum panel.

Positive results are depicted in black and negative results are depicted in gray. SPEP: serum protein electrophoresis, IFE: immunofixation electrophoresis, FLC: free light chain, MALDI-TOF: Matrix- assisted laser desorption ionization time of flight mass spectrometry
We also compared the performance of MALDI-TOF MS to a test panel routinely used for patient monitoring (i.e. SPEP, IFE and sFLC; see Table 2). Using the routine serum panel as reference, MALDI-TOF MS was concordant for 169 out of 199 samples (84.9%, p<0.001). Both MALDI and the panel were positive for 158 samples (79%). Fifteen samples from 5 patients (P2, P14, P15, P20, P26) were still detectable by the panel but not by MALDI-TOF MS (Figure 3). One free κ light chain MM patient was detectable longer by the FLC assay compared to both MALDI-TOF MS and IFE. The fifteen samples that were positive by MALDI-TOF MS but negative by the routine panel were linked to 4 IgA patients (P4, P5, P17, P21) and 1 free λ patient (P3). When MALDI-TOF MS and FLC results were combined, the detection rate improved and was the same or better than the routine serum panel. Among patients who obtained CR based on IMWG response criteria (N=9), MALDI-TOF MS detected a monoclonal protein in 22/48 (46%) post-CR samples up to EOT (range: cycle 2 to EOT) in 6 patients. The detectable proteins were interpreted as disease-related (i.e. not daratumumab).
4. DISCUSSION
This prospective study was designed to investigate the clinical utility of MALDI-TOF MS in newly diagnosed MM patients who received 8 cycles of daratumumab-based quadruplet therapy (carfilzomib-lenalidomide-dexamethasone-daratumumab). Specifically, we assessed the performance of MALDI-TOF MS compared to SPEP/IFE/FLC in peripheral blood obtained from 23 newly diagnosed MM patients. Compared to a routine serum panel (i.e. SPEP, IFE, and sFLC), we show that MALDI-TOF MS was concordant for the detection of monoclonal proteins in serum in 84% of samples.
Determining the monoclonal protein m/z at baseline is important for the interpretation of MALDI-TOF MS results especially in the setting of monoclonal antibody therapy. In a previous study, MALDI-TOF MS could distinguish daratumumab from monoclonal proteins in 85% of IgGκ MM patients.[14] Two peaks were visible when the monoclonal protein m/z value was outside the expected m/z value for daratumumab (11690 +/− 6 m/z). In this study, we found that the relative concentration of monoclonal immunoglobulins, not just their m/z values, is important to distinguish two different peaks. Mass measurements allow a peak to be accurately assigned. However, major differences in concentration may result in one peak obscuring the other. For instance, daratumumab was not visible in 5 IgGκ patients at the 15th day of cycle 1 because the monoclonal protein m/z value was close to daratumumab and was at high concentration. The opposite may be true at the end of treatment for these patients where daratumumab may obscure the monoclonal protein peak. Daratumumab is typically observed at about 0.1 g/dL in patient samples [15]. Therefore, there is a risk for an M-protein to be “hidden” under the daratumumab peak when below this concentration range. Certainly, it is important to distinguish the monoclonal antibody therapies from endogenous monoclonal antibodies that may result from clonal proliferation occurring post-treatment.[16-18] Mass spectrometry provides a solution for this, which will be important as more antibody therapeutics are used for myeloma (ex. elotuzumab and isatuximab) and other conditions. A previous study using liquid chromatography quadrupole time-of-flight mass spectrometry (LC-QTOF MS) showed that monoclonal antibody therapies could be differentiated from monoclonal proteins in 100% of the samples tested due to the improved resolution of the instrument and separation of immunoglobulins by liquid chromatography prior to mass spectrometric analysis.[19] However, this technique may not be practical for routine use due to the high cost of the instrument, the technical expertise required to operate it, and the low throughput (i.e. the run time on the instrument is about 20 minutes per sample).[7] Although MALDI-TOF MS does not have the same sensitivity/specificity as LC-QTOF MS, given its many strength which are discussed in this paper, and the fact that each patient sample takes only a few minutes to analyze by MALDI-TOF MS, it may be best positioned to replace current electrophoretic techniques in the era of targeted therapy.
We observed some discordant results between MALDI-TOF MS and the routine serum panel (i.e. SPEP, IFE, and sFLC). First, 4 IgA patients and 1 free λ patient were positive by MALDI-TOF MS longer than the routine serum panel. The ability of MALDI-TOF MS to detect a monoclonal protein will be different for each patient and each isotype due to differences in the polyclonal background. However, our results indicate that MALDI-TOF MS has a higher sensitivity, especially for IgA monoclonal proteins which typically run in the beta region of SPEP. It can be difficult to detect small monoclonal proteins in this region due to the higher background on SPEP. Three of the five IgA M-proteins in this study ran in the beta region.
A total of 5 patients (1 with a free κ M-protein and 4 with an IgGκ M-protein) had time points where MALDI-TOF MS was negative, but the routine clinical serum panel (i.e. SPEP, IFE, and sFLC) was positive. This discrepancy could be explained by several reasons. First, daratumumab can interfere with both MALDI-TOF MS and SPEP/IFE and may explain the discrepant results especially for patients with an IgGκ M-protein. The daratumumab peak on MALDI-TOF MS may obscure low levels of monoclonal protein causing the MALDI result to be falsely negative for M-protein. In addition, some of the SPEP/IFE results may be falsely positive if daratumumab was misinterpreted as the M-protein. The Hydrashift assay (Sebia, Inc.), a modified immunofixation procedure that removes daratumumab interference on IFE, was not available at the time of clinical IFE analysis for some patients to confirm whether the monoclonal protein was indeed present.[18] Another reason for the discrepant MALDI and IFE results may be glycosylation. Glycosylation may reduce ionization efficiency [20] and explain why MALDI-TOF MS was negative earlier than IFE. A glycosylated profile was noted for one of the 4 IgGκ patients (P2). Previous studies have noted an association between glycosylated light chain and higher rate of amyloidosis.[21,22] However, none of the patients with a glycosylated profile were diagnosed with amyloidosis in this study.
One free light chain MM patient was negative by MALDI-TOF but positive by the FLC assay for most time points (P20). This study used reagents that are specific for total κ and total λ light chains to purify immunoglobulins from serum. These reagents have a lower sensitivity for free light chain MM compared to those that are specific for the free light chains only because there is a higher background for the total kappa and total lambda purifications.[23] Therefore, the MALDI-TOF MS assay used in our study requires parallel serum FLC assay testing. In the near future, reagents that are specific to free light chains only may become available allowing the MALDI-TOF MS assay to capture monoclonal light chains with higher sensitivity.
The MM field is increasingly focused on MRD testing as MRD negativity is a strong prognostic indicator of longer progression-free survival and overall survival. Currently, bone-marrow-based analysis, either by flow cytometry or next generation sequencing, is used to determine a patient’s MRD status. However, a blood-based assay would be ideal, allowing clinicians to serially monitor patients in a less-invasive manner. Following the monoclonal protein with a more sensitive technique, like MALDI-TOF MS, may offer a promising solution for a blood-based MRD test.
However, there are challenges associated with this approach. We show that MALDI-TOF MS can detect monoclonal proteins several months after SPEP/IFE is negative and in patients that are MRD negative by bone-marrow-based analysis. This is likely due to the fact that serum proteins – in particular IgG – have long clearance intervals and may remain in the blood even after the disease has been cleared. Therefore, using the monoclonal protein as a biomarker for MRD may be limited. Strategies to work around the long half-life – such as using serial measurements to monitor the rate of change of the monoclonal protein or using the test in a specific clinical setting (i.e. detecting earlier relapse) – have been proposed and are currently being evaluated.
In conclusion, MALDI-TOF MS increases the detection rate of monoclonal proteins including all isotypes of MM patients. Our results demonstrate the potential of MALDI-TOF MS to replace the current electrophoretic methods (i.e. SPEP and IFE) for the follow-up of MM patients receiving modern combination therapies, in particular monoclonal antibody-based combinations. The development of automated sample preparation and data analysis software will help this methodology become more accessible to clinical laboratories in the future.
Supplementary Material
Table 3.
M-protein detection rates
| B N=23 (%) | C2 N=23 | C3 N=20 | C4 N=21 | C5 N=22 | C6 N=23 | C7 N=22 | C8 N=23 | EOT N=22 | |
|---|---|---|---|---|---|---|---|---|---|
| SPEP, IFE and FLC | 23 (100) | 22 (95.6) | 18 (90) | 16 (76.2) | 16 (72.7) | 17 (73.9) | 16 (72.7) | 16 (69.5) | 14 (63.6) |
| MALDI-TOF MS | 23 (100) | 21 (91.3) | 19 (95) | 18 (85.7) | 17 (77.3) | 17 (73.9) | 15 (68.2) | 15 (65.2) | 13 (59.1) |
| MALDI-TOF MS and FLC | 23 (100) | 22 (95.6) | 20 (100) | 19 (90.5) | 18 (81.8) | 18 (78.3) | 16 (72.7) | 16 (69.5) | 14 (63.6) |
SPEP: serum protein electrophoresis, IFE: immunofixation electrophoresis, FLC: free light chain, MALDI-TOF MS: Matrix- assisted laser desorption ionization time of flight mass spectrometry
Highlights.
The highest M-protein detection rates occur with MALDI-TOF MS plus FLC measurement
MALDI-TOF MS can help accurately determine complete response status in patients
Daratumumab can be distinguished from the M-protein in most samples by MALDI-TOF MS
Relative concentration and mass difference matters for distinguishing proteins
Acknowledgments:
The authors would like to thank Sun Cho for her technical expertise. This work was supported by a grant from the Society of Memorial Sloan Kettering Cancer Center (to K.L.T.), by research support from The Binding Site, and in part by the Memorial Sloan Kettering Core Grant (P30 CA008748) funded by the National Cancer Institute.
Footnotes
Competing interest statement:
KLT has received research support from The Binding Site and Sebia, Inc.
OL reports grants from NIH, FDA, MMRF, IMF, LLS, Perelman Family Foundation, Rising Tide Foundation, Janssen, Takeda, Glenmark, Seattle Genetics, Karyopharm; personal fees from Adaptive Biotech, Binding Site, BMS, Cellectis, Juno, and Pfizer; and IDMC from Takeda, Merck, and Janssen.
Publisher's Disclaimer: This is a PDF file of an unedited manuscript that has been accepted for publication. As a service to our customers we are providing this early version of the manuscript. The manuscript will undergo copyediting, typesetting, and review of the resulting proof before it is published in its final form. Please note that during the production process errors may be discovered which could affect the content, and all legal disclaimers that apply to the journal pertain.
REFERENCES
- [1].Facon T, Kumar S, Plesner T, Orlowski RZ, Moreau P, Bahlis N, et al. Daratumumab plus Lenalidomide and Dexamethasone for Untreated Myeloma. N Engl J Med 2019;380:2104–15. 10.1056/NEJMoa1817249. [DOI] [PMC free article] [PubMed] [Google Scholar]
- [2].Moreau P, Attal M, Hulin C, Arnulf B, Belhadj K, Benboubker L, et al. Bortezomib, thalidomide, and dexamethasone with or without daratumumab before and after autologous stem-cell transplantation for newly diagnosed multiple myeloma (CASSIOPEIA): a randomised, open-label, phase 3 study. Lancet Lond Engl 2019;394:29–38. 10.1016/S0140-6736(19)31240-1. [DOI] [PubMed] [Google Scholar]
- [3].Landgren O, Hultcrantz M, Lesokhin AM, Mailankody S, Hassoun H, Smith EL, et al. Weekly Carfilzomib, Lenalidomide, Dexamethasone and Daratumumab (wKRd-D) Combination Therapy Provides Unprecedented MRD Negativity Rates in Newly Diagnosed Multiple Myeloma: A Clinical and Correlative Phase 2 Study. Blood 2019;134:862–862. 10.1182/blood-2019-126378. [DOI] [Google Scholar]
- [4].Voorhees PM, Kaufman JL, Laubach JP, Sborov DW, Reeves B, Rodriguez C, et al. Depth of Response to Daratumumab (DARA), Lenalidomide, Bortezomib, and Dexamethasone (RVd) Improves over Time in Patients (pts) with Transplant-Eligible Newly Diagnosed Multiple Myeloma (NDMM): Griffin Study Update. Blood 2019;134:691–691. 10.1182/blood-2019-123465. [DOI] [Google Scholar]
- [5].Kumar S, Paiva B, Anderson KC, Durie B, Landgren O, Moreau P, et al. International Myeloma Working Group consensus criteria for response and minimal residual disease assessment in multiple myeloma. Lancet Oncol 2016;17:e328–46. 10.1016/S1470-2045(16)30206-6. [DOI] [PubMed] [Google Scholar]
- [6].Thoren KL. Mass spectrometry methods for detecting monoclonal immunoglobulins in multiple myeloma minimal residual disease. Semin Hematol 2018;55:41–3. 10.1053/j.seminhematol.2018.02.008. [DOI] [PubMed] [Google Scholar]
- [7].Barnidge DR, Dasari S, Botz CM, Murray DH, Snyder MR, Katzmann JA, et al. Using Mass Spectrometry to Monitor Monoclonal Immunoglobulins in Patients with a Monoclonal Gammopathy. J Proteome Res 2014;13:1419–27. 10.1021/pr400985k. [DOI] [PubMed] [Google Scholar]
- [8].Mills JR, Kohlhagen MC, Dasari S, Vanderboom PM, Kyle RA, Katzmann JA, et al. Comprehensive Assessment of M-Proteins Using Nanobody Enrichment Coupled to MALDI-TOF Mass Spectrometry. Clin Chem 2016;62:1334. 10.1373/clinchem.2015.253740. [DOI] [PubMed] [Google Scholar]
- [9].Zajec M, Jacobs JFM, Groenen PJTA, de Kat Angelino CM, Stingl C, Luider TM, et al. Development of a Targeted Mass-Spectrometry Serum Assay To Quantify M-Protein in the Presence of Therapeutic Monoclonal Antibodies. J Proteome Res 2018;17:1326–33. 10.1021/acs.jproteome.7b00890. [DOI] [PubMed] [Google Scholar]
- [10].Bergen HR, Dasari S, Dispenzieri A, Mills JR, Ramirez-Alvarado M, Tschumper RC, et al. Clonotypic Light Chain Peptides Identified for Monitoring Minimal Residual Disease in Multiple Myeloma without Bone Marrow Aspiration. Clin Chem 2016;62:243. 10.1373/clinchem.2015.242651. [DOI] [PMC free article] [PubMed] [Google Scholar]
- [11].Mills JR, Barnidge DR, Murray DL. Detecting monoclonal immunoglobulins in human serum using mass spectrometry. Methods 2015;81:56–65. 10.1016/j.ymeth.2015.04.020. [DOI] [PubMed] [Google Scholar]
- [12].Milani P, Murray DL, Barnidge DR, Kohlhagen MC, Mills JR, Merlini G, et al. The utility of MASS-FIX to detect and monitor monoclonal proteins in the clinic. Am J Hematol 2017;92:772–9. 10.1002/ajh.24772. [DOI] [PubMed] [Google Scholar]
- [13].Eveillard M, Rustad E, Roshal M, Zhang Y, Ciardiello A, Korde N, et al. Comparison of MALDI-TOF mass spectrometry analysis of peripheral blood and bone marrow-based flow cytometry for tracking measurable residual disease in patients with multiple myeloma. Br J Haematol 2020. 10.1111/bjh.16443. [DOI] [PMC free article] [PubMed] [Google Scholar]
- [14].Moore LM, Cho S, Thoren KL. MALDI-TOF mass spectrometry distinguishes daratumumab from M-proteins. Clin Chim Acta 2019;492:91–4. 10.1016/j.cca.2019.02.017. [DOI] [PMC free article] [PubMed] [Google Scholar]
- [15].McCudden CR, Jacobs JFM, Keren D, Caillon H, Dejoie T, Andersen K. Recognition and management of common, rare, and novel serum protein electrophoresis and immunofixation interferences. Clin Biochem 2018;51:72–9. 10.1016/j.clinbiochem.2017.08.013. [DOI] [PubMed] [Google Scholar]
- [16].Mills JR, Murray DL. Identification of Friend or Foe: The Laboratory Challenge of Differentiating M-Proteins from Monoclonal Antibody Therapies. J Appl Lab Med 2017;1:421–31. 10.1373/jalm.2016.020784. [DOI] [PubMed] [Google Scholar]
- [17].Murata K, McCash SI, Carroll B, Lesokhin AM, Hassoun H, Lendvai N, et al. Treatment of multiple myeloma with monoclonal antibodies and the dilemma of false positive M-spikes in peripheral blood. Lab Diagn Manag Plasma Cell Dyscrasias 2018;51:66–71. 10.1016/j.clinbiochem.2016.09.015. [DOI] [PMC free article] [PubMed] [Google Scholar]
- [18].Thoren KL, Pianko MJ, Maakaroun Y, Landgren CO, Ramanathan LV. Distinguishing Drug from Disease by Use of the Hydrashift 2/4 Daratumumab Assay. J Appl Lab Med 2019;3:857–63. 10.1373/jalm.2018.026476. [DOI] [PMC free article] [PubMed] [Google Scholar]
- [19].Mills JR, Kohlhagen MC, Willrich MAV, Kourelis T, Dispenzieri A, Murray DL. A universal solution for eliminating false positives in myeloma due to therapeutic monoclonal antibody interference. Blood 2018;132:670–2. 10.1182/blood-2018-05-848986. [DOI] [PubMed] [Google Scholar]
- [20].Nishikaze T. Sensitive and Structure-Informative N-Glycosylation Analysis by MALDI-MS; Ionization, Fragmentation, and Derivatization. Mass Spectrom 2017;6. 10.5702/massspectrometry.A0060. [DOI] [PMC free article] [PubMed] [Google Scholar]
- [21].Kumar S, Murray D, Dasari S, Milani P, Barnidge D, Madden B, et al. Assay to rapidly screen for immunoglobulin light chain glycosylation: a potential path to earlier AL diagnosis for a subset of patients. Leukemia 2019;33:254–7. 10.1038/s41375-018-0194-x. [DOI] [PubMed] [Google Scholar]
- [22].Kourelis T, Murray DL, Dasari S, Kumar S, Barnidge D, Madden B, et al. MASS-FIX may allow identification of patients at risk for light chain amyloidosis before the onset of symptoms. Am J Hematol 2018;93:E368–70. 10.1002/ajh.25244. [DOI] [PubMed] [Google Scholar]
- [23].Sepiashvili L, Kohlhagen MC, Snyder MR, Willrich MAV, Mills JR, Dispenzieri A, et al. Direct Detection of Monoclonal Free Light Chains in Serum by Use of Immunoenrichment-Coupled MALDI-TOF Mass Spectrometry. Clin Chem 2019;65:1015–22. 10.1373/clinchem.2018.299461. [DOI] [PubMed] [Google Scholar]
Associated Data
This section collects any data citations, data availability statements, or supplementary materials included in this article.