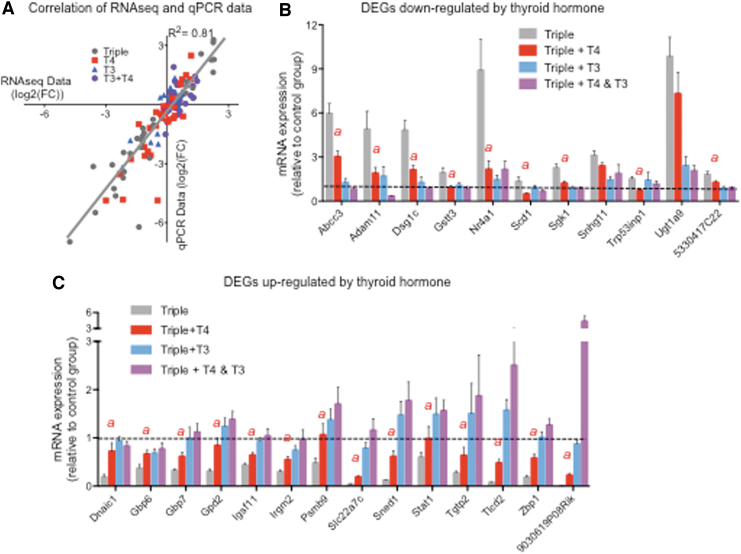
FIG. 3.
Validation by qPCR of genes regulated by T4 alone. (A) Correlation of RNA-seq and qPCR data for all genes validated. (B) Genes downregulated by T4. (C). Genes upregulated by T4. The statistical significances between the Triple+T4 group vs. the Triple group are the only ones indicated (with an “a” above) as determined by ANOVA and Fisher's LSD test. Dotted lines indicated control values. qPCR, quantitative polymerase chain reaction.

